

Abstract
Objective:
To identify novel transcriptomic changes to eutopic endometrium by exposure to chronic mild hypernadrogenemia (testosterone [T]) with/without exposure to an obesogenic Western-style diet (WSD).
Design:
Two-by-two factorial arrangement of treatments.
Setting:
National primate research center.
Animal(s):
Rhesus macaque females were chronically exposed to T and/or consumed a WSD from menarche through adulthood. After 4.5 years of treatment, Tru-Cut endometrial biopsies were obtained at the midsecretory phase (n = 6–4/group), and paired-end sequencing of RNA was performed. Several females in the T, WSD, and T+WSD cohorts developed endometriosis within 6 months of biopsy; a separate analysis was performed contrasting diagnosis of endometriosis stage 0–2 versus stages 3 and 4 (American Society for Reproductive Medicine revised criteria).
Intervention(s):
Chronic exposure to mild elevation of T (~five-fold elevation) and/or WSD from menarche until adulthood.
Main Outcome Measure(s):
Limma voom empirical Bayes pipeline was performed to detect differentially expressed RNAs (DEs) significantly impacted by treatments and endometriosis severity. Differentially expressed RNAs were then interrogated by Ingenuity Pathway Analyses and Protein Analysis through Evolutionary Relationships.
Result(s):
Total DEs included C versus T, 469; C versus WSD, 525; C versus T+WSD, 549; and T versus T+WSD, 1,505. The majority of DEs mapped to the ontology pathways: heterotrimeric G-protein signaling pathways Gi alpha and Gs alpha (C vs. T), WNT signaling (C vs. WSD and T vs. T+WSD), and Huntington disease (C vs. T+WSD). A total of 2,171 DEs from eutopic endometrium were altered by the presence of stage 3 and 4 endometriosis lesions.
Conclusion(s):
The present global transcriptomic analyses demonstrate that the greatest magnitude of changes occurred in contrasts of C and T versus T+WSD, adding to the evidence that these two insults have a synergistic effect on female physiology. These data also support the concept that prior alterations to the function of eutopic endometrium increase the risk for endometriosis.
Keywords: Endometrium, endometrial transcriptome, hyperandrogenemia, Western-style diet, endometriosis
INTRODUCTION
Polycystic ovary syndrome (PCOS), which is associated with metabolic dysfunction and hyperandrogenemia, is a common disorder linked to infertility in women (1). Patients are diagnosed by the Rotterdam criteria, where they must present with at least two of the following criteria: polycystic ovaries on ultrasound, biochemical and/or clinical androgen excess, and/or oligo- or anovulation (2). However, several aspects of PCOS remain poorly understood, including the interrelationship between hyperandrogenemia and obesity/insulin resistance to PCOS (1) and the impact of PCOS on the other tissues of the reproductive tract.
Recently, our research group developed a nonhuman primate model that mimics exposure to chronic, mild hyperandrogenemia in the presence and absence of an obesogenic, Western-style diet (WSD) (3, 4). Immediately before menarche, rhesus macaque females were treated with Silastic implants containing either cholesterol (C) or testosterone (T; four- to five-fold above controls) and fed either a healthy (chow) or Western-style diet (WSD) in a two-by-two factorial design of treatment groups. After 3–3.5 years of treatment (equivalent to 16–18 years for a human), 90% of females experienced presumably ovulatory menstrual cycles; however, T+WSD females displayed decreased estradiol (E2) and increased luteinizing hormone in the early follicular phase and reduced progesterone (P4) in the luteal phase (4). Uterine biopsies performed during the midsecretory/luteal phase in the same cycle revealed T and T+WSD females displayed altered expression of steroid hormone receptors (ESR1) and other markers of receptivity (MMP26, TIMP3) in the endometrium. Unlike in controls, oocytes recovered from single, naturally selected periovulatory follicles were often degenerated or immature in the T, WSD, and T+WSD groups (5).
A fertility trial was performed on these females to determine whether these defects resulted in impaired conception (6). Chronic exposure to T delayed time to pregnancy; however, chronic exposure to WSD significantly reduced overall pregnancy rate. Pregnancy loss associated with altered or impaired embryogenesis was observed only in T+WSD-treated females. During gestation, pregnant T+WSD females had increased fasting insulin levels and homeostatic model assessment of insulin resistance (HOMA-IR) in mid- and late second trimester, resulting in elevated glucose at late second trimester, indicating mild insulin insensitivity. Therefore, chronic, mild hyperandrogenemia in combination with an obesogenic diet impairs overall pregnancy rate and has a greater impact on maternal metabolic state compared with either treatment alone.
Subfertility in this cohort of rhesus females could be due to ovulation of poor-quality oocytes (5) or impaired endometrial receptivity detected at the midsecretory phase of the menstrual cycle (4). Prior studies have focused on a few markers of endometrial receptivity, but global gene expression analyses are needed to characterize the endometrial transcriptome to detect global gene pathway alterations by chronic T and/or WSD exposure, which could compromise fertility. The goal, therefore, of the current study was to analyze the transcriptome of the endometrium in these rhesus females during the midsecretory phase of the menstrual cycle. While these studies were underway, a subset of these females developed severe endometriosis (see Supplemental Fig. 2; Supplemental Table 1). Because evidence suggests changes to the eutopic endometrium coincide with development of endometriosis (7), a secondary aim was to analyze the eutopic endometrium of these macaque females to identify changes in gene expression that may be related to development of this disease.
MATERIALS AND METHODS
Animals Ethics and Care
All experiments involving rhesus monkeys were approved by the Oregon National Primate Research Center (ONPRC), Oregon Health and Sciences University (OHSU) Institutional Animal Care and Use Committee in accordance with the U.S. Public Health Service Policy on Humane Care and Use of Laboratory Animals (8). All rhesus females were under the care of the ONPRC Division of Comparative Medicine (DCM), and all surgical procedures were performed by the trained staff of the DCM Surgical Services Unit.
Endometrial Tissues
Female rhesus monkeys (n = 22), maintained as part of a larger cohort (n = 39) at the ONPRC, provided endometrial tissue for these studies. Details of the treatments of this cohort were published elsewhere (3). Briefly, macaque females began treatments immediately before menarche at ~2.5 years old. Females were treated with subcutaneous Silastic implants containing either cholesterol or T (~1.5 ng/mL) and fed a standard chow diet or a WSD resulting in treatment groups of control (chow+cholesterol; C), T (chow+T), WSD (cholesterol+WSD), and T+WSD (3, 4). Details of the compostion of chow and WSD were reported elsehwere (3): chow diet is 15% calories from fat, 58% from carbohydrates, and 27% from protein; WSD is 36% calories from fat (animal-based), 46% from carbohydrates, and 18% from protein. In addition, all females received fresh fruits and vegetables, and WSD-treated macaques received an additional calorie-dense treat daily (mix of peanut butter, honey, banana, cornstarch, and WSD pellets; ~250 kcal). The metabolic parameters of these females are determined during each treatment year, as reported elsewhere (3). At 4.5–5 years of treatment, (~6.5–7 years old) serum E2 and P4 were monitored daily during one randomly chosen menstural cycle from onset of menses throughout follicular and luteal phases, by the Roche immunoassay platform at the ONPRC Endocrine Technologies Support Laboratory as detailed elsewhere (4). All females in the selected cohort (C, T, and WSD n = 6/group, T+WSD n = 4) were experiencing presumably ovulatory cycles as determined by P4 levels ≥1 ng/mL for at least 3 days after the E2 surge. Ovarian/luteal and uterine vascular function was analyzed 6–8 days after E2 surge, by contrast-enhanced ultrasound, followed by Tru-Cut uterine biopsies to collect endometrial tissue, similar to previously published studies (4). Endometrial tissue was frozen in liquid nitrogen and stored at −80°C until subsequent analyses.
This cohort of rhesus females was also examined for the presence of endometriosis and scored with the American Society of Reproductive Medicine revised classification of endometriosis scale (9). Staging was done by a combination of ultrasound analyses, abdominal palpation, and laparoscopic visualization of the reproductive tract during sterile surgical procedures performed during routine exams within 6 months of the biopsy or at the time of disease presentation (>6 months), irrespective of treatment group (examples are shown in Supplemental Fig. 2). Females were identified as no disease risk (stage 0; n=5), stage 1 (mild adhesions only, n=6), stage 2 (extensive adhesions/no visible endometriotic cysts, n = 5), stage 3 (small cysts/some adhesions, n = 3), and stage 4 (extensive large cysts and adhesions, n = 3; Supplemental Table 1).
Statistics on Animal/Tissue Characteristics
All animal data from the biopsy cohort (discrete variables E2 surge area under the curve [AUC], P4 day of biopsy, ovarian/luteal/endometrial/myometrial/uterine vascular parameters, body mass index [BMI], percentage of body fat, percentage of lean mass, percentage of android fat, fasting insulin, fasting glucose, insulin, and glucose AUC, HOMA-IR) were analyzed by linear models function of SAS (ver. 9.4, SAS Institute). Significant (P < .05) differences between treatment groups were detected by the least-squares means function of SAS, with Tukey-Kramer adjustment for multiple comparisons. Endometriosis diagnosis of biopsy and main cohort were analyzed by nonparametric one-way analysis of variance and generalized linear models function of SAS.
Endometrial Transcriptome Analyses by RNA-seq
Sample RNA extraction and sequencing were performed by the OHSU Integrated Genomics Laboratory, Gene Profiling, and Massively Parallel Sequencing Shared Resources. Total RNA was extracted from each biopsy sample (one/female) with an automated QIAcube robot using RNAeasy Mini kit (Qiagen), and RNA quantity/quality was assessed by Nano Chip 2100 Bioanalyzer (Agilent). All samples were high quality with RNA integrity number values 7.9–9.7. Next, RNA libraries were prepared for each sample using TruSeq Stranded mRNA Library Prep kit with ribosomal RNA depletion (Illumina). Library quality was verified by TapeStation System (Agilent) and real-time polymerase chain reaction using the StepOnePlus Real Time PCR System (ABI). Paired-end sequencing (100 cycles) was performed with the HiSeq 2500 instrument (Illumina), with four samples per lane.
Differential expression analysis was performed by the ONPRC Bioinformatics and Biostatistics Core, similar to previously published studies (5). The quality of the raw sequencing files was evaluated using FastQC (10) combined with MultiQC (http://multiqc.info/) (11). Trimmomatic (12) was used to remove any remaining Illumina adapters. Reads were aligned to Ensembl’s mmul8 along with its corresponding annotation, release 87. The program STAR (13) (v2.7.3a) was used to align the reads to the genome. STAR has been shown to perform well compared with other RNA-seq aligners (14). Since STAR uses the gene annotation file, it also calculated the number of reads aligned to each gene. RNA-SeQC (15) and another round of MultiQC were used to ensure alignments were of sufficient quality.
Data processing and statistical analysis were performed in open-source software R (16). Gene-level raw counts were filtered to remove genes with extremely low counts across all samples, normalized using the trimmed mean of M values method (17) and transformed to log-counts per million with associated sample-wise quality weight and observational precision weights using the voom (18, 19) method. Gene-wise linear models accommodating the two-by-two factorial design between diet and steroid were employed for differential expression analyses using limma with empirical Bayes moderation (20). Because of the relatively small and unequal number of replicates (4–6/group), it was decided not to employ a false discovery rate adjustment to the voom and limma Bayes log2 values, which are referred to as “raw” significance values.
Initial sequencing identified 32,386 RNA transcripts mapping to genes across all libraries. Genes with extremely low counts (defined as no more than 0.5 counts per million reads in 4+ samples) were filtered out of samples. After filtering, 16,669 genes were retained for further analyses. Raw counts were normalized with the trimmed mean of M values method, similar to previously published studies (5). The samples showed a similar global distribution of gene expression values after normalization. Multidimensional scaling plots confirmed that technical factors (sequencing lane and RNA extraction batch) did not contribute to significant variation in gene expression; therefore these were not adjusted for in analyses of differentially expressed RNAs (DEs). The limma voom empirical Bayes pipeline was performed similarly to previously published studies (5) to detect significantly altered RNAs, defined as a change in expression, P > .05 (DEs), in contrasts C versus T, WSD, T+WSD, WSD versus T+WSD, and T versus T+WSD groups (Supplemental Table 5). To futher determine biological significance, lists of differentially expressed genes in each contrast were then interrogated by Ingenuity Pathway Analyses (IPA) and Protein Analysis through Evolutionary Relationships (PANTHER) (21). Overlapping DEs by contrast were detected by use of open-source software VENNY (2.1, https://bioinfogp.cnb.csic.es/tools/venny/index.html).
Using a similar approach, a separate exploratory data analysis was performed to detect the impact of presence/severity of endometriosis on gene expression by eutopic endometrium within our biopsy cohort. Normalized counts per million reads from each sample were analyzed by the same limma voom pipeline to detect significant DEs in contrasts stages 0–2 (n=16) versus 3 and 4 (n=6), stage 1 versus 0, stage 2 versus 0, stage 3 versus 0, and stage 4 versus 0 (Supplemental Table 6). Lists of differentially expressed genes in each contrast were again interrogated by IPA, PANTHER, and VENNY.
RESULTS
Female Macaque Cohort: Overall Effects of Diet, T, and Risk for Endometriosis
Consumption of the WSD in this cohort was associated with longer follicular phases (overall effect of WSD, P < .02), particularly in the T+WSD group, which tended to have ~4.5 ± 2.8 more days of unopposed E2 exposure compared with the C and T groups (P = .09, .052; Supplemental Fig. 1A). There was no significant impact of T and/or WSD on absolute E2 produced during the preovulatory E2 surge (P >.7; data not shown), and P4 levels on day of biopsy were not significantly different (P >.15; Supplemental Fig. 1B). There was also no significant difference in the number of days of exposure to P4 levels > 1 ng/mL (P >.7; Supplemental Fig. 1C). There were no differences in body weight, BMI, fasting insulin, insulin produced during intravenous glucose tolerance test (ivGTT), and HOMA-IR in this cohort (all P >.11; data not shown). However, there were significant overall effects of WSD on total percentage of body fat (P = .03), percentage of android fat (P = .01), total percentage of lean mass (P = .03), and glucose levels during ivGTT (glucose AUC, P = .0006; Supplemental Figs. 3A–3D). Pairwise comparisions between treatment groups showed significant differences in body composition between T and WSD cohorts (P < .05, different uppercase letters). On average, females exposed to T consuming the standard chow diet were leaner than WSD-consuming females. Exposure to T in the presence of the chow diet (T) resulted in lower glucose AUC in the biopsy cohort and total fat mass (overall effect of T, P = .003, P < .05; Supplemental Figs. 3D–3E).
On the day of biopsy, the corpora lutea (CL) of T-treated females tended to have reduced blood volume (BV; P = .0512) and vascular flow (VF; P = .09), while CL BV and VF were positively correlated with total percentage of lean mass (Pearson correlation coefficient [r] =0.5, P = .013 and r = 0.42, P = .04) and CL BV was negatively correlated with total percentage of body fat (r = −0.49, P = .014; Supplemental Fig. 4). Blood volume within the entire uterus was significantly reduced in the T-treated group, leading to a significant interaction between WSD and T (P = .02; Fig. 2A). The same pattern was observed for VF, but due to a greater difference in VF between the T and T+WSD groups, the effect of WSD reached significance (P = .018; Fig. 2B). Uterine VF negatively correlated with absolute lean mass (r = −0.53, P = .007; Fig. 2C). Vascular function was also analyzed in the basal layer of the endometrium encompassing the base of the spiral arteries (basalis zone): T exposure resulted in reduced BV in both the T and T+WSD groups compared with C (P = .012; Fig. 2D). Measurement of BV in the innermost layer of the endometrium (functionalis) demonstrated reduced vascularization in all treatment groups compared with controls, with an overall significant effect of T (P = .02; C vs. T, WSD and T+WSD P < .033, .049, and .023, respectively; Fig. 2E). Quantification of VF within the basalis and functionalis found similar trends (effect of T P = .06, .08; data not shown). An example of the biopsy obtained on the same day of these vascular analyses is presented in Figure 2F. Note how approximately half of the biopsy contains material from the functionalis zone.
FIGURE 2.
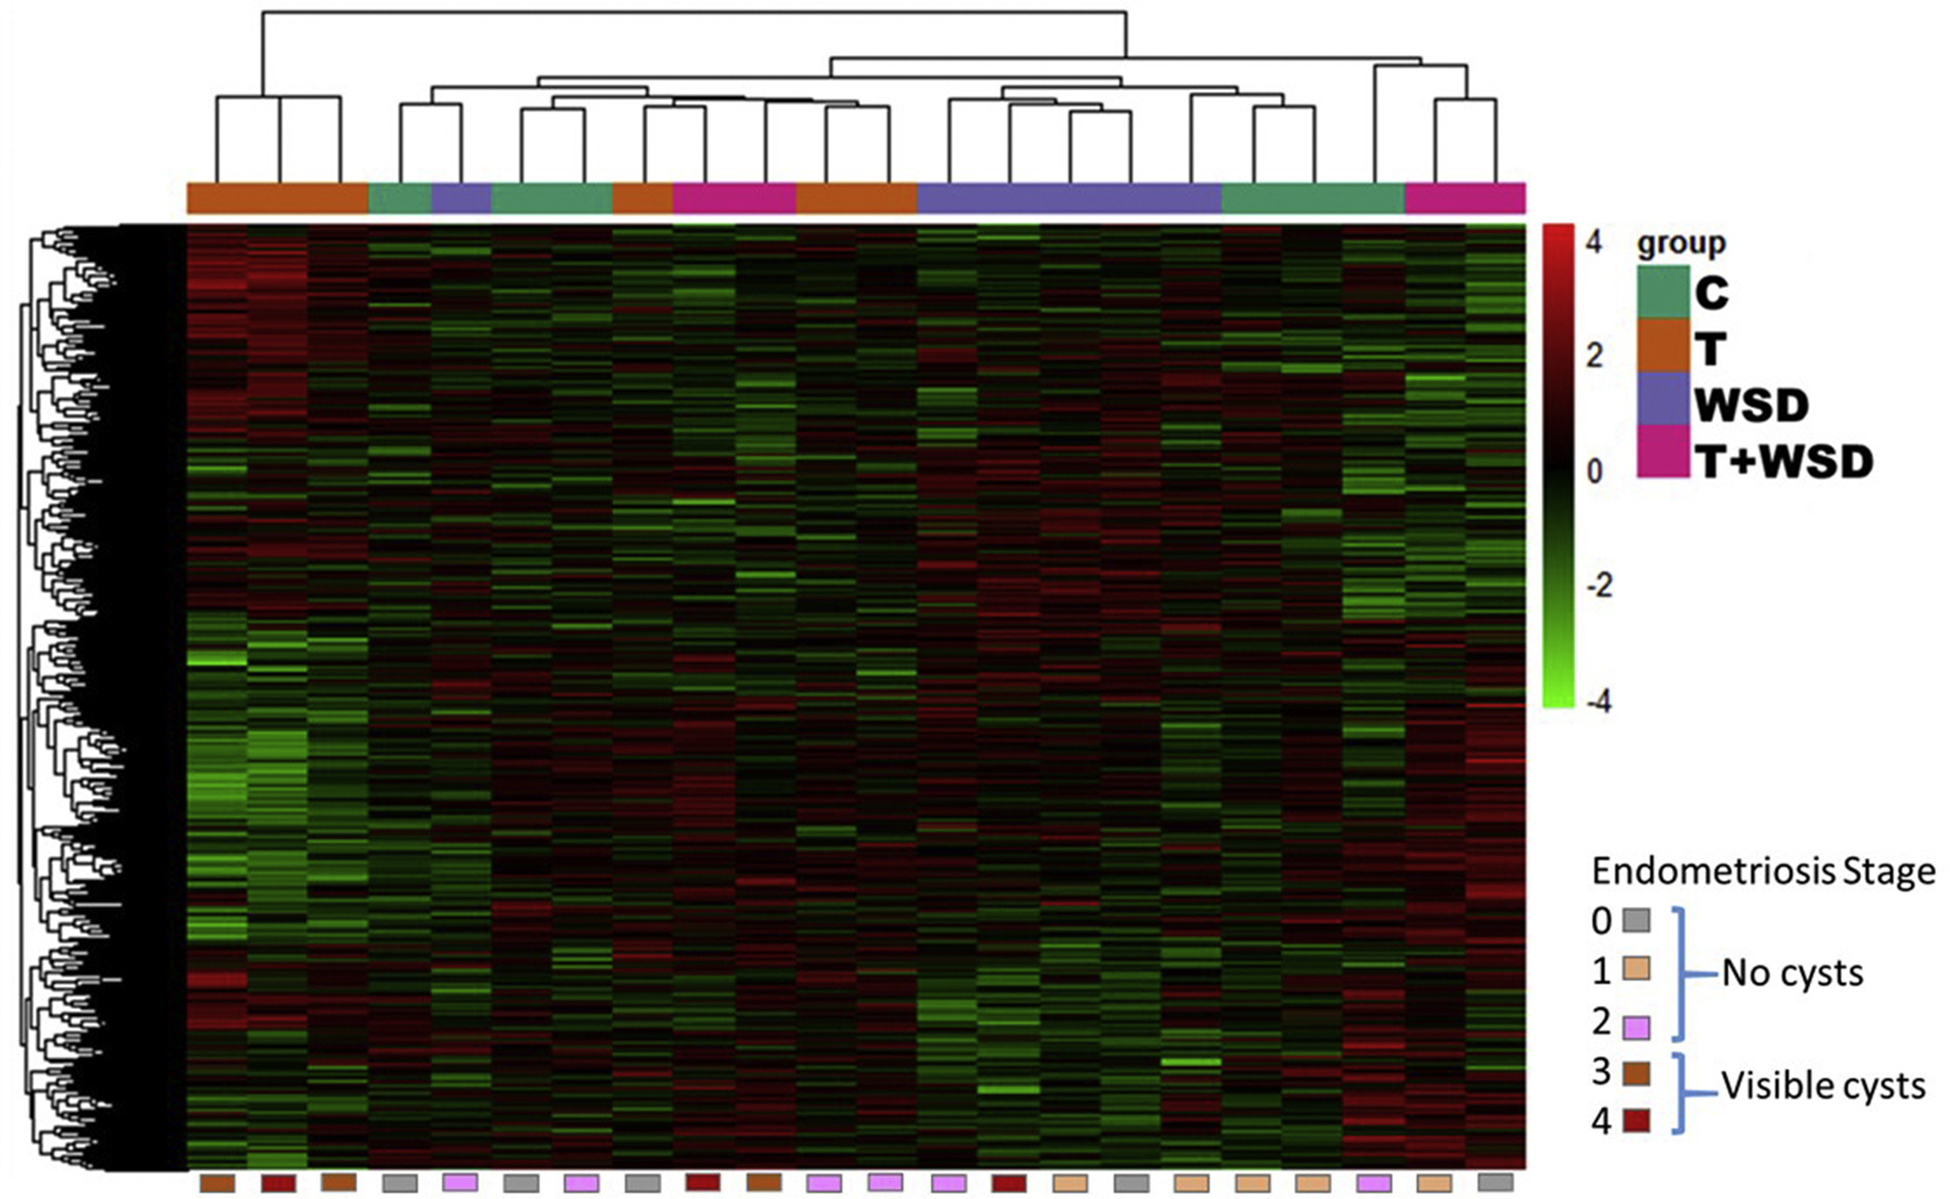
Hierarchical clustering of all differentially expressed (DE) gene products by biopsy/female. Individual RNAs depicted here in a heat map by row were identified as significantly differentially expressed in at least one contrast (See Materials and Methods for details of statistical analyses and contrasts). Red color indicates increased expression, while green color indicates reduced expression. Numbers are given in log2 scale. Each column represents data from a single rhesus female. Treatment groups are identified by colored boxes at the top of the heat map, while endometriosis stage is identified at the bottom of the map.
At the time of biopsy, three females within the T and WSD groups presented with endometriosis scores of stages 2–4, while other females were scored at stage 0 (no evidence of disease) and stage 1 (mild adhesions only). However, within 6 months of biopsy, only two C, one T, one WSD, and one T+WSD female remained at stage 0, while other stages increased in prevalence (Supplemental Table 1). Within this biopsy cohort, no one treatment group was significantly overrepresented at each stage of endometriosis (χ2 P >.5); however, none of the control females presented with scores associated with stages 3 and 4 (χ2 P = .08). Therefore, all further analyses into transcriptomic changes to eutopic endometrium by endometriosis severity within 6 months were performed by stage and not treatment group.
Endometrial Transcriptome: Effects of T and/or WSD
Samples were analyzed by multidimensional scaling plot using unsupervised clustering and illustrated by treatment group, percentage of lean mass, and vascular function (Supplemental Fig. 5), and significant DEs are presented in a heat map for comparison between samples (Fig. 1). For the purpose of comparing between comparisons, and identifying regulated pathways, DEs were defined as genes with significant alterations in expression (log2 values, P < .05). Table 1 lists the number of differentially expressed genes significantly impacted by T and/or WSD. The largest number of differentially expressed genes were associated with comparison of T+WSD versus T groups (n = 1,505), while the least number were associated with the T versus C group (n = 469). Analyses of interaction effects between WSD and T were also performed, that is, how the effect of each changes at different levels of the other factor: [(T+WSD − T) − (WSD − C)] or [(T+WSD − C) − (T − C)]: 1,109 total genes had significant interaction effects (Table 1). Venn diagram analyses of all contrasts show minimal overlap in each subset (3.2%–16.5%; Fig. 3). The most impacted gene product for each contrast is presented in Table 1.
FIGURE 1.
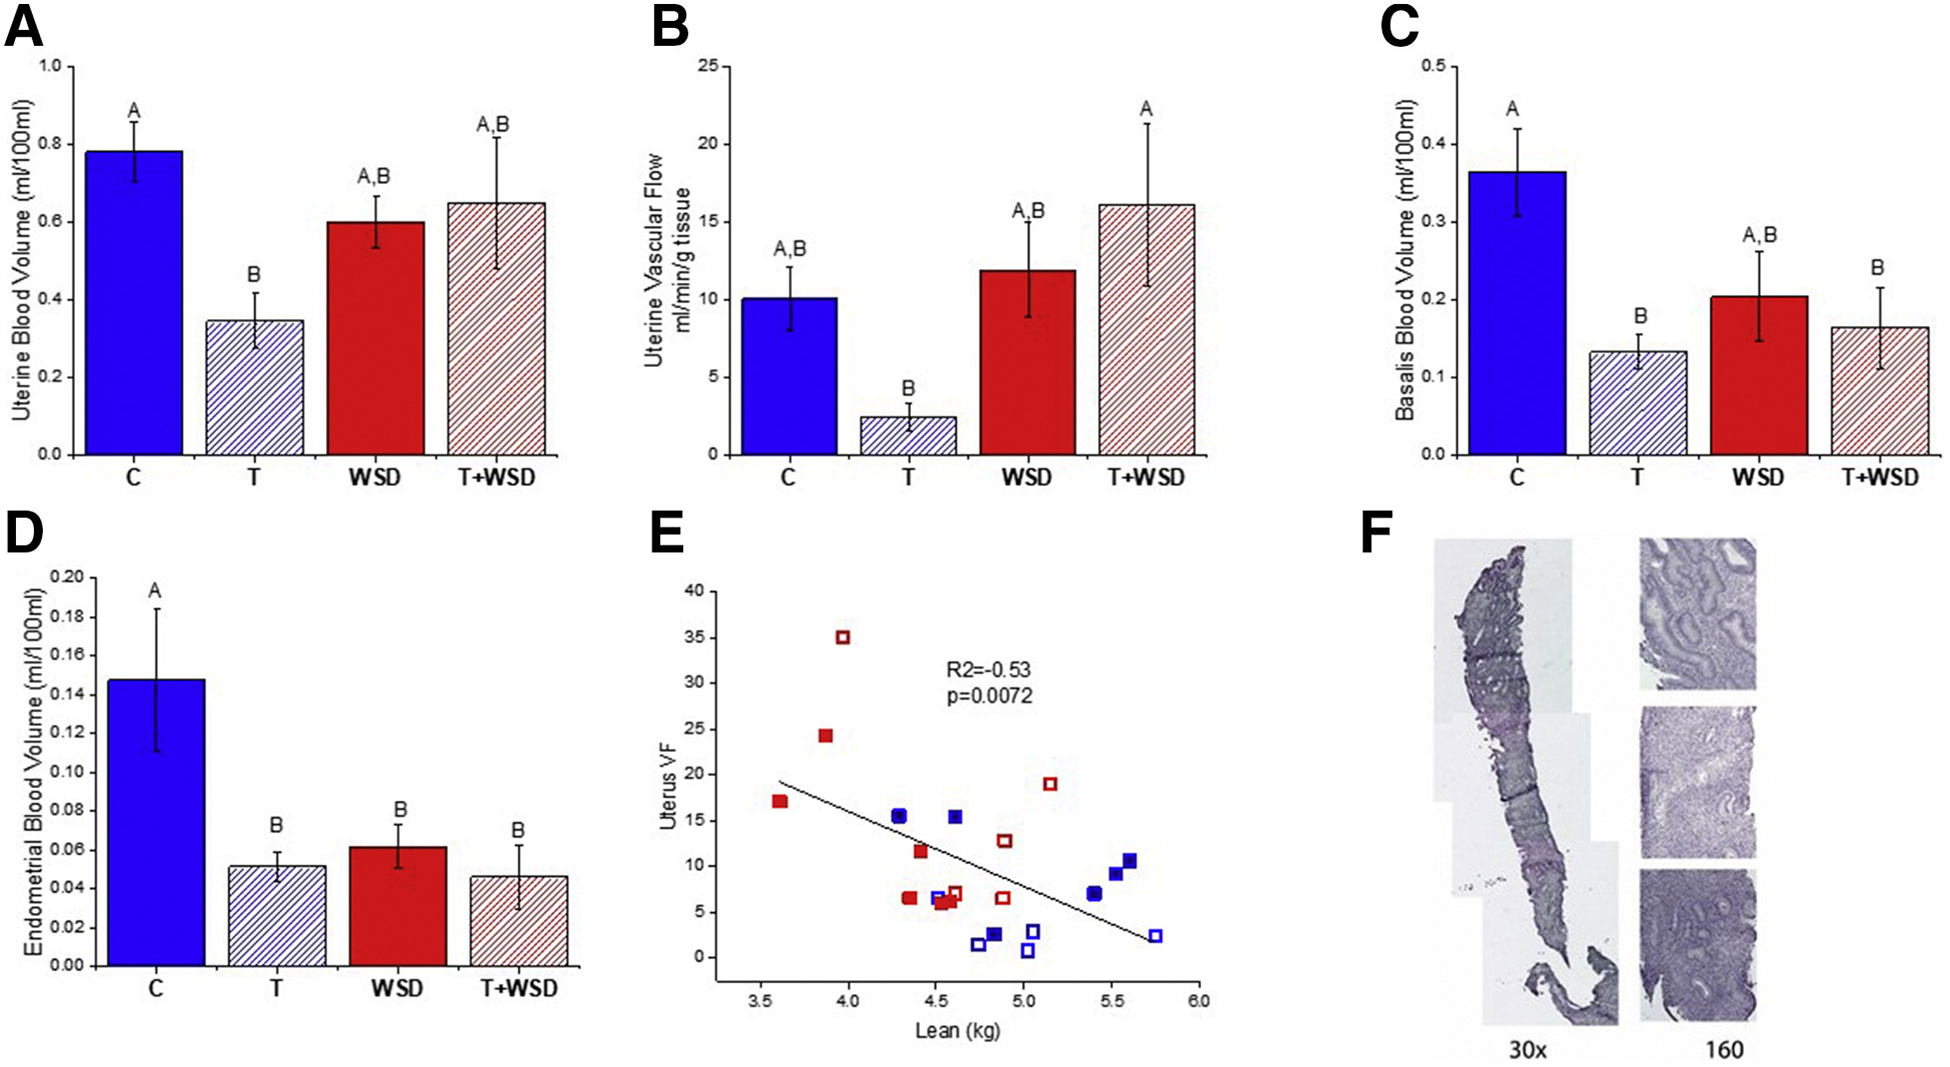
Contrast-enhanced ultrasound analyses of vascular function within the uteri of biopsy cohort. Blood volume (A) and vascular flow (B) within the entire uterus, as well as blood volume within the junctional/basalis zone (C) and within the upper/functionalis zone of the endometrium (D), were analyzed from the same video clip captured during microbubble (Definity) destroy/replenishment imaging. Different uppercase letters above the columns indicate significant differences (P < .05) between treatment groups (see text for details of statistical analyses). A negative correlation was found between measures of vascular flow within the uterus and the female’s lean mass (E). Each symbol indicates the measurements from a single female: closed boxes are cholesterol-implanted females, open boxes are testosterone-implanted females, blue color indicates chow-fed females, red color indicates Western-style diet-fed females. See text for further details of statistical analyses. An example of the complete histological image of the entire uterine Tru-Cut biopsy is presented in panel F. Note how the majority of the biopsy contains material from the endometrial glands.
TABLE 1.
| Differentially expressed gene products significantly impacted by testosterone (T) and/or Western-style diet (WSD). | |||
|---|---|---|---|
| T | WSD | T + WSD | |
| C | 251↓/218↑ | 233↓/292↑ | 266↓/283↑ |
| T | 584↓/921↑ | ||
| WSD | 380↓/421↑ | 514↓/449↑ | |
| Interaction: (WSD_T - Chow_T)-(WSD_C - Chow C) or (WSD_T-WSD_C)-(Chow_T-Chow_C) | 502↓ | ||
| 607↑ | |||
| Numbers of gene products (based on ensembl ID) significantly down-regulated (↓) or up-regulated (↑) when the group in the top row is contrasted with the group in the first column (See materials and methods for details). | |||
| Gene products with the greatest fold change (FC) in each contrast | ||||
|---|---|---|---|---|
| Contrast | Up-regulated | FC* | Down-regulated | FC* |
| T vs. C | MT-ATP8: mitochondrially encoded ATP synthase 8 | 3.093 | CRYAA/ CRYAA2: crystallin alpha A | −2.9 |
| WSD vs. C | NUDT2: nudix hydrolase 2 | 2.158 | C16orf89: thyroid transcript | −5.371 |
| T+WSD vs. C | CKM: M-type creatine kinase | 5.9 | CRYAA/ CRYAA2: crystallin alpha A | −15 |
| T+WSD vs. T | KRT2: Keratin 2 | 5.72 | PRAME: preferentially expressed antigen in melanoma | −5.485 |
| T+WSD vs. WSD | MYH7: myosin heavy chain 7 (cardiac) | 5.103 | CRYAA/ CRYAA2: crystallin alpha A | −3.972 |
| T vs. WSD | FFAR4: free fatty acid receptor 4 | 3.471 | CRYAA/ CRYAA2: crystallin alpha A | −3.012 |
FC is presented in log2 scale.
FIGURE 3.
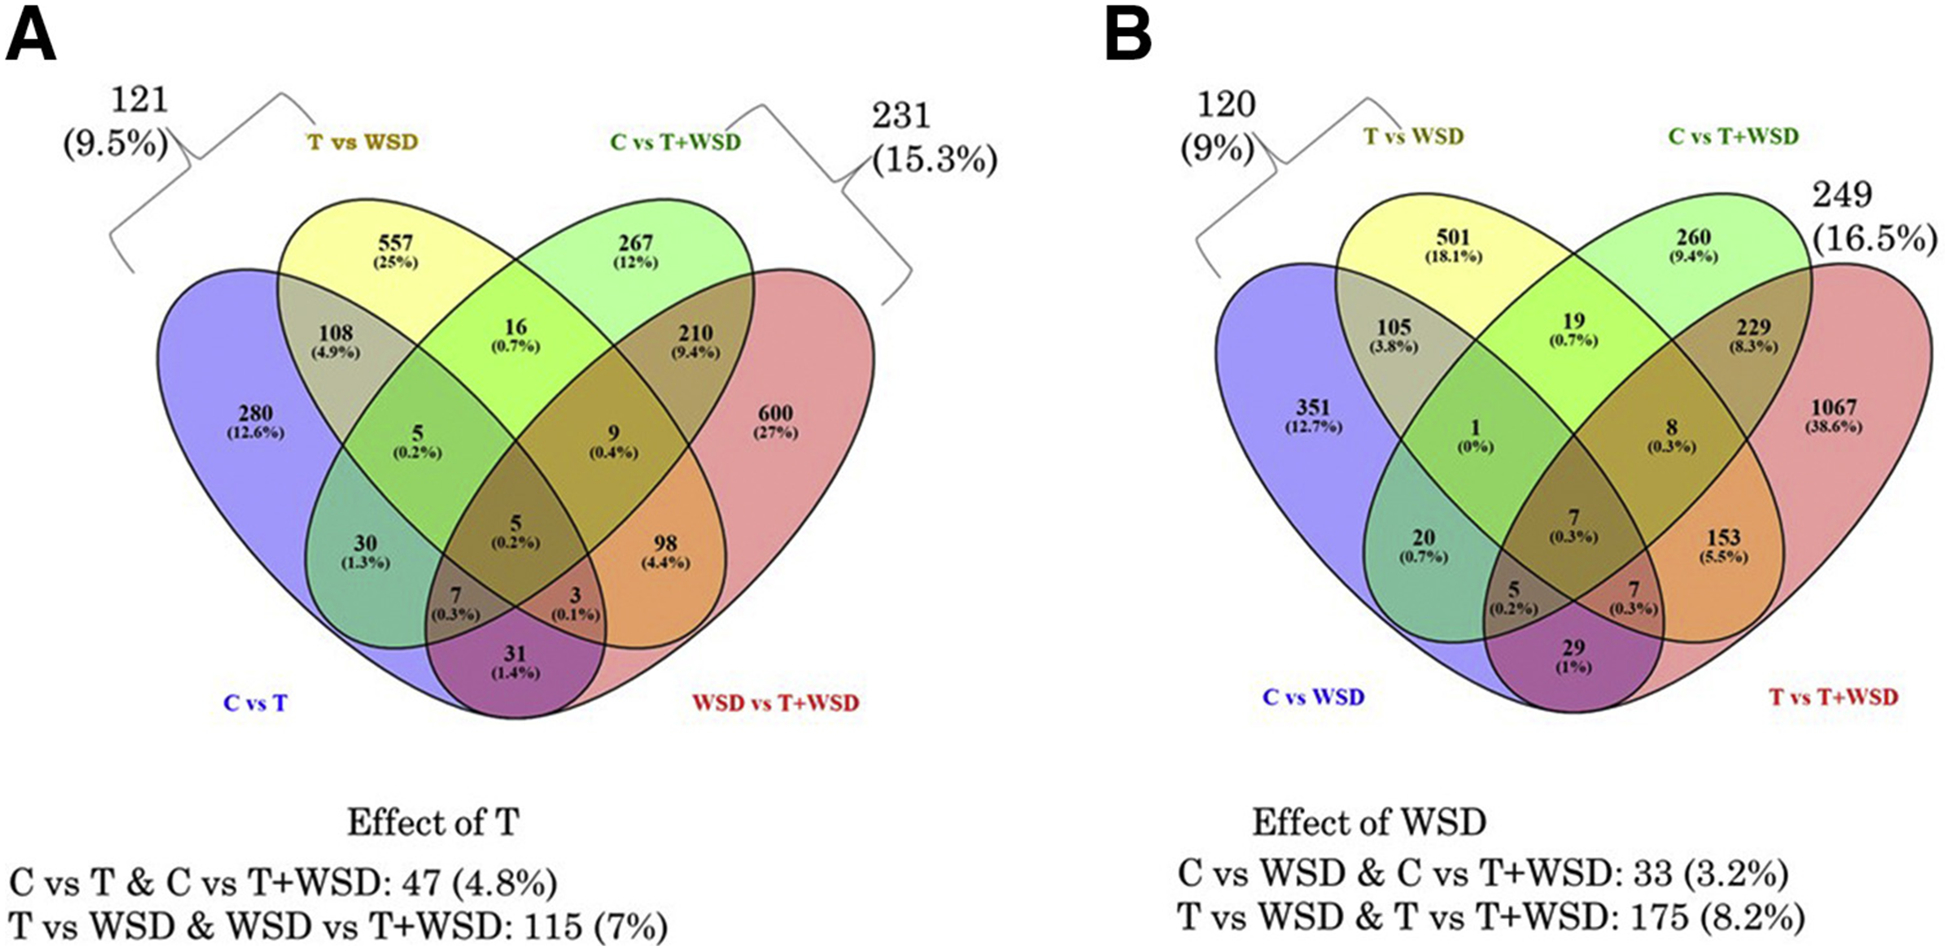
Venn diagram analyses of overlap in differentially expressed (DE) gene products by contrast. Diagrams are organized by effect of testosterone (A) and effect of Western-style diet (B). For each sections, total numbers of DE RNAs are depicted, along with the percentage of all DE RNAs within each contrast. See text for details.
Ingenuity Pathway Analyses software was used to identify gene categories/disease and gene functions as well as top upstream regulators and causal networks for DEs of all contrasts (Supplemental Tables 2 and 7). As suggested by Venn diagram analyses, divergent regulatory pathways, gene networks, and categories/disease functions were found by this analysis. Many diseases/gene functions in all contrasts were associated with cancers, due to the number of gene products associated with proliferation, inflammation, and cell cycle regulation (Supplemental Table 2). Top regulatory networks for DEs in each contrast are depicted in Supplemental Figure 6 (Supplemental Table 7). Ingenuity Pathway Analyses were also used to mine the top 20 DEs (highest fold change in expression, 10 upregulated and 10 downregulated) for each contrast to determine whether a set of transcription factors previously reported were altered in macaque endometrium by T (PGR, ESR1) (4) and/or WSD treatments (IRS1) (22) and the androgen receptor (Supplemental Fig. 7). These demonstrate interrelationships between the selected transcription factors; however, at most two to three differentially expressed genes displayed regulatory interactions with these previously reported genes. Even for T versus T+WSD, where IPA identified IRS1 as a top upstream regulator (Supplemental Table 8, T vs. T+WSD, P = 1.35E–04), this transcription factor accounted only for regulation of MYL1 within the gene list (Supplemental Fig. 7D), suggesting that many novel regulatory proteins/processes were identified in these contrasts.
Additional pathway analyses were conducted on DEs in all contrasts using the PANTHER classification system (21). The top molecular function, cellular processes, cellular component/cell/cell part, and protein class for all contrasts are listed in Supplemental Table 3 (Supplemental Table 8). Most DEs in contrasts identify with the molecular function “binding” (5/6 contrasts). Equally represented in contrasts are the cellular processes “cellular response to stimulus,” “cellular metabolic process,” and “cellular component organization” (each 2/6). Most DEs in all contrasts were identified in the “intracellular” cell part: the definition by PANTHER GO:0005622 is, “The living contents of a cell; the matter contained within (but not including) the plasma membrane, usually taken to exclude large vacuoles and masses of secretory or ingested material. In eukaryotes it includes the nucleus and cytoplasm.” Nucleic acid-binding proteins made up the top protein classification in most contrasts, comprising 22%–12% of all functional hits, except in the contrast C versus T+WSD, where the top protein classification was hydrolases (16.1%, nucleic acid binding was no. 2, 9.8%; Supplemental Table 8). Gene ontology pathways were mined from lists of significant DEs in main contrasts of C versus T, C versus WSD, C versus T+WSD, and T versus T+WSD by PANTHER (Supplemental Table 4). Commonalities between these contrasts were observed in the pathways “Huntington’s disease,” “WNT signaling pathway,” “gonadotropin-releasing hormone receptor pathway,” “angiogenesis,” and “cadherin signaling pathway,” which were present in at least two or more contrasts.
Eutopic Endometrial Transcriptome: Effect of Endometriosis Progression
Biopsies of eutopic endometrium from females at more advanced stages of endometriosis (stages 3 and 4, visible cysts) were first contrasted with those with no evidence of disease or less advanced stages (stages 0–2, no cysts; Fig. 1, Table 2; Supplemental Table 6). This contrast identified 2,171 DEs, 31% more than were identified by treatments of T and/or WSD. When samples were compared for progression by stage, eutopic endometrium present in females with stage 3 diagnoses was most distinct from females with no disease risk (stage 0, Table 2). Venn diagram analyses of DEs found low levels of overlap between stages (Fig. 4A). When stages 3 and 4 were compared to lists of DEs from treatment group contrasts, 164 were found in T versus C contrast DEs (35% of C vs. T), while only 24 were in WSD versus C (4.6%). Only 32 DEs were similar to T+WSD versus C (5.6%); however, C and T+WSD females had similar body fat and glucose AUC, so the contrast of T+WSD versus T (leaner, lower glucose AUC) was used to determine the impact of obesity. There were 386 of T+WSD versus T DEs (26%) altered in females with endometriosis lesions (Fig. 4B).
TABLE 2. Differentially expressed gene products in eutopic endometrium significantly impacted by endometriosis.
.
| Contrast | Down | Up |
|---|---|---|
| No cysts vs. visible cysts (0–2 vs. 3 and 4) | 1,031 | 1,140 |
| stage 1 vs. 0 | 283 | 244 |
| stage 2 vs. 0 | 688 | 393 |
| stage 3 vs. 0 | 1,206 | 1,386 |
| stage 4 vs. 0 | 344 | 429 |
FIGURE 4.
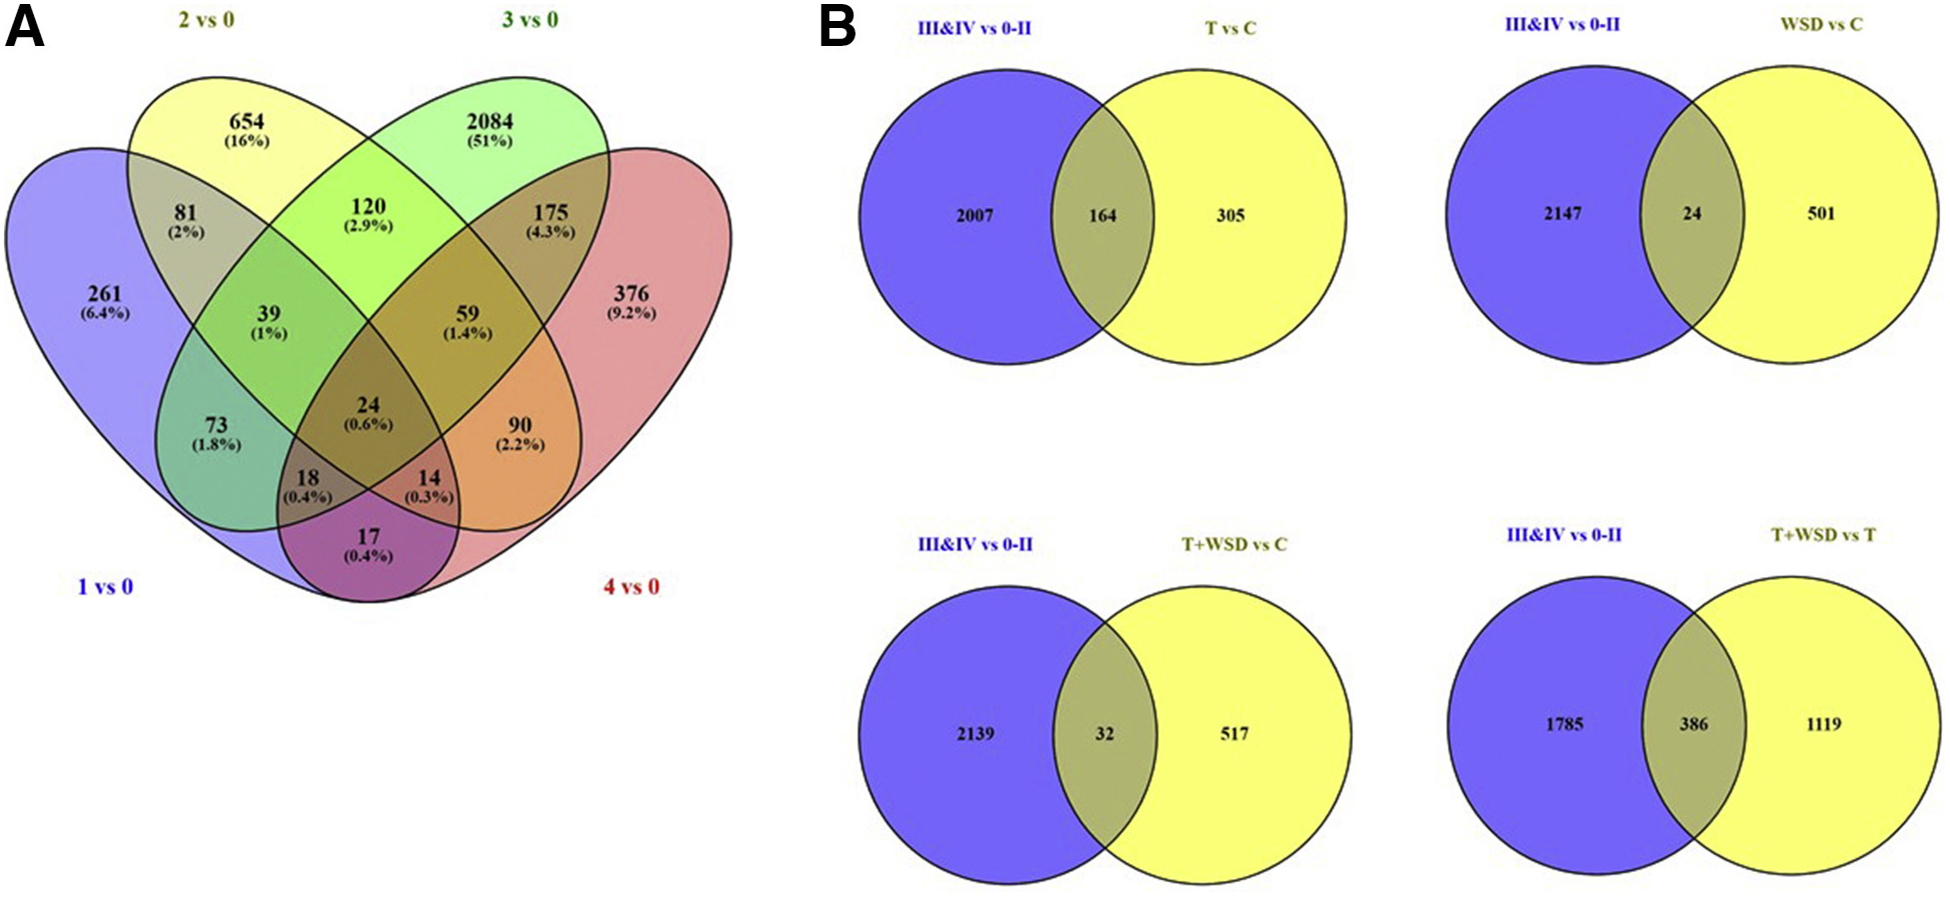
Venn siagram analyses of differentially expressed (DE) gene products in contrasts of eutopic endometrium by endometriosis stage (A). Additional analyses of DE RNAs in contrast of cysts versus no cysts (3 and 4 vs. 0–2) compared with main treatment contrasts of T vs. C, WSD vs. C, T+WSD vs. C, and T+WSD vs. T are provided here. See text for details on extent of overlap between these contrasts. C control; T = testosterone; WSD = Western-style diet.
Pathway analyses were performed by IPA, with DEs within contrast of stages 3 and 4 versus 0–2 (Table 3). An example of significant regulatory pathway ESR1 (P = 1.06E–06) is depicted in Figure 5A (ESR1 at central node), and significant causal network TCF4-CTNNB1 (P = 1.49E–11) is depicted in Figure 5B (CTNNB at central node). The top gene networks were identified (z score = 42; Table 4); disease and gene functions mapping to the most significant network are cancer, protein synthesis, and RNA damage and repair. Only significantly impacted DEs within this network are depicted (Fig. 5C). A gene ontology term analysis was performed using PANTHER (Supplemental Table 8); similar to T and/or WSD treatments, the most impacted cellular process was “cellular component organization,” most DEs mapped to the cell part “intracellular,” and a large number were identified as nucleic acid binding proteins (16.8%). Pathway analyses of DEs by PANTHER also identified the “WNT signaling pathway” and “gonadotropin-releasing hormone receptor pathway,” similar to T and/or WSD treatments (Table 5).
TABLE 3. Ingenuity Pathway Analyses top 5 gene categories, diseases and functions, upstream regulators, and causal networks of contrast no cysts vs. visible cysts.
| Category/diseases or functions | P value | No. of molecules | Upstream regulator | P value | Causal network | P value |
|---|---|---|---|---|---|---|
| Cancer, organismal injury, and abnormalities/cancer | 4.34E-55 | 1,548 | MYCN | 1.38E-06 | CD276 | 3.08E-12 |
| Cancer, organismal injury, and abnormalities/solid tumor | 1.27E-54 | 1,548 | FSH | 1.45E-06 | PTPRG | 9.72E-12 |
| Cancer, organismal injury, and abnormalities/ malignant solid tumor | 3.35E-56 | 1,544 | ESR1 | 1.06E-06 | TCF4-CTNNB1 | 1.49E-11 |
| Cancer, organismal injury, and abnormalities/ extracranial solid tumor | 1.13E-54 | 1,541 | TP53 | 3.85E-06 | Bcl9-Cbp/p300-Ctnnb1-Lef/Tcf | 3.57E-11 |
| Cancer, organismal injury, and abnormalities/ nonhematological solid tumor | 5.28E-61 | 1,536 | TCF7L2 | 4.26 E-06 | CTNN-LEF1 | 3.62E-11 |
FIGURE 5.
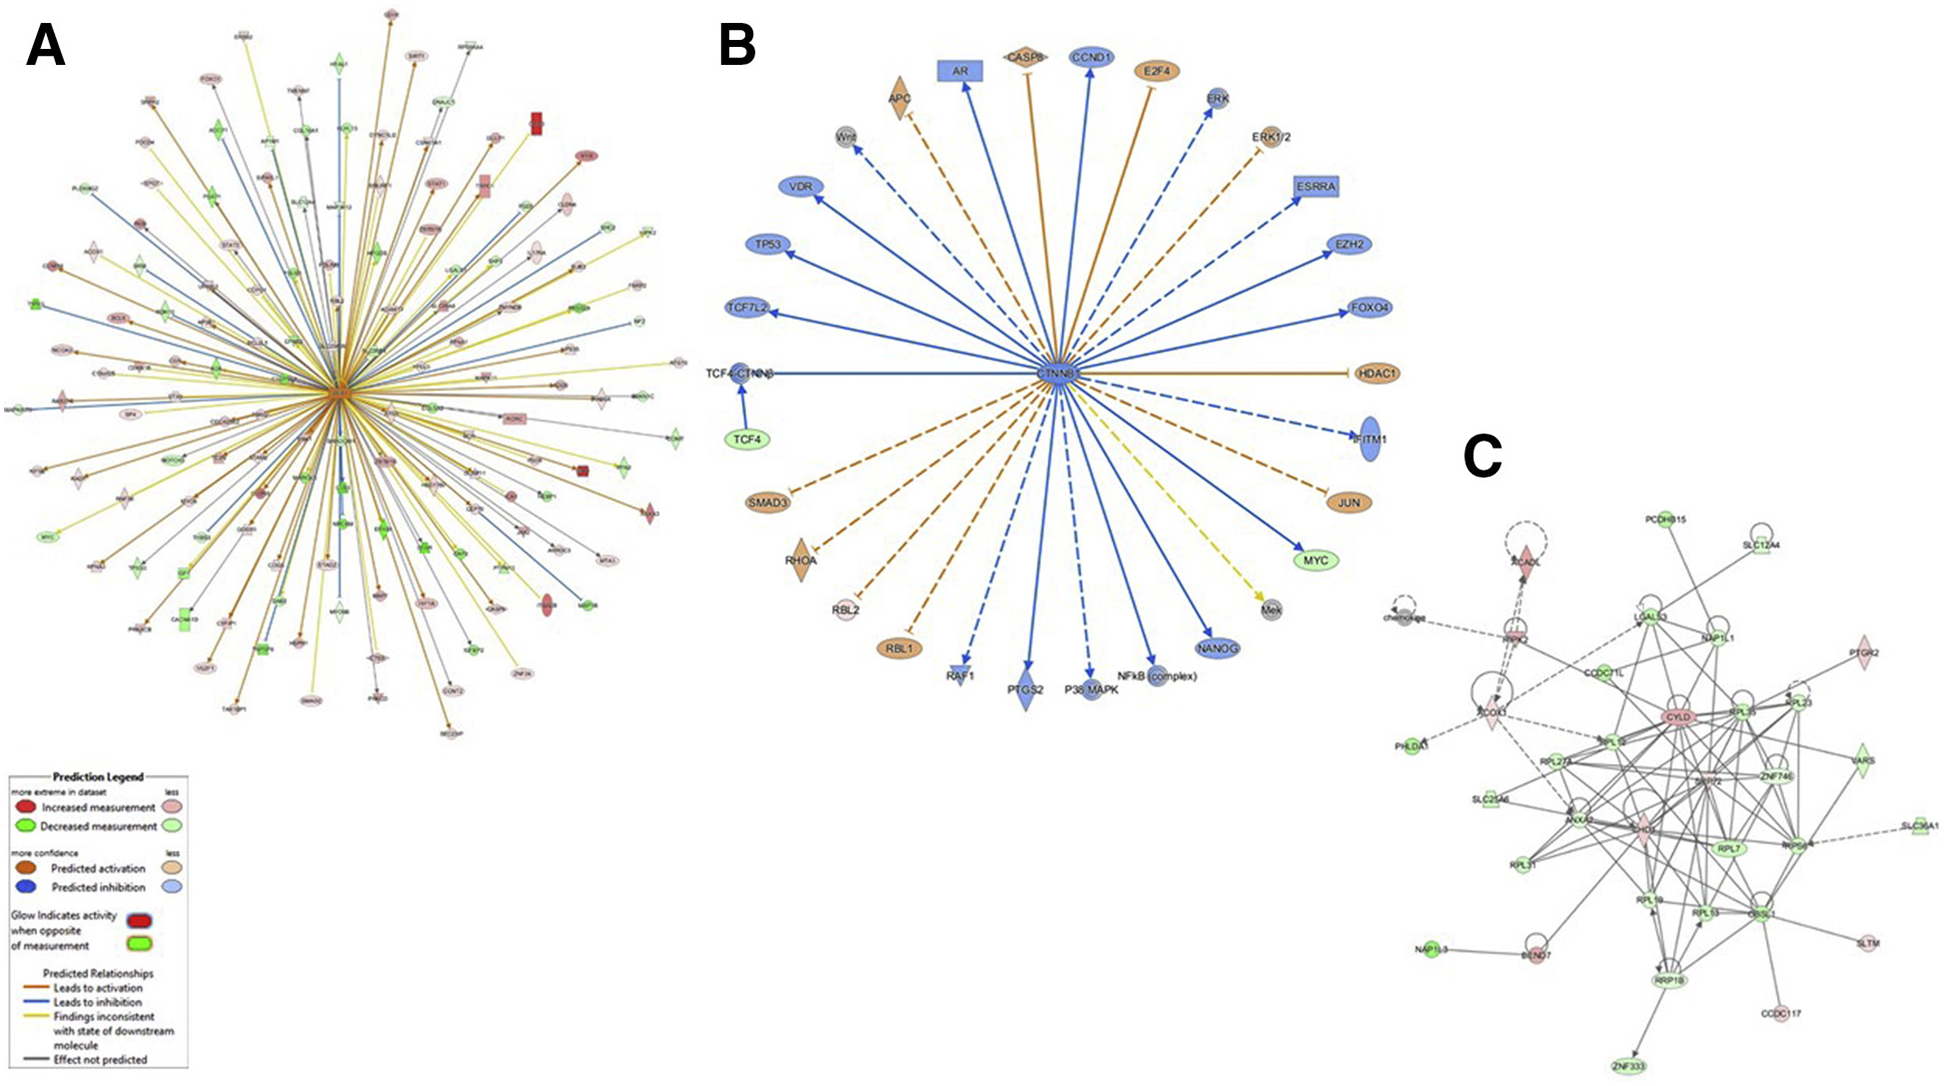
Ingenuity Pathway Analyses (IPA) of contrast eutopic endometrium of females without vs. with endometriotic cysts (stages 0–2 vs. stages 3 and 4, see text for details). Examples of significant regulatory pathway ESR1 (A; ESR1 at central node) and causal network TCF4-CTNNB1 (B; CTNNB at central node) are shown. The top gene network identified by IPA is depicted in panel C. Prediction legend supplied below panel A from IPA.
TABLE 4. Ingenuity Pathway Analyses top 5 gene networks in contrast no cysts vs. visible cysts.
.
| Top diseases and functions | z Score | No. of focus molecules |
|---|---|---|
| Cancer, protein synthesis, RNA damage and repair | 42 | 34 |
| Connective tissue disorders, developmental disorder, hereditary disorder | 40 | 33 |
| Cellular assembly and organization, cellular function and maintenance, RNA post-transcriptional modification | 37 | 32 |
| Developmental disorder, ophthalmic disease, organismal injury and abnormalities | 37 | 32 |
| Connective tissue development and function, connective tissue disorders, organ morphology | 37 | 32 |
TABLE 5. PANTHER pathway analyses top 5 gene pathways in contrast no cysts vs. visible cysts.
.
| Category name (accession no.) | No. of genes | % Total functional hits |
|---|---|---|
| WNT signaling pathway (P00057) | 41 | 5.6 |
| Integrin signaling pathway (P00034) | 32 | 4.4 |
| CCKR signaling map (P06959) | 28 | 3.9 |
| Gonadotropin-releasing hormone receptor pathway (P06664) | 26 | 3.6 |
| Inflammation mediated by chemokine and cytokine signaling pathway (P00031) | 24 | 3.3 |
DISCUSSION
The present analyses detail the impacts of 6 years of hyperandrogenemia in the presence and/or absence of an obesogenic diet on the endometrial transcriptome in nonhuman primates. These treatments mimic pubertal onset of hyperandrogenemia observed in a subset of adolescent girls at risk for PCOS later in adulthood (23, 24). Previous marker analyses were performed on the endometrium obtained by biopsy in this population of rhesus females after 3 years of treatment (4, 22). This analysis found ESR1, PGR, MMP26, TIMP3, GLUT1/12, and IRS1 displayed aberrant expression in the secretory phase in females exposed to T (T and T+WSD groups), while WSD treatment only impacted GLUT3. These data suggested females exposed to T might be developing progesterone resistance, while at the same time also displaying impaired insulin/glucose metabolism within the endometrium. A fertility trial of these females performed after these biopsies appeared to confirm these findings: exposure to T was associated with increased interval to conception, while WSD was associated with reduced fertility (6). The broader transcriptomic studies comprising this manuscript were initiated postpartum after females who had successfully achieved pregnancy had begun to return to cyclicity. The greatest number of gene products altered in the current analyses was found in T+WSD versus T; in this contrast females had the greatest divergence in body composition (T-treated females were leaner), and body composition correlated with uterine vascularity (lean animals had higher VF through their uterus/endometrium). Overall, transcriptomic changes associated with hyperandrogenemia in the presence of a healthy chow diet (T vs. C) were modest—these two groups only differed in glucose response during ivGTT, and other metabolic parameters were not statistically different. This is contrasted with the larger number of transcriptomic changes associated with hyperandrogenemia in the presence of the obesogenic diet (T+WSD vs. WSD)—these two groups had very similar metabolic characteristics at the time of study. These two seemingly paradoxical observations may account for the large number of transcripts with significant interaction effects between T and/or WSD detected in this data set. The metabolic data reported here are specific to the subset of rhesus females undergoing endometrial biopsies during the midsecretory phase. Females were randomly selected from treatment groups; however, all females were required to experience a midcycle surge of E2, indicating presumably ovulatory cycles before to ensure midsecretory status. Metabolic analyses of the entire cohort during the same treatment year (n = 8–10/group) revealed exposure to T in the presence of a chow diet resulted in similar glucose clearance during ivGTT to control females (Bishop et al. unpublished observations). These analyses also found significant increases in BMI and body fat with consumption of the WSD (Bishop et al. unpublished observations). Therefore, effects of T alone in the endometrium must also be examined in the broader context of the reproductive and metabolic physiology of the female. This is a strength of this nonhuman primate study, featuring well-defined cohorts of females analyzed longitudinally throughout adult life beginning at menarche.
From these results it appears the greatest impact on endometrial function is related to metabolism; hyperandrogenemia contributes to poor endometrial function when combined with an obesogenic diet/metabolic dysfunction. This result is not completely unexpected; the aforementioned fertility trial found that a female’s metabolic status was predictive of her ability to achieve a viable pregnancy (6), and data from women with PCOS have reported significant increases in pregnancy rates after treatment with insulin sensitizers and lifestyle interventions (25, 26). In addition, rhesus macaques consuming this obesogenic WSD have impaired placentation compared with controls consuming healthy chow diets (27, 28), suggesting defects in decidualization occur when overall metabolic status is poor. The data generated here indicate that this is likely due to defects in endometrial function before embryonic gonadotropin signaling and attachment. Impaired decidualization is seen in obese mice models and human primary endometrial cell cultures and may be due to direct responses to elevated leptin signaling by endometrial stromal cells (as reviewed in reference 29). Upon closer inspection of PANTHER gene ontologies (http://www.pantherdb.org/list/advancedTextSearch.jsp?listType=9), the leptin gene is included in the “gonadotropin-releasing hormone receptor” pathway, which is identified as one of the top 5 regulated pathways in contrasts T+WSD versus T, WSD versus C, and T+WSD versus C. The leptin receptor is significantly down-regulated in WSD versus C, suggesting leptin signaling may be altered in the endometrium of macaques consuming the WSD. This may be just one of several pathways by which the endometrium responds to a dam’s metabolic status.
In all contrasts, genes associated with oncogenic processes were overrepresented in this data set. Coincidentally, several macaques developed endometriosis diagnosed at the time of biopsy or within 6 months. This presented a unique opportunity to interrogate changes within this data set associated with development of disease, as well as disease progression. Evidence from individuals undergoing female-to-male sex transition as well as rodent models suggests high levels of androgens have an antiproliferative action on endometrial stromal cells and dysregulated androgen receptor signaling is seen in endometriotic lesions (30, 31). The synthetic androgen danazol is able to successfully shrink endometriotic lesions in women but is not commonly prescribed because of unwanted androgenic side effects (32). Women with PCOS are reported to have a high risk for endometriosis in some studies (33) and reports also suggest an elevated risk for endometrial cancer (34). But in our cohort of rhesus females that developed endometriosis, no one treatment group was significantly overrepresented (Supplemental Table 1). This trend held for the entire cohort of rhesus females maintained on these treatments in our colony, where endometriotic progression was observed in all groups, but control females did not present with more advanced stages present in T, WSD, and T+WSD cohorts by the time of this analysis (22).
Endometriosis is associated with obesity in women, with a recent genome-wide association study showing significant overlap between areas of the genome associated with fat distribution and endometriosis (35). When endometriosis stages were compared with metabolic parameters in our larger cohort (39 females), BMI, %/kg body fat, %/kg lean mass, total bone mineral content (kg), HBA1C, and weight were not significantly associated with endometriosis stages (χ2 analyses, P >.4, data not shown). However, fasting insulin (P = .014), glucose production during ivGTT (P = .018), and HOMA-IR (P = .008) were significantly associated with endometriosis stages (at ~5 years of treatment; Supplemental Fig. 8). The aforementioned genome-wide association study analyses likewise did not find significant associations with BMI and waist-to-hip ratio adjusted BMI (35), confirming that metabolic status, and not necessarily gross measurements of body weight, may be more predictive of risk for endometriosis.
Conclusions
Transcriptomic changes to the endometrium of primates exposed to hyperandrogenemia in the presence of a healthy diet were modest. However, when hyperandrogenemia is combined with an obesogenic diet/metabolic dysfunction, this contributes to poor endometrial function as reflected by a larger number of dysregulated gene products. This analysis also capitalized on the observation that several females developed endometriosis either before or immediately after biopsy. There are very few, if any, assessments of eutopic endometrium in women who appear to be disease free at time of biopsy but quickly develop detectible endometriosis, as in this nonhuman primate cohort. The data provided here can be used to provide insights into early changes within endometrium that drive disease progression.
Supplementary Material
Acknowledgements:
The authors thank the ONPRC Division of Comparative Medicine for care of animals, especially Heather Sidener, D.V.M., D.A.C.L.A.M. and Lauren Drew Martin, D.V.M., D.A.C.L.A.M. for their assistance identifying females with endometriosis; Emily Mishler, M.S., Tanner Grenz, B.S. and Samantha Rettke, B.S., members of the NCTRI Non-Human Primate Core for their assistance with the study;. Diana Takahashi, M.S., ONPRC Obese Resources and Cadence True, Ph.D., for their metabolic assessments of NCTRI females; ONPRC Bioinformatics and Biostatistics Core members for providing analysis of the RNA-seq data; and the OHSU Integrated Genomics Laboratory, in particular the Gene Profiling and Massively Parallel Sequencing Shared Resources, for their purification and sequencing of the macaque samples.
C.V.B. has nothing to disclose. F.L. has nothing to disclose. L.G. has nothing to disclose. S.S.F. has nothing to disclose. O.D.S. reports grants from NIH (P50HD071836, R21HD098642), during the conduct of the study.
Supported by the Eunice Kennedy Shriver National Institute of Child Health and Human Development of the National Institutes of Health (NIH) under funding for the Oregon Health and Science University/Oregon National Primate Research Center (ONPRC) National Center for Translational Research in Infertility award P50 HD071836 and the Office of the NIH Director award to the ONPRC, P51 OD011092. The content is solely the responsibility of the authors and does not necessarily represent the official views of the NIH.
REFERENCES
- 1.Teede HJ, Misso ML, Costello MF, Dokras A, Laven J, Moran L, et al. Recommendations from the international evidence-based guideline for the assessment and management of polycystic ovary syndrome. Hum Reprod 2018; 33:1602–18. [DOI] [PMC free article] [PubMed] [Google Scholar]
- 2.Legro RS, Arslanian SA, Ehrmann DA, Hoeger KM, Murad MH, Pasquali R, et al. Diagnosis and treatment of polycystic ovary syndrome: an Endocrine Society clinical practice guideline. J Clin Endocrinol Metab 2013;98: 4565–92. [DOI] [PMC free article] [PubMed] [Google Scholar]
- 3.True CA, Takahashi DL, Burns SE, Mishler EC, Bond KR, Wilcox MC, et al. Chronic combined hyperandrogenemia and western-style diet in young female rhesus macaques causes greater metabolic impairments compared to either treatment alone. Hum Reprod 2017;32:1880–91. [DOI] [PMC free article] [PubMed] [Google Scholar]
- 4.Bishop CV, Mishler EC, Takahashi DL, Reiter TE, Bond KR, True CA, et al. Chronic hyperandrogenemia in the presence and absence of a western-style diet impairs ovarian and uterine structure/function in young adult rhesus monkeys. Hum Reprod 2018;33:128–39. [DOI] [PMC free article] [PubMed] [Google Scholar]
- 5.Bishop CV, Reiter TE, Erikson DW, Hanna CB, Daughtry BL, Chavez SL, et al. Chronically elevated androgen and/or consumption of a Western-style diet impairs oocyte quality and granulosa cell function in the nonhuman primate periovulatory follicle. J Aassist Reprod Genet 2019;36:1497–511. [DOI] [PMC free article] [PubMed] [Google Scholar]
- 6.Bishop CV, Stouffer RL, Takahashi DL, Mishler EC, Wilcox MC, Slayden OD, et al. Chronic hyperandrogenemia and western-style diet beginning at puberty reduces fertility and increases metabolic dysfunction during pregnancy in young adult, female macaques. Hum Reprod 2018;33:694–705. [DOI] [PMC free article] [PubMed] [Google Scholar]
- 7.Liu H, Lang JH. Is abnormal eutopic endometrium the cause of endometriosis? The role of eutopic endometrium in pathogenesis of endometriosis. Med Sci Monit 2011;17: RA92–9. [DOI] [PMC free article] [PubMed] [Google Scholar]
- 8.National Research Council Guide for the Care and Use of Laboratory Animals. 8th ed. Washington, D.C.: National Academies Press; 2011. [Google Scholar]
- 9.Canis M, Donnez JG, Guzick DS, Halme JK, Rock JA, Schenken RS, et al. Revised American Society for Reproductive Medicine classification of endometriosis: 1996. Fertil Steril 1997;67:817–21. [DOI] [PubMed] [Google Scholar]
- 10.Andrews S FastQC: a quality control tool for high throughput sequence data. http://www.bioinformatics.babraham.ac.uk/projects/fastqc. [Google Scholar]
- 11.Ewels P, Magnusson M, Lundin S, Kaller M. MultiQC: summarize analysis results for multiple tools and samples in a single report. Bioinformatics 2016; 32:3047–8. [DOI] [PMC free article] [PubMed] [Google Scholar]
- 12.Bolger AM, Lohse M, Usadel B. Trimmomatic: a flexible trimmer for Illumina sequence data. Bioinformatics 2014;30:2114–20. [DOI] [PMC free article] [PubMed] [Google Scholar]
- 13.Dobin A, Davis CA, Schlesinger F, Drenkow J, Zaleski C, Jha S, et al. STAR: ultrafast universal RNA-seq aligner. Bioinformatics 2013;29:15–21. [DOI] [PMC free article] [PubMed] [Google Scholar]
- 14.Engstrom PG, Steijger T, Sipos B, Grant GR, Kahles A, Ratsch G, et al. Systematic evaluation of spliced alignment programs for RNA-seq data. Nat Methods 2013;10:1185–91. [DOI] [PMC free article] [PubMed] [Google Scholar]
- 15.DeLuca DS, Levin JZ, Sivachenko A, Fennell T, Nazaire MD, Williams C, et al. RNA-SeQC: RNA-seq metrics for quality control and process optimization. Bioinformatics 2012;28:1530–2. [DOI] [PMC free article] [PubMed] [Google Scholar]
- 16.R_Core_Team R. A language and environment for statistical computing. Vienna, Austria: R Foundation for Statistical Computing; 2017. https://www.R-project.org/. [Google Scholar]
- 17.Robinson MD, Oshlack A. A scaling normalization method for differential expression analysis of RNA-seq data. Genome Biol 2010;11:R25. [DOI] [PMC free article] [PubMed] [Google Scholar]
- 18.Law CW, Chen Y, Shi W, Smyth GK. voom: Precision weights unlock linear model analysis tools for RNA-seq read counts. Genome Biol 2014;15:R29. [DOI] [PMC free article] [PubMed] [Google Scholar]
- 19.Liu R, Holik AZ, Su S, Jansz N, Chen K, Leong HS, et al. Why weight? Modelling sample and observational level variability improves power in RNA-seq analyses. Nucleic Acids Res 2015;43:e97. [DOI] [PMC free article] [PubMed] [Google Scholar]
- 20.Ritchie ME, Phipson B, Wu D, Hu Y, Law CW, Shi W, et al. Limma powers differential expression analyses for RNA-sequencing and microarray studies. Nucleic Acids Res 2015;43:e47. [DOI] [PMC free article] [PubMed] [Google Scholar]
- 21.Mi H, Muruganujan A, Ebert D, Huang X, Thomas PD. PANTHER version 14: more genomes, a new PANTHER GO-slim and improvements in enrichment analysis tools. Nucl Acids Res 2018;47:D419–26. [DOI] [PMC free article] [PubMed] [Google Scholar]
- 22.Slayden OD, Bishop CV, Mishler E, Martin LD, Sidener HM, Hennebold JD, et al. Severe endometriosis in rhesus macaques consuming a western-style diet (WSD) and chronically treated with androgen. Fertil Steril 2019;112: e43–4. [Google Scholar]
- 23.Burt Solorzano CM, Beller JP, Abshire MY, Collins JS, McCartney CR, Marshall JC. Neuroendocrine dysfunction in polycystic ovary syndrome. Steroids 2012;77:332–7. [DOI] [PMC free article] [PubMed] [Google Scholar]
- 24.McGee WK, Bishop CV, Bahar A, Pohl CR, Chang RJ, Marshall JC, et al. Elevated androgens during puberty in female rhesus monkeys lead to increased neuronal drive to the reproductive axis: a possible component of polycystic ovary syndrome. Hum Reprod 2012;27:531–40. [DOI] [PMC free article] [PubMed] [Google Scholar]
- 25.Morley LC, Tang T, Yasmin E, Norman RJ, Balen AH. Insulin-sensitising drugs (metformin, rosiglitazone, pioglitazone, D-chiro-inositol) for women with polycystic ovary syndrome, oligo amenorrhoea and subfertility. Cochrane Database Syst Rev 2017;11:CD003053. [DOI] [PMC free article] [PubMed] [Google Scholar]
- 26.Balen AH, Morley LC, Misso M, Franks S, Legro RS, Wijeyaratne CN, et al. The management of anovulatory infertility in women with polycystic ovary syndrome: an analysis of the evidence to support the development of global WHO guidance. Hum Reprod Update 2016;22:687–708. [DOI] [PubMed] [Google Scholar]
- 27.Frias AE, Morgan TK, Evans AE, Rasanen J, Oh KY, Thornburg KL, et al. Maternal high-fat diet disturbs uteroplacental hemodynamics and increases the frequency of stillbirth in a nonhuman primate model of excess nutrition. Endocrinology 2011;152:2456–64. [DOI] [PMC free article] [PubMed] [Google Scholar]
- 28.Kuo K, Roberts VHJ, Gaffney J, Takahashi DL, Morgan T, Lo JO, et al. Maternal high-fat diet consumption and chronic hyperandrogenemia are associated with placental dysfunction in female rhesus macaques. Endocrinology 2019;160:1937–49. [DOI] [PMC free article] [PubMed] [Google Scholar]
- 29.Broughton DE, Moley KH. Obesity and female infertility: potential mediators of obesity’s impact. Fertil Steril 2017;107:840–7. [DOI] [PubMed] [Google Scholar]
- 30.Simitsidellis I, Saunders PTK, Gibson DA. Androgens and endometrium: new insights and new targets. Mol Cell Endocrinol 2018;465:48–60. [DOI] [PubMed] [Google Scholar]
- 31.Huhtinen K, Saloniemi-Heinonen T, Keski-Rahkonen P, Desai R, Laajala D, Ståhle M, et al. Intra-tissue steroid profiling indicates differential progesterone and testosterone metabolism in the endometrium and endometriosis lesions. J Clin Endocrinol Metab 2014;99:E2188–97. [DOI] [PubMed] [Google Scholar]
- 32.Farquhar C, Prentice A, Singla AA, Selak V. Danazol for pelvic pain associated with endometriosis. Cochrane Database Syst Rev 2007;4:CD000068. [DOI] [PubMed] [Google Scholar]
- 33.Holoch KJ, Savaris RF, Forstein DA, Miller PB, Higdon HL, Likes CE, et al. Coexistence of polycystic ovary syndrome and endometriosis in women with infertility. J Endometr Pelvic Pain Disord 2014;6:79–83. [Google Scholar]
- 34.Shafiee MN, Khan G, Ariffin R, Abu J, Chapman C, Deen S, et al. Preventing endometrial cancer risk in polycystic ovarian syndrome (PCOS) women: could metformin help? Gynecol Oncol 2014;132:248–53. [DOI] [PubMed] [Google Scholar]
- 35.Rahmioglu N, Macgregor S, Drong AW, Hedman ÅK, Harris HR, Randall JC, et al. Genome-wide enrichment analysis between endometriosis and obesity-related traits reveals novel susceptibility loci. Hum Mol Genet 2015;24:1185–99. [DOI] [PMC free article] [PubMed] [Google Scholar]
Associated Data
This section collects any data citations, data availability statements, or supplementary materials included in this article.