

Abstract
Proton magnetic resonance spectroscopy (1H-MRS) is a noninvasive imaging technique that measures the concentration of metabolites in defined areas of the human brain in vivo. The underlying structure of natural metabolism-emotion relationships is unknown. Further, there is a wide range of between-person differences in metabolite concentration in healthy individuals, but the significance of this variation for understanding emotion in healthy humans is unclear. Here we investigated the relationship of two emotional constructs, agency and flexibility, with the metabolites glutamate and glutamine (Glx), N-acetylaspartate (tNAA), choline (Cho), creatine (tCr), and myo-inositol (Ins) in the right dorsal anterior cingulate cortex (dACC) in medically and psychiatrically healthy volunteers (N = 20, 9 female; mean age = 22.8 years, SD = 3.40). The dACC was selected because this region is an integrative hub involved in multiple brain networks of emotion, cognition and behavior. Emotional traits were assessed using the Multidimensional Personality Questionnaire Brief Form (MPQ-BF), an empirically derived self-report instrument with an orthogonal factor structure. Phenotypes evaluated were positive and negative agency (MPQ-BF Social Potency, Aggression), emotional and behavioral flexibility (MPQ-BF Absorption, Control-reversed), and positive and negative affect (MPQ-BF Social Closeness; Stress Reaction, Alienation). The resting concentration of tNAA in the dACC was robustly positively correlated with Absorption (r = +0.56, unadjusted p = .005), moderately positively correlated with Social Potency (r = +0.42, unadjusted p = .03), and robustly negatively correlated with Aggression (r = −0.59, unadjusted p = .003). Absorption and Aggression accounted for substantial variance in tNAA (R2 = 0.31, 0.35; combined R2 = 0.50), and survived correction for multiple comparisons (Holm-Bonferroni adjusted p = .032, 0.021, respectively). dACC Glx and Cho had modest relationships with behavioral flexibility and social affiliation that did not survive this multiple correction, providing effect sizes for future work. Principal Component Analysis (PCA) revealed a three-factor orthogonal solution indicating specific relationships between: 1) Glx and behavioral engagement; 2) Cho and affiliative bonding; and 3) tNAA and a novel dimension that we term neuroaffective reserves. Our results inform the neurobiology of agency and flexibility and lay the groundwork for understanding mechanisms of natural emotion using 1H-MRS.
Keywords: Trait emotion, Personality, Single voxel proton magnetic spectroscopy, Dorsal anterior cingulate, tNAA, Neurotypical adult volunteers
1. Introduction
Health is the “state of complete physical, mental and social well-being and not merely the absence of disease ” (WHO, 1946, rev 2006). Emotional human health is shaped by agency and flexibility. Agency is the ability to shape one’s own choices and to take decisive action in the world (Depue and Collins, 1999; Patrick et al., 2002; Tellegen, 1982). Flexibility is the ability to fluidly respond to events as they occur (Depue and White, 2015; Patrick et al., 2002; Tellegen, 1982). Both abilities contribute to the emotional traits that shape affective experience (Depue and White, 2015; Patrick et al., 2002; Tellegen, 1982). Diminution or loss of agency and flexibility contribute to functional impairment that characterize injury, and medical and psychiatric disease including addiction (Dellu-Hagedorn et al., 2018; Istin et al., 2017; Markarian et al., 2010). Understanding the neural foundations of human agency and flexibility thus has the potential to improve well-being across life and to illuminate the biological basis of the wide range of individual differences in these traits.
Proton magnetic resonance spectroscopy (1H-MRS) is a method that noninvasively and quantitatively evaluates brain metabolites. This method provides information on compounds in the brain that are ubiquitous and occur at mM concentrations, such as N-acetylaspartate (tNAA), glutamatergic compounds (Glx), choline (Cho), myoinositol (Ins) and creatine (tCr). Studies to date have associated these compounds with neuronal integrity (tNAA), glutamatergic activity (Glx), bioenergetics (tCr), cell membrane turnover (Cho), intracellular catecholamine signaling (Ins), and acetylcholine production (Cho) (Cohen et al., 2010; Fonnum, 1984; Kekelidze et al., 2001; Rae, 2014; Wallimann et al., 1992).
Several lines of data suggest that these metabolites may also shape the magnitude and scope of agency and flexibility in humans. The first evidence comes from cognitive neuroscience, where tNAA in frontal, temporal, occipitoparietal, cingulate and supraventricular cortex relates to cognitive fluidity. In healthy adults, tNAA in these regions is positively related with cognitive performance, attention, executive function, working memory, processing speed, cognitive creativity, divergent thinking and general and fluid intelligence (Jung et al., 2009, 2013, 1999b; Nikolaidis et al., 2017; Paul et al., 2016). These findings indicate a relationship between tNAA and fluid cognition (Patel et al., 2014), and raise the possibility of a relationship with other aspects of fluidity, such as the flexibility of emotion and behavior.
The second line of evidence comes from clinical neuroscience. Alterations in tNAA, tCr, Ins, Cho and Glx accompany dysregulation and recovery of agency and flexibility. Loss of behavioral flexibility occurs in drug and alcohol dependence, bipolar mania and obsessive-compulsive disorder (Dellu-Hagedorn et al., 2018; Istin et al., 2017; Markarian et al., 2010). These conditions involve reductions in tNAA in frontal and medial brain regions (Chang et al., 2003; Croarkin et al., 2015; Haselhorst et al., 2002; Jang et al., 2006; Nordahl et al., 2002; Reneman et al., 2002; Reynolds and Reynolds, 2011; Salo et al., 2007; Schuff et al., 2008; Sung et al., 2013, 2007; Winsberg et al., 2000). Select reductions are also observed in tCr, Cho, Ins, and Glx (Birur et al., 2017; Ende et al., 2006; Ernst et al., 2000; Salo et al., 2007; Sekine et al., 2002). Glx and Cho change dynamically in early drug abstinence, with acute reductions in Glx and elevations in Cho (Ernst and Chang, 2008; Nordahl et al., 2005; Salo et al., 2007). Loss of emotional flexibility characterizes major depressive disorder (MDD) and post-traumatic stress disorder (Cao et al., 2019; Piao et al., 2017). These conditions are correlated with reduced tNAA and Ins in frontal and limbic regions (Rae, 2014; Reynolds and Reynolds, 2011; Schuff et al., 2008; Venkatraman et al., 2009). Substantive loss of agency also occurs in stroke, neurodegenerative disease and Alzheimer’s disease (Harezlak et al., 2011). Here reductions in tNAA are thought to reflect glutamate-related excitotoxicity and lesion-induced patient apathy, with conjoined improvements in tNAA, apathy and recovery of function in the period following acute stroke (Dong et al., 2009; Glodzik-Sobanska et al., 2005; Lau and Tymianski, 2010; Yeh et al., 2018). Effective treatment of mood disorders also changes brain metabolites. The serotonin reuptake inhibitor citalopram, the mood stabilizer lamotrigine and electroconvulsive therapy normalize tNAA in the prefrontal cortex, ACC, left amygdala and frontal white matter (Croarkin et al., 2015; Jang et al., 2006; Michael et al., 2003). Short-term oral creatine monohydrate increases frontal lobe tCr and improves SSRI-resistant depression (Kondo et al., 2016). Taken together, these data indicate alterations in metabolites, agency and flexibility in the progression, recovery and treatment of brain disease.
The third lines of evidence come from affective neuroscience, where 1H-MRS was assessed alongside validated measures of emotion. These studies involve healthy volunteers and most often focus on state and trait anxiety, with more limited investigation of incentive emotion, positive affect, impulsivity, alexithymia and emotional intelligence (Colic et al., 2016; Ende, 2015; Gallinat et al., 2007; Grachev and Apkarian, 2000; Grimm et al., 2012; Hoerst et al., 2010; Jung et al., 2002; Kim et al., 2009; Modi et al., 2014; Timoshanko et al., 2014; White et al., 2018). Affective studies often focus on the anterior cingulate, amygdala and frontal cortex. In these regions Glx and tCr appear to rise with incentive motivation, positive affect and behavioral activation (Ende, 2015; Hoerst et al., 2010; White et al., 2018). There is a positive relationship of tNAA with the ability to identify and name emotion, and a positive relationship of Ins with anxiety (Colic et al., 2016; Grachev and Apkarian, 2000; Howells et al., 2015; Modi et al., 2014). The situation is less clear with higher-order measures such as impulsivity, neuroticism and extraversion, with mixed to null relationships observed with Glx, Cho, NAA, and tCr (Grachev and Apkarian, 2000; Grimm et al., 2012; Hoerst et al., 2010; Kim et al., 2009; Modi et al., 2014; Ryman et al., 2011). Overall the data suggest a complex pattern of relationships between emotion and metabolites which differ by level of analysis. Higher-order traits reflect multiple lower-order traits, which in turn can have disparate associations with brain metabolites (Depue and White, 2015; White, 2017). As such, 1H-MRS investigation of lower-order traits such as agency and flexibility may provide crucial information on the metabolic mechanisms of emotion and health.
In this study we used 1H-MRS to investigate the neurobiology of agency and flexibility in well individuals. Effects were evaluated in medically and psychiatrically healthy young adult volunteers (N = 20; age = 22.8 ± 3.40).1H-MRS data were acquired in the right dorsal anterior cingulate after a three-hour period of rest in each participant (dACC; voxel location in Fig. 1; experimental design in Suppl. Figure S1). The right dACC was selected because it is a neocortical hub that connects the default mode, frontoparietal control, cingulo-opercular, and salience networks that mediate behavioral activation, agentic positive emotion, salience and attention monitoring (Barrett and Satpute, 2013). Trait emotion was assessed using the MPQ-BF, an empirically derived self-report instrument (Patrick et al., 2002). Positive and negative aspects of agency were evaluated using the MPQ-BF scales of Social Potency and Aggression. Emotional and behavioral flexibility were evaluated using the MPQ-BF scales of Absorption and Control. Valenced emotion was evaluated using three additional MPQ-BF scales to address specificity and discriminant validity (details in Table 1).
Fig. 1. MRS voxel and example spectra.
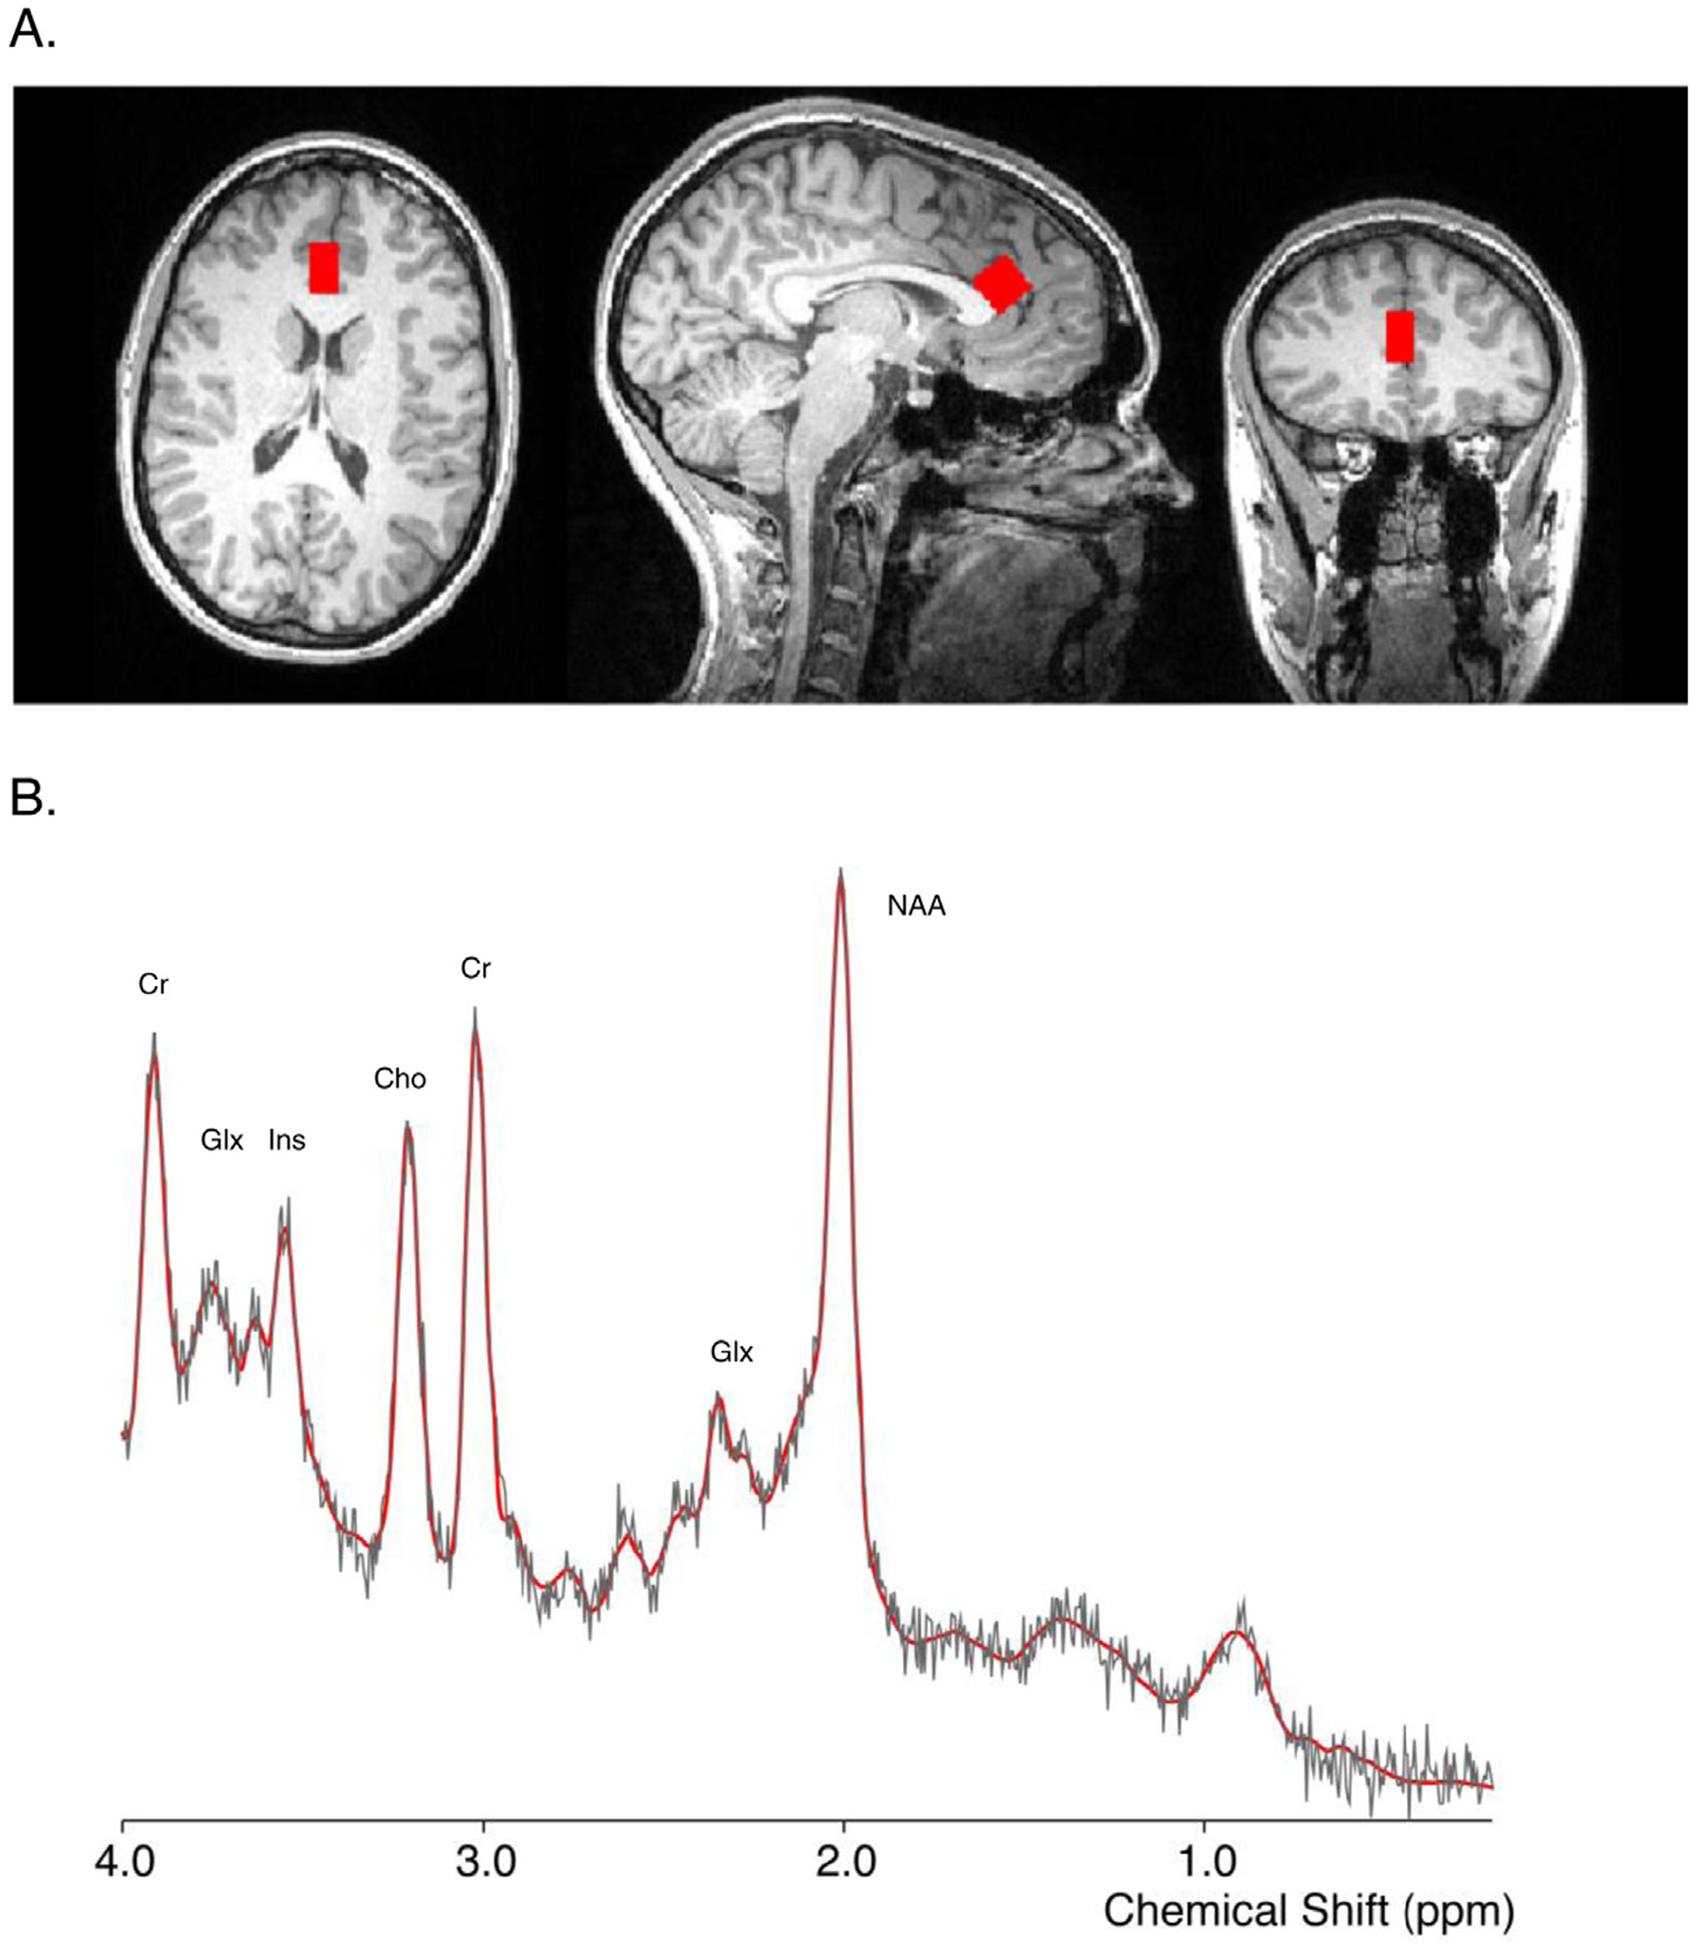
(A) Voxel placement in dorsal anterior cingulate cortex (dACC). Left: axial; middle: sagittal; right: coronal views, respectively. Images are in radiological orientation (L = R). (B) Example MRS spectra with labeled peaks. The solid red curve overlay is the fitted spectrum from LCModel, and the raw data shown in light gray. Labeled peaks: Cr = creatine; Ins = myo-inositol; Cho = choline; Glx = glutamate and glutamine; NAA = N-acetyl-aspartate.
Table 1.
Constructs and measures.
| Trait Measures |
Constructs | |||||
|---|---|---|---|---|---|---|
| Flexibility | Agency | Valence | ||||
| Emotion | Behavior | Positive | Negative | Positive | Negative | |
| 1. Absorption | √ | |||||
| 2. Control-reversed | √ | |||||
| 3. Social Potency | √ | √ | ||||
| 4. Aggression | √ | √ | ||||
| 5. Social Closeness | √ | |||||
| 6. Stress Reaction | √ | |||||
| 7. Alienation | √ | |||||
Emotion constructs were evaluated using measures of trait emotion on the Multidimensional Personality Questionnaire Brief Form (MPQ-BF). Trait measures of emotion are in column 1. Emotion constructs of primary interest are in columns 2 to 7. Absorption provides a measure of the flexibility of emotion (col. 2). Control-reversed provides a measure of behavioral flexibility (col. 3). Social Potency provides a measure of positive agency (col. 4). Aggression provides a measure of negative agency (col. 5). Scales of non-agentic valenced emotion were included for purposes of discriminant validity. These are Social Closeness, which measures non-agentic positive emotion (col. 6), and Stress Reaction and Alienation, which measure non-agentic negative emotion (col. 7). The measures provide an orthogonal test of the relationships between 1 H MRS metabolites, agency, flexibility and valence (see Methods).
Our overall goal was to understand the relationship between 1H-MRS metabolites and natural traits of agency and flexibility in healthy volunteers. There were several hypotheses. dACC tNAA was expected to rise with emotional fluidity (MPQ-BF Absorption), given positive findings with cognitive fluidity (Nikolaidis et al., 2017; Paul et al., 2016). In contrast, dACC tNAA was expected to fall with negative agency (MPQ-BF Aggression), given inverse findings with clinical aggression (Basoglu et al., 2008; Critchley et al., 2000). dACC Glx was expected to rise with positive agency (MPQ-BF Social Potency) and behavioral flexibility (MPQ-BF Control-reversed), given positive findings with positive affect and impulsivity (Hoerst et al., 2010; White et al., 2018). Cho was expected to rise with positive and negative agency (MPQ-BF Social Potency, Aggression) given findings of Cho with traits of both positive and negative affect (Jung et al., 2002; Ryman et al., 2011; Timoshanko et al., 2014).
2. Methods
2.1. Study design
Medically and psychiatrically healthy young adult volunteers gave informed consent and underwent 1H-MRS and emotion assessment as a part of a larger parent study that addressed drug effects on 1H-MRS metabolites (White et al., 2018). The present paper reports on relationships between emotional traits and metabolites evaluated on the placebo day. Timing of the test session is available in Supplemental Figure S1, with 1H-MRS conducted following a three hour period of rest in a standardized environment (White et al., 2018). The present data have not been previously reported and are relevant to normal, between-person differences in 1H-MRS metabolites in the dACC.
2.2. Recruitment
Participants were medically and psychiatrically healthy as determined by a clinical interview, structured psychiatric interview, self-report questionnaire, drug and alcohol testing, medical exam and EKG. Exclusion and inclusion criteria have been published (White et al., 2018) and excluded: those younger than 18 or older than 35; those with BMI below 18 or over 30; left-handedness; less than a high school education/GED; lack of fluency in English; any chronic medical condition; abnormal EKG; any current or past Axis I psychiatric disorder; smoking more than 5 cigarettes per week; and in females, current or intended pregnancy or lactation. Exclusion of drug and alcohol dependence, head trauma and psychiatric disease avoids potential confounds in metabolites due to neurodegeneration and neurotoxicity (Dong et al., 2009; Ende et al., 2006; Lau and Tymianski, 2010; Tunc-Skarka et al., 2015). The study was approved by the Institutional Review Board for research with human subjects at Brown University and the Memorial Hospital of Rhode Island in accordance with the Code of Federal Regulations (Title 45, Part 46) “Protection of Human Subjects” adopted by the National Institutes of Health and the Office for Protection from Research Risks. The study was conducted ethically in accordance with the Helsinki Declaration of 1964 (revised 2013).Written informed consent was obtained from all participants.
2.3. Participants
Twenty-six healthy right-handed individuals participated; of these twenty had high quality MRS data available for analysis with trait emotion (N = 20; data exclusions in Methods).Participants were 18–28 years of age (mean = 22.8 years, SD = 3.40, N = 20). There were roughly equal numbers of males and females (11 males, 9 females).Racial composition was 60% White, 20% Asian, 5% African American, 5% American Indian or Alaskan Native, and 10% Multiracial/Other. Ethnicity was 79% non-Hispanic and 21% Latino/Hispanic. Overall the sample was well educated, with 10% reporting a high school diploma, the majority (60%) reporting some college education and 30% reporting a bachelor’s degree or beyond.
2.4. Procedures
Trait emotion was assessed at the psychological screening session at the Laboratory of Affective Neuroscience at Brown University, with 1H-MRS spectra acquired at the Brown University Magnetic Resonance Facility (MRF). Digital breath analysis and urine toxicology screening confirmed participants were alcohol and drug free prior to neuroimaging. Participants were in verbal contact with the experimenter at all times during the experiment (White et al., 2018).
2.5. Structural imaging
A Siemens 3T TIM Trio system (Siemens Medical Solutions, New York, NY) was used for MR data collection. Whole-brain T1-weighted images (MPRAGE sequence) were acquired in the sagittal plane at the beginning of the MRI session (resolution = 1 mm × 1 mm × 1 mm; TR = 1900 ms; TI = 900 ms, TE = 2.98 ms; TI = 900 ms; flip angle = 9°; FOV = 256 × 256). The structural T1 images were processed using SPM12 (Ashburner and Friston, 2005), and Gannet Coregister was used to reconstruct the voxel (Edden et al., 2014; Harris et al., 2015).
2.6. Magnetic resonance spectroscopy
Spectra were acquired in the dACC using single voxel, point-resolved spectroscopy (PRESS). The voxel measured 15 × 15 × 10 mm (10 mm in SI direction) and was placed on the T1-weighted anatomical image using the three plane reconstructions. The voxel was placed on the right dACC immediately anterior and parallel to the corpus callosum (see Fig. 1 A).On sagittal view, the midline slice where the corpus callosum was most distinct was selected and the voxel was placed anterior and superior to the corpus callosum. The voxel was rotated to be tangential to the corpus callosum. In coronal, sagittal and axial views, the voxel was aligned anterior and parallel to the corpus callosum such that the posterior edge of the voxel was in line with the horns of the lateral ventricles. In coronal view, the voxel was right lateralized to capture innervation from the salience network (Grayson et al., 2014) and to minimize CSF contamination from the longitudinal fissure. Voxel placement was confirmed by posthoc voxel reconstruction in subject specific anatomical space. Reconstructed MRS voxels were checked to confirm agreement with voxel placement protocol for individual anatomy, according to the subject specific anatomical landmarks (described above).During the MRS sessions standard first-order auto shimming was implemented, line width checked and shimming manually adjusted to minimize the free water line width. Prior to acquisition of spectral data, non-water suppressed datasets were obtained to provide for eddy current compensation and to provide a water reference. Acquisition parameters were TR = 3000 ms, TE = 30 ms, with 128 averages taken for a total acquisition time of 6 m 24 s for water-suppressed data.
Spectra were processed and metabolites quantified using LCModel, using a basis set provided by the LCModel author (Provencher, 1993).Data were compensated for differential T1 effects according to individual metabolite T1 values at 3 Tesla (Ethofer et al., 2003; Mlynarik et al., 2001; Traber et al., 2004). All of the data received zero- and first-order phase correction as part of the regular LCModel process, done automatically by LCModel with no user intervention. Only metabolites with Cramer-Rao lower bound (CRLB) ≤ 20% were evaluated. Example spectra using this procedure are in Fig. 1B.
Quality control was implemented in four steps.(1) Using co-registration tools from the Gannet analysis package (Harris et al., 2015), voxels were reconstructed in each anatomical scan and segmented using SPM12 (Ashburner and Friston, 2005), a common method that allows for quantification of the proportion of white matter, gray matter and CSF in the voxel. Data were corrected for partial volume effects per established methods (Brandt et al., 2016; Larsen et al., 2016; Maltezos et al., 2014).(2) All MRS spectra and voxel reconstruction output were visually inspected for quality by an MRS data acquisition and analysis expert. (3) Data for individual metabolites were excluded where the CRLB exceeded 20% SD. (4) Metabolite data were evaluated for outliers, defined as a value more than 2.5 SD away from the mean (see Patel et al., 2014). These procedures indicated that the majority of the data were of high quality: from a total of 26 acquired scans, three scans were excluded for lack of water reference files, one scan was excluded for issues with voxel reconstruction, and two scans were excluded for having low proportion of gray matter (< 0.60) in the voxel. No data were excluded for exceeding the CRLB threshold and there were no outliers. Thus, MRS scans from twenty participants were available for statistical analysis (N = 20).
2.7. 1H-MRS measures
Metabolites reliably assessed by 1H-MRS include tNAA, a combined measure of N-acetyl-aspartate (NAA) and N-acetylaspartyl-glutamate (NAAG); Glx, a composite measure of Glu and Gln; Cho, a measure of choline-containing compounds glycerophosphocholine and phosphocholine; tCr, a combined measure of creatine and phosphocreatine; and Ins, a measure of myo-inositol. Reliability for these metabolites using a PRESS acquisition at 3T is well established (Baker et al., 2008; Geurts et al., 2004; Provencher, 1993).Glx was selected in favor of Glu given its prevalence in the literature. Each metabolite was quantified relative to water in institutional units (i.u.) per standard practice (Zhu and Barker, 2011).Ratio-based measures were considered but decided against to avoid interpretive confounds should multiple metabolites relate to emotional traits (Haga et al., 2009; Li et al., 2003; Rae, 2014).Metabolites were corrected for partial volume effects using the formula [*1/(1- fCSF)], where fCSF is the voxel volume fraction of cerebrospinal fluid (determined using SPM segmentation of the reconstructed voxel as described above) therefore providing a measure of metabolite concentration in total tissue within the voxel (per methods of (Ashburner and Friston, 2005; Brandt et al., 2016; Edden et al., 2014; Harris et al., 2015; Larsen et al., 2016; Maltezos et al., 2014)). These procedures are in keeping with our prior work and published guidelines for analytic rigor in human MRS (Patel et al., 2014; White et al., 2018).
2.8. Trait emotion measures
Emotional traits were evaluated by self-reports on the Multidimensional Personality Questionnaire Brief Form (MPQ-BF) (Patrick et al., 2002). The MPQ-BF has eleven primary (lower-order) orthogonal scales developed through an iterative empirical process (Patrick et al., 2002; Tellegen, 1982). Each primary scale is affectively unipolar and measures the relative presence (versus absence) of a specific emotional trait. Low scores thus indicate a relative absence of a given trait, whereas high scores indicate the strong presence of the trait. Self-reports on the MPQ-BF have excellent validity and reliability (Patrick et al., 2002).Responses on primary scales are independent to modestly correlated, correlating 0.0 to ±.4 in healthy volunteers (Tellegen, 1982). The MPQ-BF thus allows for the dissociation of multiple aspects of natural emotion using a dimensional approach in healthy young adults. Constructs and measures are in Table 1.
Positive agency was evaluated by scores on the MPQ-BF Social Potency scale, which measures the frequency and intensity of agentic engagement with positive incentive stimuli. High scores on Social Potency indicate a high level of positive agency in the face of positive incentive stimuli, whereas low scores indicate low motivation to engage with and lower positive agentic emotion to these cues.
The negative component of agency includes a willingness to act in ways that can have an adverse impact on others. Negative agency was evaluated by the MPQ-BF Aggression scale, which measures the propensity toward negative agentic affective states and interpersonal aggression. High scores on Aggression indicate a proclivity toward negatively valenced agentic engagement, whereas low scores indicate a capacity to resist or be resilient to negative agentic emotion.
Emotional flexibility was evaluated by the MPQ-BF Absorption scale, which measures the capacity for immersive emotion. High scores on Absorption indicate easily inducible, immersive subjective emotional responses to a broad range of eliciting stimuli. Low scores in contrast indicate a less inducible immersive emotional response, a narrower range of eliciting stimuli, and a narrower range of experienced emotion. The trait thus provides a measure of the fluidity and dynamic range of emotion.
Behavioral flexibility was evaluated by reversed scores on the MPQ-BF Control scale, calculated as [Control multiplied by (−1)].High scores on Control-reversed indicate a preference for spontaneity, while low scores indicate a preference for planfulness (Patrick et al., 2002).
Given the commingling of positive and negative emotion in the primary measures of agency, valenced emotion without an agentic component was also assessed. Non-agentic positive emotion was evaluated by the MPQ-BF Social Closeness scale, a measure of affiliative extraversion that is related to but distinct from positive agency (Grodin and White, 2015). Non-agentic negative emotion was evaluated by the MPQ-BF Stress Reaction and Alienation scales. These scales measure ruminative distress and interpersonal alienation, respectively, which are related to but distinct from aggression (Patrick et al., 2002; Tellegen, 1982; White and Depue, 1999). These primary scales measure valenced emotion without an agentic component, which is relevant to specificity and discriminant validity.
Responses on the MPQ-BF were evaluated for data quality using the Invalidity scale, which identifies invalid patterns of responding on the instrument due to invariant responses, true/false response bias, inconsistent responses, or social desirability response patterns (Patrick et al., 2002). All participants had valid scores on the MPQ-BF.
2.9. Statistical analysis
2.9.1. Descriptive analyses
Descriptive statistics were computed for all measures. The relationship of CSF-corrected metabolites was evaluated using a bivariate correlation approach in order to provide information on relationship of metabolites in the dACC at rest (two-tailed). The relationship of trait emotion measures was also evaluated using a bivariate correlation approach (two-tailed) in order to provide information on the interrelationship of agency, flexibility and valenced emotion. These analyses provide basic information about the distribution of the independent and dependent measures.
2.9.2. Relationships with trait emotion
Bivariate correlations were conducted to determine relationships between neurometabolites and trait emotion. A priori hypotheses were evaluated one-tailed given directional hypotheses with each metabolite (above).Discriminant tests were evaluated two-tailed to provide information on specificity and discriminant validity. Follow-up partial correlations were conducted for findings with multiple predictors, in order to determine the extent to which emotion-metabolite relationships were independent. Effect sizes were estimated for significant findings using the guidelines of Cohen (Cohen, 1988, 1992). Pearson correlations of 0.1 were interpreted as small effects, 0.3 interpreted as medium effects, and 0.5 interpreted as large effects. Overall variance explained for each metabolite was estimated by R2, with R2 calculated as the square of the correlation coefficient (r2) for individual relationships, and R2 calculated by linear regression for multiple relationships (Cohen, 1988, 1992). Last, a principal component analysis (PCA) was conducted to provide exploratory information on biologically coherent domains of metabolites and natural emotion. The PCA analysis was restricted to measures that were found to be significant in the primary analysis in order to evaluate the structure of relationships between significant predictors and dACC metabolites. PCA factors with eigenvalues greater than or equal to 1.0 were selected and interpreted based on items with factor loadings greater than 0.35.A varimax rotation was utilized to provide orthogonal information on neurometabolic function and trait emotion. The label provided to each principal component is qualitative based on the first author’s expertise in the neurobiology of emotion.
2.9.3. Type I and type II error
We selected the stepwise Holm-Bonferroni correction procedure to minimize Type I error (Holm, 1979). The Holm-Bonferroni sequential correction, while assuming the independence of tests, does so in stepwise fashion which is uniformly more powerful than the original Bonferroni method and, unlike the original, provides for the specific estimation and fixation of Type I error for the family of tests conducted (i.e., family-wise error is fixed at a predetermined alpha, usually but not always 0.05; see (Aickin and Gensler, 1996). The Holm-Bonferroni sequential procedure was applied to all emotion tests for each metabolite. Each MRS outcome was thus treated as its own family of tests, with correction for all seven traits evaluated as a conservative correction for multiple testing (four primary and three discriminant measures).Findings were ordered in descending order of effect magnitude (i.e., in ascending p-value order) and the Holm-Bonferroni adjusted alpha was applied in sequential fashion, using the formula α* = α/(n-rank + 1), with adjusted alpha criteria of 0.0071, 0.00833, 0.01, 0.0125, 0.0166, 0.025 and 0.05 applied to findings of rank 1 through 7, respectively. This approach provides for greater ability to detect effects and more rigorous control of family-wise error compared to alternative procedures (Aickin and Gensler, 1996).
Type II error was minimized using a two-pronged approach. Unadjusted and adjusted p-values were calculated for all findings. The unadjusted p-values provide an estimation of effect size and relationships in the absence of correction for multiple comparisons, providing first-line protection against Type II error. Findings for which unadjusted p-values indicated a relationship at an alpha of 0.05, but for which adjusted p-values were not significant at a family-wise error alpha of 0.05, were designated as preliminary in nature. These results provide preliminary data and effect size estimates for future work. This two-pronged approach protects against Type II error, which can have substantial adverse impact on scientific progress (Amrhein et al., 2019).
2.9.4. Statistical power
Power analyses for bivariate correlations were conducted in G*Power 3.1 using an alpha of 0.05 (Cohen, 1988; Faul et al., 2009). The final sample of 20 had high power (1-β = 0.8) to detect large correlations (r ≥ 0.53) and low power (1-β ≤ 0.42) to detect small to medium correlations (r ≤ 0.33).
3. Results
3.1. Descriptive statistics
3.1.1. 1H-MRS metabolites
Means and standard deviations for CSF-corrected metabolite concentrations in the dACC voxel and LCModel fit characteristics (CRLBs) are in Table 2.CRLBs for individual metabolites (means and SD in Table 2), full width half maximum value (mean ± SD = 0.06 ± 0.02), and signal-to-noise ratio (mean ± SD = 17.90 ± 3.13) were within the bounds of standards for high quality data collected using single-voxel spectroscopy (Provencher, 1993).Segmentation procedures indicated a mean ± SD tissue fraction of 0.71 ± 0.04 gray matter, 0.10 ± 0.05 white matter, and 0.18 ± 0.03 CSF within the voxel. Metabolites did not show evidence of CSF dependence (data not shown).
Table 2.
Descriptive statistics.
| Mean ± SD | CRLB | |
|---|---|---|
| Metabolites | ||
| tNAA | 8.32 ± 0.78 | 3.30 ± 0.80 |
| Glx | 13.13 ± 1.42 | 4.75 ± 1.89 |
| Cho | 1.83 ± 0.18 | 3.10 ± 0.79 |
| tCr | 6.42 ± 0.43 | 2.60 ± 0.60 |
| Ins | 4.84 ± 0.52 | 4.40 ± 1.90 |
| Trait Measures | ||
| Flexibility | ||
| Absorption | 6.5 ± 3.0 | |
| Control-reversed | −8.7 ± 3.0 | |
| Agency | ||
| Social Potency | 6.9 ± 3.3 | |
| Aggression | 1.6 ± 1.1 | |
| Discriminant Validity | ||
| Social Closeness | 9.1 ± 2.9 | |
| Stress Reaction | 4.4 ± 4.1 | |
| Alienation | 1.3 ± 2.0 |
Top rows are descriptive statistics for CSF-corrected metabolite levels in instsitutional units (i.u.). N = 20; see Methods for data quality and exclusions. Leftmost column indicates mean ± standard deviation for CSF-corrected metabolite concentrations in the dACC voxel. Rightmost column indicates mean and standard deviations for CRLB = Cramer-Rao lower bound for each metabolite. tNAA = total N -acetyl-aspartate and N-acetylaspartyl-glutamic acid. Glx = Glx complex. Cho = choline-containing compounds. tCr = total creatine and phosphocreatine. Ins = myo-inositol. Lower rows are d escriptive statistics for self-reports of trait emotion on the Multidimensional Personality Questionnaire Brief Form (MPQ-BF). Measures of Flexibility: Absorption, a measure of the flexibility of emotional engagement. Control-reversed, a measure of the flexibility and spontaneity of behavior. Measures of Agency: Social Potency, a measure of positively valenced agentic emotion. Aggression, a measure of negatively valenced agentic emotion. Measures included for Discriminant Validity: Social Closeness, a measure of affiliative extraversion which is distinct from Social Potency. Stress Reaction, a measure of ruminative distress, which is distinct from Aggression. Alienation, a measure of internal feelings of interpersonal alienation, also distinct from Aggression. N = 20 healthy young adults, see Methods for details.
Relationship of metabolites are in Suppl. Table S1. The CSF-corrected concentration of tNAA was unrelated to other metabolites (all r < |.24|, all p >.05, n.s.). In contrast Glx, Cho, tCr and Ins were strongly interrelated (Glx and tCr r = 0.76, p <.01; Glx and Cho r = 0.59, p <.01; Glx and Ins r = 0.48, p <.05; Cho and tCr r = 0.58, p <.01; Cho and Ins r = 0.65, p <.01; tCr and Ins r = 0.72, p <.01). These patterns indicate the independence of tNAA from other metabolites at rest in healthy volunteers, and the association of CSF-corrected estimates of Glx, Cho, tCr and Ins.
3.1.2. Trait emotion
Means and standard deviations for trait emotion are in Table 2.Scores ranged from the 29th to the 71st percentile, and the overall mean was centered on the 51st percentile (Suppl. Table S2), similar to published norms (Patrick et al., 2002). There were no sex differences (p ≥.06).Overall there were several patterns (Suppl. Table S3).Participants’ scores on the measures of Social Potency and Aggression were unrelated, indicating the independence of positive and negative agency in the present sample (r = −0.13, n.s.).Participants’ scores on Absorption and Control-reversed were also unrelated, indicating the independence of emotional and behavioral fluidity (r = 0.05, n.s.). In addition, the measures of agency were generally unrelated to the measures of flexibility (i.e., Absorption and Social Potency r = 0.14, n.s.; Absorption and Aggression r = −0.32, n.s.; Control-reversed and Aggression r = −0.09, n.s.), with the exception of a positive relation between the measures of behavioral flexibility and positive agency (Control-reversed and Social Potency r = +0.51, p <.05). This finding is consistent with the larger positive relationship of impulsivity and extraversion (Depue and Collins, 1999).Agency and flexibility were unrelated to valenced non-agentic emotion (i.e., measures included for purposes of discriminant validity; see Suppl. Table S3). The above findings indicate that participants’ responses on the MPQ-BF measures of agency, flexibility and valenced emotion were largely uncorrelated, providing orthogonal assessment of each emotional domain suitable for analysis with 1H-MRS metabolites.
3.2. Tests of relationships
3.2.1. tNAA and trait emotion
Relationships between 1H-MRS metabolites and trait emotion are in Table 3. There was a strong positive relationship between dACC tNAA and MPQ-BF Absorption (r = + 0.56, unadjusted p = .005; Table 3).As seen in Fig. 2-A, tNAA concentration in the dACC increased in participants with higher Absorption compared to those with lower trait scores. The large effect explained 31% of the variance in tNAA (R2 = 0.31) and was significant after Holm-Bonferroni correction (Holm adjusted p = .0324; family-wise α = 0.05).Second, tNAA in the dACC was modestly positively related with MPQ-BF Social Potency, r = + 0.42, unadjusted p =.03, R2 = 0.17, Table 3. As seen in Fig. 2-B, tNAA concentration increased in individuals with higher Social Potency compared to those with lower trait scores. The finding did not survive Holm-Bonferroni correction (Holm adjusted p =.167; family-wise α = 0.05), and is considered a preliminary result. Third, there was a strong negative correlation between dACC tNAA and MPQ-BF Aggression (r = −0.59, unadjusted p =.003; Table 3). As seen in Fig. 2-C, tNAA concentration in the dACC was reduced in participants with higher Aggression scores compared to those with lower trait scores. This large effect explained 35% of the variance in tNAA (R2 = 0.35) and was significant after Holm-Bonferroni correction (Holm adjusted p =.0210; family-wise α= 0.05). Partial correlations indicated that Absorption, Social Potency, and Aggression were independently related to tNAA (partial r’s = |.42 to 0.60|; p’s = 0.038 to 0.004; see Suppl. Results). In contrast measures of non-agentic valenced emotion were unrelated to tNAA (Table 3). The regression model with two predictors (Absorption, Aggression) was significant, F(2,19) = 8.50, p = .003, with an R2 of 0.500. The model with three predictors (Absorption, Social Potency, Aggression) was also significant, F(3,19) = 7.80, p =.002, with an R2 of 0.594. Together these findings indicate Absorption, Social Potency and Aggression explained 50 – 59% of the variance in tNAA in the dACC, a large effect.
Table 3.
Metabolic correlates.
| Trait Measures | tNAA | Glx | Cho |
|---|---|---|---|
| Flexibility | |||
| Absorption | .56***⧫ | −0.15 | −0.51** |
| Control-reversed | −0.06 | .41* | .37* |
| Agency | |||
| Social Potency | .42* | .17 | .24 |
| Aggression | −0.59***⧫ | −0.19 | .12 |
| Discriminant Measures | |||
| Social Closeness | .22 | .26 | .46* |
| Stress Reaction | −0.12 | −0.35 | −0.34 |
| Alienation | .17 | −0.26 | −0.15 |
Relationship between trait measures of agency and flexibility and CSF-corrected metabolite concentrations in the dACC voxel. N = 20, see Methods for details. All metabolites are partial volume corrected. Pearson correlations are presented. Glx = Glx complex. tNAA = total N-acetyl-aspartate and N-acetylaspartyl-glutamic acid. Cho = choline-containing compounds. Trait measures of emotion on the Multidimensional Personality Questionnaire Brief Form (MPQ-BF). Flexibility was assessed by Absorption: a measure of emotional range and capacity for emotional engagement across a wide range of internal and external stimuli; and Control-reversed: a measure of the preference for spontaneous over planned activities. Agency was assessed by Social Potency: a measure of agentic positive emotion; Aggression: a measure of agentic negative emotion. Discriminant Measures : Three measures of valenced emotion provide information on discriminant validity. Non-agentic positive emotion was evaluated by the Social Closeness scale, a measure of affiliation and social warmth, which is distinct from Social Potency (Grodin and White, 2015). Non-agentic negative emotion was evaluated by the Stress Reaction scale, a measure of ruminative distress, which is distinct from Aggression; and the Alienation scale, a measure of internal feelings of interpersonal alienation, also distinct from Aggression (see Suppl. Table S1 and S2). Correlations between 0.3 and 0.5 represent medium-sized effects; correlations greater than or equal to 0.5 represent large-sized effects.
unadjusted p ≤ 0.005,
unadjusted p = .01,
unadjusted p ≤ 0.05.Preliminary results (adjusted p <.05) are in italics.
Effects significant after correction for multiple comparisons (Holm-Bonferroni sequential adjusted α criterion = 0.0071, 0.0083) are in bold.
Fig. 2. tNAA relates to emotional flexibility and resilience to aggression.
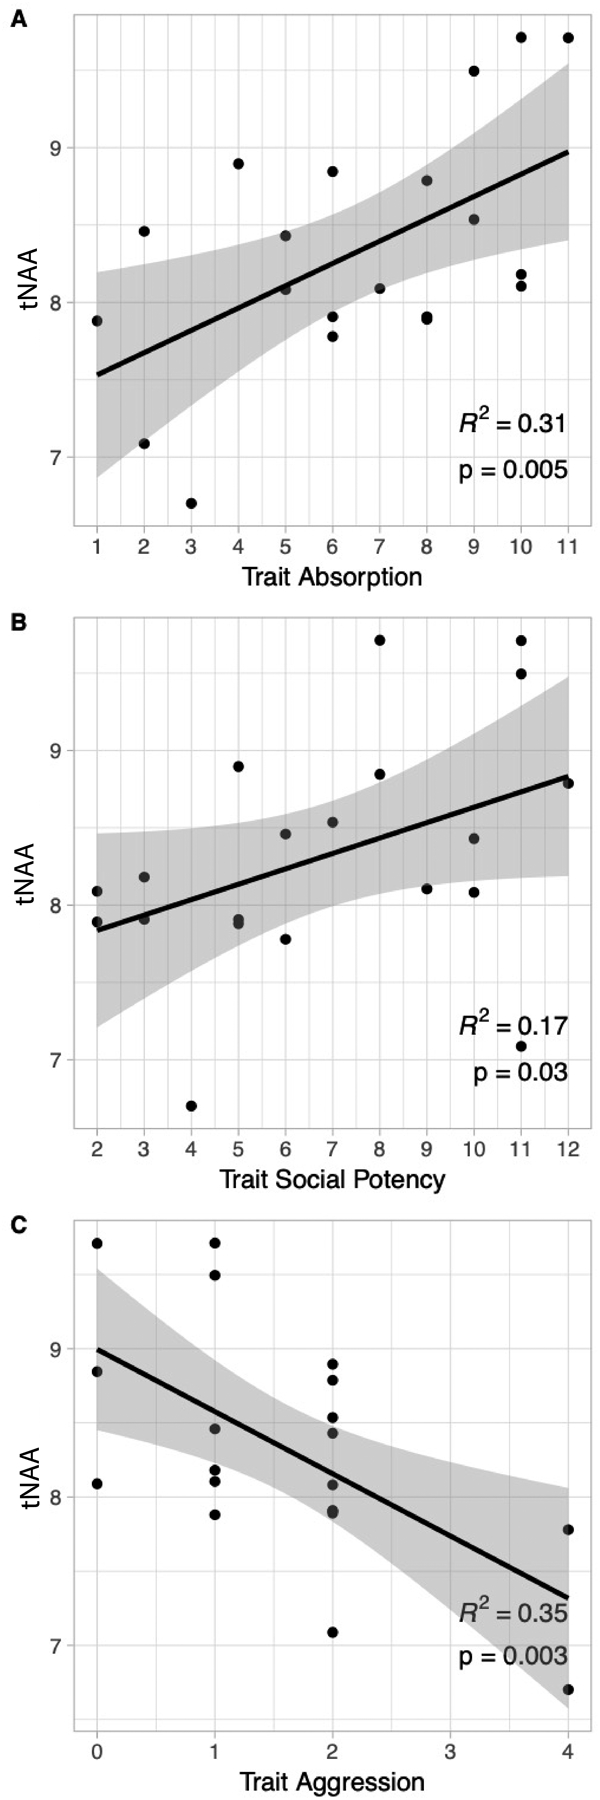
(A) tNAA in the dACC is strongly positively related to scores on trait Absorption, r = + 0.56, unadjusted p =.005, R2 = 0.31. The finding is large in size and survived correction using the Holm-Bonferroni sequential method (Holm adjusted p = .0324; family-wise α = 0.05). (B) tNAA in the dACC is positively related to scores on trait Social Potency, r = + 0.42, unadjusted p = .03, R2 = 0.17. The finding did not survive correction using the Holm-Bonferroni sequential method (Holm adjusted p = .167; family-wise α = 0.05), and thus is considered preliminary. (C) tNAA in the dACC is strongly negatively related to trait scores on trait Aggression, r = − 0.59, unadjusted p =.003, R2 = 0.35. The finding is large in size and survived correction using the Holm-Bonferroni sequential method (Holm adjusted p = .0210; family-wise α = 0.05).
tNAA = total N-acetyl-aspartate and N-acetylaspartylglutamate, corrected for partial volume effects. dACC = dorsal anterior cingulate; voxel size was 15 × 15 × 10 mm (10 mm in SI direction; see Methods for details). Personality was evaluated using the Multidimensional Personality Questionnaire Brief Form (MPQ-BF). gray shading is 95% confidence interval.
N = 20 participants with 1 H MRS data meeting quality control criteria; see Methods section for details.
3.2.2. Glx and trait emotion
The resting concentration of Glx in the dACC was modestly positively correlated with behavioral flexibility (MPQ-BF Control-reversed), r = +0.41, unadjusted p = .04, R2 = 0.17 (Table 3). As seen in Fig. 3, Glx was increased in participants with higher Control-reversed scores compared to those with lower trait scores. This medium-sized effect did not survive correction using the Holm-Bonferroni sequential method (Holm adjusted p =.258; family-wise α = 0.05), and is considered preliminary. Control-reversed explained 17% of the variance in Glx, a medium effect.
Fig. 3. Glx and behavioral flexibility.
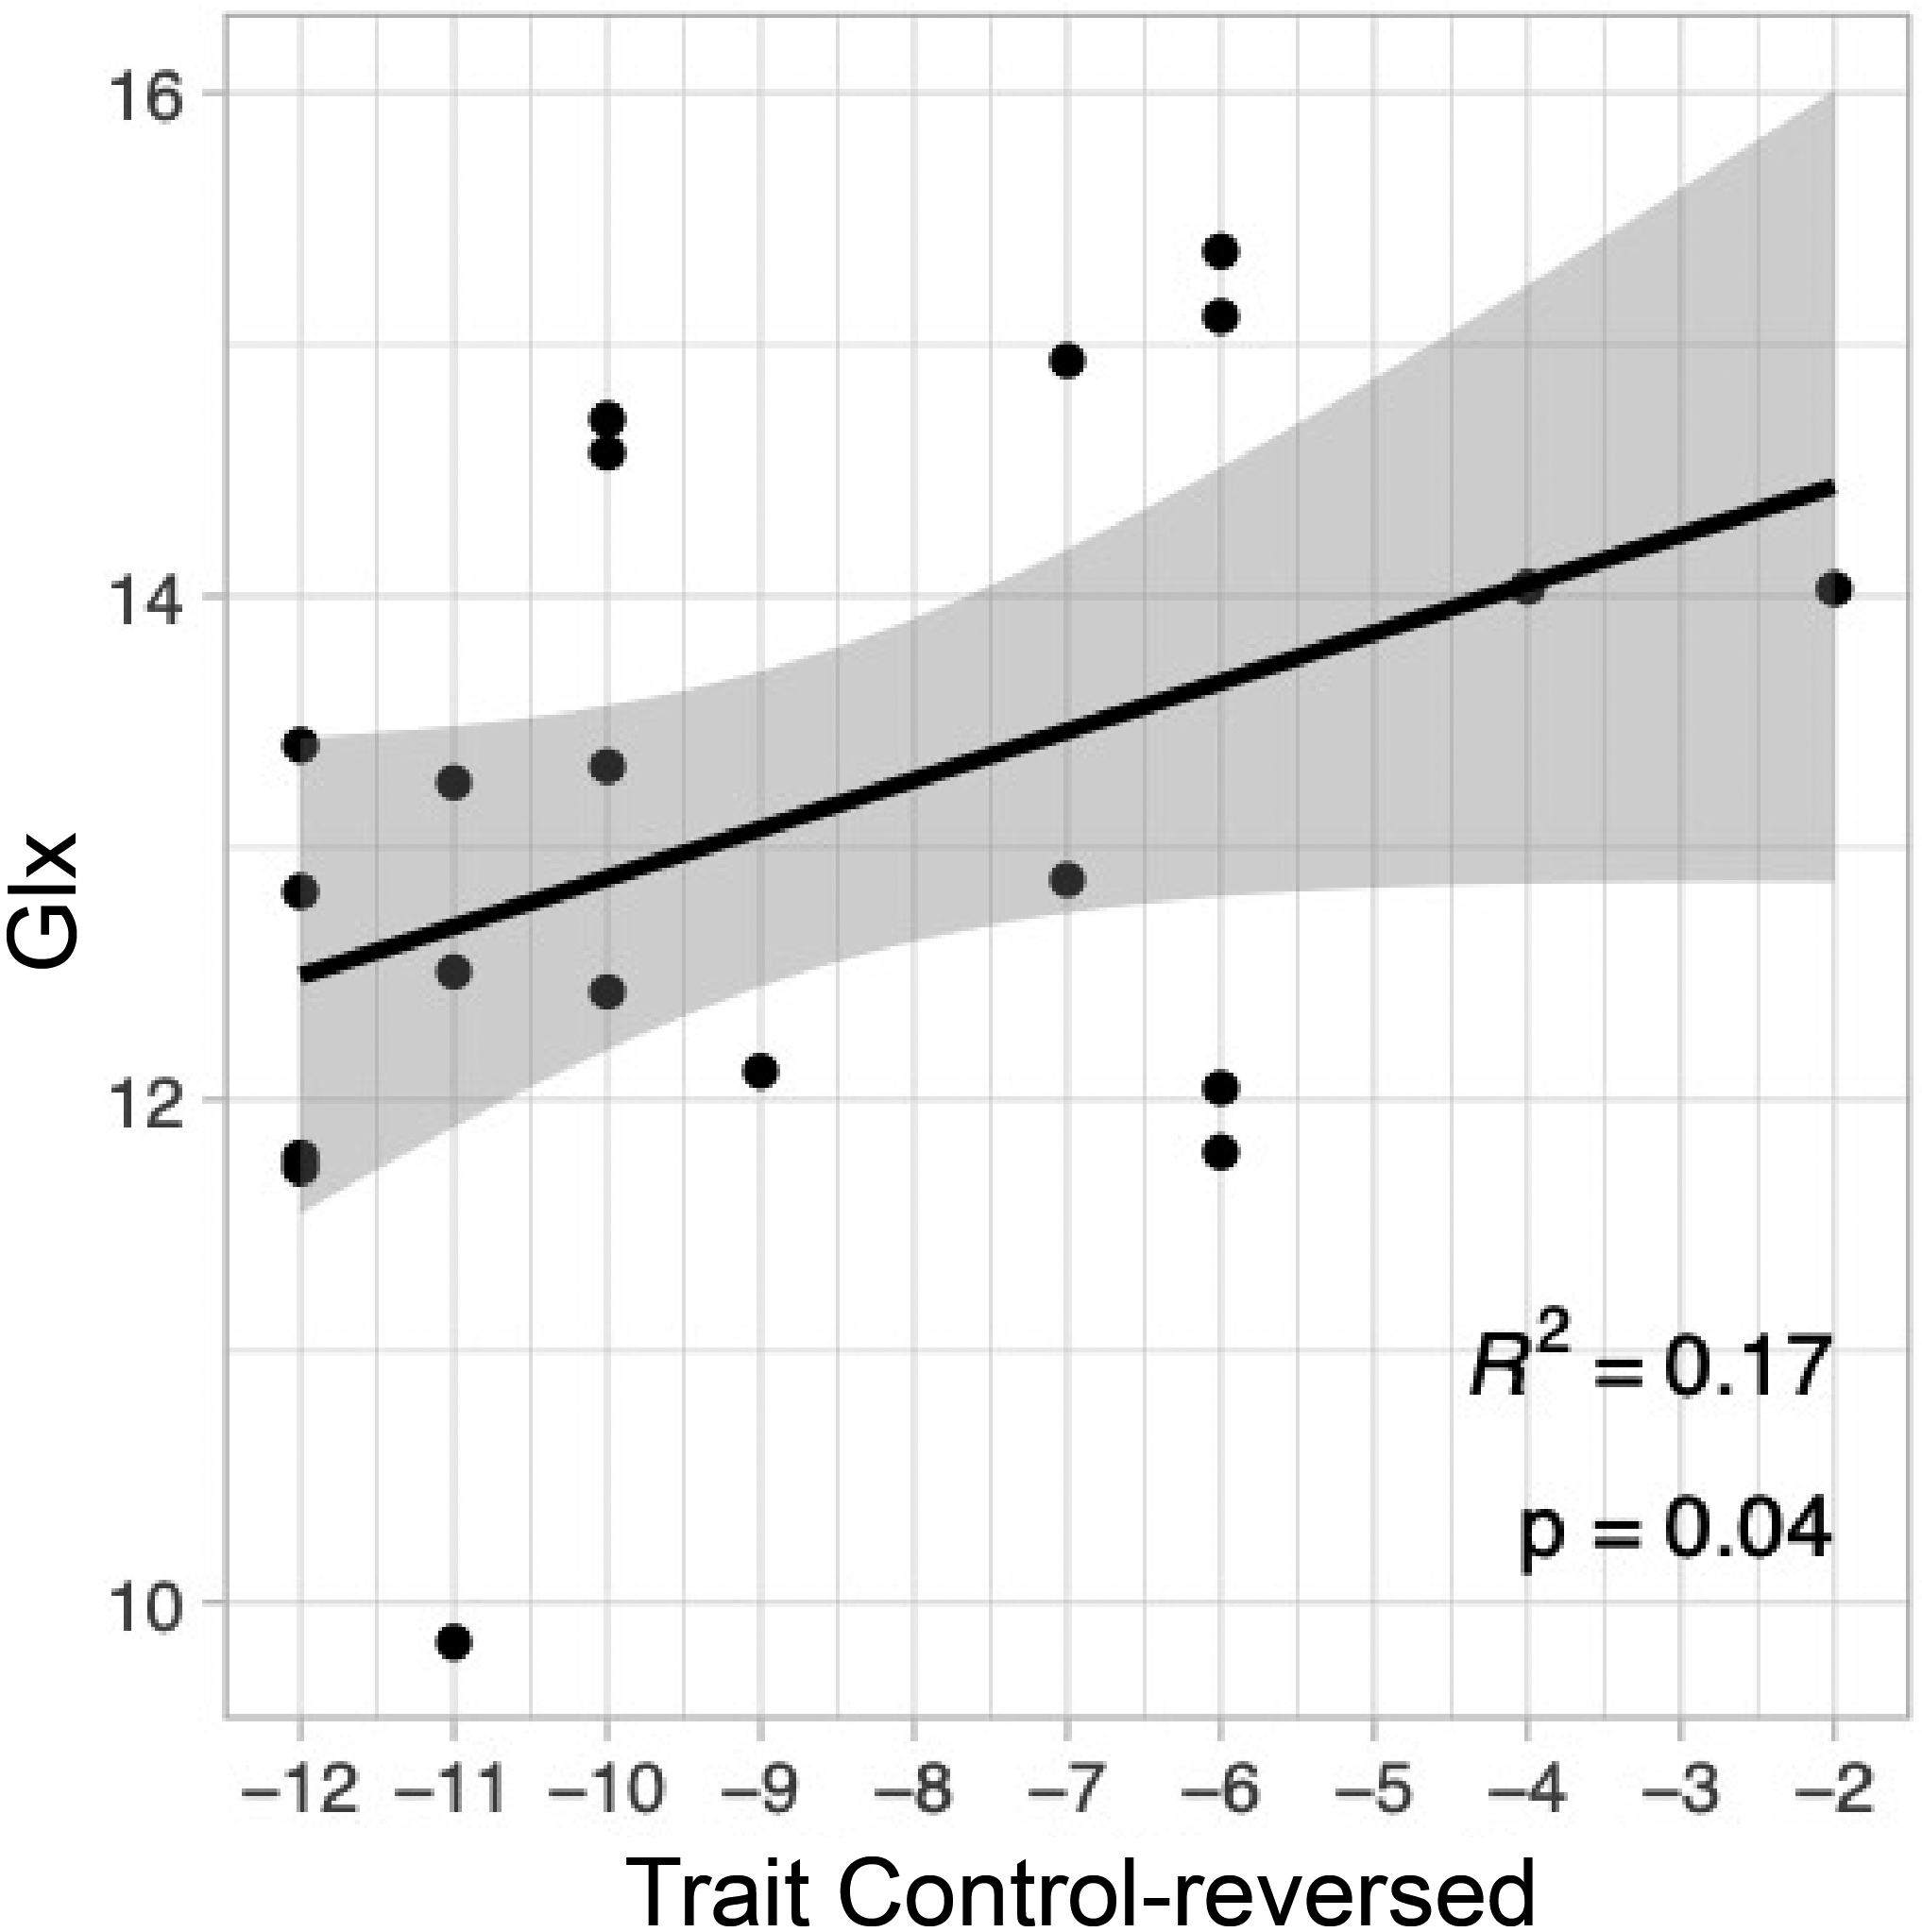
Glx in the dACC is positively related to scores on trait Control-reversed, r = +0.41, unadjusted p = .04, R2 = 0.17. The finding did not survive correction using the Holm-Bonferroni sequential method (Holm adjusted p = .258), and thus is considered preliminary. The finding provides evidence of a medium sized relationship between dACC Glx and behavioral flexibility in healthy adults. Glx = Glx complex, corrected for partial volume effects.dACC = dorsal anterior cingulate; voxel size was 15 × 15 × 10 mm (10 mm in SI direction; see Methods for details). Personality was evaluated using the Multidimensional Personality Questionnaire Brief Form (MPQ-BF).gray shading is 95% confidence interval. N = 20 participants with 1 H MRS data meeting quality control criteria; see Methods section for details.
3.2.3. Cho and trait emotion
The resting concentration of Cho in the dACC was modestly correlated with several traits. These effects did not survive correction using the Holm-Bonferroni sequential method and are considered preliminary. First, there was a negative relationship between Cho and MPQ-BF Absorption (r = −0.51, R2 = 0.26, uncorrected p =.01; Holm adjusted p =.07, family-wise α = 0.05; Table 3). As seen in Fig. 4-A, dACC Cho was reduced in individuals with higher Absorption compared to those with lower trait scores, a large effect. Second, there was a positive relationship between dACC Cho and MPQ-BF Control-reversed (r = +0.37, R2 = 0.14, uncorrected p =.05; Holm adjusted p =.27, family-wise α = 0.05, Table 3). As seen in Fig. 4-B, dACC Cho increased in individuals with higher behavioral flexibility (Control-reversed) compared to individuals with lower trait scores, a medium effect. Third, Cho was positively associated with MPQ-BF Social Closeness (r = +0.46, R2 = 0.21, p =.02; Holm adjusted p =.26, family-wise α = 0.05; Table 3), a measure of affiliative extraversion. As seen in Fig. 4-C, dACC Cho increased in participants with higher Social Closeness compared to those with lower scores, a medium effect. Partial correlations indicated that MPQ-BF Absorption, Control-reversed, and Social Closeness were each independently related to Cho (partial r’s = |.41 to 0.57|; p’s = 0.043 to 0.005). The regression model with three predictors was significant, F (3,19) = 7.15, p =.003, with an R2 of 0.573. The traits explained 57% of the total variance in Cho, a large effect.
Fig. 4. Cho and multiple domains of emotion.
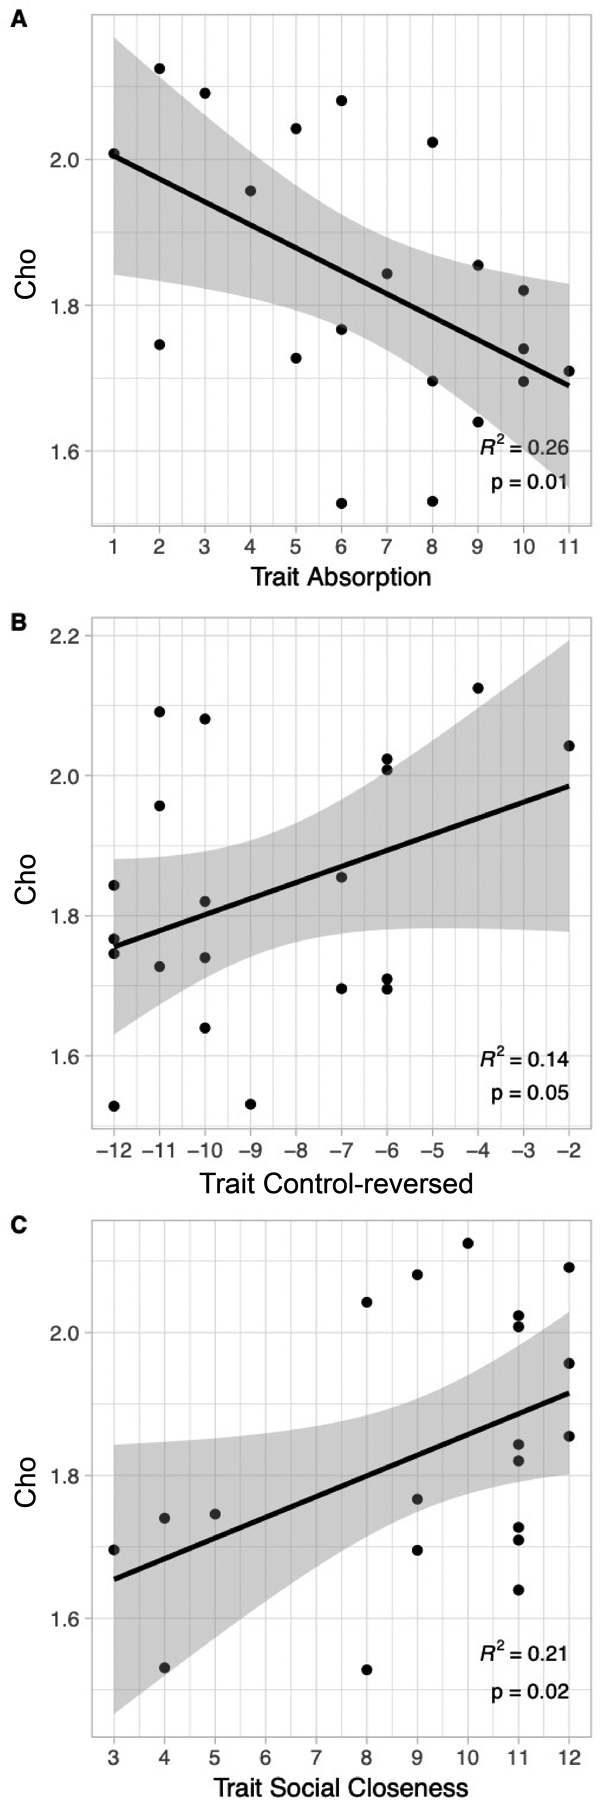
(A) Cho in the dACC is strongly negatively related to scores on trait Absorption, r = −0.51, unadjusted p = .01, R2 = 0.26. (B) Cho in the dACC is positively related to scores on trait Control-reversed, r = + 0.37, unadjusted p = .05, R2 = 0.14. (C) Cho in the dACC is also positively related to trait scores on trait Social Closeness, r = + 0.46, unadjusted p = .02, R2 = 0.21.Cho = choline containing compounds, corrected for partial volume effects. The findings did not survive correction using the Holm-Bonferroni sequential method (Holm adjusted p = .0723, 0.2703, and 0.2611 respectively; family-wise α = 0.05), and thus are considered preliminary. The findings indicate a medium sized relationship between dACC Cho and multiple domains of emotion in healthy adults.dACC = dorsal anterior cingulate; voxel size was 15 × 15 × 10 mm (10 mm in SI direction; see Methods for details).Personality was evaluated using the Multidimensional Personality Questionnaire Brief Form (MPQ-BF). Grey shading is 95% confidence interval. N = 20 participants with 1 H MRS data meeting quality control criteria; see Methods for details.
3.2.4. tCr, Ins and trait emotion
tCr and Ins in the dACC were not associated with any trait measure (agency and flexibility: all r < |.36|, all unadjusted p >.06, n.s.; discriminant measures: all r < |.35|, all unadjusted p >.06, n.s.; Holm adjusted p-values > 0.4388, family-wise α = 0.05).
3.3. Principal component analysis
The exploratory PCA analysis assessed the overall structure of emotion and 1H-MRS metabolites. Findings indicated that neurometabolites and emotion aggregated into three orthogonal components (Table 4). Component 1 involved high and specific loadings from tNAA, MPQ-BF Absorption, and MPQ-BF Aggression (0.87, 0.80, −0.71), and a moderate loading from MPQ-BF Social Potency (0.39). This factor appears to represent a novel endogenous neural infrastructure which we term neuroaffective reserves. Measures loading on this factor reflect differences in emotional fluidity and dynamic range of emotion (Absorption), positive agency (Social Potency) and the resilience to negative agency (low Aggression). Component 2 involved high factor loadings from MPQ-BF Control-reversed, Glx and Cho (0.88, 0.74, and 0.62, respectively), and a moderate loading from MPQ-BF Social Potency (0.45). This factor represents a dimension of behavioral engagement, as these measures reflect differences in the breadth, frequency and variety of approach behavior (Table 4). Component 3 involved high loadings from MPQ-BF Social Closeness, MPQ-BF Social Potency and Cho (0.94, 0.50, and 0.48, respectively). This factor represents a dimension of affiliation, as these measures reflect differences in the extent, frequency and depth of social relationships and interactions (Table 4). The three-factor solution explained 72.7% of the variance in 1H-MRS metabolites and trait emotion, with 30.7% of the variance explained by Component 1, 28.4% of the variance explained by Component 2, and 13.6% of the variance explained by Component 3.Metabolite-emotion relationships thus coalesced into three orthogonal, underlying dimensions of (1) tNAA-related neuroaffective reserves, (2) Glx-related behavioral engagement, and (3) Cho-related affiliative bonding.
Table 4.
Principal component analysis.
| Neuroaffective Reserves | Behavioral Engagement | Affiliation | |
|---|---|---|---|
| Metabolites | |||
| tNAA | .87 | −0.07 | .34 |
| Glx | −0.04 | .74 | .24 |
| Cho | −0.46 | .62 | .48 |
| Trait Measures | |||
| Absorption | .80 | −0.13 | −0.18 |
| Aggression | −0.71 | −0.19 | .02 |
| Control-reversed | .11 | .88 | −0.11 |
| Social Potency | .39 | .45 | .50 |
| Social Closeness | −0.02 | .06 | .94 |
Factor loadings for the principal component analysis of resting metabolites in the dACC voxel and trait emotion in healthy volunteers, N = 20, see Methods for data quality and exclusions. PCA analysis was restricted to measures that were significant in the primary analyses. Factor loadings above 0.35 are indicated in bold . All metabolites are partial volume corrected. tNAA = total N-acetyl-aspartate and N-acetylaspartyl-glutamic acid. Glx = Glx complex. Cho = choline-containing compounds. Emotion was assessed using the Multidimensional Personality Questionnaire Brief Form (MPQ-BF). Measures of Agency: Social Potency, a measure of agentic positive emotion. Aggression, a measure of agentic negative emotion. Measures of Flexibility: Absorption, a measure of emotional range and capacity for emotional engagement across a wide range of internal and external stimuli. Control-reversed, a measure of the preference for spontaneous over planned activities. Discriminant Measure: Social Closeness, a measure of affiliation and social warmth, which is distinct from Social Potency. Three components with eigenvalues greater than 1.0 were extracted and a varimax rotation was applied. The three-factor solution explained 72.7% of the variance in neurometabolites and emotion.
4. Discussion
There are three sets of 1H-MRS findings. First the level of tNAA in the dACC is indicative of a novel, underlying dimension of neuroaffective reserves, which involves emotional fluidity, positive agency and resilience to negative agency. The tNAA effects are large in size, survive correction for multiple comparisons, and represent the largest and most robust relationships identified in the present sample. Two additional, modest effects were considered preliminary, as they were significant at an uncorrected p-value of 0.05, but did not survive the correction for multiple comparisons. These effects included the modest positive relationship of Glx and behavioral engagement, which involves positive agency and behavioral flexibility, and the modest positive relationship of Cho and affiliation, which involves positive agency and social warmth. Our findings provide the first evidence in healthy humans that N-acetylated compounds (NAA, NAAG), glutamatergic compounds (Glx) and cholinergic compounds (Cho) in the dACC relate to natural traits of agency and flexibility. Below we discuss candidate mechanisms and brain-behavior relationships involved in each phenotype.
4.1. tNAA-related neuroaffective reserves
4.1.1. Phenomenology
Our primary findings indicate that in healthy individuals tNAA reflects a supple, agile emotional system capable of responding creatively to a wide range of stimuli. The magnitude of tNAA effects were large in size (Fig. 2, Tables 3 and 4) and on par with the largest results with tNAA in cognitive neuroscience, which range from 0.01 to approximately 0.6 in healthy volunteers (Patel et al., 2014). The concentration of tNAA was unrelated to all other metabolites evaluated, indicating that tNAA provides unique information about neural structure and function relevant to emotional health. These tNAA-emotion relationships may reflect shared underlying processes of creativity, divergent thinking and capacity for mental-emotional engagement. For example, immersive emotional responses require sustained and intensive engagement with low-intensity emotionally-relevant cues, in contrast with perceptual filtering, which occurs early in the processing stream and circumvents attentional and emotional capture. Similarly, resilience to negative agency requires creative and sustained engagement with aversive negative stimuli in order to achieve conflict resolution. This response is in contrast with reflexive aggression, which is a rapid reaction that disregards negative outcomes. Positive agency in turn requires creative, sustained engagement with positive stimuli, in contrast with apathy and disengagement. This phenomenological overlap likely contributes to the aggregation of qualities observed within tNAA-related neuroaffective reserves (Table 4).
4.1.2. Supporting processes
Creative, prolonged engagement with low-intensity cues likely requires the sustained coordination of activity across multiple networks combined with a low threshold for perception, experience and action. These processes may contribute differently to tNAA-related neuroaffective reserves. For instance, high tNAA in the dACC may enable a greater sensitivity to low-intensity cues, a lower threshold for generation of responses, a greater capacity for integration and synthesis of new information, and/or a greater temporal resonance of internally-generated states. Such processes would facilitate both immersive emotion and positive agentic engagement with subtle, low-intensity cues. High tNAA may confer capacity for emotional problem-solving, a more robust reservoir of respect for self and others, and/or an improved ability to identify creative solutions to interpersonal issues. These processes would minimize the likelihood of engaging in confrontations that are exploitive, demeaning or violate personal boundaries, facilitating low aggression. tNAA may also facilitate the capacity to detect and respond to incentive cues with positive affect and volitional action, supporting positive agency and resilience to negative agency.
4.1.3. Neural mechanisms of neuroaffective reserves
Based on the literature and the present results, we propose a working model of the neural infrastructure underlying neuroaffective reserves in healthy individuals (Fig. 5). These reserves could involve at least three sets of neural mechanisms: (1) NAA contributions to functional activity, which facilitates the capacity to respond to low-intensity cues; (2) NAAG modulation of monoamines, ACh and GABA, which facilitates low thresholds for perception, experience and action; and (3) NAAG potentiation of local glucose availability, which improves the continuity and depth of recurrent neural processing. Evidence for each mechanism is discussed in turn.
Fig. 5.
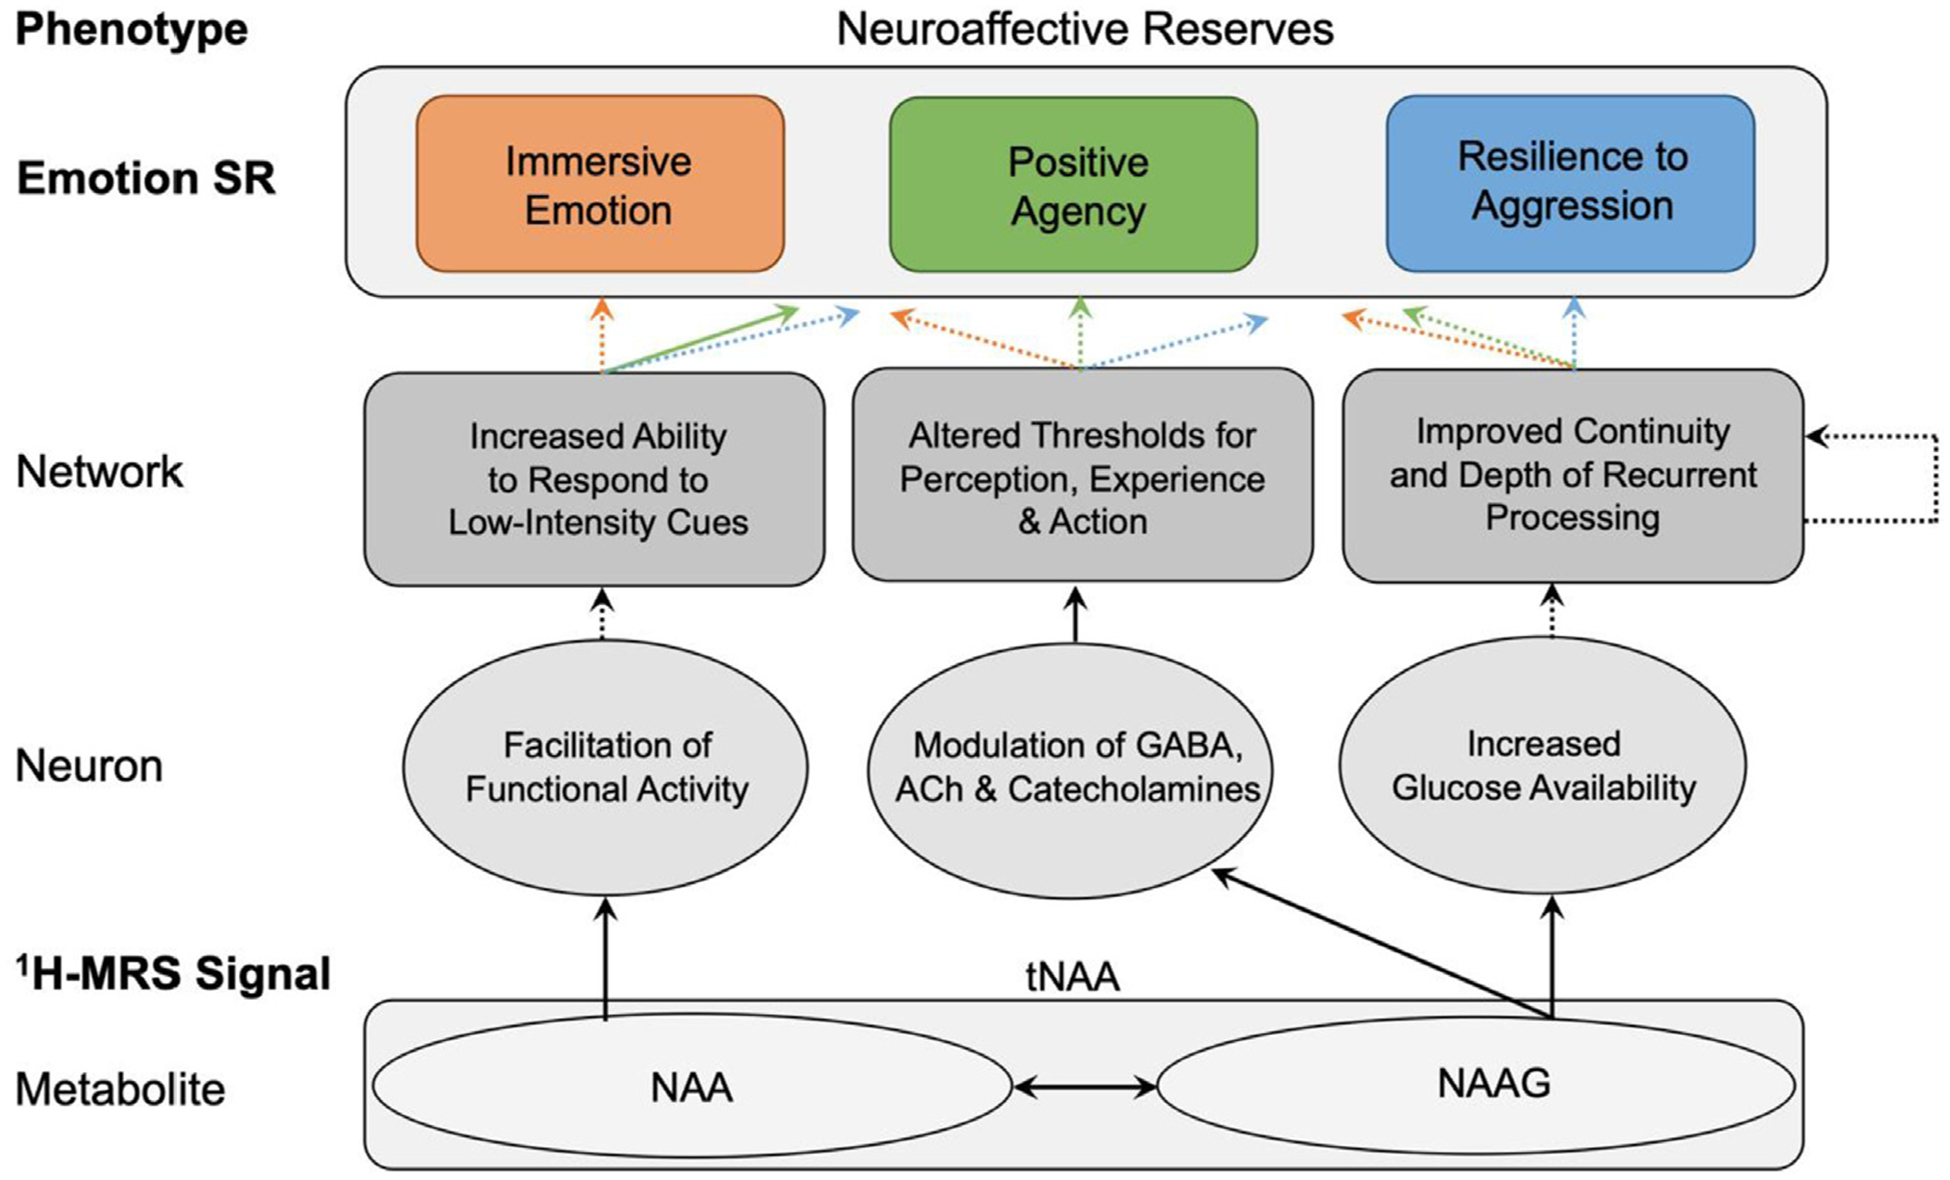
A Working Model of tNAA-related Neuroaffective Reserves in Healthy Adults Level of analysis is indicated by labels on the left. Items in bold were evaluated empirically in the study using 1H-MRS, self-reports (SR) of emotion, and PCA analysis. Ovals indicate processes at the cellular level. Rhomboids indicate processes at the network level. Solid arrows indicate relationships with substantial evidentiary basis in the literature. Dashed arrows indicate hypothesized relationships.
(1)NAA facilitates functional capacity and activity through its close relationship with mitochondrial energy metabolism (Baslow et al., 2007; Clark, 1998).NAA also changes dynamically with neurostimulation, while sedative drugs reduce tNAA, Glx, and Cho (Baslow et al., 2016; Castellano et al., 2012; Gomez et al., 2012; Landim et al., 2016; Zhang et al., 2009). In this view tNAA-related facilitation of functional activity would increase one’s responsiveness to low-intensity cues, thereby facilitating immersive emotion and positive agency (Fig. 5).
(2)NAAG modulates monoamines, GABA and acetylcholine (Baslow, 2003, 2010; Malomouzh et al., 2005; Moffett et al., 2007). In our model, NAAG, the second component of tNAA, shapes emotion through its modulation of monoamines, GABA and acetylcholine. The relationship of these neuromodulators, peptides and neurotransmitters to emotion are well-established. Dopamine contributes to agentic extraversion, serotonin contributes to behavioral control, norepinephrine contributes to negative affective traits, GABA contributes to behavioral impulsivity, and acetylcholine shapes emotional learning (Boy et al., 2011; Coccaro et al., 2015; Depue and Collins, 1999; Ende, 2015; Likhtik and Johansen, 2019; White and Depue, 1999). These compounds also affect thresholds for perception, experience, learning and action (Depue and White, 2015). This pathway is thus positioned to directly affect the capacity for immersive emotion, positive agency and resilience to aggression in healthy adults (Fig. 5).
(3)NAAG impacts glucose delivery to active neurons. This effect is immediate, local, highly scalable and reflects an mGluR3 agonist effect in active neurons and surrounding astrocytes (Baslow et al., 2005). Targeted glucose delivery to active neurons supports the temporal capacity for neural activation (Baslow et al., 2005). In recursive neural networks a given neuron can receive input from any other neuron within the network, with both current input and the ongoing state of the network shaping overall network activity (Barak, 2017). This property allows activity to be propagated in cycles of continuous stimulation, providing a neural mechanism for phenomena such as empathy that unfold over time (Barak, 2017; Decety, 2011; Kriegeskorte and Golan, 2019). Targeted glucose delivery to active neurons should support the duration, efficiency and extent of recurrent neural processing, thereby facilitating the continuity, depth and complexity of emotional responses (Fig. 5).
4.1.4. Clinical implications
The tNAA phenotypes described here may have utility in understanding and intervening in bipolar mania, depression, OCD, PTSD, HIV, diabetes, obesity, neurodegenerative disease, stroke and Alzheimer’s disease (Clark, 1998; Croarkin et al., 2015; Glodzik-Sobanska et al., 2005; Jang et al., 2006; Michael et al., 2003). In these conditions acute or chronic alterations in tNAA coincide with clinically relevant changes in agency and flexibility during disease progression, recovery and treatment. Phenotypes identified here may have particular relevance in the prodromal phase, where diagnoses are most challenging, and interventions are likely to have maximal impact.
4.2. Additional metabolite-emotion relationships
Our findings identify several potential phenotypes for Glx and Cho. These findings were less robust than findings with tNAA, are significant at an uncorrected p-value of 0.05 (N = 20) and provide information on directionality of modest effects to guide future progress.
4.2.1. Preliminary association of Glx with behavioral engagement
Glx concentrations increased modestly with higher ratings of behavioral flexibility (MPQ-BF Control-reversed) and behavioral engagement (PCA Factor 2). This association is consistent with prior work indicating a positive association of impulsivity, extraversion and behavioral activation (Quilty et al., 2014). The evidence that Glu rises with impulsivity has recently been reviewed and confirmed in a comprehensive meta-analysis (Ende, 2015). Our data provide further evidence that Glx may relate to positive agency and behavioral approach. The present Glx findings are consistent with more widely established dopaminergic mechanisms that shape mood, behavior and incentive motivation. For instance, agentic extraversion predicts the behavioral, neuroendocrine, and mood responses to psychostimulant drugs that affect dopamine (Depue and Collins, 1999; Depue and Fu, 2013; Depue et al., 1994; Depue and White, 2015; Morrone et al., 2000; White, 2017; White et al., 2007, 2006). Dopamine agonists increase Glx synthesis, reduce catabolism and increase Glx in the dACC (Sherman and Mott, 1985; White et al., 2018). In contrast, sedative drugs acutely reduce levels of Glx and Glu (Zhang et al., 2009). Dopaminergic facilitation of Glx may thus contribute to the positive relationship observed here with Glx and behavioral engagement.
4.2.2. Preliminary association of Cho with affiliation
Cho levels were modestly related to multiple aspects of trait emotion (behavioral flexibility, social warmth, emotional fluidity and positive agency, r = |.37| to |.51|; Table 3) that aggregated as a dimension of affiliation (Table 4). The positive loadings of Cho on affiliation, behavioral flexibility, and positive agency (PCA Components 2 and 3) are consistent with the positive association of Cho with emotional intelligence (Timoshanko et al., 2014). Affiliation may relate to in vivo characteristics for which Cho provides a stable marker, such as membrane integrity, and/or other biochemical compounds for which Cho is a precursor, such as acetylcholine (Jung et al., 1999a; Rae, 2014). The negative loading of Cho on tNAA-related emotional fluidity (PCA Component 1) is consistent with the inhibition of tonic acetylcholine release by NAAG, the inverse relationship of Cho with flexibility during learning, and the facilitation of aversive emotional learning by acetylcholine (Bell et al., 2018; Likhtik and Johansen, 2019; Malomouzh et al., 2005). In clinical studies Cho is often interpreted as a marker of membrane health and is decreased in neuroinflammatory conditions, such as HIV (Cohen et al., 2010; Harezlak et al., 2011). The present findings suggest Cho may serve as a marker for high quality social support in healthy individuals, with functional consequences modulated by tNAA during active learning.
4.3. Brain markers, mechanisms and individual differences
Brain markers of emotion reside at the intersection of biological mechanisms, natural variation and observable phenotypes. Our findings speak to all three points and indicate that: (a) naturally occurring between-person variation in dACC tNAA in healthy adults is biologically meaningful; (b) this variation in tNAA is substantively related to individual differences in trait emotion; and (c) tNAA is involved temporally or causally with the basic functions of agency and flexibility in well individuals. Our findings also bring into relief a larger conceptual issue concerning brain markers. Formally, metabolite levels require a sufficient range of variation to serve as a brain marker of health-related outcomes. Relevant outcomes must in turn be observable, measurable and have a sufficient range of variation in the population of interest. Thus, a given metabolite may play an essential role in the healthy human brain yet would provide a poor marker of wellness in the absence of these criteria. Natural differences in tNAA in the dACC observed here overcome these issues and may provide a meaningful marker of wellness in young adults. Preliminary data indicate Glx and Cho may have additional promise.
4.4. Relationships amongst metabolites
Relationships among metabolites in the dACC were instructive. tNAA was unrelated to all other metabolites (all r < |.24|, all p >.05, n.s.), highlighting the potentially unique role of tNAA in emotional health. In contrast Glx, Cho, tCr and Ins were moderately to strongly interrelated (r’s from 0.48 to 0.76, all p <.05). This interdependence may reflect estimation of metabolites from a single common spectrum. Alternately, interdependence may reflect one or more biological processes affecting Glx, Cho, tCr and Ins at rest. These relationships and their biological interdependencies represent an important avenue for future neurometabolic work in healthy and clinical samples.
4.5. Strengths, limitations and future work
Strengths of the study include evaluation of 1H-MRS neurometabolites in a racially and ethnically diverse sample of young adults. Participants were medically and psychiatrically healthy and free of drugs and alcohol as determined by medical exam, clinical interview and drug and alcohol testing. Participant responses were similar to national norms, with good representation of the middle of the distribution of scores on each trait. Agency and flexibility were evaluated in each participant using separate measures. Valenced emotion was assessed to provide information on specificity and discriminant validity. The emotion measures used have a known genetic component (heritability estimates h2 of 0.44 to 0.54) and low to near-zero correlations with fluid and crystallized cognition (Ackerman and Heggestad, 1997; Tellegen et al., 1988).Our analytic strategy is consistent with rigorous procedures to ensure MRS data quality. There were also several limitations. As 1H-MRS was conducted solely in the dACC, the study does not provide information on other brain regions. Future studies using a longitudinal design will inform directionality, particularly in youth in whom these systems are still developing (Silveri et al., 2013). Techniques such as MEGA-PRESS and field strengths such as 7 T that discriminate Glu, Gln, NAA and NAAG are warranted (Wijtenburg et al., 2013). The interrelationship of Glx, Cho, tCr and Ins within the dACC may reflect biological processes. 1H-MRS investigation of FDA-approved catecholamine, GABA and mGluR3 agonists alongside the concurrent assessment of emotion can provide important information on mechanisms.
5. Conclusions
In summary, three of the most abundant neurometabolites in the human brain - tNAA, Glx, and Cho - relate to basic traits of agency and flexibility in healthy young adults. tNAA relates strongly to an endogenous phenotype of neuroaffective reserves, which reflects the separate capabilities of flexible and immersive emotional experience, positive agency and resilience to negative agency. This newly identified phenotype may reflect an intrinsic neural infrastructure supporting emotional health. Additional preliminary phenotypes included Glx-related behavioral approach and Cho-related affiliation. Neurometabolites in the dACC are thus moderately to substantially related to natural emotion in healthy adults, representing signal rather than noise in this population. Our findings indicate that tNAA should be interpreted in a fashion that goes beyond its typical description as a marker of neuronal integrity to reflect its more fundamental role in neurons, networks and emotional phenotypes. We conclude that tNAA, Glx and Cho in the dACC relate to fundamental aspects of agency, flexibility and neuroaffective resources in healthy young adults.
Supplementary Material
Acknowledgments
We thank Lynn Fanella, Erica Nixon and Marilena DeMayo of the Brown University Magnetic Resonance Facility for technical assistance, Timothy Souza for assistance with data processing, and Chelsea Boyd, Mikalei Gordon, Selen Senocak, and Nikitha Gangasani for assistance in 1H-MRS data collection, and Dr. Jason Machan of the Center for Advance Clinical and Translational Research (Advance-CTR) for statistical consultation and guidance. Graphical abstract 3-D structure images for N-acetylaspartic acid (NAA, CID 65065) from PubChem, https://pubchem.ncbi.nlm.nih.gov/compound/65065#section=Structures. Glass brain was created in SPM CONN Toolbox v.19.c (www.nitrc.org/projects/conn, RRID:SCR_009550). The authors are entirely responsible for the scientific content of the paper.
Funding and disclosure
This work was supported by the National Institute of Health Grant DA029189 (TLW); Carney Institute for Brain Science Innovation Award (TLW); Hanlon Foundation (TLW); National Science Foundation Graduate Research Fellowship DGE1058262 (AZN); National Institute of Health Training Grant AA007459 and career award K23-AA024704 (MM); National Institute of General Medical Sciences, National Institutes of Health (P20GM103645); Institute on Alcohol Abuse and Alcoholism career award K01-AA025306 (ECP); National Institute of Health career award K01-AG050707 (AJW); the National Center for Advancing Translational Sciences of the National Institutes of Health under University of Florida Clinical and Translational Science Awards KL2TR001429 and UL1TR001427. Part of this research was conducted using computational resources and services at the Center for Computation and Visualization, Brown University, NIH grant S10 OD016366.Statistical consultation was supported by Institutional Development Award Number U54GM115677 from the National Institute of General Medical Sciences of the National Institutes of Health, which funds Advance Clinical and Translational Research (Advance-CTR). The views expressed in this article are those of the authors and do not necessarily reflect the position or policy of the Department of Veterans Affairs, United States government, National Institute of Health or National Science Foundation. The authors declare no conflict of interest.
Abbreviations:
- H-MRS
Proton magnetic resonance spectroscopy
- Glu
glutamate
- Gln
glutamine
- Glx
pooled Glu and Gln
- tNAA
total N-acetylaspartate and N-acetylaspartylglutamate
- Cho
choline-containing compounds (glycerophosphocholine and phosphocholine)
- dACC
dorsal anterior cingulate cortex
Footnotes
Supplementary materials
Supplementary material associated with this article can be found, in the online version, at doi: 10.1016/j.neuroimage.2020.117509.
References
- Ackerman PL, Heggestad ED, 1997. Intelligence, personality, and interests: evidence for overlapping traits. Psychol. Bull 121, 219–245. [DOI] [PubMed] [Google Scholar]
- Aickin M, Gensler H, 1996. Adjusting for multiple testing when reporting research results: the Bonferroni vs Holm methods. Am. J. Public Health 86, 726–728. [DOI] [PMC free article] [PubMed] [Google Scholar]
- Amrhein V, Greenland S, McShane B, 2019. Retire statistical significance. Nature 567, 305–307. [DOI] [PubMed] [Google Scholar]
- Ashburner J, Friston KJ, 2005. Unified segmentation. Neuroimage 26, 839–851. [DOI] [PubMed] [Google Scholar]
- Baker EH, Basso G, Barker PB, Smith MA, Bonekamp D, Horska A, 2008. Regional apparent metabolite concentrations in young adult brain measured by (1)H MR spectroscopy at 3 Tesla. J. Magn. Reson. Imaging 27, 489–499. [DOI] [PMC free article] [PubMed] [Google Scholar]
- Barak O, 2017. Recurrent neural networks as versatile tools of neuroscience research. Curr. Opin. Neurobiol 46, 1–6. [DOI] [PubMed] [Google Scholar]
- Barrett LF, Satpute AB, 2013. Large-scale brain networks in affective and social neuroscience: towards an integrative functional architecture of the brain. Curr. Opin. Neurobiol 23, 361–372. [DOI] [PMC free article] [PubMed] [Google Scholar]
- Baslow MH, 2003. N-acetylaspartate in the vertebrate brain: metabolism and function. Neurochem. Res 28, 941–953. [DOI] [PubMed] [Google Scholar]
- Baslow MH, 2010. Evidence that the tri-cellular metabolism of N-acetylaspartate functions as the brain’s “operating system”: how NAA metabolism supports meaningful intercellular frequency-encoded communications. Amino Acids 39, 1139–1145. [DOI] [PubMed] [Google Scholar]
- Baslow MH, Cain CK, Sears R, Wilson DA, Bachman A, Gerum S, Guilfoyle DN, 2016. Stimulation-induced transient changes in neuronal activity, blood flow and N-acetylaspartate content in rat prefrontal cortex: a chemogenetic fMRS-BOLD study. NMR Biomed. 29, 1678–1687. [DOI] [PMC free article] [PubMed] [Google Scholar]
- Baslow MH, Dyakin VV, Nowak KL, Hungund BL, Guilfoyle DN, 2005. 2-PMPA, a NAAG peptidase inhibitor, attenuates magnetic resonance BOLD signals in brain of anesthetized mice: evidence of a link between neuron NAAG release and hyperemia. J. Mol. Neurosci 26, 1–15. [DOI] [PubMed] [Google Scholar]
- Baslow MH, Hrabe J, Guilfoyle DN, 2007. Dynamic relationship between neurostimulation and N-acetylaspartate metabolism in the human visual cortex: evidence that NAA functions as a molecular water pump during visual stimulation. J. Mol. Neurosci 32, 235–245. [DOI] [PubMed] [Google Scholar]
- Basoglu C, Semiz U, Oner O, Gunay H, Ebrinc S, Cetin M, Sildiroglu O, Algul A, Ates A, Sonmez G, 2008. A magnetic resonance spectroscopy study of antisocial behaviour disorder, psychopathy and violent crime among military conscripts. Acta Neuropsychiatr. 20, 72–77. [DOI] [PubMed] [Google Scholar]
- Bell T, Lindner M, Mullins PG, Christakou A, 2018. Functional neurochemical imaging of the human striatal cholinergic system during reversal learning. Eur. J. Neurosci 47, 1184–1193. [DOI] [PubMed] [Google Scholar]
- Birur B, Kraguljac NV, Shelton RC, Lahti AC, 2017. Brain structure, function, and neurochemistry in schizophrenia and bipolar disorder-a systematic review of the magnetic resonance neuroimaging literature. NPJ Schizophr. 3, 15. [DOI] [PMC free article] [PubMed] [Google Scholar]
- Boy F, Evans CJ, Edden RA, Lawrence AD, Singh KD, Husain M, Sumner P, 2011. Dorsolateral prefrontal gamma-aminobutyric acid in men predicts individual differences in rash impulsivity. Biol. Psychiatry 70, 866–872. [DOI] [PMC free article] [PubMed] [Google Scholar]
- Brandt AS, Unschuld PG, Pradhan S, Lim IA, Churchill G, Harris AD, Hua J, Barker PB, Ross CA, van Zijl PC, Edden RA, Margolis RL, 2016. Age-related changes in anterior cingulate cortex glutamate in schizophrenia: a (1)H MRS Study at 7 Tesla. Schizophr. Res 172, 101–105. [DOI] [PMC free article] [PubMed] [Google Scholar]
- Cao B, Zhu J, Zuckerman H, Rosenblat JD, Brietzke E, Pan Z, Subramanieapillai M, Park C, Lee Y, McIntyre RS, 2019. Pharmacological interventions targeting anhedonia in patients with major depressive disorder: a systematic review. Prog. Neuropsychopharmacol. Biol. Psychiatry 92, 109–117. [DOI] [PubMed] [Google Scholar]
- Castellano G, Dias CS, Foerster B, Li LM, Covolan RJ, 2012. NAA and NAAG variation in neuronal activation during visual stimulation. Braz. J. Med. Biol. Res 45, 1031–1036. [DOI] [PMC free article] [PubMed] [Google Scholar]
- Chang K, Adleman N, Dienes K, Barnea-Goraly N, Reiss A, Ketter T, 2003. Decreased N-acetylaspartate in children with familial bipolar disorder. Biol. Psychiatry 53, 1059–1065. [DOI] [PubMed] [Google Scholar]
- Clark JB, 1998. N-acetyl aspartate: a marker for neuronal loss or mitochondrial dysfunction. Dev. Neurosci 20, 271–276. [DOI] [PubMed] [Google Scholar]
- Coccaro EF, Fanning JR, Phan KL, Lee R, 2015. Serotonin and impulsive aggression. CNS Spectr. 20, 295–302. [DOI] [PubMed] [Google Scholar]
- Cohen J, 1988. Statistical Power Analysis for the Behavioral Sciences. Lawrence Erlbaum Associates Inc, New Jersey. [Google Scholar]
- Cohen J, 1992. A power primer. Psychol. Bull 112, 155–159. [DOI] [PubMed] [Google Scholar]
- Cohen RA, Harezlak J, Gongvatana A, Buchthal S, Schifitto G, Clark U, Paul R, Taylor M, Thompson P, Tate D, Alger J, Brown M, Zhong J, Campbell T, Singer E, Daar E, McMahon D, Tso Y, Yiannoutsos CT, Navia B, Consortium HIVN, 2010. Cerebral metabolite abnormalities in human immunodeficiency virus are associated with cortical and subcortical volumes. J. Neurovirol 16, 435–444. [DOI] [PMC free article] [PubMed] [Google Scholar]
- Colic L, Demenescu LR, Li M, Kaufmann J, Krause AL, Metzger C, Walter M, 2016. Metabolic mapping reveals sex-dependent involvement of default mode and salience network in alexithymia. Soc. Cognit. Affect. Neurosci 11, 289–298. [DOI] [PMC free article] [PubMed] [Google Scholar]
- Critchley HD, Simmons A, Daly EM, Russell A, van Amelsvoort T, Robertson DM, Glover A, Murphy DG, 2000. Prefrontal and medial temporal correlates of repetitive violence to self and others. Biol. Psychiatry 47, 928–934. [DOI] [PubMed] [Google Scholar]
- Croarkin PE, Thomas MA, Port JD, Baruth JM, Choi DS, Abulseoud OA, Frye MA, 2015. N-acetylaspartate normalization in bipolar depression after lamotrigine treatment. Bipolar Disord. 17, 450–457. [DOI] [PMC free article] [PubMed] [Google Scholar]
- Decety J, 2011. The neuroevolution of empathy. Ann. N.Y. Acad. Sci 1231, 35–45. [DOI] [PubMed] [Google Scholar]
- Dellu-Hagedorn F, Rivalan M, Fitoussi A, De Deurwaerdere P, 2018. Inter-individual differences in the impulsive/compulsive dimension: deciphering related dopaminergic and serotonergic metabolisms at rest. Philos. Trans. R. Soc. Lond. B Biol. Sci 373. [DOI] [PMC free article] [PubMed] [Google Scholar]
- Depue RA, Collins PF, 1999. Neurobiology of the structure of personality: dopamine, facilitation of incentive motivation, and extraversion. Behav. Brain Sci 22, 491–517 discussion 518–469. [DOI] [PubMed] [Google Scholar]
- Depue RA, Fu Y, 2013. On the nature of extraversion: variation in conditioned contextual activation of dopamine-facilitated affective, cognitive, and motor processes. Front. Hum. Neurosci 7, 288. [DOI] [PMC free article] [PubMed] [Google Scholar]
- Depue RA, Luciana M, Arbisi P, Collins P, Leon A, 1994. Dopamine and the structure of personality: relation of agonist-induced dopamine activity to positive emotionality. J. Pers. Soc. Psychol 67, 485–498. [DOI] [PubMed] [Google Scholar]
- Depue RA, White TL, 2015. Personality: neurobehavioral foundation and pharmacological protocols. In: Stolerman IP, Price LH (Eds.), Encyclopedia of Psychopharmacology. Springer, Heidelberg, pp. 1258–1266. [Google Scholar]
- Dong XX, Wang Y, Qin ZH, 2009. Molecular mechanisms of excitotoxicity and their relevance to pathogenesis of neurodegenerative diseases. Acta Pharmacol. Sin 30, 379–387. [DOI] [PMC free article] [PubMed] [Google Scholar]
- Edden RA, Puts NA, Harris AD, Barker PB, Evans CJ, 2014. Gannet: a batch-processing tool for the quantitative analysis of gamma-aminobutyric acid-edited MR spectroscopy spectra. J. Magn. Reson. Imaging 40, 1445–1452. [DOI] [PMC free article] [PubMed] [Google Scholar]
- Ende G, 2015. Proton magnetic resonance spectroscopy: relevance of Glutamate and GABA to Neuropsychology. Neuropsychol. Rev 25, 315–325. [DOI] [PubMed] [Google Scholar]
- Ende G, Walter S, Welzel H, Demirakca T, Wokrina T, Ruf M, Ulrich M, Diehl A, Henn FA, Mann K, 2006. Alcohol consumption significantly influences the MR signal of frontal choline-containing compounds. Neuroimage 32, 740–746. [DOI] [PubMed] [Google Scholar]
- Ernst T, Chang L, 2008. Adaptation of brain glutamate plus glutamine during abstinence from chronic methamphetamine use. J. Neuroimmune Pharmacol 3, 165–172. [DOI] [PMC free article] [PubMed] [Google Scholar]
- Ernst T, Chang L, Leonido-Yee M, Speck O, 2000. Evidence for long-term neurotoxicity associated with methamphetamine abuse: a 1H MRS study. Neurology 54, 1344–1349. [DOI] [PubMed] [Google Scholar]
- Ethofer T, Mader I, Seeger U, Helms G, Erb M, Grodd W, Ludolph A, Klose U, 2003. Comparison of longitudinal metabolite relaxation times in different regions of the human brain at 1.5 and 3 Tesla. Magn. Reson. Med 50, 1296–1301. [DOI] [PubMed] [Google Scholar]
- Faul F, Erdfelder E, Buchner A, Lang AG, 2009. Statistical power analyses using G*Power 3.1: tests for correlation and regression analyses. Behav. Res. Methods 41, 1149–1160. [DOI] [PubMed] [Google Scholar]
- Fonnum F, 1984. Glutamate: a neurotransmitter in mammalian brain. J. Neurochem 42, 1–11. [DOI] [PubMed] [Google Scholar]
- Gallinat J, Kunz D, Lang UE, Neu P, Kassim N, Kienast T, Seifert F, Schubert F, Bajbouj M, 2007. Association between cerebral glutamate and human behaviour: the sensation seeking personality trait. Neuroimage 34, 671–678. [DOI] [PubMed] [Google Scholar]
- Geurts JJ, Barkhof F, Castelijns JA, Uitdehaag BM, Polman CH, Pouwels PJ, 2004. Quantitative 1H-MRS of healthy human cortex, hippocampus, and thalamus: metabolite concentrations, quantification precision, and reproducibility. J. Magn. Reson. Imaging 20, 366–371. [DOI] [PubMed] [Google Scholar]
- Glodzik-Sobanska L, Slowik A, Kieltyka A, Kozub J, Sobiecka B, Urbanik A, Szczudlik A, 2005. Reduced prefrontal N-acetylaspartate in stroke patients with apathy. J. Neurol. Sci 238, 19–24. [DOI] [PubMed] [Google Scholar]
- Gomez R, Behar KL, Watzl J, Weinzimer SA, Gulanski B, Sanacora G, Koretski J, Guidone E, Jiang L, Petrakis IL, Pittman B, Krystal JH, Mason GF, 2012. Intravenous ethanol infusion decreases human cortical gamma-aminobutyric acid and N-acetylaspartate as measured with proton magnetic resonance spectroscopy at 4 tesla. Biol. Psychiatry 71, 239–246. [DOI] [PMC free article] [PubMed] [Google Scholar]
- Grachev ID, Apkarian AV, 2000. Anxiety in healthy humans is associated with orbital frontal chemistry. Mol. Psychiatry 5, 482–488. [DOI] [PubMed] [Google Scholar]
- Grayson DS, Ray S, Carpenter S, Iyer S, Dias TG, Stevens C, Nigg JT, Fair DA, 2014. Structural and functional rich club organization of the brain in children and adults. PLoS One 9, e88297. [DOI] [PMC free article] [PubMed] [Google Scholar]
- Grimm S, Schubert F, Jaedke M, Gallinat J, Bajbouj M, 2012. Prefrontal cortex glutamate and extraversion. Soc. Cognit. Affect. Neurosci 7, 811–818. [DOI] [PMC free article] [PubMed] [Google Scholar]
- Grodin EN, White TL, 2015. The neuroanatomical delineation of agentic and affiliative extraversion. Cognit. Affect. Behav. Neurosci 15, 321–334. [DOI] [PMC free article] [PubMed] [Google Scholar]
- Haga KK, Khor YP, Farrall A, Wardlaw JM, 2009. A systematic review of brain metabolite changes, measured with 1H magnetic resonance spectroscopy, in healthy aging. Neurobiol. Aging 30, 353–363. [DOI] [PubMed] [Google Scholar]
- Harezlak J, Buchthal S, Taylor M, Schifitto G, Zhong J, Daar E, Alger J, Singer E, Campbell T, Yiannoutsos C, Cohen R, Navia B, Consortium HIVN, 2011. Persistence of HIV-associated cognitive impairment, inflammation, and neuronal injury in era of highly active antiretroviral treatment. AIDS 25, 625–633. [DOI] [PMC free article] [PubMed] [Google Scholar]
- Harris AD, Puts NA, Edden RA, 2015. Tissue correction for GABA-edited MRS: considerations of voxel composition, tissue segmentation, and tissue relaxations. J. Magn. Reson. Imaging 42, 1431–1440. [DOI] [PMC free article] [PubMed] [Google Scholar]
- Haselhorst R, Dursteler-MacFarland KM, Scheffler K, Ladewig D, Muller-Spahn F, Stohler R, Seelig J, Seifritz E, 2002. Frontocortical N-acetylaspartate reduction associated with long-term IV heroin use. Neurology 58, 305–307. [DOI] [PubMed] [Google Scholar]
- Hoerst M, Weber-Fahr W, Tunc-Skarka N, Ruf M, Bohus M, Schmahl C, Ende G, 2010. Correlation of glutamate levels in the anterior cingulate cortex with self-reported impulsivity in patients with borderline personality disorder and healthy controls. Arch. Gen. Psychiatry 67, 946–954. [DOI] [PubMed] [Google Scholar]
- Holm S, 1979. A simple sequentially rejective multiple test procedure. Scand. J. Stat 6, 65–70. [Google Scholar]
- Howells FM, Hattingh CJ, Syal S, Breet E, Stein DJ, Lochner C, 2015. (1)H-magnetic resonance spectroscopy in social anxiety disorder. Prog. Neuropsychopharmacol. Biol. Psychiatry 58, 97–104. [DOI] [PubMed] [Google Scholar]
- Istin M, Thiriet N, Solinas M, 2017. Behavioral flexibility predicts increased ability to resist excessive methamphetamine self-administration. Addict. Biol 22, 958–966. [DOI] [PubMed] [Google Scholar]
- Jang JH, Kwon JS, Jang DP, Moon WJ, Lee JM, Ha TH, Chung EC, Kim IY, Kim SI, 2006. A proton MRSI study of brain N-acetylaspartate level after 12 weeks of citalopram treatment in drug-naive patients with obsessive-compulsive disorder. Am. J. Psychiatry 163, 1202–1207. [DOI] [PubMed] [Google Scholar]
- Jung RE, Brooks WM, Yeo RA, Chiulli SJ, Weers DC, Sibbitt WL Jr., 1999a. Biochemical markers of intelligence: a proton MR spectroscopy study of normal human brain. Proc. Biol. Sci 266, 1375–1379. [DOI] [PMC free article] [PubMed] [Google Scholar]
- Jung RE, Gasparovic C, Chavez RS, Flores RA, Smith SM, Caprihan A, Yeo RA, 2009. Biochemical support for the “threshold” theory of creativity: a magnetic resonance spectroscopy study. J. Neurosci 29, 5319–5325. [DOI] [PMC free article] [PubMed] [Google Scholar]
- Jung RE, Mead BS, Carrasco J, Flores RA, 2013. The structure of creative cognition in the human brain. Front. Hum. Neurosci 7, 330. [DOI] [PMC free article] [PubMed] [Google Scholar]
- Jung RE, Yeo RA, Chiulli SJ, Sibbitt WL Jr., Weers DC, Hart BL, Brooks WM, 1999b. Biochemical markers of cognition: a proton MR spectroscopy study of normal human brain. Neuroreport 10, 3327–3331. [DOI] [PubMed] [Google Scholar]
- Jung RE, Yeo RA, Love TM, Petropoulos H, Sibbitt WL Jr., Brooks WM, 2002. Biochemical markers of mood: a proton magnetic resonance spectroscopy study of normal human brain. Biol. Psychiatry 51, 224–229. [DOI] [PubMed] [Google Scholar]
- Kekelidze T, Khait I, Togliatti A, Benzecry JM, Wieringa B, Holtzman D, 2001. Altered brain phosphocreatine and ATP regulation when mitochondrial creatine kinase is absent. J. Neurosci. Res 66, 866–872. [DOI] [PubMed] [Google Scholar]
- Kim HJ, Kim JE, Cho G, Song IC, Bae S, Hong SJ, Yoon SJ, Lyoo IK, Kim TS, 2009. Associations between anterior cingulate cortex glutamate and gamma-aminobutyric acid concentrations and the harm avoidance temperament. Neurosci. Lett 464, 103–107. [DOI] [PubMed] [Google Scholar]
- Kondo DG, Forrest LN, Shi X, Sung YH, Hellem TL, Huber RS, Renshaw PF, 2016. Creatine target engagement with brain bioenergetics: a dose-ranging phosphorus-31 magnetic resonance spectroscopy study of adolescent females with SSRI-resistant depression. Amino Acids 48, 1941–1954. [DOI] [PMC free article] [PubMed] [Google Scholar]
- Kriegeskorte N, Golan T, 2019. Neural network models and deep learning. Curr. Biol 29, R231–R236. [DOI] [PubMed] [Google Scholar]
- Landim RC, Edden RA, Foerster B, Li LM, Covolan RJ, Castellano G, 2016. Investigation of NAA and NAAG dynamics underlying visual stimulation using MEGA–PRESS in a functional MRS experiment. Magn. Reson. Imaging 34, 239–245. [DOI] [PMC free article] [PubMed] [Google Scholar]
- Larsen RJ, Newman M, Nikolaidis A, 2016. Reduction of variance in measurements of average metabolite concentration in anatomically-defined brain regions. J. Magn.Reson 272, 73–81. [DOI] [PubMed] [Google Scholar]
- Lau A, Tymianski M, 2010. Glutamate receptors, neurotoxicity and neurodegeneration. Pflugers Arch. 460, 525–542. [DOI] [PubMed] [Google Scholar]
- Li BS, Wang H, Gonen O, 2003. Metabolite ratios to assumed stable creatine level may confound the quantification of proton brain MR spectroscopy. Magn. Reson. Imaging 21, 923–928. [DOI] [PubMed] [Google Scholar]
- Likhtik E, Johansen JP, 2019. Neuromodulation in circuits of aversive emotional learning. Nat. Neurosci 22, 1586–1597. [DOI] [PubMed] [Google Scholar]
- Malomouzh AI, Nikolsky EE, Lieberman EM, Sherman JA, Lubischer JL, Gross-feld RM, Urazaev A, 2005. Effect of N-acetylaspartylglutamate (NAAG) on non-quantal and spontaneous quantal release of acetylcholine at the neuromuscular synapse of rat. J. Neurochem 94, 257–267. [DOI] [PubMed] [Google Scholar]
- Maltezos S, Horder J, Coghlan S, Skirrow C, O’Gorman R, Lavender TJ, Mendez MA, Mehta M, Daly E, Xenitidis K, Paliokosta E, Spain D, Pitts M, Asherson P, Lythgoe DJ, Barker GJ, Murphy DG, 2014. Glutamate/glutamine and neuronal integrity in adults with ADHD: a proton MRS study. Transl. Psychiatry 4, e373. [DOI] [PMC free article] [PubMed] [Google Scholar]
- Markarian Y, Larson MJ, Aldea MA, Baldwin SA, Good D, Berkeljon A, Murphy TK, Storch EA, McKay D, 2010. Multiple pathways to functional impairment in obsessive-compulsive disorder. Clin. Psychol. Rev 30, 78–88. [DOI] [PubMed] [Google Scholar]
- Michael N, Erfurth A, Ohrmann P, Arolt V, Heindel W, Pfleiderer B, 2003. Neurotrophic effects of electroconvulsive therapy: a proton magnetic resonance study of the left amygdalar region in patients with treatment-resistant depression. Neuropsychopharmacology 28, 720–725. [DOI] [PubMed] [Google Scholar]
- Mlynarik V, Gruber S, Moser E, 2001. Proton T (1) and T (2) relaxation times of human brain metabolites at 3 Tesla. NMR Biomed. 14, 325–331. [DOI] [PubMed] [Google Scholar]
- Modi S, Rana P, Kaur P, Rani N, Khushu S, 2014. Glutamate level in anterior cingulate predicts anxiety in healthy humans: a magnetic resonance spectroscopy study. Psychiatry Res. 224, 34–41. [DOI] [PubMed] [Google Scholar]
- Moffett JR, Ross B, Arun P, Madhavarao CN, Namboodiri AM, 2007. N-Acetyl-aspartate in the CNS: from neurodiagnostics to neurobiology. Prog. Neurobiol 81, 89–131. [DOI] [PMC free article] [PubMed] [Google Scholar]
- Morrone JV, Depue RA, Scherer AJ, White TL, 2000. Film-induced incentive motivation and positive activation in relation to agentic and affiliative components of extraversion. Pers. Individ. Differ 29, 199–216. [Google Scholar]
- Nikolaidis A, Baniqued PL, Kranz MB, Scavuzzo CJ, Barbey AK, Kramer AF, Larsen RJ, 2017. Multivariate associations of fluid intelligence and NAA. Cereb. Cortex 27, 2607–2616. [DOI] [PubMed] [Google Scholar]
- Nordahl TE, Salo R, Natsuaki Y, Galloway GP, Waters C, Moore CD, Kile S, Buonocore MH, 2005. Methamphetamine users in sustained abstinence: a proton magnetic resonance spectroscopy study. Arch. Gen. Psychiatry 62, 444–452. [DOI] [PubMed] [Google Scholar]
- Nordahl TE, Salo R, Possin K, Gibson DR, Flynn N, Leamon M, Galloway GP, Pfefferbaum A, Spielman DM, Adalsteinsson E, Sullivan EV, 2002. Low N-acetyl-aspartate and high choline in the anterior cingulum of recently abstinent methamphetamine-dependent subjects: a preliminary proton MRS study. Magnetic resonance spectroscopy. Psychiatry Res. 116, 43–52. [DOI] [PubMed] [Google Scholar]
- Patel T, Blyth JC, Griffiths G, Kelly D, Talcott JB, 2014. Moderate relationships between NAA and cognitive ability in healthy adults: implications for cognitive spectroscopy. Front. Hum. Neurosci 8, 39. [DOI] [PMC free article] [PubMed] [Google Scholar]
- Patrick CJ, Curtin JJ, Tellegen A, 2002. Development and validation of a brief form of the multidimensional personality questionnaire. Psychol. Assess 14, 150–163. [DOI] [PubMed] [Google Scholar]
- Paul EJ, Larsen RJ, Nikolaidis A, Ward N, Hillman CH, Cohen NJ, Kramer AF, Barbey AK, 2016. Dissociable brain biomarkers of fluid intelligence. Neuroimage 137, 201–211. [DOI] [PubMed] [Google Scholar]
- Piao C, Deng X, Wang X, Yuan Y, Liu Z, Liang J, 2017. Altered function in medial prefrontal cortex and nucleus accumbens links to stress-induced behavioral inflexibility. Behav. Brain Res 317, 16–26. [DOI] [PubMed] [Google Scholar]
- Provencher SW, 1993. Estimation of metabolite concentrations from localized in vivo proton NMR spectra. Magn. Reson. Med 30, 672–679. [DOI] [PubMed] [Google Scholar]
- Quilty LC, DeYoung CG, Oakman JM, Bagby RM, 2014. Extraversion and behavioral activation: integrating the components of approach. J. Pers. Assess 96, 87–94. [DOI] [PubMed] [Google Scholar]
- Rae CD, 2014. A guide to the metabolic pathways and function of metabolites observed in human brain 1H magnetic resonance spectra. Neurochem. Res 39, 1–36. [DOI] [PubMed] [Google Scholar]
- Reneman L, Majoie CB, Flick H, den Heeten GJ, 2002. Reduced N-acetylaspartate levels in the frontal cortex of 3,4-methylenedioxymethamphetamine (Ecstasy) users: preliminary results. AJNR Am. J. Neuroradiol 23, 231–237. [PMC free article] [PubMed] [Google Scholar]
- Reynolds LM, Reynolds GP, 2011. Differential regional N-acetylaspartate deficits in postmortem brain in schizophrenia, bipolar disorder and major depressive disorder. J. Psychiatr. Res 45, 54–59. [DOI] [PubMed] [Google Scholar]
- Ryman SG, Gasparovic C, Bedrick EJ, Flores RA, Marshall AN, Jung RE, 2011. Brain biochemistry and personality: a magnetic resonance spectroscopy study. PLoS One 6, e26758. [DOI] [PMC free article] [PubMed] [Google Scholar]
- Salo R, Nordahl TE, Natsuaki Y, Leamon MH, Galloway GP, Waters C, Moore CD, Buonocore MH, 2007. Attentional control and brain metabolite levels in methamphetamine abusers. Biol. Psychiatry 61, 1272–1280. [DOI] [PubMed] [Google Scholar]
- Schuff N, Neylan TC, Fox-Bosetti S, Lenoci M, Samuelson KW, Studholme C, Kornak J, Marmar CR, Weiner MW, 2008. Abnormal N-acetylaspartate in hippocampus and anterior cingulate in posttraumatic stress disorder. Psychiatry Res. 162, 147–157. [DOI] [PMC free article] [PubMed] [Google Scholar]
- Sekine Y, Minabe Y, Kawai M, Suzuki K, Iyo M, Isoda H, Sakahara H, Ashby CR Jr., Takei N, Mori N, 2002. Metabolite alterations in basal ganglia associated with methamphetamine-related psychiatric symptoms. A proton MRS study. Neuropsychopharmacology 27, 453–461. [DOI] [PubMed] [Google Scholar]
- Sherman AD, Mott J, 1985. Amphetamine stimulation of glutaminase is blocked by neuroleptics. Life Sci. 36, 1163–1167. [DOI] [PubMed] [Google Scholar]
- Silveri MM, Sneider JT, Crowley DJ, Covell MJ, Acharya D, Rosso IM, Jensen JE, 2013. Frontal lobe gamma-aminobutyric acid levels during adolescence: associations with impulsivity and response inhibition. Biol. Psychiatry 74, 296–304. [DOI] [PMC free article] [PubMed] [Google Scholar]
- Sung YH, Carey PD, Stein DJ, Ferrett HL, Spottiswoode BS, Renshaw PF, Yurgelun-Todd DA, 2013. Decreased frontal N-acetylaspartate levels in adolescents concurrently using both methamphetamine and marijuana. Behav. Brain Res 246, 154–161. [DOI] [PMC free article] [PubMed] [Google Scholar]
- Sung YH, Cho SC, Hwang J, Kim SJ, Kim H, Bae S, Kim N, Chang KH, Daniels M, Renshaw PF, Lyoo IK, 2007. Relationship between N-acetyl-aspartate in gray and white matter of abstinent methamphetamine abusers and their history of drug abuse: a proton magnetic resonance spectroscopy study. Drug Alcohol Depend. 88, 28–35. [DOI] [PubMed] [Google Scholar]
- Tellegen A, 1982. Brief Manual for the Multidimensional Personality Questionnaire. University of Minnesota, Minneapolis. [Google Scholar]
- Tellegen A, Lykken DT, Bouchard TJ Jr., Wilcox KJ, Segal NL, Rich S, 1988. Personality similarity in twins reared apart and together. J. Pers. Soc. Psychol 54, 1031–1039. [DOI] [PubMed] [Google Scholar]
- Timoshanko A, Desmond P, Camfield DA, Downey LA, Stough C, 2014. A magnetic resonance spectroscopy (H-1 MRS) investigation into brain metabolite correlates of ability emotional intelligence. Pers. Individ. Differ 65, 69–74. [Google Scholar]
- Traber F, Block W, Lamerichs R, Gieseke J, Schild HH, 2004. 1H metabolite relaxation times at 3.0 tesla: measurements of T1 and T2 values in normal brain and determination of regional differences in transverse relaxation. J. Magn. Reson. Imaging 19, 537–545. [DOI] [PubMed] [Google Scholar]
- Tunc-Skarka N, Weber-Fahr W, Ende G, 2015. Recreational alcohol use induces changes in the concentrations of choline-containing compounds and total creatine in the brain: a (1)H MRS study of healthy subjects. MAGMA 28, 503–510. [DOI] [PubMed] [Google Scholar]
- Venkatraman TN, Krishnan RR, Steffens DC, Song AW, Taylor WD, 2009. Bio chemical abnormalities of the medial temporal lobe and medial prefrontal cortex in late-life depression. Psychiatry Res. 172, 49–54. [DOI] [PMC free article] [PubMed] [Google Scholar]
- Wallimann T, Wyss M, Brdiczka D, Nicolay K, Eppenberger HM, 1992. Intracellular compartmentation, structure and function of creatine kinase isoenzymes in tissues with high and fluctuating energy demands: the ‘phosphocreatine circuit’ for cellular energy homeostasis. Biochem. J 281 (Pt 1), 21–40. [DOI] [PMC free article] [PubMed] [Google Scholar]
- White TL, 2017. Beyond Sensation Seeking: a Conceptual Framework for Individual Differences in Psychostimulant Drug Effects in Healthy Humans. Curr. Opin. Behav. Sci 13, 63–70. [DOI] [PMC free article] [PubMed] [Google Scholar]
- White TL, Depue RA, 1999. Differential association of traits of fear and anxiety with norepinephrine- and dark-induced pupil reactivity. J. Pers. Soc. Psychol 77, 863–877. [DOI] [PubMed] [Google Scholar]
- White TL, Lejuez CW, de Wit H, 2007. Personality and gender differences in effects of damphetamine on risk taking. Exp. Clin. Psychopharmacol 15, 599–609. [DOI] [PubMed] [Google Scholar]
- White TL, Lott DC, de Wit H, 2006. Personality and the subjective effects of acute amphetamine in healthy volunteers. Neuropsychopharmacology 31, 1064–1074. [DOI] [PubMed] [Google Scholar]
- White TL, Monnig MA, Walsh EG, Nitenson AZ, Harris AD, Cohen RA, Porges EC, Woods AJ, Lamb DG, Boyd CA, Fekir S, 2018. Psychostimulant drug effects on glutamate, Glx, and creatine in the anterior cingulate cortex and subjective response in healthy humans. Neuropsychopharmacology 43, 1498–1509. [DOI] [PMC free article] [PubMed] [Google Scholar]
- WHO, 1946. Constitution of the World Health Organization rev 2006.
- Wijtenburg SA, Rowland LM, Edden RA, Barker PB, 2013. Reproducibility of brain spectroscopy at 7T using conventional localization and spectral editing techniques. J. Magn. Reson. Imaging 38, 460–467. [DOI] [PMC free article] [PubMed] [Google Scholar]
- Winsberg ME, Sachs N, Tate DL, Adalsteinsson E, Spielman D, Ketter TA, 2000. Decreased dorsolateral prefrontal N-acetyl aspartate in bipolar disorder. Biol. Psychiatry 47, 475–481. [DOI] [PubMed] [Google Scholar]
- Yeh YC, Li CW, Kuo YT, Huang MF, Liu TL, Jaw TS, Yang YH, Kuo KC, Chen CS, 2018. Association between altered neurochemical metabolites and apathy in patients with Alzheimer’s disease. Int. Psychogeriatr 30, 761–768. [DOI] [PubMed] [Google Scholar]
- Zhang H, Wang W, Gao W, Ge Y, Zhang J, Wu S, Xu L, 2009. Effect of propofol on the levels of neurotransmitters in normal human brain: a magnetic resonance spectroscopy study. Neurosci. Lett 467, 247–251. [DOI] [PubMed] [Google Scholar]
- Zhu H, Barker PB, 2011. MR spectroscopy and spectroscopic imaging of the brain. Methods Mol. Biol 711, 203–226. [DOI] [PMC free article] [PubMed] [Google Scholar]
Associated Data
This section collects any data citations, data availability statements, or supplementary materials included in this article.