Summary
In metazoan development, lineage specific gene expression is modulated by the delicate balance between transcription activation and repression. Despite much of our knowledge in the enhancer-centered transcription activation, silencers and their roles in normal development are poorly understood. Here, we performed chromatin interaction analyses of Polycomb repressive complex 2 (PRC2), a key regulator inducing transcriptional gene silencing, to uncover silencers, their molecular identity and associated chromatin connectivity. Systematic analysis of the cis-regulatory silencer elements reveals their chromatin features and gene targeting specificity. Deletion of these PRC2-bound silencers in mice results in transcriptional derepression of their interacting genes and pleiotropic developmental phenotypes, including embryonic lethality. While functioning as PRC2-bound silencers in pluripotent cells, they can transition into active tissue-specific enhancers during development, suggesting their regulatory versatility. Our study characterizes the molecular nature of silencers, their associated chromatin architectures, and offers the exciting possibility of targeted re-activation of epigenetically silenced genes.
Introduction
In metazoan development, transcription regulation is one of the key mechanisms modulating lineage differentiation and cell fate determination. The precise control of gene expression is achieved by the delicate balance between transcription activation and repression1. Within the nuclei, genes with distinct transcriptional activities are compartmentalized into separate sub-nuclear domains, including active transcription factories2 and repressive Polycomb (PcG) bodies3. While much of our existing knowledge of transcription regulation has been established through the extensive survey of enhancers in the context of active transcription factories4,5, the roles of silencers in mediating transcriptional gene silencing (TGS) and their functional requirement in development remain underexplored despite their existence been proposed more than two decades ago6,7.
Within the repressive PcG-associated chromatin conformation, silencers have been suggested as noncoding distal regulatory elements (DREs) directing transcription repression by mediating long-range chromatin interactions to their target genes6,8. Polycomb repressive complex 2 (PRC2), an integral component of the PcG bodies, regulates proper embryonic development9. Deletion of the core components of PRC2 result in their target genes de-repression9–12 and embryonic lethality13–15. Furthermore, PRC2 has been shown to function as a repressor to establish long-range chromatin interactions16,17 and the interactions between genes and PRC2-chromatin complexes enhance their epigenetic silencing16,18,19. Therefore, chromatin conformation orchestrated by PRC2 could be adopted to examine the silencer-gene interactions, from which the PRC-bound silencers and their target genes could be identified.
PRC2 associated chromatin conformation has been broadly surveyed across different species and cell types20–25. These studies adopted either targeted methods to capture interactions confined within a few selected genes18,20–24,26 or Hi-C method specialized in detecting topological associating domains (TAD) spanning across hundreds of kilobases17,25,27. Despite the rich understanding in the role of PRC2 in 3D chromatin organization, the key unknowns remain as to the prevalence and exact identity of the silencers as well as their regulatory targets. Expanding from these previous studies, we applied PRC2 mediated chromatin immunoprecipitation (ChIP)-based interaction analysis (ChIA-PET)28 in mouse pluripotent embryonic stem cells (mESCs), one of the cell types in which PRC2-mediated TGS was most studied21,29,30. ChIA-PET specifically captures genome-wide chromatin contacts mediated by PRC2 at binding-site resolution, the information not available in previous analyses. Through the comprehensive survey of PRC2-bound promoters and their DREs interaction networks, we uncovered PRC2-bound silencers and characterized their function in transcriptional control. Perturbation of the PRC2-bound silencer-promoter interactions by the CRISPR-Cas9-facilitated genome editing method resulted in target gene-specific re-activation and pleiotropic developmental defects, including embryonic lethality in mice. When examining the chromatin states of these silencers throughout the lineage specification, we demonstrated that these PRC2-bound silencers, similar to the poised enhancers31–33, can transition into transcriptional enhancers in lineage-specified cells. Our results underscore the regulatory versatility of the non-coding regions in the mammalian genome and highlight their vital function in normal development.
Results
PRC2 mediates extensive chromatin interactions to transcriptionally silence developmentally-regulated genes
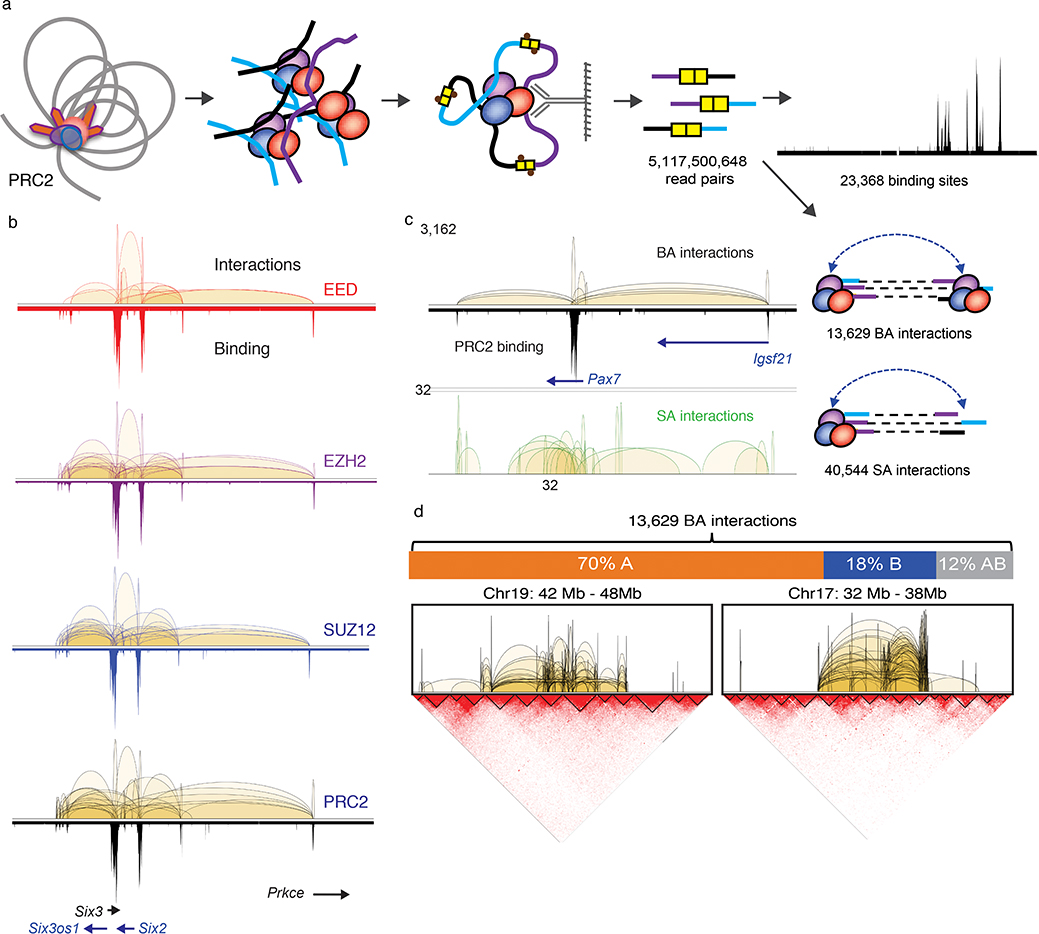
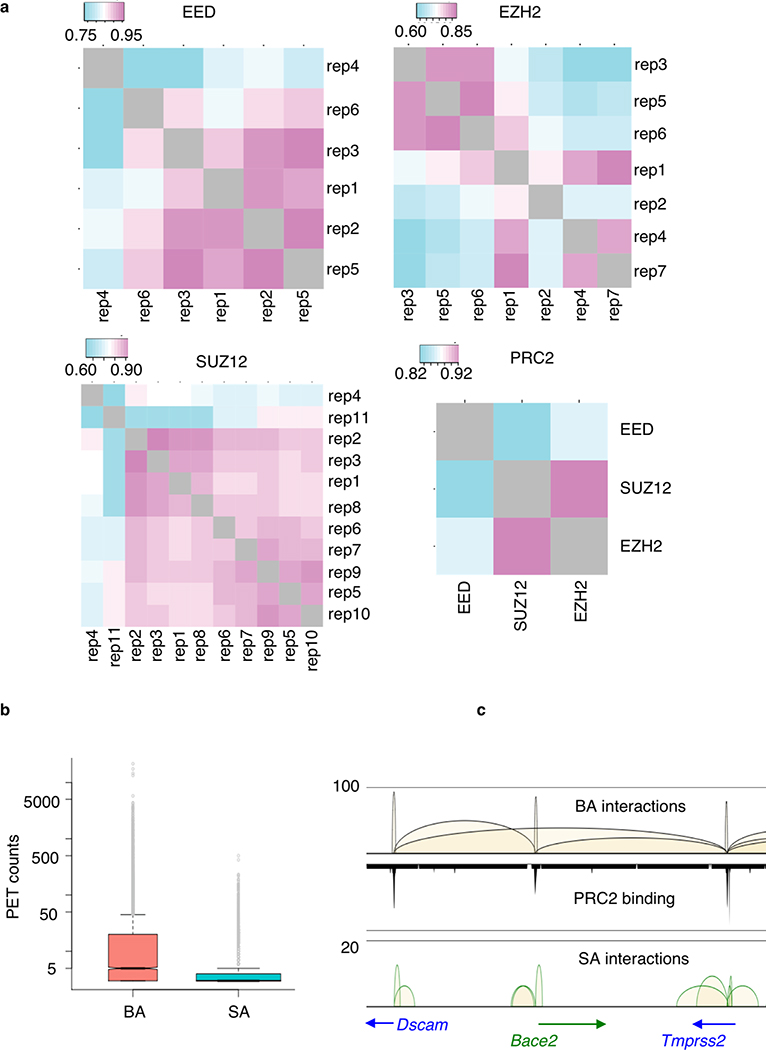
We characterized PRC2-mediated chromatin interactions in mESCs by ChIA-PET analysis. ESC chromatin was crosslinked and genomic regions connected by PRC2 were captured by proximity ligation of crosslinked chromatin followed by ChIP using antibodies against each of the three core subunits of PRC2 complex, namely EED, EZH2 and SUZ12 in mESCs (Fig. 1a, Methods). To maximize the sensitivity of the ChIA-PET library approach in capturing PRC2-mediated interactions, we constructed multiple biological replicates, EED (n = 6), EZH2 (n = 7) and SUZ12 (n = 11), and generated a total of 5 billion paired-read sequences (Supplementary Table 1). The replicates datasets showed a high degree of consistency (Extended Data Fig. 1a), and were therefore merged to define 25,000–42,000 protein binding sites (FDR <0.05) and 12,000–28,000 significant chromatin interactions (FDR <0.05, p <0.05) supported by EED, EZH2 and SUZ12 binding (Supplementary Table 2&3). Consistent with these three subunits functioning together in the PRC2 complex, a high degree of correlation was found among the interactomes mediated by each subunit (r = 0.8–0.93, Extended Data Fig. 1a), as exemplified in a 1Mb region of the Six2/3-Prkce locus (Fig. 1b). The comprehensive PRC2 interactome was defined by combining all 5 billion read pairs sequences from three subunits to yield 54,173 significant intra-chromosomal interactions (FDR<0.05, p<0.05) which were supported by PRC2 binding at either single anchor (SA) or both anchors (BA) (Fig. 1a, Supplementary Table 2&4). BA-interactions have significantly higher numbers of read counts than SA-interactions (Welch two sample t-test, p-value = 3.73e-53, Extended Data Fig. 1b). Based on such feature, BA-interactions (n = 13,629) represent specific loops between the PRC2 binding sites, while SA-interactions (n = 40,544) are transient and weak connections often found within the BA-interaction regions (Fig. 1c, Extended Data Fig. 1c). These PRC2-mediated chromatin interactions are largely constrained within topologically associating domains (TADs)34,35 (Fig. 1d) and also significantly associated with the active, gene-rich A-type compartments than the inactive, gene-poor B-type compartments (9,532, 70%; p-value = 1.27e-160). Collectively, these data constitute one of the most extensively surveyed transcriptionally repressive chromatin interactomes.
Fig. 1: ChIA-PET analysis defines PRC2 interactome in mESC.
a. Cross-linked chromatin was fragmented and subjected to proximity ligation followed by ChIP enrichment for three core PRC2 components, EED (n = 6), EZH2 (n = 7) and SUZ12 (n = 11) in mESC. See Supplementary Table 1 for sample details. Five billion read pairs were pooled to define PRC2 binding sites and interactions supported by PRC2 binding at both anchors (BA) and single anchor (SA). b. Interactions (upper tracks) and binding (lower tracks) profiles across chr17:85,366,518–86,405,710 region for EED (red), EZH2 (purple), SUZ12 (blue) and combined PRC2 (black) are displayed with matching gene track. c. BA and SA interactions across chr16:96,921,289–98,008,954 region are shown together with the PRC2 binding profile and the associated genes. Y-axis shows the interaction frequency represented by the number of PET counts. d. Upper Panel: The distribution of PRC2 BA interactions among nuclear compartments A, B and across A-B. Percent of total BA interactions are shown. Lower panel: ChIA-PET interactions within 6 Mb of chromosomes 17 and 19 are shown in reference with the topological associated domains (TADs) defined by Hi-C contact maps.
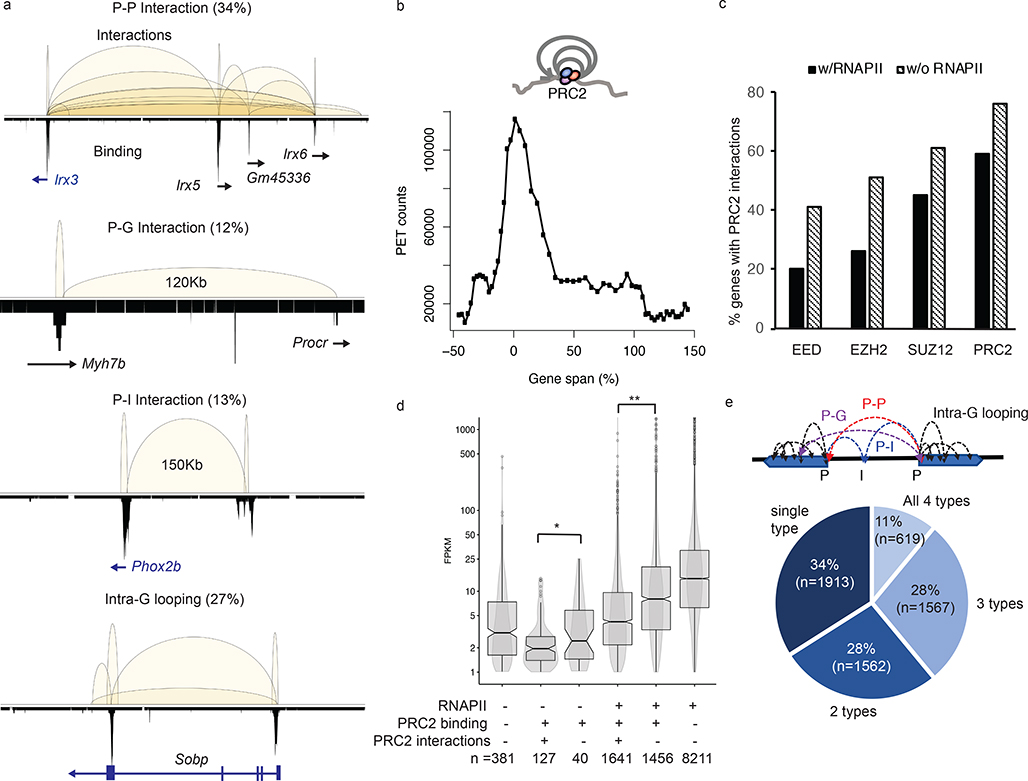
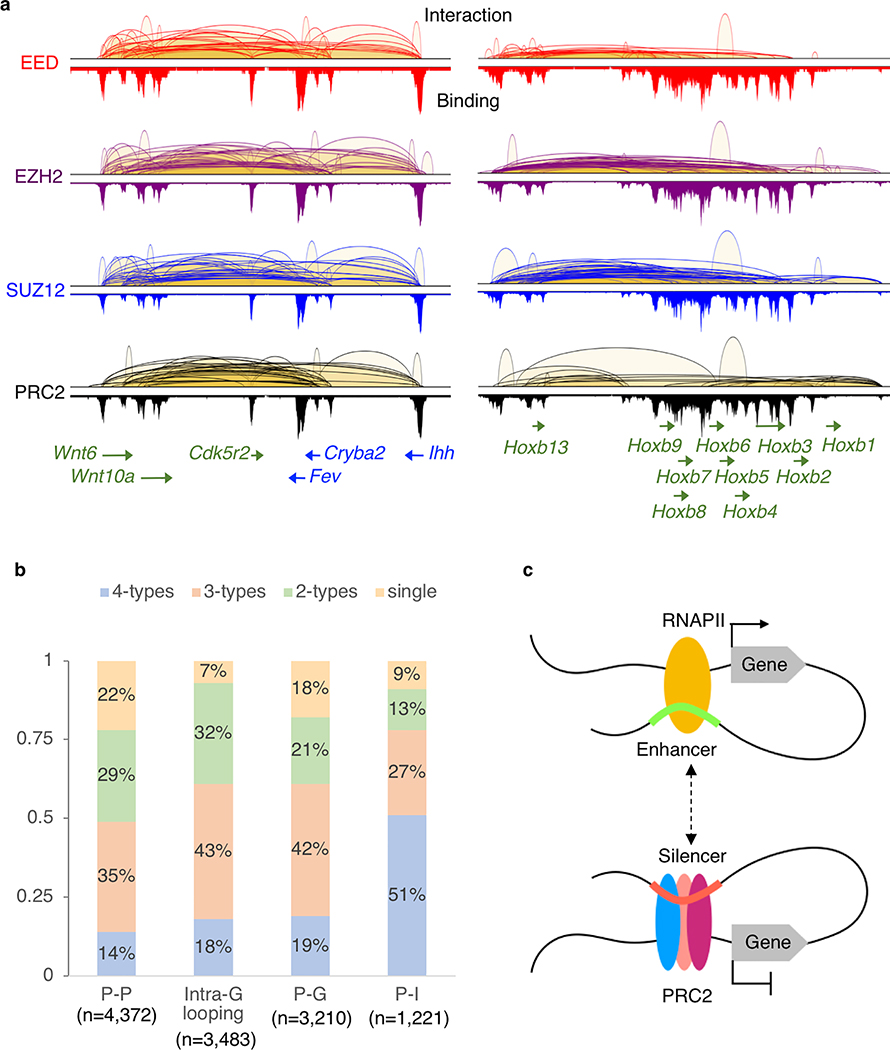
Vast majority (95%) of the 13,629 BA-interactions are found within gene-coding regions and most (60%) of them are anchored at gene promoters (defined as ± 2.5 Kb of transcription starting sites (TSS)). These are interactions between promoters (P-P, 34%), or promoter to either intergenic (P-I, 13%) or intragenic regions (P-G, 12%) of distal genes (Fig. 2a). 27% of the BA-interactions are found within individual genes (intra-G), coiling the promoters or looping from 5’ to 3’ of their associated transcription units (Fig. 2a). The distribution of intra-G interaction frequencies, highest at the TSS and gradually declining toward the 3’ end of the genes (Fig. 2b), suggests that the PRC2-induced chromatin compaction follows the direction of the gene transcription. PRC2-bound promoters co-occupied by RNA polymerase II (RNAPII) exhibit significantly fewer interactions than PRC2-bound promoters lacking RNAPII binding (59% vs. 76%, p = 0.0012, paired t-test) (Fig. 2c). Among all the genes bound by PRC2, those with PRC2-mediated chromatin interactions, including many well-known developmentally regulated genes like Wnt6-Ihh and Hoxb loci (Extended Data Fig. 2a), have significantly lower steady-state levels of RNA (p = 0.03). A similar pattern is also observed for genes with their promoter co-occupied with PRC2 and RNAPII (p-value <2.2e-16) (Fig. 2d). Many well-known developmentally regulated genes exhibited numerous PRC2-mediated loops of multiple interactions types (P-P, P-I, P-G and intra-G) as shown for the Hoxb loci. Among the 5,825 genes with BA-interactions (Supplementary Table 5), 3,784 (65%) display multiple (≥ 2) types of interactions (Fig. 2e) with the most common co-occurring types being P-P and intra-G looping (2871/3784; 76%), followed by P-P with either P-G or P-I (2648/3784; 70%), while only 7% of the genes display intra-G looping as the singular interaction type (Extended Data Fig. 2b). Gene ontology analysis of these 5,825 genes suggests their functions significantly enriched in developmental processes (q-value = 2e-140), morphogenesis (q-value = 2.4e-96), and cellular differentiation (q-value = 4.6e-86) (Supplementary Table 6), consistent with the known biological processes regulated by PRC2 in the pluripotent cells36.
Fig. 2: PRC2 mediates extensive chromatin looping in genes of low transcription activities.
a. Four major subclasses of PRC2 interactions are classified based on features, gene (G), promoter (P) and intergenic (I), associated with the interaction anchors. The chromosomal regions showed are as follows; P-P, chr8:91,651,961–92,862,573; P-G, chr2:155,604,301–155,765,282; P-I, chr5:66,963,794–67,352,967 and Intra-G looping, chr10:42,916,485–43,260,546. PRC2 binding profiles are shown in lower tracks. b. The distribution of interaction frequency (PET counts) across the gene coding regions associated with PRC2 intra-G looping (n = 3,483). c. The percentages of genes with PRC2 interactions detected. X-axis indicates the protein factors bound at the promoters. Significant differences (paired t-test, p = 0.0012) are found between binding in the presence (black) or absence (hatched) of RNAPII. d. Distribution of steady-state RNA expression level (FPKM) among genes with different patterns of binding and interactions. Each box represents first quartile (bottom) and third quartile (top) with median in the middle. Whiskers represent data range defined as 1.5 times interquartile from median (Q2 +/− 1.5*(Q3-Q1)). Points above whiskers represent outliers. The single and double asterisks indicate significant p-value = 0.034 and 2.2E-16 from one-sided Wilcoxon rank sum tests.
e. The percentages of PRC2 tethered genes with single, dual, three or all four subclasses of interaction types. Most genes are associated with more than one category of interactions.
PRC2-interaction anchors act as transcriptional silencers
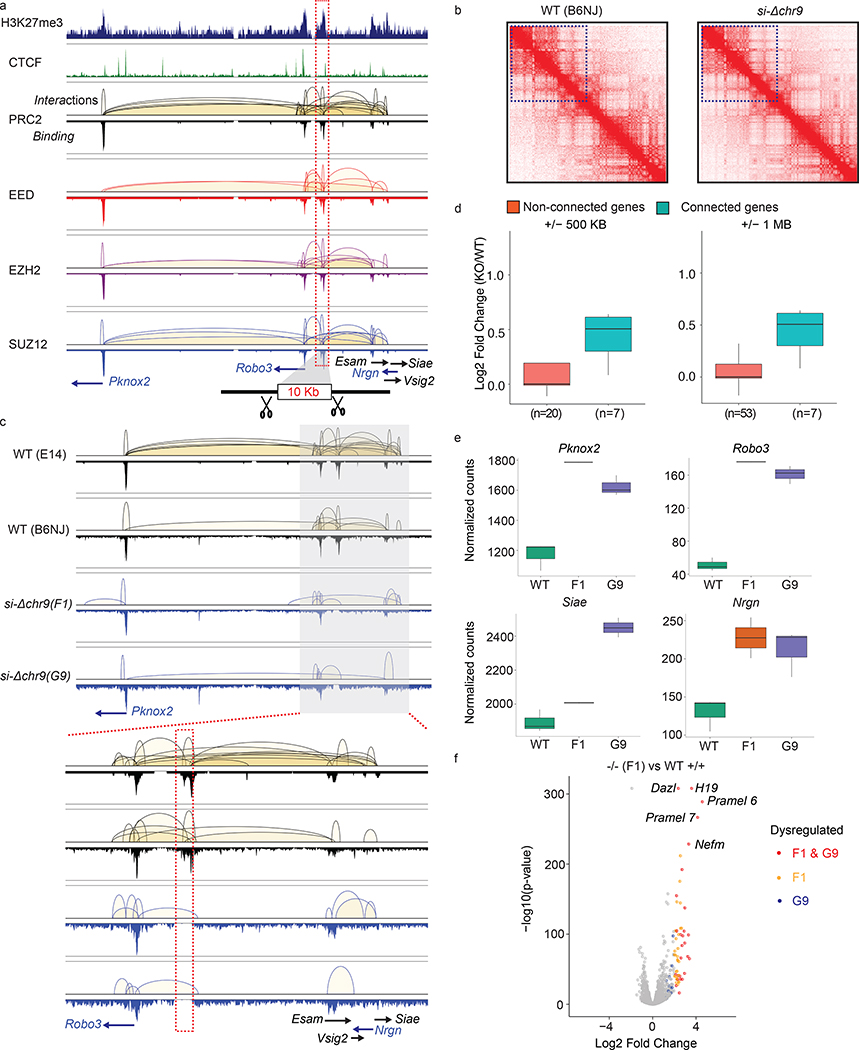
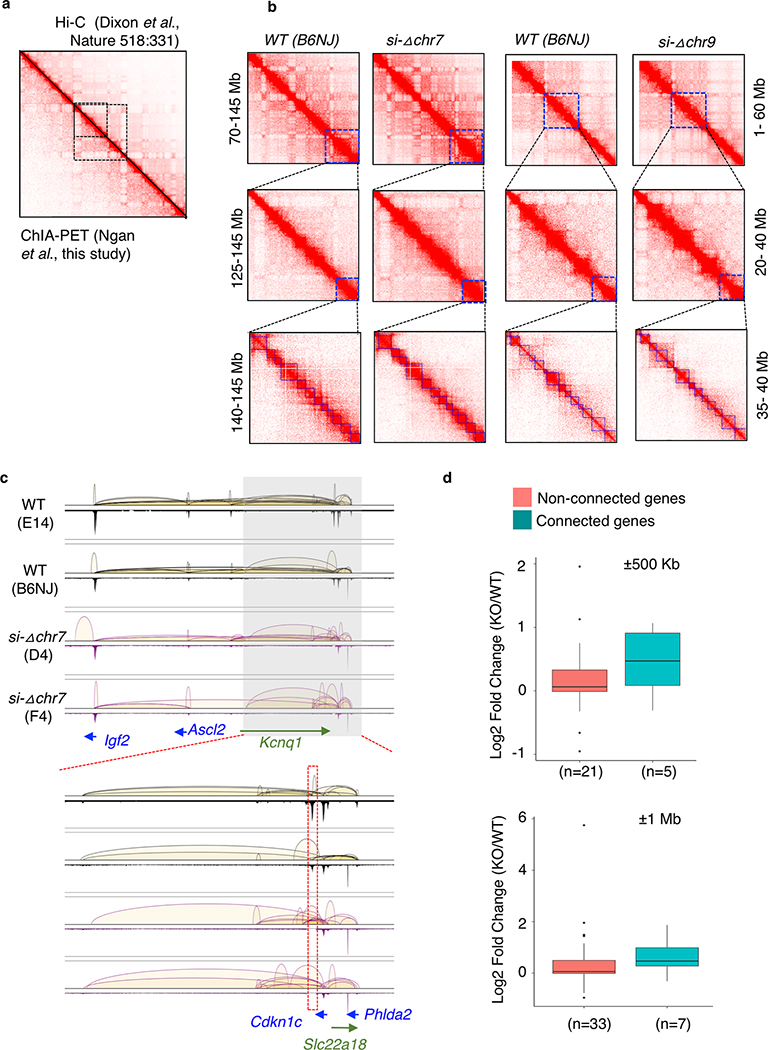
We hypothesized that silencers can repress the transcription of their target genes through chromatin looping when bound by the repressors like PRC2, similar to how enhancers activate target gene expression37,38 (Extended Data Fig. 2c). To test if the non-coding interacting anchors bound by PRC2 can function as the silencers, we performed CRISPR/Cas9 targeted knockout (KO) of the intergenic anchors, targeting deletion between 5–10kb regions in sizes, and characterized gene expression changes in the KO mESCs (Extended Data Fig. 3). From 21 intergenic anchors selected based on the functional importance of their connected genes (Supplementary Table 7), we successfully established homozygous (−/−) KO mESC lines for four loci. The deleted regions and their associated genes are shown in Fig. 3a and Extended Data Fig. 4. Validation of the KO clones were shown in Extended Data Fig. 5. To evaluate the effects of interaction anchor deletion on chromatin organization, local interactions and PRC2 occupancy, particularly regions adjacent to the deleted loci and their targeted genes, we performed the ChIA-PET analysis in two of the KO ESC lines (si-Δchr9 and si-Δchr7) and compared the interaction maps with the those detected in the WT ES cells. ChIA-PET uncovered broad spatial topologically associating domains, similar to Hi-C-based approaches (Extended Data Fig. 6a) and the topological structures surrounding the deleted regions did not yield any detectable changes while the local interactions originated from the deleted regions were lost (Fig. 3b & c and Extended Data Fig. 6b & c). We also observed an overall reduction of the interactions in the region proximity to si-Δchr9 locus when compared with WT ESCs. Despite the loss of specific interactions, PRC2 binding at these connected promoters was not affected.
Fig. 3: Intergenic anchors function as transcriptional silencers.
a. Chromatin interaction profiles within chr9:37,071,610–37,689,270 mediated by each subunits of PRC2 were shown together with connected genes, H3K27me3 and CTCF binding intensity. The 10 Kb deleted si-Δchr9 region is highlighted. b. Contact heatmaps of chromosome 9 in wildtype (WT) and si-Δchr9 KO mESC lines. Regions (3–60 Mb) surrounding the deleted locus are highlighted. c. PRC2-mediated chromatin interaction profiles within chr9:36,955,506–37,955,721 in two independent WT and si-Δchr9 KO mESC lines. Lower panel displays region surrounding si-Δchr9 locus (chr9:37,395,678–37,576,659). d. Expression changes between connected vs. non-connected genes within 500kb and 1Mb of the si-Δchr9 region (Only clone F1 is shown). n indicates number of genes in each category. See details in Supplementary Table 8A. e. RNA expression of 4 selected genes connected to the si-Δchr9 locus from WT (n = 3), F1 (n = 2) and G9 (n = 3) KO mESC clones. f. Differential gene expression changes between the wild type (n=3) and homozygous deleted clones F1 (n=2) shown as a volcano plot. Selected genes with the most striking upregulation are labelled.
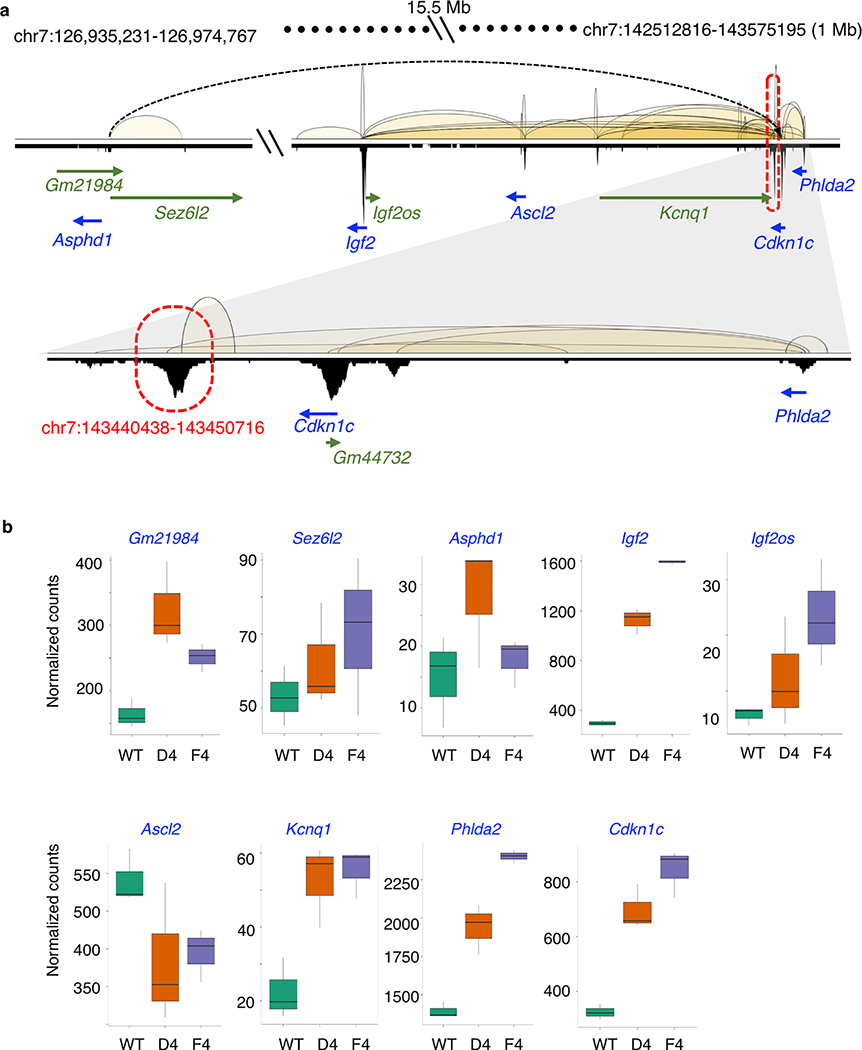
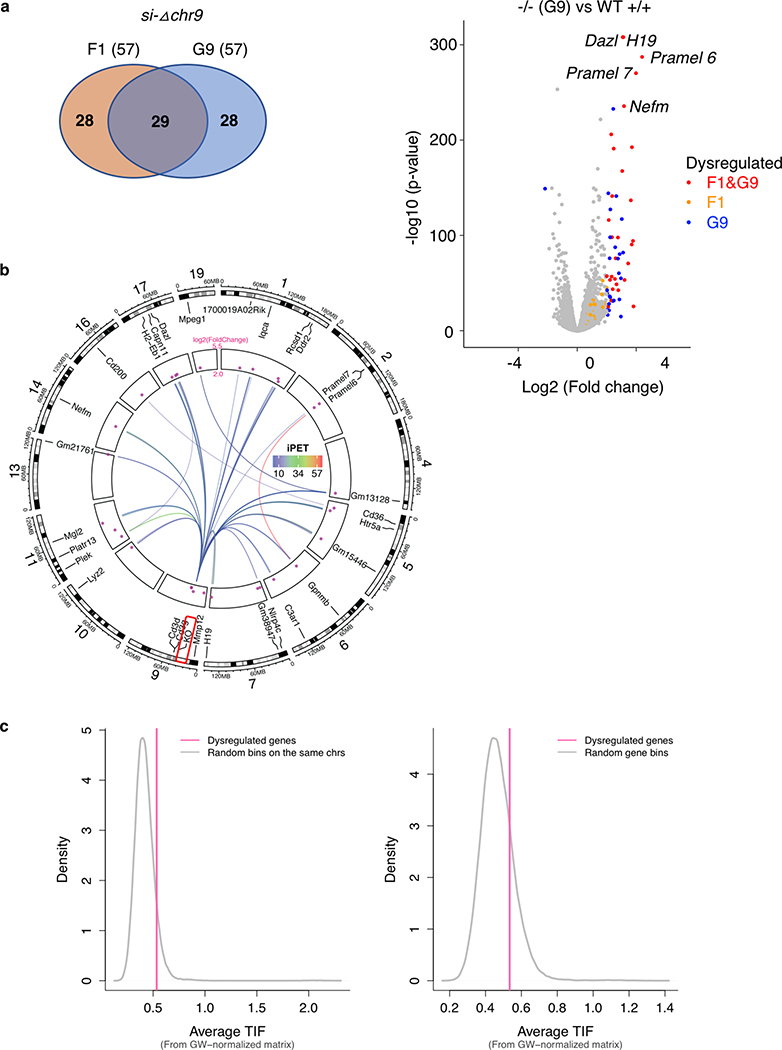
To determine the transcriptional effect associated with the deletion of the PRC2-bound silencers and their tethered interactions, we compared the gene expression between the homozygous deletion and wild type ESCs from multiple biological replicates. Genes interacting with the PRC2-bound interacting regions were overall upregulated (log2 fold change > 0) in the KO lines while the non-connected local genes (resided within ±500 Kb or ±1 Mb from the KO loci) were not (Fig. 3d, Extended Data Fig. 6d, Supplementary Table 8). Specifically, in chr7, chr2 and chr3-silencer KOs (si-Δchr7, si-Δchr2 and si-Δchr3), the expression of 9 out of the 10, 9 out of 14 and 5 out of 8 connected genes with detected expression were re-activated in KO ESC lines when compared with their expression in the wild-type ESCs, respectively (Extended Data Fig. 7). In the chr9-silencer KO (si-Δchr9), excluding the 5 predicted genes whose expression cannot be detected, we detected elevated RNA levels from 7 of the 8 connected genes (Fig. 3e). The reactivation were observed from genes transcribed from both sides of the deleted anchors. Therefore, their silencing activities were independent of the direction of transcription. Beyond local re-activation, we also observed global transcriptional de-repression in si-Δchr9 ESCs. Among the differentially expressed genes (log2 fold change > 2 & P-adj < 0.05) uncovered in si-Δchr9 ESCs, all except one, were upregulated in two independent F1 and G9 KO ESC lines (Fig. 3f, Extended Data Fig. 8a). Genes exhibiting the most striking degree of de-repression were imprinting H19 lincRNA, tumor antigen Pramel6 and Dazl, a gene involved in spermatogenesis (Supplementary Table 9). We reasoned that the transcriptional reactivation of these genes in the KO cells could be resulted from their spatial proximity to the si-Δchr9 locus in the 3-dimensional nuclear space and losing their contacts upon si-chr9 deletion. To evaluate their physical proximity, we examined the trans-contacts between si-Δchr9 silencer locus and the derepressed genes using the trans-interaction PETs in the ChIA-PET data and observed higher inter-chromosomal contact frequencies between the dysregulated genes and the si-Δchr9 locus (Extended Data Fig. 8b). To independently confirm their proximity in 3D space, we further used the trans-chromosomal interaction frequencies (TIFs) determined in the mESC Hi-C data 25. The average TIFs between si-Δchr9 and the derepressed genes detected in the KO clones were determined and compared with the TIFs determined from the random background defined through either random loci selected from the same set of chromosomes where the dysregulated genes resided or genome-wide, non-dysregulated genes with 100,000 permutations. We observed that the average TIF between si-Δchr9 silencer locus and the dysregulated genes was significantly higher (Wilcoxon tests’ p-values < 2.2E-16) using the genome-wide ICE (iterative correction and eigenvector decomposition)-normalized matrix39 (Extended Data Fig. 8c). Given the increased expression of the genes coupled with the loss of their PRC2 associated promoter-silencer interactions, we conclude that these PRC2-bound anchors function as transcriptional silencers.
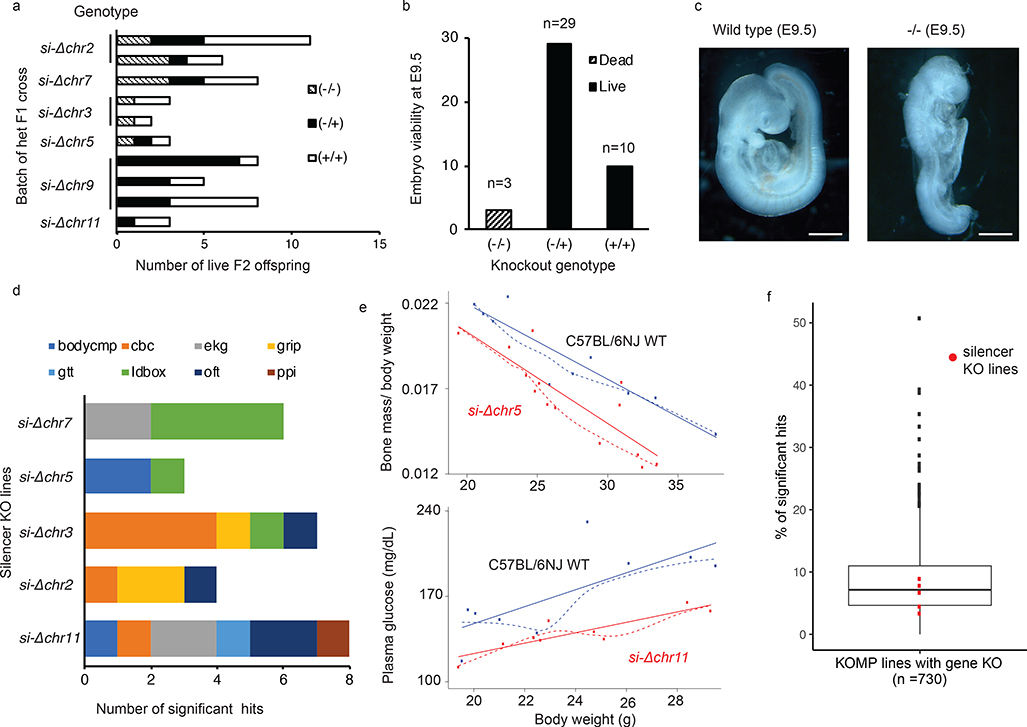
To characterize of the in vivo function of the PRC2-bound silencers, we assessed the phenotypes associated with the homozygous silencer deletions in mice. From total six PRC2-bound silencer KOs for which heterozygous mice were successfully established, viable homozygous KO mice were derived from five of them (Fig. 4a). Heterozygous mice carrying si-Δchr9 failed to yield any viable homozygous (−/−) pups from three separate crosses, indicating an essential function of si-Δchr9 in the embryonic development. To reaffirm the embryonic lethality, we examined embryos at embryonic day 9.5 (E9.5), the earliest stage when they can be recognized, and found no viable homozygous (−/−) embryos (Fig. 4b). Among the three dead embryos carrying homozygous deletions, one of which showed morphology of developmentally delay (Fig. 4c), and the other two were resorbed. From the remaining five PRC2-bound silencer loci with viable homozygous KO mice, we conducted a comprehensive, standardized phenotyping screen that measured 126 phenotyping parameters in 14 test procedures encompassing diverse biological and disease areas 40,41. From these five silencer KO lines, we detected significant variation (FDR <0.05) in 28 phenotypic measurements, ranging between three to eight different assays per KO line, from eight different procedures (Supplementary Table 10, Fig. 4d), including lower bone mass, plasma glucose level (Fig. 4e) and grip strength. In si-Δchr3 KO mice, three of the seven significant phenotypical aberrations were involved in the blood cell counts (cbc) while in si-Δchr7 KO mice, four of the six significant changes were anxiety responses measured by light-dark box tests (ldbox). Intriguingly, in si-Δchr11 KO mice, three of the eight significant phenotypical aberrations, namely heart rate, R-R interval in electrocardiography (ekg) and startle responses, measured by the prepulse inhibition (ppi) tests, were also altered in the mutant strains of CBX4 and Rbfox3, the two genes connecting to this particular silencer locus through PRC2 bound chromatin loops, suggesting a possible mechanistic model for these DREs’ function. Overall, the ratio of the significant hits detected from these noncoding silencer KOs were comparable to those from the coding-gene KO strains (n = 730 strains) (Fig. 4f), suggesting that these PRC2-bound DREs were of equivalent functional importance to the protein-coding genes. Collectively, the pleiotropic phenotypic aberration observed in six silencer KO strains provided functional annotation of these PRC2-bound DREs in vivo and highlighted the importance of their biological roles during development.
Fig. 4: Mice with PRC2-bound silencer deletion display pleiotropic developmental defect.
a. Relative ratio of −/−, −/+ and +/+ genotypes determined in six KO F2 crosses, including attempts from multiple crosses. b. For si-Δchr9, numbers of embryos at E9.5 days (Y-axis) of different genotypes (X-axis) from F2 crosses with heterozygous KO locus. c. Morphology of wild type (+/+) and homozygous (−/−) si-Δchr9 embryos at E9.5. Scale bar is 0.5mm. d. Numbers of phenotypic assays with significant changes among the eight domains detected in each of the five deletion with viable homozygous KOs. Cohort of at least 5 age-matched, sex-matched mice were compared. Significance were adjusted for multiple testing using Benjamini-Hochberg procedure to control the FDR at 5%. Details provided in Supplementary Table 10. Abbreviations; bodycmp: body composition; cbc: complete blood count; ekg: electrocardiography; gtt: glucose tolerance test; grip: grip strength; ldbox: light-dark box test; oft: open field test; ppi: prepulse inhibition test. e. Significant alteration in bone density and plasma glucose detected in si-Δchr5 and si-Δchr11 KO mice, respectively. Both a regression line (solid line) and a loess line (dotted line) fitted for each genotype are shown. f. Percent of hits in the PRC2-silencer KO (n=5) mice in relative to these detected in the KO of protein coding genes (n=730). The lower, middle and upper hinges in the boxplot correspond to the first (Q1), median, third (3) of percentage significant hits for 730 KO gene in the KOMP. Whiskers represent data range defined as 1.5 times interquartile from median (Q2 +/− 1.5*(Q3-Q1)). Points above whiskers represent outliers.
PRC2-associated silencers transition into active enhancers during differentiation
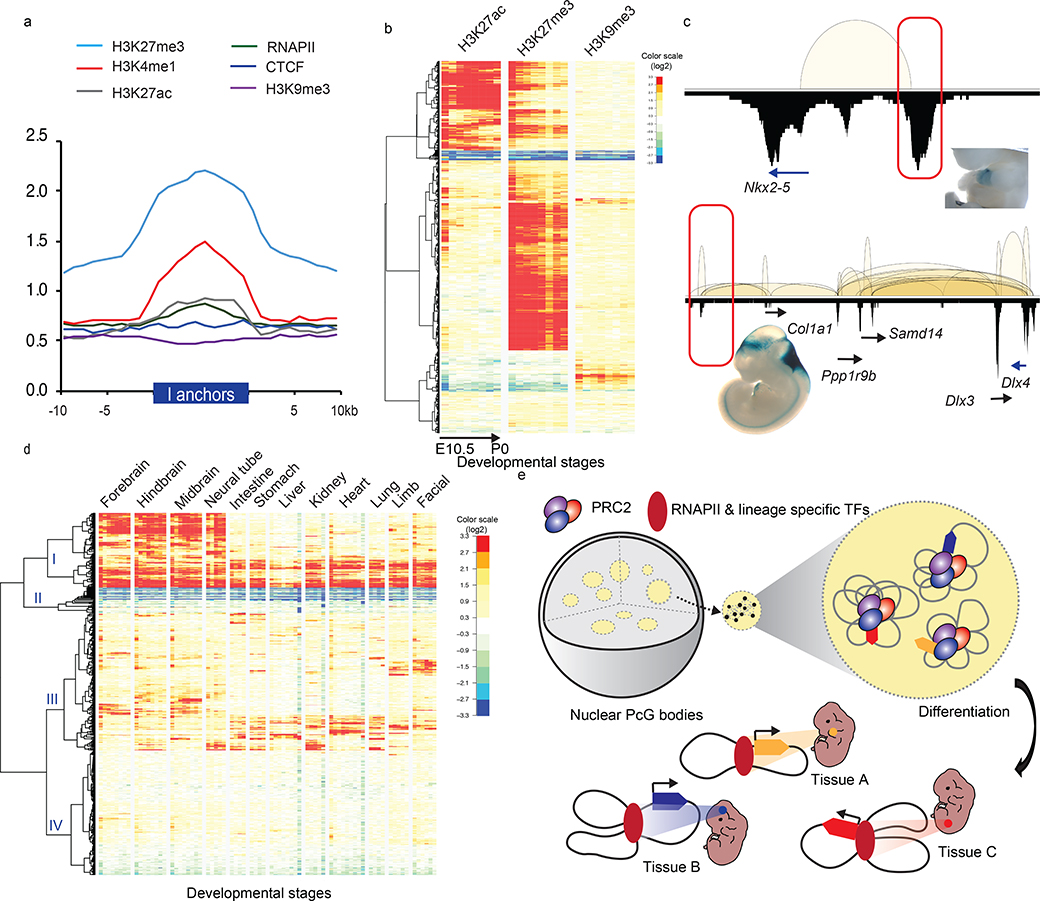
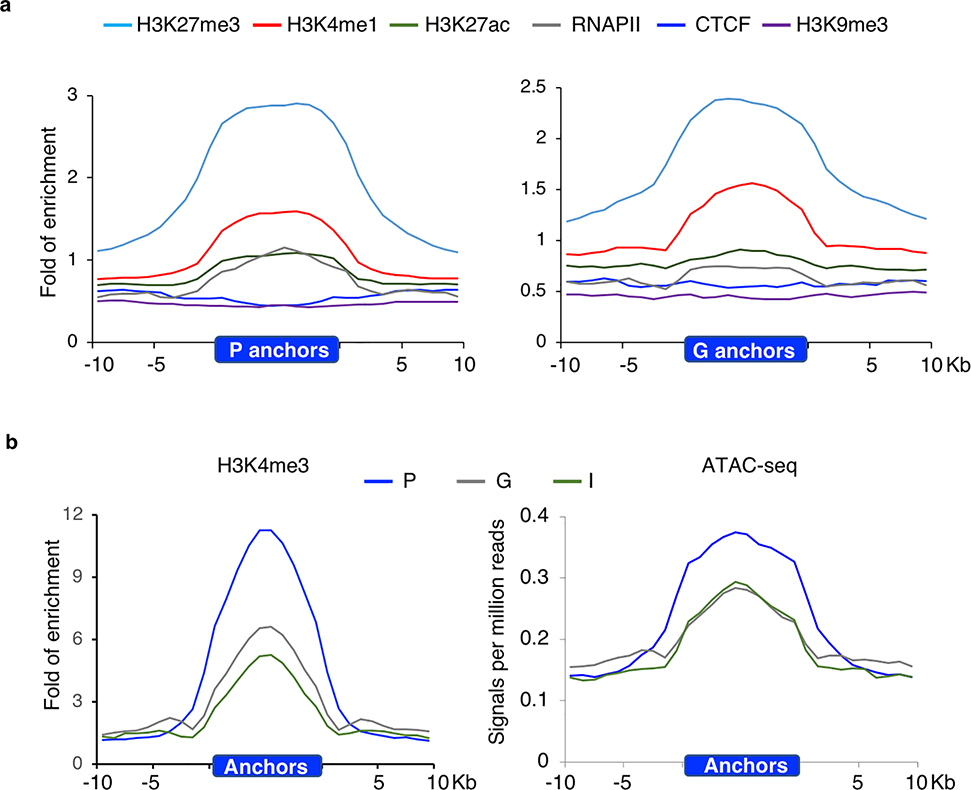
To characterize the chromatin states and functional features of the PRC2-bound silencers, profiles of chromatin signatures representing open chromatin accessibility (ATAC-seq), active and repressive histone modifications (H3K4me3, H3K4me1, H3K27ac, H3K27me3, H3K9me3) as well as RNAPII and insulator CTCF binding were either downloaded from ENCODE or generated in this study (Methods). Their enrichment within the non-coding intergenic interaction anchors (I, n = 1,800), the promoter anchors (P, n = 4,120) and intragenic anchors (G, n = 2,302) were examined. For all three anchor types, we observed the enrichment of H3K4me3 and ATAC-seq signals, as well as a moderate co-enrichment of H3K27me3 and H3K4me1, a signature previously identified for poised enhancers32 (Fig. 5a and Extended Data Fig. 9). We also surveyed these PRC2-bound silencers for the enrichment of regulatory function, including open chromatin and transcription factor binding (TFBS) annotated in the ENSEMBL regulatory build42, the key pluripotent TFBS43, and the CpG islands (CGI) from UCSC Genome Browser44. CGI was found with highest enrichment (average log2 fold enrichment 6.8), consistent to its involvement in PcG recruitment45,46. Regulatory features like open chromatin and TF binding were found over represented but enhancer signal was depleted in the PRC2-bound silencers (Supplementary Table 11). Furthermore, most of the TFs important for self-renewal and pluripotency, like MYC, SMAD1, were also found enriched in these PRC2-bound silencers, raising the possibility that these PRC2-bound silencers are the foci for multiple TF binding and these TFs could be important for PRC2-mediated transcriptional repression.
Fig. 5: Intergenic anchors exhibit the poised chromatin state and acquire enhancer signature during differentiation.
a. Enrichment fold of four histone modifications, RNAPII and CTCF binding over input control across ±10Kb of intergenic (I)-anchor regions. b. Heatmaps of H3K27ac, H3K27me3 and H3K9me3 normalized enrichment of the 1,800 I-anchors throughout progressive developmental stages in forebrain. The color scales represented the fold enrichment of ChIP over input.c. Enhancer activities of the PRC2 bound intergenic anchors in Nkx2–5 and Dlx3/4 loci observed in developing mouse embryos (heart in upper panel, mm1645 and hindbrain in lower panel, mm568) (www.enhancer.lbl.gov). d. Four distinct patterns of I-anchors based on the clustering of H3K27ac signal profiles across 74 different developmental stages collected from 12 tissues. The color scales represented the fold enrichment of ChIP over input. e. A model describes how PRC2 associated repressive chromatin foci contributing to TGS and transition into tissue specific enhancers during differentiation. PRC2 aggregated clusters are formed by extensive chromatin looping between silenced genes and their corresponding DREs. Upon differentiation, they are selectively dissolved, presumably in the absence of PRC2 binding. DREs acquire tissue specific enhancer signal and associate with RNAPII to activate their target gene expression.
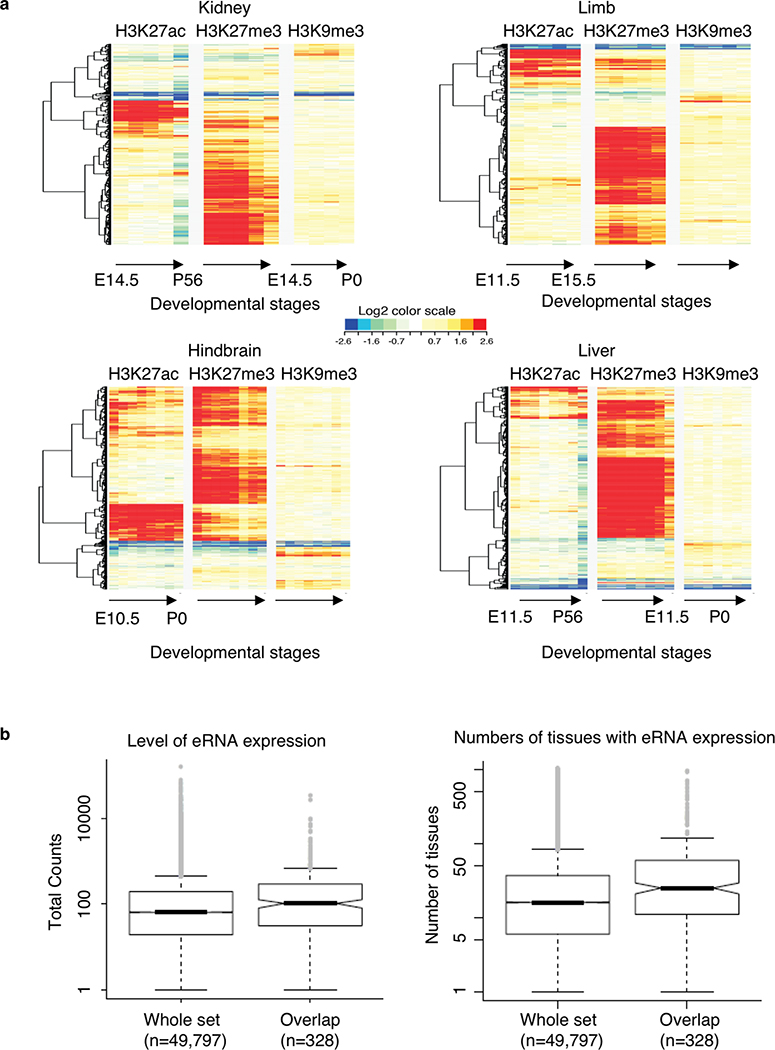
The enrichment of poised enhancer signature within the intergenic anchors suggests that these PRC2-bound silencers could transition into enhancers during ESC differentiation. To test this hypothesis, we surveyed the histone modification representing active enhancers (H3K27ac) and two repressive marks (H3K27me3 and H3K9me3) in these silencers throughout embryonic differentiation stages from E10.5 to postnatal day 0 (P0) or day 56 (P56) across 12 major mouse tissues (Supplementary Table 12 listed all ENCODE data used). In each tissue type, we detected H3K27ac enrichment with partial reduction of H3K27me3 in a subset of these regions (Fig. 5b, Extended Data Fig. 10a). To further verify their enhancer activities in the differentiated tissues, we searched the presence of validated mouse enhancers within these regions from the collection of the VISTA enhancer identified in mice (http://enhancer.lbl.gov)47 and eRNA expression in the developed tissues profiled by CAGE analysis in FANTOM548. 28 of the PRC2 bound DREs were found displaying VISTA enhancer activities in tissues ranging from heart, hindbrain to limb (Fig. 5c). Furthermore, 25% of PRC2 bound DREs exhibited eRNA expression. Compared with all FANTOM5-defined enhancer regions (n=49,797), the regions overlapped with PRC2 bound DREs (n=328) expressed eRNAs in more cell types (mean 70 vs 36; p-value 3.84E-11, one-sided Wilcoxon test) and at higher level (mean normalized CAGE tag counts 589 vs 274; p-value 3.84E-11) (Extended Data Fig. 10b). We were able to stratify the PRC2-bound silencers into four separate groups (Fig. 5d, Supplementary Table 13) based on their overall H3K27ac enrichment pattern across 74 developmental stages from 12 major tissue types. Group I DREs (n = 371) exhibit H3K27ac signal in multiple tissues and developmental stages, thus potentially functioning as common enhancers in multiple lineages. Group II DREs (n = 126) are strongly devoid of H3K27ac signal across all cell types and stages, possibly inert or inaccessible regions. Group III DREs (n = 683) exhibits enriched H3K27ac in only a few selective tissues or stages, suggesting their stage-specific enhancer activities; and Group IV DREs (n = 620) show little H3K27ac enrichment in any cell type surveyed here; these could be enhancers in other tissue types not included here.
Taken together, the PRC2 dependent chromatin connectivity configures the genome structures as the transcription silencing foci in the pluripotent genomes. Within the interaction networks, the PRC2 bound DREs can act as transcription silencers in a target-specific way to maintain the lineage specification genes in a repressive but poised chromatin state. Upon differentiation, these DREs can either remain bound by PRC2 in the silencing foci or convert into tissue specific enhancers, and the transitions between two regulatory states would be dependent on the chromatin conformation and the expression of stage- or tissue-specific transcription factors (Fig. 5e).
Discussion
In this study, we applied the PRC2 chromatin interaction analysis to reveal the widespread, highly precise and remarkably complex silencer associated chromatin connectivity networks in mESC genome. This is the first report to connect silencers to their target genes. Acting as a repressor complex, PRC2 bound to the silencer regulatory elements to induce chromatin compaction and sequester developmentally regulated genes into the condensed, sub-nuclear microenvironments where transcription silencing can be facilitated by increasing the local concentration of specific repressive factors, PRC2 complexes and coregulated gene clusters. Within the silencing hubs, these silencers could presumably function as the nucleation sites to initiate extensive chromatin looping. The disruption of these hubs impacts the chromatin conformation and disturbed the connected gene regulatory network critical for development.
In the last decade, transcriptional enhancers have emerged as the dominant class of regulatory elements in the non-coding portion of the mammalian genome49. Here, our PRCR interactome data confirm the fluidity of non-coding regulatory element with a dual-activity model which provide genomes with maximal versatility in expression regulation. These elements can function as both enhancers and silencers and the dynamic transcriptional regulatory activities of these functional elements are critically dependent on the nature of associated protein complexes, local sequence context and chromatin conformation. In contrast to thousands of protein-encoding gene knockouts in mice50,51, only few of the regulatory elements have been subjected to knockout analysis 52–54. It is noteworthy that the pleiotropic patterns of phenotypical aberration associated with the deletion in PRC2-bound silencers highlight the influence of these PRC2-bound silencers in multiple lineages of organismal development. This is similar to the effects of numerous variants found in the noncoding regulatory elements measured by the GWAS studies in many human diseases. Moreover, such results may have implications in the mechanisms involved in the silencing of tumor suppressor genes which predispose cells to tumor progression55. The delineation of silencer sequence contexts, their distribution, and diversity underscores the versatility of epigenetic-based transcription regulation and offers the exciting possibility of targeted re-expression of epigenetically silenced genes for therapeutic ramifications56.
Methods
Cell culture
Mouse embryonic stem cells (ESC) E14 were cultured under feeder-free conditions on 0.1% gelatin coated dishes in Knockout DMEM (Life Technologies) supplemented with 15% FBS (Hyclone), 2 mM L-glutamine (Life Technologies), 0.1 mM non-essential amino acids (Life Technologies), 100 U/ml Penicillin/Streptomycin (Life Technologies), 0.05 mM 2-mercaptoethanol (Sigma), 1,000 U/ml ESGRO mouse LIF Medium Supplement (Leukemia Inhibitory Factor) (Millipore) and maintained at 37ºC with 5% CO2. Cells were fed daily. Primary wild type WT B6 Neo and CRISPR knockout ES cell lines were cultured on irradiated mouse embryonic fibroblast (MEF) feeder layer with high glucose DMEM (Sigma) supplemented with 15% ES Cell FBS (Gibco), 1X non-essential amino acids (Gibco), 1X Glutamax (Thermo Fisher), 100 U/ml Penicillin/Streptomycin (Gibco), 1mM sodium pyruvate (Gibco), 0.1mM 2-mercaptoethanol (Gibco) and further supplemented with PD0325901 and CHIR99021 (Selleckchem). Cells were cultured onto feeder-free 0.1% gelatin coated dishes in Knockout DMEM (Life Technologies) prior to harvest.
Chromatin immunoprecipitation (ChIP)
Cells were harvested with trypsin (Invitrogen) and suspended in KO-DMEM (Gibco). Cross-linking was performed with 1.5mM EGS (ethylene glycolbis succinimidylsuccinate) (Sigma) for 45 min followed by 1% formaldehyde for 10 min at room temperature with constant shaking. The reaction was quenched with 0.2M Glycine (Sigma). The cells were washed with PBS (Ambion) supplemented with Protease Inhibitor (Roche). Cells were lysed twice in Lysis buffer (0.1% SDS, 50 mM HEPES-KOH pH 7.5, 150 mM NaCl, 1 mM EDTA, 1% Triton X-100, 0.1% sodium deoxycholate) for 15 min in 4ºC and centrifuged at 1000xg for 10 min. The cells were then sonicated (Branson) in Shearing Buffer (1.0% SDS, 50 mM HEPES-KOH pH 7.5, 150 mM NaCl, 1 mM EDTA, 1% Triton X-100, 0.1% sodium deoxycholate) for 3 min. The sheared chromatin was pre-cleared in 50μl of Protein A and G Dynabeads (Invitrogen). The pre-cleared chromatin was incubated on the antibody containing Dynabeads overnight in 4ºC for immunoprecipitation. Antibodies used are anti-SUZ12 (ab12073, Abcam), anti-EED (ab4469, Abcam), EZH2 (#39875, Active Motif), H3K27me3 (ab6002, Abcam), RNAPII (MMS126R, clone 8WG16, Covance) and CTCF (ab70303, Abcam). The beads were washed three times in Lysis Buffer, one time in High Salt Lysis Buffer (50 mM HEPES-KOH pH 7.5, 350 mM NaCl, 1 mM EDTA, 1% Triton X-100, 0.1% sodium deoxycholate, 0.1% SDS), followed by a wash in Washing Buffer (10 mM HEPES-KOH pH 7.5, 250 mM LiCl, 1 mM EDTA, 0.5% NP-40, 0.5% Sodium deoxycholate) and finally resuspended in TE buffer.
ChIP-seq library construction
Immunoprecipitated DNA was treated with end-repair, A-tailing, and ligation of Illumina compatible adapters (IDT, Inc) using the KAPA-Illumina library creation kit (KAPA biosystems). The ligated product was amplified with 8 cycles of PCR (KAPA biosystems). Libraries were sequenced on Illumina Miseq, Nextseq and Hiseq platforms.
ATAC-seq
ATAC-seq was performed on E14 cell lines as previously reported57. Libraries were sequenced on Illumina Miseq.
ChIA-PET library construction
ChIA-PET library was prepared as previously described28 with the following modifications. The proximity ligated chromatin complex was eluted with 1% SDS (Ambion) and de-crosslinked using proteinase K (Invitrogen) and purified using Zymo ChIP DNA Clean & Concentrator (Zymo Research). The purified fragments were tagmented using the Nextera DNA Sample Preparation Kit (Illumina). The linker ligated ChIA-PET constructs were selected using Sera-Mag Speed Beads Streptavidin-Blocked Magnetic Particles (GE Healthcare). The magnetic beads were blocked with yeast tRNA (Ambion) prior to the selection. The streptavidin selected constructs were amplified with 8–10 cycles of PCR and purified using Ampure XP beads (Beckman Coulter). For the primary mES B6NJ and KO cell clones, the library were prepared with an in situ approach where crosslinked cells were lysed and digested with AluI enzyme (NEB). Fragmented DNA ends were A-tailed and ligated with biotinylated linker overnight58. The ligated chromatin were then sheared by sonication and immunoprecipitated with anti-Ezh2 antibody. The immunoprecipitated DNA were subjected to tagmentation, biotin selection and amplication. Libraries were sequenced on Illumina Nextseq, Hiseq and Novaseq platforms.
RNA-seq library construction
Total RNA was extracted using the RNeasy Mini Kit (Qiagen). RNA-seq libraries were generated using the Illumina Truseq Stranded RNA LT kits. mRNA was purified from 1μg of total RNA using magnetic beads containing poly-T oligos. RNA was fragmented using divalent cations and high temperature. The fragmented RNA was reversed transcribed using random hexamers and reverse transcriptase Superscript II (Invitrogen) followed by second strand synthesis. The fragmented cDNA was treated with end repair, A-tailing, adapter ligation and 10 cycles of PCR. Libraries were sequenced on the Illumina Hiseq and Novaseq.
CRISPR/Cas9 Targeted knockout mouse generation and characterization
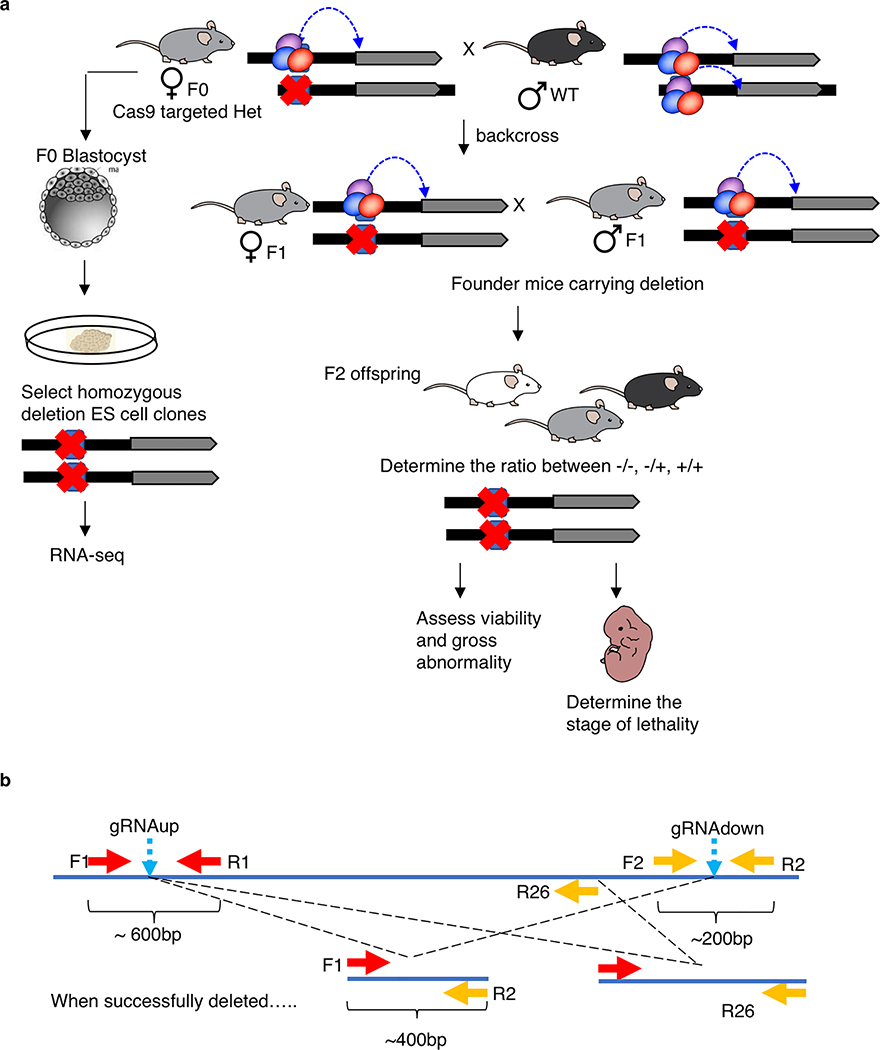
The 21 target regions screened were listed in Supplementary Table 7. Cas9 RNP including Cas9 protein and sgRNA were electroporated into around 100 C57BL/6NJ mouse zygotes using the ZEN (zygote electroporation of nucleases) technology59. After electroporation, 15 zygotes were transferred to a pseudo-pregnant mouse to generate KO mice, 4 transfers for each gene locus. The remaining zygotes were kept in culture in vitro. When these zygotes entered blastocyst stage, they were plated into 96-well plates with MEF feeder cells to generate mouse ES cells. Around 80% of the plated blastocytes successfully generated ES cells. The ES cells were kept in culture, expanded and genotyped for genomic loci KO using the established genotyping strategies. With this method, the brightness of the intermediate band approximately indicate the amount of cells with gene KO. The mouse ES cells with the brightest intermediate band were used for single cell clone screening as described before. Briefly, the ES cells were diluted and plated on a 10 cm dish with MEFs cells as the feeder layer. The single clones grew after plating and were picked and transferred to 96-well plates. The ES cells from single clones were expanded and genotyped using similar strategies (Extended Data Fig. 3b). To determine the gender of the KO mES cell lines, we adopted the strategy using Rbm31x/y method as described previously60. The homozygous KO clones were selected for further expansion and cryo-preserved.
For KO mice generation, Founder (F0) mice were genotyped to screen for deletion events by PCR across the cutting sites of expected deleted regions and the confirmed heterozygous female were bred with wild-type male to expand the knockout lines. For embryonic analysis, a single allele from the chr9 line was expanded, timed mating performed, and embryos dissected and examined at embryonic day 9.5 (E9.5). For assessing viability, we only considered viable (visible heartbeat) embryos with unambiguous genotypes.
Phenotyping screening
All procedures and protocols were approved by the Jackson Laboratory Animal Care and Use Committee and were conducted in compliance with the National Institute of Health Guideline for Care and Use of Laboratory Animals. Systematic mouse phenotyping screen was conducted for five homozygous silencer KO strains using a broad-based phenotyping pipeline40,41 established by the Knockout Mouse Phenotyping Program (KOMP2) and the International Mouse Phenotyping Consortium (IMPC). The JAX KOMP2 pipeline assessed 14 major domains of 126 traits associated with development, behavior and physiology. To determine the significance of the phenotypes changes, cohorts of at least five age-matched, sex-matched wild-type C57BL6/NJ mice were phenotyped alongside for each test. Statistical analysis was performed using PhenStat R package61. For categorical data including eye and shirpa procedure, Fisher’s Exact test was used, while continuous data analysis was performed using Linear Mixed Model framework in PhenStat which uses linear mixed models in which batch (date of test) was included as a random effect and body weight as a covariate. The association of significance were adjusted for multiple testing using the Benjamini–Hochberg procedure62 to control the FDR at 5%.
Confirmation of the deletion regions in the KO ES clones
DNA was extracted using All Prep DNA/RNA Mini kit (Qiagen) according to manufacturer’s instruction. PCR was performed using with 2X Kapa HiFi HotStart Ready Mix (Kapa Biosystems) with 3 min denaturation at 95°C, followed by 25–30 cycles of 20s at 98°C, 15s at 65°C and 15s at 72°C and a final elongation of 1 min at 72°C. Primer sequences used are listed in Supplementary Table 7.
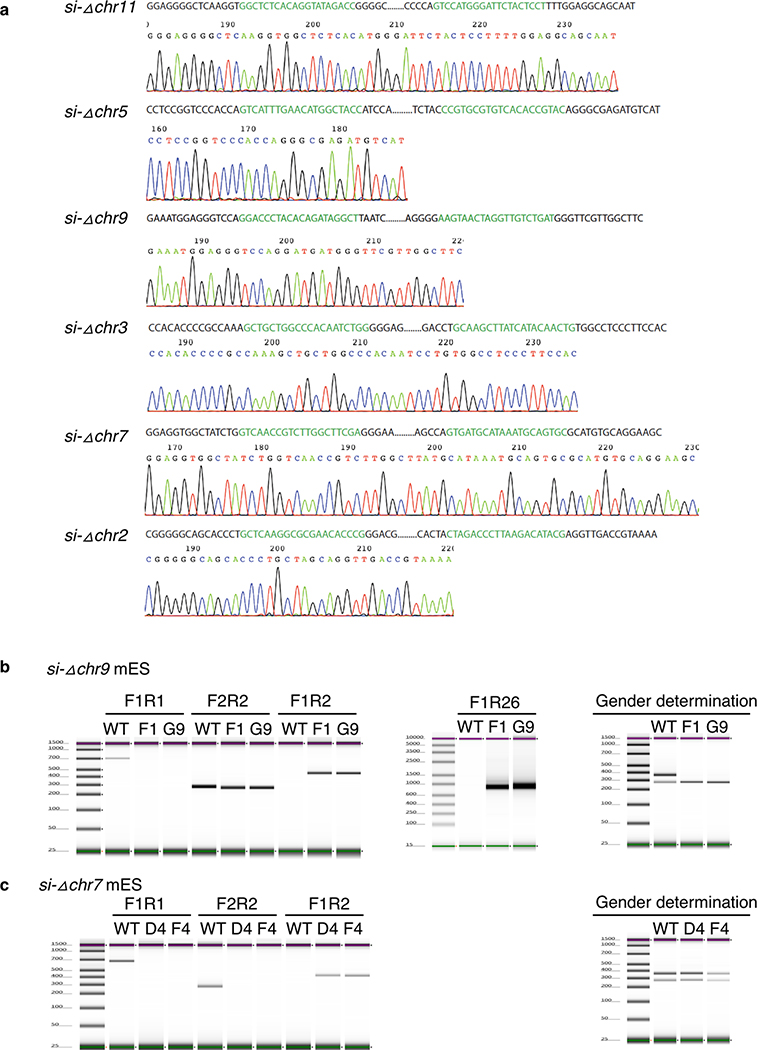
To detect the deletion events in the target loci, a strategy using two pairs of primers (F1/R1/F2/R2) was used. In the control group, when the two pairs of primers are used in the PCR reaction, the first pair (F1/R1) yields a PCR product around 600bp and the second pair yields a PCR product around 200bp. In the electrophoresis analysis, there will be two bands at 600bp and 200bp respectively. If a deletion event is generated, primers R1 and F1 lost their binding site. Only F1 and R2 are functional to generate a PCR product around 400bp in length (Extended Data Fig. 3b).
ChIA-PET Data processing, interaction calling and annotation
ChIA-PET data was processed with ChIA-PET Utilities, a scalable re-implementation of ChIA-PET Tools63 (see code availability). Briefly, sequencing adaptors incorporated during the tagmentation reaction in the library construction process were removed from the paired reads. To distinguish chimeric ligation events from intra-molecular ligation, two types of linker-ligated chromatin fragments (linkers A and B) were used at equal amounts in the proximity ligation (for details see4). The paired reads were binned into either intra-molecular (A-A or B-B) or inter-molecular (A-B) PETs based on their linker sequence and only the intra-molecular ligated PETs were analyzed. Tags identified (>=18bp) were mapped to mouse genome (mm10) using BWA alignment64 and mem65 according to their tag length. The duplicated pair-end tags arising from clonal PCR amplification were filtered and the uniquely mapped, non-redundant PETs were calssified as inter-chromosomal (L tags and R tags mapped onto different chromosomes), intra-chromosomal (L tags and R tags mapped onto the same chromosome with genomic distance > 8Kb) and self-ligation PETs (L tags and R tags mapped onto the genome ≤ 8Kb). Multiple intra-chromosomal PETs whose respective ends found within 1 Kb were then clustered (PET counts or iPET represents the strength or frequency of the interaction). The 1Kb distance was chosen because of the broader PRC2 binding profile in distance. We further performed statistical assessment of the PET clusters interaction significance using ChiaSigScaled (see code availability), a scalable re-implementation of ChiaSig66. Interaction clusters with member size 3 and above (iPET 3+) and FDR<0.05 were reported.
In the process of constructing ChIA-PET libraries, Tn5 transposon mediated tagmentation was applied to generate chromatin fragments with compatible ends for Illumina library adaptors. Tn5 has known tagmentation bias towards certain sequence context, which resulted in excess sequence coverage and false-positive interaction calls at specific genomic locations. These regions can be defined by the their exceptionally high level of ChIP enrichment defined by reads from ChIA-PET sequences regardless of the protein factors used. To distinguish these regions, we applied peak calling onto approximate 600 million reads collected from multiple ChIA-PET libraries using MACS2 (see Binding peak calling in ChIP-seq analysis) and normalized by ChIP-seq input data, to derive 52,964 peak regions with fold-enrichment ranging between 1.2 to 12144 (median: 2.3; 99th percentile: 22.7). Based on the distribution of the fold-enrichment scores, we defined 53 most enriched regions (minimum fold-enrichment is 115, top 0.1% ranked in enrichment scores) followed by visual inspection of their read coverage profiles across multiple tagmentation based ChIA-PET libraries. These regions (Supplementary Table 14) were treated as the blacklist regions and used to remove any interactions with whose anchors overlapped from further analysis.
Next, the interactions were classified based on their anchors overlapped with gene models in gencode.vm14.grcm38 (accessed date 2017–10-03). Each anchor was annotated with gene that overlapped at 1bp overlap. To classify each anchor, priority was given to promoter (P) region (defined as ±2.5kb of TSS) followed by gene region (G). Anchors that do not overlap with any gene or promoter region were classified as intergenic (I). The interaction classification is just the combination of its anchors classification with additional prefix “s” should both anchors overlap common gene(s).
ChIP-seq data analysis
Single-end reads were quality trimmed along with the adapter if present using cutadapt (options: -e 0.2 -a AGATCGGAAGAGC --minimum-length 20 --trim-n -n 3). The trimmed-reads were mapped on the mm10 genome using ‘bwa aln’, and only the reads mapped uniquely onto the genome were collected followed by removing duplicates. Peak calling was performed on ChIP-seq and ChIA-PET reads using MACS2.1.0.2015122267 with flags --keep-dup all --nomodel --extsize 250 -B –SPMR -g mm. Narrow peaks results were collected for all factors, except H3K27me3 where broad peaks were called. Besides the data we generated, we also included ENCODE public data sets. Using the same pipeline, we processed H3K27ac (ENCFF001KFX) and H3K4me1 (ENCFF001KFE) with ENCFF071UWJ as the input control. We simply downloaded and used the pre-calculated fold-change enrichment data for H3K9me3 (Encode bigWig file ENCFF857TIJ).
Consistency between ChIA-PET biological replicates
To assess the consistency of ChIA-PET replicates, we performed correlation analysis among replicates. First, interaction matrix with 500kb binning containing PET counts was constructed for each library. Blacklist regions were excluded from computation. In addition, a matrix aggregated from all libraries with the same protein factor was calculated to select the bins representing frequent interacting regions. This selection was made to minimize effect of predominant sparse interactions (zero elements in the matrices) when calculating the correlation. The sums of every bin in the aggregate matrix were computed. The 20% bins with the highest counts were selected to be included in correlation computation. Pairwise Pearson’s correlation coefficient, r, was computed for libraries within the same protein factor. r values were influenced by the sequencing depth so replicates with lower numbers of sequencing reads generally yielded lower r values.
RNA-seq and differential gene expression analysis of the KO ES lines
Reads were trimmed using Trim Galore!68 to remove adapters and low-quality portion of the reads. Trimmed reads were aligned to mm10 genome and gencode.vm14.grcm38 transcripts with hisat2 (version 2.1.0)69. We used HTSeq70 to quantify the mapped transcripts, with parameters for reverse strandedness (-s=reverse) and assigning reads that are assigned to more than one feature to all aligned featured (–nonunique=all). Gene models known as not transcribed by RNA polymerase II like pseudogenes, snoRNA, snRNA, miscRNA and riboRNA were removed to yield 30,517 gene models; for subsequent RNA-seq analysis we examined the 28,657 genes located on autosomes. Using the transcript quantifications from HTseq for the 28,657 genes, we performed differential gene expression analysis with R package DESeq271. We performed the following analysis for each dataset separately: si-Δchr9 (N si-Δchr9-F1=2, N si-Δchr9-G9=3) and wildtype (Nwildtype=3) or si-Δchr7 (N si-Δchr7-F4=3, N si-Δchr7-D4=3) and wildtype (Nwildtype=3). First, we normalized the counts using DESeq2’s built-in count normalization approach (i.e. counts(dds, normalized=TRUE)). Then, we performed differential expression analysis using DESeq2 between knock out and wildtype and applied shrinkage for log2 fold change estimation using lfcShrink from the DESeq2 package. P-values were adjusted using the method of Benjamini and Hochberg62. Genes were considered dysregulated (differentially expressed) when the adjusted p-value < 0.05 and either log2 fold change > 2 or log2 fold change < −2.
Feature analysis of PRC2 bound distal regulatory elements (DRE)
The features explored were open chromatin, TFBS and enhancer frim the ENSEMBL regulatory build42, the key pluripotent TFBS43, and CGI from UCSC Genome Browser44. Specifically, the fold enrichment is the fraction of observed overlap between the 1800 DREs and the feature against the expected background established from 1000 simulations. For each simulation, the DREs were randomly permuted on the chromosome with shuffleBed disallowing overlapping amongst the permuted DREs, the N regions and blacklist. The number of the shuffled DREs that overlap the features is recorded to establish the average and standard deviation of the expected background. The Z-score / standard score is computed as the signed fractional number of the background standard deviations by which the empirical observations is above the background mean.
Gene Ontology Analysis
We performed GO enrichment analysis on 5,825 genes (Supplementary Table 5) that were involved in BA-interactions against the 24,692 genes without BA-interactions using GOrrilla (http://cbl-gorilla.cs.technion.ac.il) with “Mus musculus” selected as reference. The set of 5,825 genes was uploaded as the target, and the set of 24,692 genes was uploaded as the background.
Hi-C data processing
We processed the mESC Hi-C data (GSE35156)35 with Juicer tools72 and produced the hic file. Using HiTC (R Bioconductor package)73, we then called the A/B compartments using gene density data (in R library BSgenome.Mmusculus.UCSC.mm10) by calling ‘pca.hic.regular’ function.
To investigate the interaction between si-Δchr9 to the 29 derepressed genes in the KO clones, we interrogate the most recent high resolution Hi-C data on mESC (GEO number: GSE96107; All 14 runs of HiC_ES_1 SRX2636666)25. A total of over 2.5 billion read was processed with Juicer tools72. The processed reads resulted 1.2 billion Hi-C contacts, then a genome-wide interaction matrix with 100 kb resolution was generated and ICE-normalized for analysis. We identified the bins where those gene loci were located in the interaction frequency (IF) matrix. In this analysis, we only focus on trans-chromosomal interactions: si-Δchr9 on chr9 with 26 derepressed genes on different chromosomes (3 genes on chr9 were excluded). The average trans-chromosomal interaction frequencies (TIF) of si-Δchr9 bin to the bins that housed these genes was computed. This value was then compared with random picked genes. The distribution of random bins on different chromosomes followed the distribution of chromosomes in the real case. The random picks were permuted 100,000 times, and the average TIF between si-Δchr9 and random picks was computed for each permutation. We observed that the average TIF of si-Δchr9 to the derepressed genes was significantly higher than that of the random picks (Wilcoxon tests’ p-values < 2.2E-16). Another background model we tested comprised of all bins that contained genes (the 30,517 gene model) but excluding bins where repressed genes resided. We repeated the random permutation 100,000 times, and concluded that the average TIF between si-Δchr9 and derepressed genes was significantly higher than that of random background (Wilcoxon test p-values < 2.2E-16).
Extended Data
Extended Data Fig. 1: Reproducibility of PRC2 ChIA-PET analysis.
a. Pearson correlation coefficient, r, between individual ChIA-PET replicates for EED (n=6), EZH2 (n=7), SUZ12 (n=11) and the combined PRC2 libraries between three subunits. See Supplementary Table 1 for sample details. b. PRC2 chromatin interactions and binding profile across chr4:139,536,779–140,286,920. Tracks from the top: BA interaction, PRC2 binding profiles and SA interactions. Y-axis: interaction frequency represented by PET counts. c. Distribution of interaction frequency among BA and SA interactions. Each box represents first quartile (bottom) and third quartile (top) with median in the middle. Whiskers represent data range defined as 1.5 times interquartile from median (Q2 +/− 1.5*(Q3-Q1)).
Extended Data Fig. 2: Extensive chromatin interactions between DREs and PRC2 bound genes.
a. Examples of the multiple co-occurred chromatin looping patterns (P-P, P-G, P-I and intra-G interactions) in the Wnt6-Ihh (chr1:74,751,523–74,968,999) and Hoxb (chr11:96,161,617–96,425,610) regions are shown from EED (red), EZH2 (purple), SUZ12 (blue) and PRC2 (black) ChIA-PET libraries, respectively. b. Percentages of genes exhibit single, 2-type, 3-type and all 4-type of interactions. For example, among the 4,372 genes with P-P interactions, 14% of them have all 4-type of interactions (P-P, P-I, P-G and intra-G looping). c. Proposed model on how DREs can connect to their target genes and function as either enhancers or silencers by binding to RNAPII or PRC2.
Extended Data Fig. 3: Experimental validation of intergenic silencers in vivo.
a. Schematic overview of generating heterozygous founder mice strains and ES clones carrying deletion in the intergenic anchors by CRISPR/Cas9. b. Schematic description of genotype strategy and primer design used in screening of KO mice and derived ES clones.
Extended Data Fig. 4: Intergenic anchors deleted in the mouse KO strains by CRISPR-Cas9.
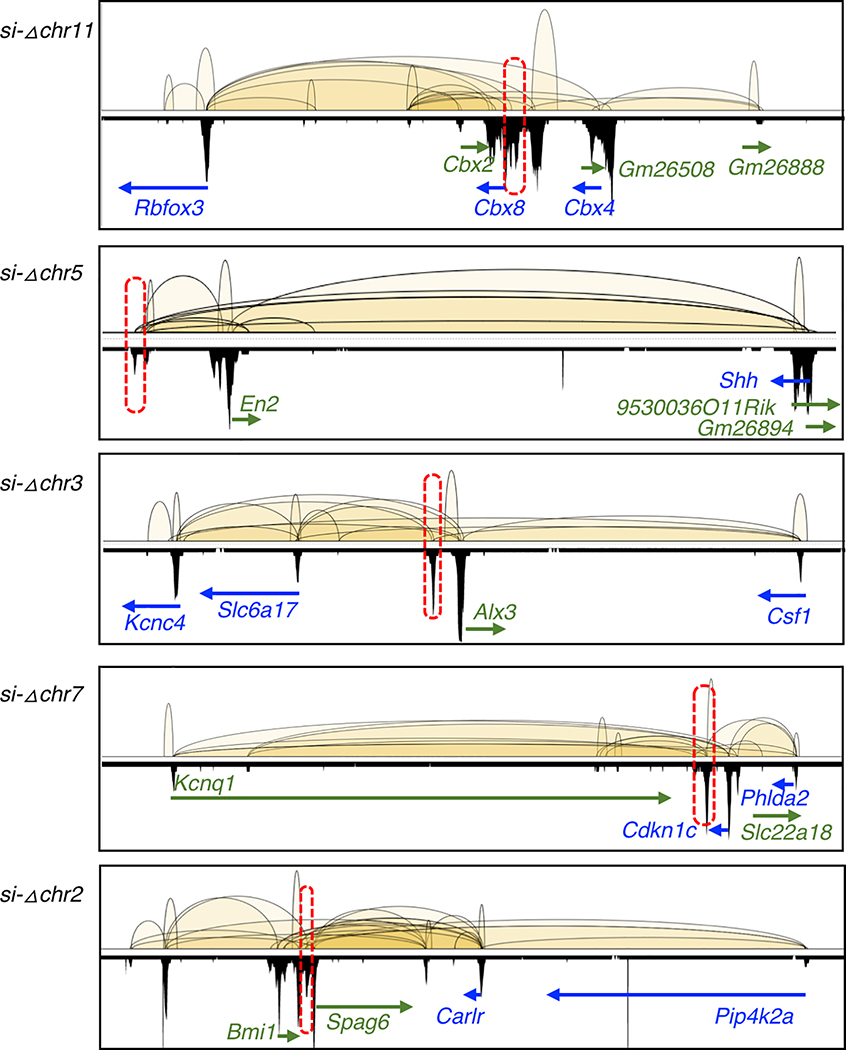
PRC2 interactions and binding profiles from 5 of the 6 KO regions (si-Δchr9 is shown in Figure 3a). Selective genes connected by the KO regions through the PRC2 loops are labelled. Chromosome location (from top to bottom) are as follow; chr11:118,861,894–119,194,521, chr5:28,100,320–28,484,061, chr3:107,423,514–107,782,737, chr7:143,061,554–143,537,289 and chr2:18,568,747–19,024,016.
Extended Data Fig. 5: Validation of KO.
a. Genotype confirmation by Sanger sequencing of the PCR products for all six successfully generated KO clones. b. PCR genotyping of KO derived mES clones to confirm deletion (deleted region on chromosome 9) in si-Δchr9 derived F1 and G9 clones, in triplicate (only representative results are shown here) in two independent experiments.. Additional primer R26 was designed to confirm heteroallelic deletion. Panel on the right determination of the gender of the KO clones are XY while wild type ES line is XX (refers to Methods). c. Genotyping by PCR to confirm deletion (deleted region on chromosome 7) in si-Δchr7 derived mES D4 and F4 clones.
Extended Data Fig. 6: The loss of connectivity triggers genes reactivation.
a. Heatmap showing connectivity in previous study using Hi-C and current study using ChIA-PET. Example shown is chr1:36,282,810–192,258,731. b. Topological-associated domain analysis showed no difference in si-Δchr9, si-Δchr7 compared to wildtype. c. Loss of connecting loops in si-Δchr7 clones D4 and F4. Shown are chr7:142,557,623–14,3646,256 and zoom in region chr7:143,127,114–14,3550,277. d. Genes expression of connected of si-Δchr7 and non-connected genes from flanking 500kb and 1Mb regions. Only clone D4 is shown. n indicates number of genes in each category. See details in Supplementary Table 8B.
Extended Data Fig. 7: Upregulation of genes associated with si-Δchr7.
PRC2 interaction and binding profiles of the 1 Mb Igf2/Kcnq1 imprinting region. The si-Δchr7 (chr7:143,440,438–143,450,716) is marked in red. Three of the 10 genes with P-I interactions to this KO region located 15.5 Mb upstream. b. Normalized RNA-seq counts of the connected genes in wild type (+/+) (n=3) and 2 independent homozygous KO (−/−) ES clones D4 (n=3) and F4 (n=3). Gm44732 has no expression. N indicates number of biologically independent samples.
Extended Data Fig. 8: Upregulation of genes associated with si-Δchr9.
a. Venn diagram of differentially upregulated genes in si-Δchr9 clones F1 and G9. Differentially expressed genes in homozygous KO (−/−) ES clones G9 (n=3) compared with wild type (+/+) ESC (n=3) shown in volcano plot (p-value vs. fold change). Dysregulated genes found in both F1 and G9 (red), F1 only (orange) and G9 only (blue) are color labelled. Selected genes with the most striking upregulation are labelled. b. Circos plot shows the inter-chromosomal connectivity (iPET counts > 10) between the KO allele with the 29 upregulated gene loci. c. The distribution of interaction frequencies between the si-Δchr9 KO silencer locus and random background #1 (Left) or #2 (Right). TIFs between si-Δchr9 and the dysregulated genes are shown as red lines.
Extended Data Fig. 9: Histone profiles of PRC2 interaction anchors.
a. Enrichment fold of four histone modifications, RNAPII and CTCF binding over input across ±10Kb of promoter (P) and Gene (G)- anchor regions. b. Enrichment of H3K4me3 and ATAC-seq profile across ± 10 Kb of the promoter (P), gene (G) and intergenic (I) interaction anchors.
Extended Data Fig. 10: Features of intergenic anchors in developmental stages.
a. Heat maps H3K27me3, H3K27ac, H3K9me3 normalized signals of the 1,800 I-anchors through progressive developmental stages of kidney, limbs, hindbrain and liver. The color scales represented the fold enrichment of the ChIP vs input at log2 scale. b. Expression of eRNA in distal regulatory elements (DREs) and those overlapped with PRC2-bound silencers. Each box represents first quartile (bottom) and third quartile (top) with median in the middle. Whiskers represent data range defined as 1.5 times interquartile from median (Q2 +/− 1.5*(Q3-Q1)). Points above whiskers represent outliers.
Supplementary Material
Acknowledgments
The authors thank Drs. Ryan Tewhey and Carmen Robinett for their feedback and comments on the manuscript, Dr. Jim Denegre for coordinating mouse KO models generation and Dr. Alyssa Lau for her assistance on the art images. Research reported in this publication was partially supported by the 4DN (U54 DK107967) and ENCODE (UM1 HG009409) consortia. C.-L.W. is supported by NIGMS R01 GM127531-01A1. C.-L.W. and C.Y.N. are supported by NCI under Award Number P30CA034196. A portion of this work was conducted under the support from U.S. Department of Energy Joint Genome Institute by the Office of Science of the U.S. Department of Energy under Contract No. DE-AC02-05CH11231.
Footnotes
Life Science Reporting Summary included.
Code Availability
ChIA-PET Utilities (code available at https://github.com/cheehongsg/CPU)
ChiaSigScaled (code available at https://github.com/cheehongsg/ChiaSigScaled)
Competing Financial Interest
We declare that none of the authors have competing financial or non-financial interests.
Data availability statement
All data described in this study are being deposited in NCBI’s Gene Expression Omnibus GSE120393.
Reference
- 1.Young RA Control of the embryonic stem cell state. Cell 144, 940–54 (2011). [DOI] [PMC free article] [PubMed] [Google Scholar]
- 2.Cook PR A model for all genomes: the role of transcription factories. J Mol Biol 395, 1–10 (2010). [DOI] [PubMed] [Google Scholar]
- 3.Saurin AJ et al. The human polycomb group complex associates with pericentromeric heterochromatin to form a novel nuclear domain. J Cell Biol 142, 887–98 (1998). [DOI] [PMC free article] [PubMed] [Google Scholar]
- 4.Zhang Y et al. Chromatin connectivity maps reveal dynamic promoter-enhancer long-range associations. Nature 504, 306–310 (2013). [DOI] [PMC free article] [PubMed] [Google Scholar]
- 5.Chakalova L & Fraser P Organization of transcription. Cold Spring Harb Perspect Biol 2, a000729 (2010). [DOI] [PMC free article] [PubMed] [Google Scholar]
- 6.Maston GA, Evans SK & Green MR Transcriptional regulatory elements in the human genome. Annu Rev Genomics Hum Genet 7, 29–59 (2006). [DOI] [PubMed] [Google Scholar]
- 7.Ogbourne S & Antalis TM Transcriptional control and the role of silencers in transcriptional regulation in eukaryotes. Biochem J 331 ( Pt 1), 1–14 (1998). [DOI] [PMC free article] [PubMed] [Google Scholar]
- 8.Feuerborn A & Cook PR Why the activity of a gene depends on its neighbors. Trends Genet 31, 483–90 (2015). [DOI] [PubMed] [Google Scholar]
- 9.Boyer LA et al. Polycomb complexes repress developmental regulators in murine embryonic stem cells. Nature 441, 349–53 (2006). [DOI] [PubMed] [Google Scholar]
- 10.Bracken AP, Dietrich N, Pasini D, Hansen KH & Helin K Genome-wide mapping of Polycomb target genes unravels their roles in cell fate transitions. Genes Dev 20, 1123–36 (2006). [DOI] [PMC free article] [PubMed] [Google Scholar]
- 11.Chamberlain SJ, Yee D & Magnuson T Polycomb repressive complex 2 is dispensable for maintenance of embryonic stem cell pluripotency. Stem Cells 26, 1496–505 (2008). [DOI] [PMC free article] [PubMed] [Google Scholar]
- 12.Pasini D, Bracken AP, Hansen JB, Capillo M & Helin K The polycomb group protein Suz12 is required for embryonic stem cell differentiation. Mol Cell Biol 27, 3769–79 (2007). [DOI] [PMC free article] [PubMed] [Google Scholar]
- 13.Faust C, Lawson KA, Schork NJ, Thiel B & Magnuson T The Polycomb-group gene eed is required for normal morphogenetic movements during gastrulation in the mouse embryo. Development 125, 4495–506 (1998). [DOI] [PubMed] [Google Scholar]
- 14.O’Carroll D et al. The polycomb-group gene Ezh2 is required for early mouse development. Mol Cell Biol 21, 4330–6 (2001). [DOI] [PMC free article] [PubMed] [Google Scholar]
- 15.Pasini D, Bracken AP, Jensen MR, Lazzerini Denchi E & Helin K Suz12 is essential for mouse development and for EZH2 histone methyltransferase activity. EMBO J 23, 4061–71 (2004). [DOI] [PMC free article] [PubMed] [Google Scholar]
- 16.Tiwari VK et al. PcG proteins, DNA methylation, and gene repression by chromatin looping. PLoS Biol 6, 2911–27 (2008). [DOI] [PMC free article] [PubMed] [Google Scholar]
- 17.Ogiyama Y, Schuettengruber B, Papadopoulos GL, Chang JM & Cavalli G Polycomb-Dependent Chromatin Looping Contributes to Gene Silencing during Drosophila Development. Mol Cell 71, 73–88 e5 (2018). [DOI] [PubMed] [Google Scholar]
- 18.Bantignies F et al. Polycomb-dependent regulatory contacts between distant Hox loci in Drosophila. Cell 144, 214–26 (2011). [DOI] [PubMed] [Google Scholar]
- 19.Tiwari VK, Cope L, McGarvey KM, Ohm JE & Baylin SB A novel 6C assay uncovers Polycomb-mediated higher order chromatin conformations. Genome Res 18, 1171–9 (2008). [DOI] [PMC free article] [PubMed] [Google Scholar]
- 20.Schoenfelder S et al. Polycomb repressive complex PRC1 spatially constrains the mouse embryonic stem cell genome. Nat Genet 47, 1179–1186 (2015). [DOI] [PMC free article] [PubMed] [Google Scholar]
- 21.Denholtz M et al. Long-range chromatin contacts in embryonic stem cells reveal a role for pluripotency factors and polycomb proteins in genome organization. Cell Stem Cell 13, 602–16 (2013). [DOI] [PMC free article] [PubMed] [Google Scholar]
- 22.Vieux-Rochas M, Fabre PJ, Leleu M, Duboule D & Noordermeer D Clustering of mammalian Hox genes with other H3K27me3 targets within an active nuclear domain. Proc Natl Acad Sci U S A 112, 4672–7 (2015). [DOI] [PMC free article] [PubMed] [Google Scholar]
- 23.Wani AH et al. Chromatin topology is coupled to Polycomb group protein subnuclear organization. Nat Commun 7, 10291 (2016). [DOI] [PMC free article] [PubMed] [Google Scholar]
- 24.Kundu S et al. Polycomb Repressive Complex 1 Generates Discrete Compacted Domains that Change during Differentiation. Mol Cell 65, 432–446 e5 (2017). [DOI] [PMC free article] [PubMed] [Google Scholar]
- 25.Bonev B et al. Multiscale 3D Genome Rewiring during Mouse Neural Development. Cell 171, 557–572 e24 (2017). [DOI] [PMC free article] [PubMed] [Google Scholar]
- 26.Tolhuis B et al. Interactions among Polycomb domains are guided by chromosome architecture. PLoS Genet 7, e1001343 (2011). [DOI] [PMC free article] [PubMed] [Google Scholar]
- 27.Li L et al. Widespread rearrangement of 3D chromatin organization underlies polycomb-mediated stress-induced silencing. Mol Cell 58, 216–31 (2015). [DOI] [PMC free article] [PubMed] [Google Scholar]
- 28.Fullwood MJ et al. An oestrogen-receptor-alpha-bound human chromatin interactome. Nature 462, 58–64 (2009). [DOI] [PMC free article] [PubMed] [Google Scholar]
- 29.Margueron R et al. Role of the polycomb protein EED in the propagation of repressive histone marks. Nature 461, 762–7 (2009). [DOI] [PMC free article] [PubMed] [Google Scholar]
- 30.Oksuz O et al. Capturing the Onset of PRC2-Mediated Repressive Domain Formation. Mol Cell 70, 1149–1162 e5 (2018). [DOI] [PMC free article] [PubMed] [Google Scholar]
- 31.Cruz-Molina S et al. PRC2 Facilitates the Regulatory Topology Required for Poised Enhancer Function during Pluripotent Stem Cell Differentiation. Cell Stem Cell 20, 689–705 e9 (2017). [DOI] [PubMed] [Google Scholar]
- 32.Rada-Iglesias A et al. A unique chromatin signature uncovers early developmental enhancers in humans. Nature 470, 279–83 (2011). [DOI] [PMC free article] [PubMed] [Google Scholar]
- 33.Zentner GE, Tesar PJ & Scacheri PC Epigenetic signatures distinguish multiple classes of enhancers with distinct cellular functions. Genome Res 21, 1273–83 (2011). [DOI] [PMC free article] [PubMed] [Google Scholar]
- 34.Shin H et al. TopDom: an efficient and deterministic method for identifying topological domains in genomes. Nucleic Acids Res 44, e70 (2016). [DOI] [PMC free article] [PubMed] [Google Scholar]
- 35.Dixon JR et al. Topological domains in mammalian genomes identified by analysis of chromatin interactions. Nature 485, 376–80 (2012). [DOI] [PMC free article] [PubMed] [Google Scholar]
- 36.Shen X et al. EZH1 mediates methylation on histone H3 lysine 27 and complements EZH2 in maintaining stem cell identity and executing pluripotency. Mol Cell 32, 491–502 (2008). [DOI] [PMC free article] [PubMed] [Google Scholar]
- 37.Brand AH, Breeden L, Abraham J, Sternglanz R & Nasmyth K Characterization of a “silencer” in yeast: a DNA sequence with properties opposite to those of a transcriptional enhancer. Cell 41, 41–8 (1985). [DOI] [PubMed] [Google Scholar]
- 38.Gray S & Levine M Transcriptional repression in development. Curr Opin Cell Biol 8, 358–64 (1996). [DOI] [PubMed] [Google Scholar]
- 39.Imakaev M et al. Iterative correction of Hi-C data reveals hallmarks of chromosome organization. Nat Methods 9, 999–1003 (2012). [DOI] [PMC free article] [PubMed] [Google Scholar]
- 40.Dickinson ME et al. High-throughput discovery of novel developmental phenotypes. Nature 537, 508–514 (2016). [DOI] [PMC free article] [PubMed] [Google Scholar]
- 41.Meehan TF et al. Disease model discovery from 3,328 gene knockouts by The International Mouse Phenotyping Consortium. Nat Genet 49, 1231–1238 (2017). [DOI] [PMC free article] [PubMed] [Google Scholar]
- 42.Zerbino DR, Wilder SP, Johnson N, Juettemann T & Flicek PR The ensembl regulatory build. Genome Biol 16, 56 (2015). [DOI] [PMC free article] [PubMed] [Google Scholar]
- 43.Chen X et al. Integration of external signaling pathways with the core transcriptional network in embryonic stem cells. Cell 133, 1106–17 (2008). [DOI] [PubMed] [Google Scholar]
- 44.Gardiner-Garden M & Frommer M CpG islands in vertebrate genomes. J Mol Biol 196, 261–82 (1987). [DOI] [PubMed] [Google Scholar]
- 45.Deaton AM & Bird A CpG islands and the regulation of transcription. Genes Dev 25, 1010–22 (2011). [DOI] [PMC free article] [PubMed] [Google Scholar]
- 46.Ku M et al. Genomewide analysis of PRC1 and PRC2 occupancy identifies two classes of bivalent domains. PLoS Genet 4, e1000242 (2008). [DOI] [PMC free article] [PubMed] [Google Scholar]
- 47.Visel A, Minovitsky S, Dubchak I & Pennacchio LA VISTA Enhancer Browser--a database of tissue-specific human enhancers. Nucleic Acids Res 35, D88–92 (2007). [DOI] [PMC free article] [PubMed] [Google Scholar]
- 48.Arner E et al. Transcribed enhancers lead waves of coordinated transcription in transitioning mammalian cells. Science 347, 1010–4 (2015). [DOI] [PMC free article] [PubMed] [Google Scholar]
- 49.Consortium, E.P. An integrated encyclopedia of DNA elements in the human genome. Nature 489, 57–74 (2012). [DOI] [PMC free article] [PubMed] [Google Scholar]
- 50.Guan C, Ye C, Yang X & Gao J A review of current large-scale mouse knockout efforts. Genesis 48, 73–85 (2010). [DOI] [PubMed] [Google Scholar]
- 51.Lloyd KC A knockout mouse resource for the biomedical research community. Ann N Y Acad Sci 1245, 24–6 (2011). [DOI] [PMC free article] [PubMed] [Google Scholar]
- 52.Osterwalder M et al. Enhancer redundancy provides phenotypic robustness in mammalian development. Nature 554, 239–243 (2018). [DOI] [PMC free article] [PubMed] [Google Scholar]
- 53.Shim S, Kwan KY, Li M, Lefebvre V & Sestan N Cis-regulatory control of corticospinal system development and evolution. Nature 486, 74–9 (2012). [DOI] [PMC free article] [PubMed] [Google Scholar]
- 54.Sur IK et al. Mice lacking a Myc enhancer that includes human SNP rs6983267 are resistant to intestinal tumors. Science 338, 1360–3 (2012). [DOI] [PubMed] [Google Scholar]
- 55.Kazanets A, Shorstova T, Hilmi K, Marques M & Witcher M Epigenetic silencing of tumor suppressor genes: Paradigms, puzzles, and potential. Biochim Biophys Acta 1865, 275–88 (2016). [DOI] [PubMed] [Google Scholar]
- 56.Crea F, Paolicchi E, Marquez VE & Danesi R Polycomb genes and cancer: time for clinical application? Crit Rev Oncol Hematol 83, 184–93 (2012). [DOI] [PubMed] [Google Scholar]
References
- 57.Buenrostro JD, Giresi PG, Zaba LC, Chang HY & Greenleaf WJ Transposition of native chromatin for fast and sensitive epigenomic profiling of open chromatin, DNA-binding proteins and nucleosome position. Nat Methods 10, 1213–8 (2013). [DOI] [PMC free article] [PubMed] [Google Scholar]
- 58.Tang Z et al. CTCF-Mediated Human 3D Genome Architecture Reveals Chromatin Topology for Transcription. Cell 163, 1611–27 (2015). [DOI] [PMC free article] [PubMed] [Google Scholar]
- 59.Wang W, Zhang Y & Wang H Generating Mouse Models Using Zygote Electroporation of Nucleases (ZEN) Technology with High Efficiency and Throughput. Methods Mol Biol 1605, 219–230 (2017). [DOI] [PubMed] [Google Scholar]
- 60.Tunster SJ Genetic sex determination of mice by simplex PCR. Biol Sex Differ 8, 31 (2017). [DOI] [PMC free article] [PubMed] [Google Scholar]
- 61.Kurbatova N, Mason JC, Morgan H, Meehan TF & Karp NA PhenStat: A Tool Kit for Standardized Analysis of High Throughput Phenotypic Data. PLoS One 10, e0131274 (2015). [DOI] [PMC free article] [PubMed] [Google Scholar]
- 62.Benjamini Y & Hochberg Y Controlling the False Discovery Rate: A Practical and Powerful Approach to Multiple Testing. Journal of the Royal Statistical Society. Series B (Methodological) 57, 289–300 (1995). [Google Scholar]
- 63.Li G et al. ChIA-PET tool for comprehensive chromatin interaction analysis with paired-end tag sequencing. Genome Biol 11, R22 (2010). [DOI] [PMC free article] [PubMed] [Google Scholar]
- 64.Li H & Durbin R Fast and accurate short read alignment with Burrows-Wheeler transform. Bioinformatics 25, 1754–60 (2009). [DOI] [PMC free article] [PubMed] [Google Scholar]
- 65.arXiv:1303.3997 [q-bio.GN], https://arxiv.org/abs/1303.3997
- 66.Paulsen J, Rodland EA, Holden L, Holden M & Hovig E A statistical model of ChIA-PET data for accurate detection of chromatin 3D interactions. Nucleic Acids Res 42, e143 (2014). [DOI] [PMC free article] [PubMed] [Google Scholar]
- 67.Liu T Use model-based Analysis of ChIP-Seq (MACS) to analyze short reads generated by sequencing protein-DNA interactions in embryonic stem cells. Methods Mol Biol 1150, 81–95 (2014). [DOI] [PubMed] [Google Scholar]
- 68. https://github.com/FelixKrueger/TrimGalore.
- 69.Kim D, Langmead B & Salzberg SL HISAT: a fast spliced aligner with low memory requirements. Nat Methods 12, 357–60 (2015). [DOI] [PMC free article] [PubMed] [Google Scholar]
- 70.Anders S, Pyl PT & Huber W HTSeq--a Python framework to work with high-throughput sequencing data. Bioinformatics 31, 166–9 (2015). [DOI] [PMC free article] [PubMed] [Google Scholar]
- 71.Love MI, Huber W & Anders S Moderated estimation of fold change and dispersion for RNA-seq data with DESeq2. Genome Biol 15, 550 (2014). [DOI] [PMC free article] [PubMed] [Google Scholar]
- 72.Durand NC et al. Juicebox Provides a Visualization System for Hi-C Contact Maps with Unlimited Zoom. Cell Syst 3, 99–101 (2016). [DOI] [PMC free article] [PubMed] [Google Scholar]
- 73.Servant N et al. HiTC: exploration of high-throughput ‘C’ experiments. Bioinformatics 28, 2843–4 (2012). [DOI] [PMC free article] [PubMed] [Google Scholar]
Associated Data
This section collects any data citations, data availability statements, or supplementary materials included in this article.
Supplementary Materials
Data Availability Statement
All data described in this study are being deposited in NCBI’s Gene Expression Omnibus GSE120393.


