

Abstract
Deficient intake of micronutrients involved in one-carbon metabolism (e.g., choline, methionine, vitamin B12, and folic acid) leads to hepatocellular carcinoma (HCC) development in rodents, but it is under-investigated in humans. We investigated the association between one-carbon metabolism–related micronutrient intake and HCC risk in a prospective cohort of 494,860 participants with 16 years of follow-up in the NIH-AARP study. Dietary intakes and supplement use were ascertained at baseline using a food-frequency questionnaire. Total intake (diet plus supplements) of the following one-carbon metabolism–related micronutrients were calculated: folate, methionine, and vitamins B2 (riboflavin), B3 (niacin), B6, and B12. These micronutrients were examined both individually and simultaneously, with adjustment for covariates. Cox proportional hazard models were used to calculate hazard ratios (HRs) and 95% confidence intervals (CIs). Over the 16-year follow-up period, 647 incident HCC cases were diagnosed. When examined individually, higher total vitamin B3 intake was associated with a lower HCC risk (HRQ5vsQ1=0.60; 95%CI=0.42–0.85; Ptrend=0.008), and the association remained significant when all six micronutrients were examined simultaneously (HRQ5vsQ1=0.32; 95%CI=0.18–0.55; Ptrend<0.0001). Among participants with >3 years of follow-up, higher total vitamin B3 intake was again associated with lower risk (HRQ5vsQ1=0.37; 95%CI=0.20–0.68; Ptrend=0.001), whereas higher total vitamin B6 intake was associated with higher risk (HRQ5vsQ1=2.04; 95%CI=1.02–4.07; Ptrend=0.04). Restricted cubic spline analyses showed a dose-response inverse association between total vitamin B3 intake and HCC risk, and dose-response positive association between total vitamin B6 intake and HCC risk. The study suggests that higher vitamin B3 intake is associated with lower HCC risk, whereas higher vitamin B6 intake is associated with increased risk.
Keywords: cancer, hepatocellular carcinoma, HCC, one-carbon metabolism, micronutrients, risk
Introduction
Hepatocellular carcinoma (HCC) is a frequently fatal primary malignancy of the liver, with an estimated 5-year survival rate of about 18% in the United States.1, 2 The major risk factors of HCC in the United States include metabolic syndrome, nonalcoholic fatty liver disease (NAFLD), chronic hepatitis B and C virus (HBV and HCV) infections, alcoholic liver disease, pre-existing diabetes mellitus, and obesity.3 Despite these well-established HCC risk factors and efforts aimed at reducing exposure to these risk factors, the incidence and mortality of HCC are both projected to increase in several population subgroups in the United States.4, 5 Current efforts aimed at addressing the increasing incidence of HCC in the United States include the now widespread use of direct-acting antiviral agents for treatment of HCV which can lead to viral clearance in more than 90% of HCV-affected patients,6 reducing exposure to HCV among intravenous drug users through needle exchange programs,7 and increasing public awareness of the link between HCC and metabolic syndrome, which is potentially modifiable and particularly prevalent among Hispanic Americans and non-Hispanic whites.3 However, there remains a need to identify additional modifiable risk factors of HCC to improve strategies for risk prevention.
Animal studies have implicated deficient intake of micronutrients involved in one-carbon metabolism in the development of HCC.8–11 One-carbon metabolism involves the transfer of methyl groups derived from both dietary sources and endogenous biosynthesis for the formation of the universal methyl-donor, S-adenosylmethionine, which is then used for methylation of DNA and other cellular moieties.12–14 Methyl groups derived from S-adenosylmethionine for methylation reactions are obtained primarily from dietary micronutrients, such as choline, betaine, methionine, folate (vitamin B9), and other B vitamins.12–15 Indeed, studies have shown that DNA methylation patterns are influenced directly by the availability of dietary methyl-donors.15–18 The importance of dietary methyl-donors in DNA methylation and hepatic tumorigenesis has been studied extensively in rodents. Mice deprived of methyl-donating micronutrients often develop altered gene expression,19–22 hypo-DNA methylation in liver tissue,10, 23 and spontaneous liver tumors.8, 9, 11, 19, 21 Specifically, mice fed with diets that are deficient in choline, methionine, vitamin B12, and folic acid often develop liver tumors, including HCC.8, 9 It has therefore been suggested that similar phenomena may occur in humans with habitually low intake of methyl-donating micronutrients, but this is under investigated in humans.13, 14
Our group previously examined the association between folate and alcohol intake, and risk for HCC using data from the National Institutes of Health and formerly the American Association of Retired Persons (NIH-AARP) Diet and Health Study, after 11 years of prospective follow-up.24 This prior work showed that higher folate intake is associated with a less deleterious effect of alcohol consumption on HCC risk. However, the study did not include other micronutrients involved in one-carbon metabolism, besides folate. In general, few studies have investigated the association between one-carbon–related micronutrient intake and HCC risk.24–30 The majority of these studies were focused on a single nutrient, often folate, and the findings are mixed.24, 28–30 Only one prospective cohort study among Finnish male smokers26 and two case-control studies among Chinese participants25, 27 investigated the association between one-carbon–related micronutrient intake as a functional group of biochemically-related nutrients in regards to HCC risk. To date, no study has comprehensively examined one-carbon metabolism–related micronutrient intake in relation to HCC risk in a US population. We therefore build upon our previous work24 by examining associations between multiple one-carbon metabolism–related micronutrient intake and risk of HCC development in the NIH-AARP Diet and Health Study, with an additional five years of follow-up data.
Materials and Methods
Study Population
A detailed description of the NIH-AARP Diet and Health Study has been published31; thus, only a brief summary follows. Between 1995 and 1996, study invitations and questionnaires were sent to 3.5 million AARP members aged 50 to 71 years who resided in six states (California, Florida, Louisiana, New Jersey, North Carolina, and Pennsylvania) and two metropolitan areas (Atlanta, Georgia and Detroit, Michigan). The questionnaires sought information about respondents’ demographics, socio-economic factors, anthropometric measurements, dietary habits, and several health-related behaviors. A total of 617,119 (18%) questionnaires were returned, among which 566,398 had satisfactory responses, as described in detail elsewhere.31 For the present study, we excluded proxy respondents (n=15,760), prevalent cancer cases (n=51,346), and individuals who reported extreme levels of total caloric intake (>2 times the sex-specific interquartile range; n=4,432). These exclusions left a final analytic sample of 494,860. All participants provided written informed consent. The study was approved by the National Cancer Institute’s Special Studies Institutional Review Board.
Cohort Follow-up and Case Ascertainment
Incident cancer cases that developed during follow-up were identified through linkage with state cancer registries in the eight study catchment areas and three additional states where the cohort members tended to relocate (Arizona, Nevada, and Texas). Incident HCC cases were identified using the International Classification of Diseases for Oncology, Third Edition (ICD-O-3) topographic code C22.0 and morphology codes 8170– 8175.24 Time to HCC development was calculated from the date the questionnaire was scanned to the date of cancer diagnosis, date of death, date last known to be alive, or date of last follow-up (December 31, 2011), whichever occurred first.
Dietary Intake and Covariates Assessment
Alcohol consumption has been shown to modulate the association between certain one-carbon metabolism–related micronutrient intake and HCC risk.24 In the NIH-AARP Diet and Health Study, dietary intakes of various foods and beverages, including alcohol, were ascertained at baseline with a self-administered 124-item food-frequency questionnaire (FFQ).32 The FFQ asked participants to report usual frequency and portion sizes of various foods and beverages over the past year. Nutrient contents of the food items was determined through linkage of the FFQ responses to a food composition database maintained by the US Department of Agriculture.32 The data on dietary supplement use were obtained with the FFQ and included dose and frequency of supplement use. Intakes of the following one-carbon–related micronutrients from food sources were available for analyses: folate, methionine, and vitamins B2 (riboflavin), B3 (niacin), B6, and B12. For dietary supplements, data were available for all micronutrients, except methionine. Association analyses were performed for dietary intake only and for total intake (diet plus supplements). For dietary intake, each nutrient was adjusted for total calorie intake based on the residual method, with additional inclusion of total calories in the statistical models.33 For total intake, supplemental intake was added to the corresponding dietary micronutrients after calorie-adjustment of the dietary portion. Other participant characteristics ascertained at baseline included age, sex, race/ethnicity, highest level of education, smoking history, alcohol consumption, self-reported history of diabetes mellitus, and body mass index (BMI, kg/m2).
Data Availability
The study data can be made available to researchers upon request to and approval by the NIH-AARP Diet and Health Cohort Study. For instructions on how to apply for data, researchers can visit https://www.nihaarpstars.com/.
Statistical Analysis
Differences in baseline characteristics were compared using means for continuous variables and proportions for categorical variables. Multivariable-adjusted Cox proportional hazard models were used to calculate hazard ratios (HRs) and 95% confidence intervals (CIs). Prior to fitting the proportional hazard models, the proportionality assumption was assessed for each variable (both the main exposure variables and covariates) using the time-dependent method and were determined to have been satisfied (P >0.05). Each of the calorie-adjusted micronutrients was categorized into quintiles, with the lowest quintile (Q1) as the reference group. Linear trend was assessed by expressing the quintile variable as a continuous variable in the statistical models. The association analyses were performed in three ways. First, each of the micronutrients was examined separately, with adjustment for the following risk factors of HCC: age (continuous), sex, race/ethnicity (non-Hispanic white, non-Hispanic black, Hispanic, other), personal history of diabetes mellitus (yes, no), smoking history (never, former, current), alcohol use (none, <1, 1–3, ≥3 drinks/day), total calorie intake (continuous), BMI (<25, 25–29, ≥30 kg/m2), highest level of education (<high school, high school graduate, some college/post-high school education, college graduate/post-graduate), frequency of physical activity (0, <1, 1–2, 3–4, 5+ times/week), multivitamin use (yes, no), red meat intake (0–23, 24–41, 42–63, 64–99, >99 grams/day ), and Healthy Eating Index scores (a marker of overall quality of diet; 10–59, 60–66, 67–71, 72–76, >76). Secondly, all six micronutrients were placed in a single model, with adjustment of the risk factors listed above. Because one-carbon metabolism–related micronutrients are thought to influence disease risk by donating methyl groups for methylation reactions,12–14 we also calculated a “methyl-donor index” as a composite measure of dietary methyl intake by standardizing the nutrient intake levels on the log-scale ([nutrient value – mean] / standard deviation) then summed across all six micronutrients, as described previously.34 The methyl-donor index also was adjusted for total calorie intake using the residual method then categorized into quintiles. Each of the three sets of analyses was performed separately for dietary intake only and for total intake (diet plus supplements).
In sensitivity analyses, we restricted the study sample to participants with more than 3 years of follow-up to control for potential confounding by subclinical malignancy at baseline. In this sub-cohort, we examined associations between the one-carbon metabolism–related micronutrient intake and HCC risk in the most elaborate model that included all six micronutrients and the HCC risk factors. We also performed restricted cubic spline regression analyses with three knots for micronutrients that were found to be significantly associated with HCC risk to test for non-linear relationships with the dependent variable (HCC).35 Stratified analyses also were performed in sub-cohorts defined by sex, BMI, alcohol intake, and physical activity level, and included assessment of statistical interaction on the multiplicative scale. All statistical tests were two-sided and a P < 0.05 was considered statistically significant. Analyses were performed with SAS v9.4 (SAS Institute, Cary, NC, USA).
Results
Over the 16-year follow-up period (1995–2011), we identified 647 incident HCC cases diagnosed among the 494,860 participants. The median time to HCC diagnosis was 9.1 years. The overall median time of cohort follow-up was 15.5 years. Table 1 presents differences in baseline characteristics by quintiles of total intake (diet plus supplements) of one-carbon metabolism–related micronutrients. The participants in the lowest quintile (Q1) of folate intake included higher proportions of men, non-Hispanic whites and current smokers and were more likely to be obese (≥30 kg/m2), whereas those in the highest quintile (Q5) were more likely to report a personal history of diabetes mellitus, multivitamin use and have a college degree. Participants in the lowest quintile of vitamin B3 (niacin) were more likely to be current smokers and consume more than three alcoholic beverages a day but less likely to have a history of diabetes mellitus, whereas those in the highest quintile were more likely to be non-Hispanic white, report multivitamin use, and engage in physical activity three or more times a week. The participants in the lowest quintile of vitamin B6 also were more likely to be current smokers, consume more than three alcoholic beverages a day and obese, but less likely to report a history of diabetes mellitus, whereas those in the highest quintile were more likely to report multivitamin use, have a college degree, and engage in physical activity three or more times a week but less likely to consume high amounts of red meat (≥64 grams/day) and tended to have higher Healthy Eating Index scores. Other differences are presented in Table 1.
Table 1.
Baseline Characteristics of the Study Participants (N=494,860) by Quintiles of Total Intake of One-carbon Metabolism–Related Micronutrients: The NIH-AARP Diet and Health Study (Enrolled 1995–1996, Followed Up to 2011).
| Folatea | Methionineb | Vitamin B2a | Vitamin B3a | Vitamin B6a | Vitamin B12a | Total Sample | |||||||
|---|---|---|---|---|---|---|---|---|---|---|---|---|---|
| Q1 | Q5 | Q1 | Q5 | Q1 | Q5 | Q1 | Q5 | Q1 | Q5 | Q1 | Q5 | ||
| Mean (SD) | Mean (SD) | Mean (SD) | Mean (SD) | Mean (SD) | Mean (SD) | Mean (SD) | Mean (SD) | Mean (SD) | Mean (SD) | Mean (SD) | Mean (SD) | Mean (SD) | |
| Total calories, kcal | 2148 (981.3) | 2054 (784.7) | 1072 (408.2) | 2846 (804.9) | 1926 (924.0) | 1910 (814.6) | 1874(885.0) | 1903 (816.8) | 2089 (931.4) | 2061 (840.0) | 2265 (899.8) | 2060 (844.4) | 1835 (806.4) |
| Age, years | 61 (5.5) | 62 (5.3) | 62 (5.4) | 61 (5.4) | 61 (5.4) | 62 (5.4) | 62 (5.4) | 61 (5.4) | 61 (5.5) | 62 (5.3) | 61 (5.4) | 62 (5.3) | 61.5 (5.4) |
| %c | %c | %c | %c | %c | %c | %c | %c | %c | %c | %c | %c | %c | |
| Sex | |||||||||||||
| Male | 68.7 | 61.5 | 42.3 | 76.6 | 65.2 | 55.7 | 59.3 | 58.2 | 64.7 | 64.7 | 63.0 | 64.9 | 59.7 |
| Female | 31.3 | 38.5 | 57.7 | 23.4 | 34.8 | 44.3 | 40.7 | 41.8 | 35.3 | 35.3 | 37.0 | 35.1 | 40.3 |
| Race/Ethnicity | |||||||||||||
| Non-Hispanic white | 92.7 | 88.2 | 87.4 | 91.4 | 88.2 | 92.1 | 87.9 | 92.4 | 91.4 | 90.6 | 87.6 | 92.4 | 91.2 |
| Non-Hispanic black | 4.0 | 4.2 | 5.7 | 3.8 | 5.6 | 3.2 | 6.1 | 3.1 | 4.3 | 4.1 | 5.7 | 3.7 | 3.9 |
| Hispanic | 1.2 | 2.9 | 2.1 | 2.2 | 2.3 | 1.9 | 2.3 | 1.9 | 1.5 | 2.3 | 2.6 | 1.5 | 1.9 |
| Other | 2.1 | 4.7 | 4.7 | 2.5 | 3.9 | 2.8 | 3.7 | 2.7 | 2.9 | 3.1 | 4.0 | 2.4 | 3.0 |
| Diabetes mellitus | |||||||||||||
| No | 93.0 | 90.6 | 93.0 | 87.6 | 93.7 | 90.5 | 92.6 | 90.4 | 94.4 | 88.3 | 94.2 | 87.2 | 91.0 |
| Yes | 7.0 | 9.4 | 7.0 | 12.4 | 6.3 | 9.5 | 7.4 | 9.6 | 5.6 | 11.7 | 5.8 | 12.8 | 9.0 |
| Smoking status | |||||||||||||
| Non-smoker | 25.5 | 39.7 | 37.7 | 32.1 | 30.9 | 36.6 | 36.1 | 34.9 | 27.3 | 39.0 | 33.7 | 33.3 | 35.1 |
| Former smoker | 47.6 | 49.9 | 45.6 | 50.3 | 48.5 | 49.2 | 45.2 | 51.2 | 46.2 | 50.8 | 50.0 | 48.6 | 49.2 |
| Current smoker | 23.0 | 6.5 | 12.3 | 13.5 | 16.4 | 10.4 | 14.5 | 10.2 | 22.6 | 6.3 | 12.3 | 14.1 | 11.9 |
| Unknownd | 3.9 | 3.9 | 4.4 | 4.0 | 4.2 | 3.8 | 4.3 | 3.7 | 3.9 | 3.9 | 4.0 | 4.0 | 3.8 |
| Alcohol, drinks/day | |||||||||||||
| None | 22.0 | 26.5 | 28.4 | 24.0 | 22.3 | 25.4 | 27.1 | 23.9 | 23.6 | 27.4 | 24.8 | 25.1 | 24.5 |
| <1 | 41.3 | 55.3 | 54.6 | 48.7 | 46.3 | 54.5 | 47.6 | 54.4 | 46.1 | 52.2 | 43.3 | 54.1 | 52.7 |
| 1–3 | 16.4 | 14.9 | 11.9 | 16.7 | 17.4 | 14.5 | 14.4 | 15.6 | 15.3 | 14.2 | 15.3 | 15.2 | 15.3 |
| >3 | 20.4 | 3.3 | 5.1 | 10.5 | 14.0 | 5.6 | 10.9 | 6.1 | 15.0 | 6.2 | 16.6 | 5.6 | 7.5 |
| BMI, kg/m2 | |||||||||||||
| <25 | 30.9 | 39.3 | 41.4 | 25.6 | 32.6 | 37.1 | 33.2 | 36.6 | 33.6 | 36.5 | 39.3 | 28.5 | 34.6 |
| 25–29 | 39.4 | 38.0 | 35.9 | 40.3 | 39.5 | 37.9 | 38.0 | 38.4 | 38.7 | 39.0 | 37.9 | 39.3 | 38.9 |
| ≥30 | 27.4 | 20.2 | 19.7 | 31.8 | 25.3 | 22.7 | 25.9 | 22.7 | 25.2 | 22.0 | 20.0 | 29.8 | 24.2 |
| Unknownd | 2.4 | 2.6 | 3.0 | 2.3 | 2.6 | 2.4 | 2.9 | 2.3 | 2.5 | 2.5 | 2.7 | 2.4 | 2.4 |
| Multivitamins use | |||||||||||||
| No | 50.7 | 40.6 | 45.9 | 45.4 | 96.5 | 1.1 | 96.7 | 0.5 | 50.5 | 41.4 | 45.5 | 45.2 | 44.9 |
| Yes | 49.3 | 59.4 | 54.1 | 54.6 | 3.5 | 98.9 | 3.3 | 99.5 | 49.5 | 58.6 | 54.5 | 54.8 | 55.1 |
| Education, years | %c | %c | %c | %c | %c | %c | %c | %c | %c | %c | %c | %c | %c |
| < HS | 7.8 | 5.1 | 6.5 | 6.8 | 7.4 | 4.6 | 7.9 | 4.4 | 7.5 | 5.9 | 7.0 | 6.5 | 6.0 |
| HS graduate | 22.9 | 15.7 | 21.9 | 18.7 | 21.6 | 16.4 | 22.5 | 16.0 | 22.0 | 18.1 | 19.8 | 19.4 | 19.5 |
| Some college /post-HS | 35.2 | 30.1 | 33.8 | 32.6 | 33.1 | 33.2 | 32.8 | 33.1 | 34.2 | 31.1 | 32.6 | 32.9 | 33.0 |
| College/post-graduate | 30.9 | 46.1 | 33.9 | 39.0 | 34.9 | 42.7 | 33.4 | 43.4 | 33.3 | 41.8 | 37.5 | 38.1 | 38.5 |
| Unknownd | 3.1 | 3.0 | 3.8 | 2.9 | 3.0 | 3.1 | 3.3 | 3.0 | 2.9 | 3.2 | 3.0 | 3.1 | 2.9 |
| Physical Activity, times per week | |||||||||||||
| 0 | 6.8 | 3.2 | 5.7 | 4.4 | 6.0 | 3.6 | 6.4 | 3.4 | 6.8 | 3.3 | 5.0 | 4.6 | 4.4 |
| <1 | 35.2 | 18.9 | 30.3 | 25.0 | 32.2 | 23.9 | 31.6 | 23.4 | 35.4 | 19.0 | 25.7 | 27.4 | 27.1 |
| 1–2 | 21.9 | 19.1 | 20.5 | 21.6 | 21.5 | 20.8 | 21.0 | 20.8 | 21.9 | 18.6 | 19.5 | 22.2 | 21.5 |
| 3–4 | 20.7 | 30.6 | 24.9 | 26.3 | 22.8 | 28.6 | 22.8 | 29.2 | 20.5 | 30.7 | 26.1 | 26.0 | 26.7 |
| 5+ | 14.3 | 27.1 | 16.9 | 21.6 | 16.2 | 22.0 | 16.6 | 22.2 | 14.3 | 27.1 | 22.6 | 18.6 | 19.2 |
| Unknownd | 1.2 | 1.1 | 1.8 | 1.0 | 1.3 | 1.0 | 1.6 | 0.9 | 1.1 | 1.2 | 1.1 | 1.1 | 1.1 |
| Red Meat Intake, grams/day | |||||||||||||
| 0–23 | 7.8 | 30.7 | 49.7 | 4.6 | 15.7 | 23.9 | 20.5 | 22.6 | 11.3 | 26.2 | 26.5 | 9.8 | 20.2 |
| 24–41 | 13.1 | 20.6 | 33.9 | 5.4 | 17.5 | 20.8 | 20.8 | 19.5 | 16.5 | 19.4 | 20.4 | 13.1 | 20.0 |
| 42–63 | 17.7 | 18.1 | 14.0 | 9.2 | 19.2 | 19.4 | 20.6 | 18.7 | 19.8 | 18.3 | 19.3 | 16.8 | 20.0 |
| 64–99 | 23.9 | 16.4 | 2.4 | 19.0 | 21.8 | 18.2 | 20.3 | 18.5 | 23.7 | 17.5 | 18.6 | 22.1 | 20.0 |
| >99 | 37.4 | 14.2 | 0.0 | 61.9 | 25.8 | 17.7 | 17.8 | 20.7 | 28.6 | 18.6 | 15.2 | 38.2 | 19.9 |
| Healthy Eating Index Score | |||||||||||||
| 10–59 | 49.2 | 5.9 | 19.3 | 25.5 | 33.7 | 14.3 | 31.1 | 13.7 | 55.3 | 4.2 | 25.6 | 20.2 | 20.0 |
| 60–66 | 25.6 | 12.5 | 19.2 | 22.5 | 24.4 | 17.4 | 22.7 | 17.6 | 24.6 | 10.4 | 21.6 | 20.4 | 20.0 |
| 67–71 | 14.1 | 19.3 | 19.9 | 19.9 | 18.8 | 19.8 | 18.2 | 20.5 | 12.0 | 17.8 | 19.4 | 20.0 | 20.0 |
| 72–76 | 7.7 | 26.5 | 20.9 | 17.1 | 14.3 | 22.3 | 15.1 | 23.0 | 5.8 | 27.0 | 18.0 | 19.3 | 20.0 |
| >76 | 3.4 | 35.8 | 20.7 | 14.9 | 8.8 | 26.2 | 12.9 | 25.2 | 2.3 | 40.6 | 15.5 | 20.1 | 20.0 |
Abbreviations: BMI, body mass index; HS, high school; Q1, 1st quintile; Q5, 5th quintile
Total intake was computed as diet plus supplements. Each micronutrient was adjusted for total caloric intake by the residual method. Quintiles were created from intake values at baseline and categorized based on distribution in the entire cohort using the 20th, 40th, 60th, and 80th percentile values as cut points.
Methionine was based on dietary intake only because data on supplemental intake were not available.
Percentages may not sum to 100% because of rounding.
A separate category was created for “unknown” and retained in the statistical analysis models.
Multivariable-adjusted HRs and 95% CIs for associations between dietary intakes of one-carbon metabolism–related micronutrient and HCC risk are shown in Table 2. The micronutrients were examined both individually and simultaneously, in separate models, with adjustment for risk factors of HCC. When examined individually, higher dietary intake of vitamin B3 was associated with a lower risk of HCC (HRQ5vsQ1=0.57; 95% CI=0.44–0.72; Ptrend<0.0001). There also was a suggestion of an increased HCC risk associated with higher dietary intake of vitamin B2 (HRQ5vsQ1=1.20; 95% CI=0.94–1.54; Ptrend=0.04). When all six micronutrients were examined simultaneously, the association for dietary vitamin B3 intake remained significant (HRQ5vsQ1=0.47, 95% CI=0.36–0.65; Ptrend<0.0001), but no association was found for dietary vitamin B2. Furthermore, higher dietary folate intake was associated with a lower HCC risk in the model that assessed all six micronutrients (HRQ5vsQ1=0.73; 95% CI=0.54–0.98; Ptrend=0.03). Dietary vitamin B6 intake also was associated with an increased HCC risk in the fourth quintile (HRQ4vsQ1=1.40; 95% CI=1.02–1.92), but not the fifth quintile (HR Q5vsQ1=1.42; 95% CI=0.98–2.05), with a significant linear trend across quintiles (Ptrend=0.03). Additionally, higher dietary methionine intake was associated with lower HCC risk in the highest quintile, with a non-significant linear trend (HRQ5vsQ1=0.59; 95% CI=0.38–0.93; Ptrend=0.11). No association was observed for dietary vitamin B12 intake or the methyl-donor index.
Table 2.
Dietary Intake of Micronutrients Involved in One-Carbon Metabolism and Risk of Hepatocellular Carcinoma: Results from Assessment of the Micronutrients Individually and Simultaneously, With Adjustment for Covariates: The NIH-AARP Diet and Health Study (Enrolled 1995–1996, Followed Up to 2011; N=494,860, Cases=647).
| Assessment of Micronutrients Individually | Assessment of Micronutrients Simultaneously | ||||
|---|---|---|---|---|---|
| Micronutrienta | Total N | Cases | Person-Years | HR (95% CI)b | HR (95% CI)c |
| Folate | |||||
| Q1 | 98,975 | 186 | 1,182,022 | 1.00 (ref) | 1.00 (ref) |
| Q2 | 98,971 | 134 | 1,202,404 | 0.84 (0.66–1.06) | 0.84 (0.66–1.08) |
| Q3 | 98,970 | 103 | 1,210,087 | 0.69 (0.53–0.89) | 0.68 (0.52–0.89) |
| Q4 | 98,971 | 112 | 1,217,945 | 0.78 (0.60–1.02) | 0.76 (0.58–1.01) |
| Q5 | 98,973 | 112 | 1,222,929 | 0.77 (0.58–1.01) | 0.73 (0.54–0.98) |
| P trendd | 0.05 | 0.03 | |||
| Methionine | |||||
| Q1 | 99,168 | 104 | 1,218,916 | 1.00 (ref) | 1.00 (ref) |
| Q2 | 98,751 | 104 | 1,212,516 | 0.87 (0.65–1.16) | 0.85 (0.64–1.14) |
| Q3 | 99,387 | 128 | 1,214,539 | 0.91 (0.67–1.24) | 0.87 (0.63–1.19) |
| Q4 | 99,128 | 149 | 1,204,573 | 0.88 (0.64–1.22) | 0.82 (0.58–1.15) |
| Q5 | 98,426 | 162 | 1,184,843 | 0.67 (0.45–1.00) | 0.59 (0.38–0.93) |
| P trendd | 0.13 | 0.11 | |||
| Vitamin B2 | |||||
| Q1 | 98,970 | 145 | 1,200,522 | 1.00 (ref) | 1.00 (ref) |
| Q2 | 98,973 | 106 | 1,213,390 | 0.90 (0.70–1.17) | |
| Q3 | 98,974 | 106 | 1,214,292 | 0.92 (0.71–1.20) | 1.03 (0.77–1.38) |
| Q4 | 98,971 | 133 | 1,209,677 | 1.14 (0.88–1.47) | 1.26 (0.94–1.70) |
| Q5 | 98,972 | 157 | 1,197,506 | 1.20 (0.94–1.54) | 1.27 (0.92–1.77) |
| P trendd | 0.04 | 0.07 | |||
| Vitamin B3 | |||||
| Q1 | 98,974 | 183 | 1,197,415 | 1.00 (ref) | 1.00 (ref) |
| Q2 | 98,972 | 113 | 1,210,855 | 0.69 (0.54–0.88) | 0.68 (0.53–0.88) |
| Q3 | 98,970 | 108 | 1,211,608 | 0.63 (0.49–0.81) | 0.61 (0.47–0.79) |
| Q4 | 98,970 | 120 | 1,210,293 | 0.65 (0.51–0.83) | 0.60 (0.46–0.78) |
| Q5 | 98,974 | 123 | 1,205,216 | 0.57 (0.44–0.72) | 0.47 (0.36–0.65) |
| P trendd | <.0001 | <.0001 | |||
| Vitamin B6 | |||||
| Q1 | 98,973 | 151 | 1,189,847 | 1.00 (ref) | 1.00 (ref) |
| Q2 | 98,970 | 122 | 1,211,215 | 0.95 (0.74–1.23) | 1.17 (0.89–1.53) |
| Q3 | 98,972 | 115 | 1,215,460 | 0.91 (0.70–1.18) | 1.19 (0.88–1.60) |
| Q4 | 98,974 | 128 | 1,214,508 | 1.02 (0.78–1.33) | 1.40 (1.02–1.92) |
| Q5 | 98,971 | 131 | 1,204,357 | 0.96 (0.73–1.27) | 1.42 (0.98–2.05) |
| P trendd | 0.98 | 0.03 | |||
| Vitamin B12 | |||||
| Q1 | 98,972 | 131 | 1,215,461 | 1.00 (ref) | 1.00 (ref) |
| Q2 | 98,971 | 112 | 1,218,847 | 1.04 (0.80–1.35) | 1.08 (0.82–1.42) |
| Q3 | 98,973 | 119 | 1,211,187 | 1.10 (0.84–1.44) | 1.14 (0.85–1.52) |
| Q4 | 98,972 | 117 | 1,203,134 | 1.01 (0.77–1.33) | 1.03 (0.75–1.40) |
| Q5 | 98,972 | 168 | 1,186,757 | 1.22 (0.95–1.56) | 1.26 (0.92–1.72) |
| P trendd | 0.17 | 0.43 | |||
| Methyl-donor indexe | |||||
| Q1 | 98,972 | 160 | 1,191,675 | 1.00 (ref) | N/A |
| Q2 | 98971 | 115 | 1,215,867 | 0.85 (0.66–1.10) | |
| Q3 | 98972 | 94 | 1,213,573 | 0.69 (0.52–0.91) | |
| Q4 | 98,973 | 137 | 1,214,058 | 0.96 (0.74–1.24) | |
| Q5 | 98,972 | 141 | 1,191,675 | 0.85 (0.65–1.10) | |
| P trendc | 0.49 | ||||
Abbreviations: HR, hazard ratio; CI, confidence interval; N/A, not applicable; Q1–Q5, calorie-adjusted quintiles of micronutrients intake (without supplements)
Each dietary micronutrient was adjusted for total calories intake using the residual method. Quintiles were created from intake values at baseline and categorized based on distribution in the entire cohort using the 20th, 40th, 60th, and 80th percentile values as cut points
All models adjusted for age (continuous), sex, race/ethnicity (white, black, Hispanic, other), diabetes mellitus (yes, no), smoking status (never, former, current), alcohol use (<1, 1–3, >3 drinks/day), total caloric intake (continuous), body mass index (<25, 25–29, ≥30 kg/m2), education level (<high school, high school graduate, some college/post-high school education, college graduate/post-graduate), physical activity (0, <1, 1–2, 3–4, 5+ times per week), multivitamin use (yes, no), red meat intake (0–23, 24–41, 42–63, 64–99, >99 grams/day ), and the Healthy Eating Index scores (10–59, 60–66, 67–71, 72–76, >76).
All of the dietary micronutrients were placed in one model with adjustment for the factors listed in b.
P trend was calculated by treating the quintile variable as a continuous variable.
A separate model was fitted for the methyl-donor index, adjusting for the factors listed in b.
Table 3 shows results for associations between total intakes of the one-carbon metabolism–related micronutrients and HCC risk. As with the diet only analyses, total vitamin B3 intake was associated with a lower HCC risk in both the individual model (HR=0.60; 95% CI=0.42–0.85; Ptrend=0.008) and the model that evaluated all six micronutrients simultaneously (HR=0.32; 95% CI=0.18–0.55; Ptrend<0.0001). There were no associations for total intakes of folate, methionine, or vitamins B2, B6, B12, or the methyl-donor index.
Table 3.
Total Intake of One-Carbon Metabolism–Related Micronutrients and Hepatocellular Carcinoma Risk: Results for Assessment of the Micronutrients Individually and Simultaneously, with Adjustment for Covariates: The NIH-AARP Diet and Health Study (Enrolled 1995–1996; N=494,860, Cases=647).
| Assessment of Micronutrients Individually | Assessment of Micronutrients Simultaneously | ||||
|---|---|---|---|---|---|
| Micronutrienta | Total N | Cases | Person-Years | HR (95% CI)b | HR (95% CI)c |
| Folate | |||||
| Q1 | 98,974 | 170 | 1,176,525 | 1.00 (ref) | 1.00 (ref) |
| Q2 | 98,969 | 121 | 1,201,809 | 0.87 (0.68–1.11) | 0.89 (0.69–1.14) |
| Q3 | 98,973 | 122 | 1,214,979 | 0.92 (0.71–1.18) | 0.94 (0.72–1.23) |
| Q4 | 98,972 | 117 | 1,219,050 | 0.89 (0.68–1.16) | 0.93 (0.70–1.22) |
| Q5 | 98,972 | 117 | 1,223,023 | 0.83 (0.63–1.10) | 0.88 (0.66–1.19) |
| P trendd | 0.27 | 0.53 | |||
| Methioninee | |||||
| Q1 | 99,168 | 104 | 1,218,916 | 1.00 (ref) | 1.00 (ref) |
| Q2 | 98,751 | 104 | 1,212,516 | 0.87 (0.65–1.16) | 0.88 (0.66–1.18) |
| Q3 | 99,387 | 128 | 1,214,539 | 0.91 (0.67–1.24) | 0.93 (0.68–1.26) |
| Q4 | 99,128 | 149 | 1,204,573 | 0.88 (0.64–1.22) | 0.90 (0.64–1.26) |
| Q5 | 98,426 | 162 | 1,184,843 | 0.67 (0.45–1.00) | 0.68 (0.44–1.04) |
| P trendd | 0.13 | 0.14 | |||
| Vitamin B2 | |||||
| Q1 | 98,974 | 140 | 1,203,248 | 1.00 (ref) | 1.00 (ref) |
| Q2 | 98,970 | 136 | 1,207,007 | 1.07 (0.84–1.36) | 1.20 (0.91–1.58) |
| Q3 | 98,972 | 118 | 1,208,260 | 0.92 (0.69–1.23) | 1.12 (0.78–1.63) |
| Q4 | 98,973 | 125 | 1,211,528 | 1.15 (0.81–1.64) | 1.39 (0.86–2.26) |
| Q5 | 98,971 | 128 | 1,205,344 | 1.14 (0.80–1.63) | 1.06 (0.60–1.88) |
| P trendd | 0.42 | 0.48 | |||
| Vitamin B3 | |||||
| Q1 | 98,971 | 159 | 1,199,363 | 1.00 (ref) | 1.00 (ref) |
| Q2 | 98,974 | 142 | 1,207,886 | 0.87 (0.69–1.10) | 0.88 (0.68–1.13) |
| Q3 | 98,971 | 111 | 1,209,537 | 0.54 (0.40–0.73) | 0.45 (0.31–0.66) |
| Q4 | 98,972 | 104 | 1,209,631 | 0.51 (0.35–0.73) | 0.30 (0.19–0.50) |
| Q5 | 98,972 | 131 | 1,208,970 | 0.60 (0.42–0.85) | 0.32 (0.18–0.55) |
| P trendd | 0.008 | <.0001 | |||
| Vitamin B6 | |||||
| Q1 | 98,972 | 155 | 1,196,450 | 1.00 (ref) | 1.00 (ref) |
| Q2 | 98,973 | 125 | 1,211,728 | 0.86 (0.67–1.11) | 0.96 (0.73–1.26) |
| Q3 | 98,971 | 119 | 1,206,064 | 0.82 (0.61–1.11) | 1.19 (0.81–1.73) |
| Q4 | 98,971 | 120 | 1,212,566 | 0.94 (0.65–1.38) | 1.58 (0.93–2.68) |
| Q5 | 98,973 | 128 | 1,208,579 | 0.99 (0.67–1.45) | 1.66 (0.88–3.15) |
| P trendd | 0.91 | 0.10 | |||
| Vitamin B12 | |||||
| Q1 | 98,972 | 143 | 1,212,872 | 1.00 (ref) | 1.00 (ref) |
| Q2 | 98,972 | 123 | 1,203,764 | 0.91 (0.71–1.17) | 0.93 (0.71–1.22) |
| Q3 | 98,973 | 121 | 1,210,731 | 0.89 (0.67–1.19) | 1.05 (0.75–1.46) |
| Q4 | 98,971 | 111 | 1,209,232 | 0.95 (0.68–1.34) | 1.17 (0.76–1.80) |
| Q5 | 98,972 | 149 | 1,198,787 | 1.20 (0.86–1.67) | 1.65 (1.03–2.65) |
| P trendd | 0.21 | 0.09 | |||
| Methyl-donor indexf | |||||
| Q1 | 98973 | 160 | 1,191,675 | 1.00 (ref) | N/A |
| Q2 | 98971 | 115 | 1,215,867 | 0.85 (0.62–1.12) | |
| Q3 | 98972 | 100 | 1,213,985 | 0.71 (0.52–0.93) | |
| Q4 | 98972 | 134 | 1,214,058 | 0.91 (0.69–1.28) | |
| Q5 | 98972 | 137 | 1,200,154 | 0.88 (0.62–1.15) | |
| P trendc | 0.49 | ||||
Abbreviations: HR, hazard ratio; CI, confidence interval; N/A, not applicable; Q1–Q5, calorie-adjusted quintiles of micronutrients intake.
Total intake was computed as diet plus supplements. Each micronutrient was adjusted for total caloric intake by the residual method. Quintiles were created from intake values at baseline and categorized based on distribution in the entire cohort using the 20th, 40th, 60th, and 80th percentile values as cut points.
All models adjusted for age (continuous), sex, race/ethnicity (white, black, Hispanic, other), diabetes mellitus (yes, no), smoking status (never, former, current), alcohol use (<1, 1–3, >3 drinks/day), total caloric intake (continuous), body mass index (<25, 25–29, ≥30 kg/m2), education level (<high school, high school graduate, some college/post-high school education, college graduate/post-graduate), physical activity (0, <1, 1–2, 3–4, 5+ times per week), multivitamin use (yes, no), red meat intake (0–23, 24–41, 42–63, 64–99, >99 grams/day ), and the Healthy Eating Index scores (10–59, 60–66, 67–71, 72–76, >76).
All of the micronutrients were placed in 1 model, adjusting for the factors listed in b.
P trend was calculated by treating the quintile variable as a continuous variable.
Methionine intake was based on diet alone because data on supplemental methionine intake were not available.
A separate model was fitted for the methyl-donor index, adjusting for the factors listed in b.
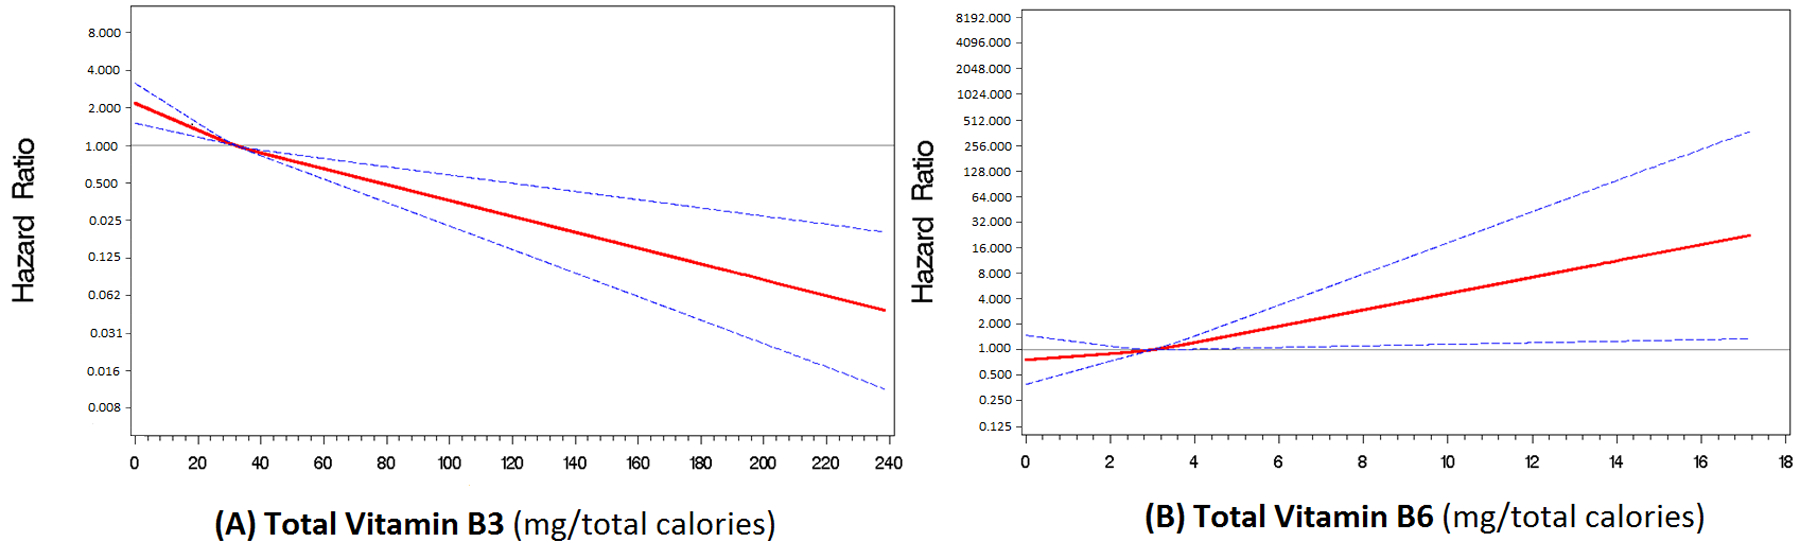
To minimize confounding by subclinical or undiagnosed HCC at baseline, we restricted the analyses to participants with more than three years of follow-up (N=453,384; cases n=559). For these analyses, all six micronutrients were evaluated concurrently, with adjustment for HCC risk factors. Associations were examined for dietary intake only (Table 4) and total intake (Table 5), and the results were similar. For dietary intake, higher vitamin B3 intake was associated with a lower HCC risk (HRQ5vsQ1=0.51; 95% CI=0.37–0.70; Ptrend< 0.0001). By contrast, higher dietary vitamin B6 intake was associated with an increased HCC risk in the fourth quintile (HRQ4vsQ1=1.51; 95% CI=1.07–1.23) but not the fifth quintile (HRQ5vsQ1=1.44; 95% CI=0.97–2.15; Ptrend=0.03) (Table 4). For total intake, higher vitamin B3 intake was again associated with a lower HCC risk (HRQ5vsQ1=0.37; 95% CI=0.20–0.68; Ptrend=0.001), while higher vitamin B6 intake was associated with an increased risk (HRQ5vsQ1=2.04; 95% CI=1.02–4.07; Ptrend=0.04) (Table 5). No association was observed for the other micronutrients or the methyl-donor index. To test for non-linearity of the associations between total intakes of vitamins B3 and B6, and HCC risk in the sample with more than three years of follow-up, restricted cubic spline regression analyses were performed in models that included all six micronutrients and covariates. The spline curves showed a dose-response positive association between higher total vitamin B3 intake and lower HCC risk (Figure 1A), and a dose-response association between higher total vitamin B6 intake and increased HCC risk (Figure 1B).
Table 4.
Simultaneous Evaluation of Dietary Micronutrients Involved in One-Carbon Metabolism and Risk of Hepatocellular Carcinoma Among Participants With >3 Years of Follow-up: The NIH-AARP Health and Diet Study (N=453,384, Cases=559).
| >3 Years of Follow-up | ||||
|---|---|---|---|---|
| Nutrienta | Total N | Cases | Person-Years | HR (95% CI)b |
| Folate | ||||
| Q1 | 90,675 | 145 | 1,170,410 | 1.00 (ref) |
| Q2 | 90,676 | 102 | 1,190,574 | 0.90 (0.69–1.17) |
| Q3 | 90,679 | 111 | 1,199,420 | 0.70 (0.52–0.94) |
| Q4 | 90,677 | 105 | 1,202,773 | 0.80 (0.59–1.08) |
| Q5 | 90,677 | 96 | 1,206,317 | 0.78 (0.56–1.07) |
| P trendc | 0.07 | |||
| Methionine | ||||
| Q1 | 91,086 | 87 | 1,206,169 | 1.00 (ref) |
| Q2 | 90,610 | 93 | 1,199,551 | 0.92 (0.67–1.26) |
| Q3 | 91,067 | 112 | 1,201,320 | 0.94 (0.67–1.31) |
| Q4 | 90,754 | 124 | 1,191,207 | 0.83 (0.57–1.22) |
| Q5 | 89,867 | 143 | 1,171,248 | 0.65 (0.40–1.06) |
| P trendc | 0.21 | |||
| Vitamin B2 | ||||
| Q1 | 90,673 | 124 | 1,187,860 | 1.00 (ref) |
| Q2 | 90,681 | 90 | 1,197,686 | 0.97 (0.72–1.30) |
| Q3 | 90,680 | 88 | 1,199,105 | 0.97 (0.71–1.32) |
| Q4 | 90,674 | 119 | 1,196,439 | 1.25 (0.91–1.72) |
| Q5 | 90,676 | 138 | 1,188,405 | 1.27 (0.89–1.81) |
| P trendc | 0.08 | |||
| Vitamin B3 | ||||
| Q1 | 90,677 | 152 | 1,187,428 | 1.00 (ref) |
| Q2 | 90,675 | 97 | 1,196,448 | 0.69 (0.52–0.90) |
| Q3 | 90,681 | 92 | 1,198,361 | 0.59 (0.45–0.79) |
| Q4 | 90,673 | 107 | 1,195,082 | 0.62 (0.47–0.83) |
| Q5 | 90,678 | 111 | 1,192,176 | 0.51 (0.37–0.70) |
| P trendc | <0.0001 | |||
| Vitamin B6 | ||||
| Q1 | 90,678 | 124 | 1,180,011 | 1.00 (ref) |
| Q2 | 90,678 | 106 | 1,197,252 | 1.23 (0.92–1.64) |
| Q3 | 90,675 | 100 | 1,200,155 | 1.25 (0.90–1.72) |
| Q4 | 90,674 | 116 | 1,199,025 | 1.51 (1.07–2.13) |
| Q5 | 90,679 | 113 | 1,193,051 | 1.44 (0.97–2.15) |
| P trendc | 0.03 | |||
| Vitamin B12 | ||||
| Q1 | 90,675 | 108 | 1,198,617 | 1.00 (ref) |
| Q2 | 90,680 | 98 | 1,201,801 | 1.07 (0.79–1.44) |
| Q3 | 90,675 | 104 | 1,197,856 | 1.13 (0.83–1.55) |
| Q4 | 90,678 | 99 | 1,191,020 | 0.97 (0.70–1.36) |
| Q5 | 90,676 | 150 | 1,180,200 | 1.25 (0.89–1.76) |
| P trendc | 0.47 | |||
| Methyl-donor indexd | ||||
| Q1 | 90,677 | 130 | 1,177,974 | 1.00 (ref) |
| Q2 | 90,676 | 100 | 1,203,114 | 0.91 (0.69–1.20) |
| Q3 | 90,677 | 80 | 1,200,701 | 0.72 (0.54–0.98) |
| Q4 | 90,678 | 126 | 1,201,078 | 1.09 (0.83–1.44) |
| Q5 | 90,676 | 123 | 1,186,628 | 0.92 (0.69–1.22) |
| P trendc | 0.94 | |||
Abbreviations: HR, hazard ratio; CI, confidence interval; N/A, not applicable; Q1–Q5, calorie-adjusted quintiles of micronutrients intake (supplements not included).
Each micronutrient was adjusted for total caloric intake by the residual method. Quintiles were created from intake values at baseline and categorized based on distribution in the entire cohort using the 20th, 40th, 60th, and 80th percentile values as cut points.
All models adjusted for age (continuous), sex, race/ethnicity (white, black, Hispanic, other), diabetes mellitus (yes, no), smoking status (never, former, current), alcohol use (<1, 1–3, >3 drinks/day), total caloric intake (continuous), body mass index (<25, 25–29, ≥30 kg/m2), education level (<high school, high school graduate, some college/post-high school education, college graduate/post-graduate), physical activity (0, <1, 1–2, 3–4, 5+ times per week), multivitamin use (yes, no), red meat intake (0–23, 24–41, 42–63, 64–99, >99 grams/day ), and the Healthy Eating Index scores (10–59, 60–66, 67–71, 72–76, >76).
P trend was calculated by treating the quintile variable as a continuous variable.
A separate model was fitted for the methyl-donor index, adjusting for the factors listed in b.
Table 5.
Simultaneous Evaluation of Total Intake of Micronutrients Involved in One-Carbon Metabolism and Risk of Hepatocellular Carcinoma Among Participants With >3 Years of Follow-up: The NIH-AARP Health and Diet Study (N=453,384, Cases=559).
| >3 Years of Follow-up | ||||
|---|---|---|---|---|
| Nutrienta | Total N | Cases | Person-Years | HR (95% CI)b |
| Folate | ||||
| Q1 | 90,073 | 144 | 1,162,399 | 1.00 (ref) |
| Q2 | 90,510 | 102 | 1,188,470 | 0.86 (0.66–1.14) |
| Q3 | 90,877 | 110 | 1,202,050 | 0.97 (0.73–1.29) |
| Q4 | 90,947 | 107 | 1,206,311 | 0.96 (0.71–1.29) |
| Q5 | 90,977 | 96 | 1,210,263 | 0.82 (0.59–1.13) |
| P trendc | 0.45 | |||
| Methionined | ||||
| Q1 | 91,086 | 87 | 1,206,169 | 1.00 (ref) |
| Q2 | 90,610 | 93 | 1,199,551 | 0.96 (0.70–1.30) |
| Q3 | 91,067 | 112 | 1,201,320 | 1.01 (0.72–1.40) |
| Q4 | 90,754 | 124 | 1,191,207 | 0.93 (0.65–1.34) |
| Q5 | 89,867 | 143 | 1,171,248 | 0.76 (0.48–1.19) |
| P trendc | 0.27 | |||
| Vitamin B2 | ||||
| Q1 | 90,657 | 118 | 1,189,976 | 1.00 (ref) |
| Q2 | 90,659 | 117 | 1,193,762 | 1.16 (0.86–1.56) |
| Q3 | 90,775 | 103 | 1,195,174 | 1.06 (0.71–1.59) |
| Q4 | 90,753 | 107 | 1,198,515 | 1.22 (0.72–2.06) |
| Q5 | 90,540 | 114 | 1,192,067 | 0.89 (0.48–1.64) |
| P trendc | 0.93 | |||
| Vitamin B3 | ||||
| Q1 | 90,477 | 129 | 1,185,852 | 1.00 (ref) |
| Q2 | 90,707 | 122 | 1,194,687 | 0.90 (0.68–1.19) |
| Q3 | 90,745 | 99 | 1,196,460 | 0.53 (0.36–0.78) |
| Q4 | 90,814 | 90 | 1,196,634 | 0.35 (0.21–0.60) |
| Q5 | 90,641 | 119 | 1,195,861 | 0.37 (0.20–0.68) |
| P trendc | 0.001 | |||
| Vitamin B6 | ||||
| Q1 | 90,425 | 125 | 1,182,756 | 1.00 (ref) |
| Q2 | 90,828 | 114 | 1,198,705 | 1.09 (0.81–1.47) |
| Q3 | 90,696 | 99 | 1,192,976 | 1.25 (0.82–1.89) |
| Q4 | 90,833 | 105 | 1,199,714 | 1.84 (1.04–3.27) |
| Q5 | 90,602 | 116 | 1,195,343 | 2.04 (1.02–4.07) |
| P trendc | 0.04 | |||
| Vitamin B12 | ||||
| Q1 | 90,868 | 120 | 1,199,916 | 1.00 (ref) |
| Q2 | 90,635 | 102 | 1,190,496 | 0.90 (0.67–1.20) |
| Q3 | 90,725 | 109 | 1,197,578 | 1.10 (0.77–1.58) |
| Q4 | 90,741 | 92 | 1,196,258 | 1.13 (0.71–1.80) |
| Q5 | 90,415 | 136 | 1,185,246 | 1.64 (0.92–2.91) |
| P trendc | 0.08 | |||
| Methyl-donor indexe | ||||
| Q1 | 90,677 | 130 | 1,182,152 | 1.00 (ref) |
| Q2 | 90,676 | 100 | 1,199,074 | 0.83 (0.63–1.12) |
| Q3 | 90,677 | 80 | 1,199,128 | 0.64 (0.52–1.03) |
| Q4 | 90,678 | 126 | 1,199,875 | 1.18 (0.74–1.53) |
| Q5 | 90,676 | 123 | 1,189,265 | 0.92 (0.58–1.26) |
| P trendc | 0.91 | |||
Abbreviations: HR, hazard ratio; CI, confidence interval; N/A, not applicable; Q1–Q5, calorie-adjusted quintiles of micronutrients intake.
Total intake was computed as diet plus supplement use. Each micronutrient was adjusted for total calories intake by the residual method. Quintiles were created from intake values at baseline and categorized based on distribution in the entire cohort using the 20th, 40th, 60th, and 80th percentile values as cut points.
All models adjusted for age (continuous), sex, race/ethnicity (white, black, Hispanic, other), diabetes mellitus (yes, no), smoking status (never, former, current), alcohol use (<1, 1–3, >3 drinks/day), total caloric intake (continuous), body mass index (<25, 25–29, ≥30 kg/m2), education level (<high school, high school graduate, some college/post-high school education, college graduate/post-graduate), physical activity (0, <1, 1–2, 3–4, 5+ times per week), multivitamin use (yes, no), red meat intake (0–23, 24–41, 42–63, 64–99, >99 grams/day ), and the Healthy Eating Index scores (10–59, 60–66, 67–71, 72–76, >76)
P trend was calculated by treating the quintile variable as a continuous variable.
Methionine intake levels were based on dietary intake only because data on supplemental use was not available.
A separate model was fitted for the methyl-donor index, adjusting for the factors listed in b.
Figure 1.
Restricted cubic spline regression curves with three knots showing (A) a dose-response inverse association between total vitamin B3 intake and hepatocellular carcinoma (HCC) risk, and (B) dose-response positive association between total vitamin B6 intake and HCC risk (N=494,860, cases=647). Cut points for the knots were determined using the 25th, 50th, and 75th percentile values of the respective variable. The analyses were performed in models that included all six one-carbon metabolism–related micronutrient(i.e., continuous forms of total folate, methionine, and vitamins B2, B3, B6 and B12), with adjustments for age (continuous), sex, race/ethnicity (white, black, Hispanic, other), diabetes mellitus (yes, no), smoking status (never, former, current), alcohol use (<1, 1–3, >3 drinks per day), total caloric intake (continuous), body mass index (<25, 25–29, ≥30 kg/m2), education (<high school, high school graduate, some college/post-high school education, college graduate/post-graduate), physical activity (0, <1, 1–2, 3–4, 5+ times per week), multivitamin use (yes, no), red meat intake (0–23, 24–41, 42–63, 64–99, >99 grams per day ), and Healthy Eating Index scores (10–59, 60–66, 67–71, 72–76, >76). Each of micronutrient was adjusted for total caloric intake for the dietary portion using the residual method before adding intake from supplements.
Stratified analyses were performed by sex, BMI, alcohol intake, and physical activity level among the participants with more than three years of follow-up, since this group is less prone to confounding by subclinical disease at baseline. These analyses involved evaluation of total intake of all six micronutrients simultaneously, and the results did not show statistical interaction by sex, BMI, alcohol intake, or physical activity for any of the micronutrients or the methyl-donor index (Supplementary Tables 1–4). However, there were instances where associations were observed in certain subgroups. As with the previous results, higher total vitamin B3 intake was associated with a lower HCC risk both among men (HRQ5vsQ1=0.43; 95% CI=0.22–0.85; Ptrend=0.01) and women (HRQ5vsQ1=0.39; 95% CI=0.22–0.52; Ptrend=0.003) (Supplementary Tables 1). Higher total vitamin B6 intake was associated with increased HCC risk in women (HRQ5vsQ1=6.21; 95% CI=1.12–34.45; Ptrend=0.005), but not men (HRQ5vsQ1=1.67; 95% CI=0.75–3.72; Ptrend=0.17). Total folate intake also was associated with lower HCC risk among women (HRQ5vsQ1=0.31; 95% CI=0.12–0.75; Ptrend=0.04), but not men (HRQ5vsQ1=0.95; 95% CI=0.64–1.40; Ptrend=0.92). Among participants with a BMI greater than or equal to 25 kg/m2, higher total vitamin B3 intake was associated with lower HCC risk (HRQ5vsQ1=0.25; 95% CI=0.13–0.50; Ptrend<0.0001), whereas higher total vitamin B6 intake was associated with increased HCC risk (HRQ5vsQ1=3.58; 95% CI=1.62–7.91; Ptrend=0.0006), but no association was found among participants with BMI less than 25 kg/m2 (Supplementary Table 2). Higher vitamin B6 intake also was associated with an increased HCC risk among participants who consumed more than three alcoholic drinks per day (HRQ5vsQ1=7.38; 95% CI=1.02–53.20; Ptrend=0.04), but not those in the other categories of alcohol intake (Supplementary Table 3). Furthermore, higher total vitamin B3 intake was associated with lower HCC risk among participants who engaged in physical activity less than once a week (HRQ5vsQ1=0.25; 95% CI=0.12–0.75; Ptrend=0.01) and those who engaged in physical activity two to three times a week (HRQ5vsQ1=0.45; 95% CI=0.14–0.65; Ptrend=0.0008), but not those in the other physical activity categories (Supplementary Table 4).
Discussion
It has long been suspected that micronutrients involved in one-carbon metabolism play important roles in HCC development through modulation of DNA methylation.10, 11, 13 In this large prospective cohort study, involving 494,860 participants with 16 years of follow-up, we found that higher vitamin B3 (niacin) intake is associated with a lower risk of HCC, after controlling for several known and potential risk factors of HCC, including diabetes mellitus, BMI, smoking history, red meat intake, the Healthy Eating Index (a marker of the overall quality of a person’s diet) and other one-carbon micronutrients. There also was a suggestion that higher vitamin B6 intake is associated with an increased HCC risk among participants with more than three years of follow-up. Stratified analyses were performed by sex, BMI, alcohol intake, and physical activity for associations between intakes of folate, methionine, and vitamins B2, B3, B6, and B12, and HCC risk, but no statistical interaction was observed. Overall, the findings suggest a potential HCC risk reduction through dietary modifications that incorporate healthy sources of vitamin B3, such as legumes, seeds, nuts, salmon, and soy products, while limiting intake of foods and supplements that contain high amounts of vitamin B6, such as beef liver, other types of organ meat, and some starchy vegetables (e.g., white potatoes and corn).36–38
In an earlier analysis of the NIH-AARP Diet and Health Study data that was focused on assessing the modifying effect of folate intake on the association between alcohol consumption and HCC risk, and included a smaller number of HCC cases (n=435), higher total folate intake was associated with a less deleterious effect of alcohol consumption on HCC risk.24 The present study included a larger number of HCC cases (n=647) accrued over an additional five years of follow-up. When examined individually, neither dietary folate nor total folate intake was associated with HCC risk. However, when examined in the presence of other one-carbon metabolism–related micronutrients, higher dietary folate intake (but not total folate) was associated with a lower HCC risk. Some blood-based studies have also reported an inverse association between folate metabolite levels and HCC risk28, 29; however, the results are conflicting since other studies did not find an association between folate metabolite levels and HCC risk.26, 27
It is important to note that the impact of folate status on cancer risk depends on a number of factors, including genetic variation in folate-metabolizing genes and alcohol intake. In the present study, we accounted for alcohol intake through statistical adjustment. We further evaluated the modifying effect of alcohol intake on the association between folate and HCC risk in the presence of other one-carbon metabolism–related micronutrients and did not find effect modification by alcohol intake. The difference in the results between the previous and the present study may be explained by variation in methodological approaches. In the previous study,24 the modifying effect of folate intake was assessed for the association between alcohol intake and HCC risk, without considering the potential effects of other one-carbon–related micronutrients. By design, the present study assessed the modifying effect of alcohol intake on the association between folate intake and HCC risk in the presence of other one-carbon metabolism–related micronutrients as a means of simultaneous evaluation of a set of biochemically related micronutrients that have been implicated in HCC development.10, 13
To our knowledge, this is the first study to report an association between higher vitamin B3 intake and lower HCC risk. Prior studies on one-carbon metabolism–related micronutrient intake and HCC risk did not include vitamin B3.24–30 In our study population, the top five dietary sources of vitamin B3 are ready-to-eat breakfast cereal, black coffee, bread/dinner rolls, chicken (not fried) and tuna. In the human body, vitamin B3 is metabolized into the enzymatic cofactor, nicotinamide adenine dinucleotide (NAD), which is used by over 400 enzymes for various biological functions, including posttranslational modifications of cellular proteins.39, 40 However, NAD is not completely stable, it is converted to nicotinamide adenine dinucleotide phosphate (NADP) and both NAD and NADP are involved in cellular oxidation reduction processes that contribute to the prevention of oxidative DNA damage and maintenance of genome integrity.41, 42 In the one-carbon metabolism pathway, vitamin B3 serves as a cofactor for the enzyme dihydrofolate reductase and is used for the conversion of folate to dihydrofolate then to tetrahydrofolate, which is eventually used for the formation of the universal methyl-donor, S-adenosylmethionine that is involved in about 85% of all methylation reactions.10, 13 Furthermore, vitamin B3 is known to lower blood levels of low-density lipoprotein cholesterol (a risk factor for NAFLD and a component of metabolic syndrome, both of which are associated with HCC development) while increasing blood levels of high-density lipoproteins (which inhibit inflammatory properties of oxidized phospholipids),43–46 and these could also be potential mechanisms for its association with HCC. Our study shows that higher intake of dietary and total vitamin B3 are each associated with a lower risk for HCC when the associations were examined individually as well as simultaneously with other one-carbon metabolism–related micronutrients in the model. The association for vitamin B3 remained significant in analyses restricted to participants with more than three years of follow-up, and was significant in both men and women. A restricted cubic spline regression curve further showed a dose-response relationship between higher vitamin B3 intake and lower HCC risk. Thus, this prospective study provides compelling evidence of a potential etiological link between vitamin B3 intake and lower risk of HCC development.
Our study suggest also that higher intake of vitamin B6 is associated with a higher risk of HCC among participants with more than three years of follow-up. The top five dietary sources of vitamin B6 in our study population are bananas, white potatoes, easy-to-eat breakfast cereal (good fiber), orange/grapefruit juice, and breakfast cereal (other). This is generally consistent with what has been reported among adults in the United States (e.g., fortified cereal, poultry, bananas, avocado, and starchy vegetables).38 The biological explanation for the observed association is not completely clear. However, vitamin B6 serves as an enzymatic cofactor in several inflammatory pathways, including the kynurenine and homocysteine metabolism pathways.47 The kynurenine pathway, in particular, is known to facilitate immune escape of malignant cells, thereby promoting tumor growth and proliferation,48 which may be a possible mechanism for its association with HCC. In contrast to our findings, an Italian case-control study, involving 185 HCC cases and 412 controls, did not find an association between dietary vitamin B6 intake and HCC risk.49 A similar null finding was reported in a prospective study among Finnish male smokers.26 In contrast, a nested case-control study of 297 HCC cases and 631 controls found that higher circulating levels of pyridoxal-5-phosphate, 1 of 3 phosphorylated forms of vitamin B6,27 is associated with lower HCC risk. It is worth noting that higher dietary intake of vitamin B6 has been associated with increased risk for endometrial cancer in the NIH-AARP Diet and Health Study cohort.50 Hence, additional studies in large prospective cohorts are needed to clarify the association between vitamin B6 intake and HCC risk.
We did not have data on choline and betaine intake for analysis. Fore methionine, only dietary data were available, but there was no plausible association was observed with HCC risk. In a case-control study conducted among Chinese participants, Zhou et al.25 found that higher dietary intakes of choline and betaine were each associated with lower HCC risk, but as with our study, they also did not find an association between dietary methionine intake and HCC risk. Schwartz et al.26 also did not find an association between circulating methionine levels and HCC risk in a prospective cohort study, but a nested case-control study by Butler et al.27 reported an association between elevated blood levels of methionine and higher HCC risk.27 Furthermore, in the presented study, we did not find an association between vitamin B12 intake and HCC risk. At least one blood-based study has reported higher HCC risk among individuals with elevated serum vitamin B12 levels30, but another study reported a null association.26Moreover, vitamin B2 was not associated with HCC risk in the present study, and findings from existing studies on vitamin B2 and HCC risk are mostly null.26, 49 One unique feature of our study is the assessment of the methyl-donor index, as a composite measure of DNA methylation potential, but no association was found between the methyl-donor index and HCC risk.
The strengths of our study include its large sample size, long follow-up period, control for several potential confounders, and simultaneous evaluation of multiple one-carbon metabolism–related micronutrients in one model. Additionally, the analyses performed among participants with more than three years of follow-up minimizes concerns of confounding by undiagnosed HCC at baseline. The evaluation of effect modification by well-known HCC risk factors also adds to the study strengths. Limitations of our study include its predominantly non-Hispanic white population, lack of data on HBV/HCV status, and lack of data on some potentially important one-carbon metabolism–related micronutrients, such as choline and betaine. Additional limitations include our inability to account for endogenous sources of one-carbon metabolism–related micronutrients and inter-individual variation in genes involved in one-carbon metabolism. The study is further limited by the single diet assessment performed at baseline. However, the dietary questionnaire used in the NIH-AARP study was designed to assess habitual dietary patterns in the year prior to enrollment, which is often many years before cancer development—the potentially susceptibility period.
In summary, the results of this large prospective cohort study suggest that higher vitamin B3 (niacin) intake is associated with a lower risk for HCC, whereas higher intake of vitamin B6 is associated with a higher HCC risk. Additional studies in large prospective cohorts that incorporate a broader list of one-carbon metabolism–related micronutrients, including choline and betaine, would improve our understanding of the role of one-carbon metabolism–related micronutrient intake in HCC development.
Supplementary Material
Novelty and Impact:
This comprehensive investigation of the association between one-carbon metabolism–related micronutrient intake and risk of hepatocellular carcinoma (HCC) development shows that higher vitamin B3 intake is associated with a lower risk of HCC, whereas higher intake of vitamin B6 is associated with a higher HCC risk. HCC prevention strategies might be enhanced with dietary modifications involving healthy sources of vitamin B3 coupled with limited intake of foods and supplements containing high amounts of vitamin B6.
Acknowledgments
This research was supported in part by the Intramural Research Program of the NIH, National Cancer Institute. Cancer incidence data from the Atlanta metropolitan area were collected by the Georgia Center for Cancer Statistics, Department of Epidemiology, Rollins School of Public Health, Emory University, Atlanta, Georgia. Cancer incidence data from California were collected by the California Cancer Registry, California Department of Public Health’s Cancer Surveillance and Research Branch, Sacramento, California. Cancer incidence data from the Detroit metropolitan area were collected by the Michigan Cancer Surveillance Program, Community Health Administration, Lansing, Michigan. The Florida cancer incidence data used in this report were collected by the Florida Cancer Data System (Miami, Florida) under contract with the Florida Department of Health, Tallahassee, Florida. The views expressed herein are solely those of the authors and do not necessarily reflect those of the FCDC or FDOH. Cancer incidence data from Louisiana were collected by the Louisiana Tumor Registry, Louisiana State University Health Sciences Center School of Public Health, New Orleans, Louisiana. Cancer incidence data from New Jersey were collected by the New Jersey State Cancer Registry, The Rutgers Cancer Institute of New Jersey, New Brunswick, New Jersey. Cancer incidence data from North Carolina were collected by the North Carolina Central Cancer Registry, Raleigh, North Carolina. Cancer incidence data from Pennsylvania were supplied by the Division of Health Statistics and Research, Pennsylvania Department of Health, Harrisburg, Pennsylvania. The Pennsylvania Department of Health specifically disclaims responsibility for any analyses, interpretations, or conclusions. Cancer incidence data from Arizona were collected by the Arizona Cancer Registry, Division of Public Health Services, Arizona Department of Health Services, Phoenix, Arizona. Cancer incidence data from Texas were collected by the Texas Cancer Registry, Cancer Epidemiology and Surveillance Branch, Texas Department of State Health Services, Austin, Texas. Cancer incidence data from Nevada were collected by the Nevada Central Cancer Registry, Division of Public and Behavioral Health, State of Nevada Department of Health and Human Services, Carson City, Nevada.
We are indebted to the participants in the NIH-AARP Diet and Health Study for their outstanding cooperation. We also thank Sigurd Hermansen and Kerry Grace Morrissey from Westat for study outcomes ascertainment and management and Leslie Carroll at Information Management Services for data support and analysis.
Abbreviations
- BMI
Body mass index
- CI
confidence interval
- FFQ
food-frequency questionnaire
- HBV
hepatitis B virus
- HCC
hepatocellular carcinoma
- HCV
hepatitis C virus
- HR
hazard ratio
- NAD
nicotinamide adenine dinucleotide
- NADP
nicotinamide adenine dinucleotide phosphate
- NAFLD
Non-alcoholic fatty liver disease
- NIH-AARP
National Institutes of Health and formerly the American Association of Retired Persons
- Q1
lowest or 1st quintile
- Q5
highest or 1st quintile
Footnotes
Disclosure of Potential Conflicts of Interest
The authors declare no potential conflicts of interest
Disclaimer
The content is solely the responsibility of the authors and does not necessarily represent the official views of the NIH.
References
- 1.Altekruse SF, Henley SJ, Cucinelli JE, McGlynn KA. Changing hepatocellular carcinoma incidence and liver cancer mortality rates in the United States. Am J Gastroenterol 2014;109: 542–53. [DOI] [PMC free article] [PubMed] [Google Scholar]
- 2.Siegel RL, Miller KD, Jemal A. Cancer statistics, 2020. CA Cancer J Clin 2020;70: 7–30. [DOI] [PubMed] [Google Scholar]
- 3.Makarova-Rusher OV, Altekruse SF, McNeel TS, Ulahannan S, Duffy AG, Graubard BI, Greten TF, McGlynn KA. Population attributable fractions of risk factors for hepatocellular carcinoma in the United States. Cancer 2016;122: 1757–65. [DOI] [PMC free article] [PubMed] [Google Scholar]
- 4.Petrick JL, Kelly SP, Altekruse SF, McGlynn KA, Rosenberg PS. Future of Hepatocellular Carcinoma Incidence in the United States Forecast Through 2030. J Clin Oncol 2016;34: 1787–94. [DOI] [PMC free article] [PubMed] [Google Scholar]
- 5.Rahib L, Smith BD, Aizenberg R, Rosenzweig AB, Fleshman JM, Matrisian LM. Projecting cancer incidence and deaths to 2030: the unexpected burden of thyroid, liver, and pancreas cancers in the United States. Cancer Res 2014;74: 2913–21. [DOI] [PubMed] [Google Scholar]
- 6.Chung RT, Baumert TF. Curing chronic hepatitis C--the arc of a medical triumph. N Engl J Med 2014;370: 1576–8. [DOI] [PubMed] [Google Scholar]
- 7.Davis SM, Daily S, Kristjansson AL, Kelley GA, Zullig K, Baus A, Davidov D, Fisher M. Needle exchange programs for the prevention of hepatitis C virus infection in people who inject drugs: a systematic review with meta-analysis. Harm Reduct J 2017;14: 25. [DOI] [PMC free article] [PubMed] [Google Scholar]
- 8.Brunaud L, Alberto JM, Ayav A, Gerard P, Namour F, Antunes L, Braun M, Bronowicki JP, Bresler L, Gueant JL. Effects of vitamin B12 and folate deficiencies on DNA methylation and carcinogenesis in rat liver. Clin Chem Lab Med 2003;41: 1012–9. [DOI] [PubMed] [Google Scholar]
- 9.Pogribny IP, James SJ, Beland FA. Molecular alterations in hepatocarcinogenesis induced by dietary methyl deficiency. Mol Nutr Food Res 2012;56: 116–25. [DOI] [PubMed] [Google Scholar]
- 10.Puszyk WM, Trinh TL, Chapple SJ, Liu C. Linking metabolism and epigenetic regulation in development of hepatocellular carcinoma. Lab Invest 2013;93: 983–90. [DOI] [PMC free article] [PubMed] [Google Scholar]
- 11.Zeisel SH, da Costa KA, Albright CD, Shin OH. Choline and hepatocarcinogenesis in the rat. Adv Exp Med Biol 1995;375: 65–74. [DOI] [PubMed] [Google Scholar]
- 12.Anderson OS, Sant KE, Dolinoy DC. Nutrition and epigenetics: an interplay of dietary methyl donors, one-carbon metabolism and DNA methylation. J Nutr Biochem 2012;23: 853–9. [DOI] [PMC free article] [PubMed] [Google Scholar]
- 13.Mahmoud AM, Ali MM. Methyl Donor Micronutrients that Modify DNA Methylation and Cancer Outcome. Nutrients 2019;11. [DOI] [PMC free article] [PubMed] [Google Scholar]
- 14.Choline Zeisel S., Other Methyl-Donors and Epigenetics. Nutrients 2017;9. [DOI] [PMC free article] [PubMed] [Google Scholar]
- 15.Niculescu MD, Zeisel SH. Diet, methyl donors and DNA methylation: interactions between dietary folate, methionine and choline. J Nutr 2002;132: 2333s–5s. [DOI] [PubMed] [Google Scholar]
- 16.Nilsson E, Matte A, Perfilyev A, de Mello VD, Kakela P, Pihlajamaki J, Ling C. Epigenetic Alterations in Human Liver From Subjects With Type 2 Diabetes in Parallel With Reduced Folate Levels. J Clin Endocrinol Metab 2015;100: E1491–501. [DOI] [PMC free article] [PubMed] [Google Scholar]
- 17.Tsujiuchi T, Tsutsumi M, Sasaki Y, Takahama M, Konishi Y. Hypomethylation of CpG sites and c-myc gene overexpression in hepatocellular carcinomas, but not hyperplastic nodules, induced by a choline-deficient L-amino acid-defined diet in rats. Jpn J Cancer Res 1999;90: 909–13. [DOI] [PMC free article] [PubMed] [Google Scholar]
- 18.Locker J, Reddy TV, Lombardi B. DNA methylation and hepatocarcinogenesis in rats fed a choline-devoid diet. Carcinogenesis 1986;7: 1309–12. [DOI] [PubMed] [Google Scholar]
- 19.Ghoshal AK, Farber E. The induction of liver cancer by dietary deficiency of choline and methionine without added carcinogens. Carcinogenesis 1984;5: 1367–70. [DOI] [PubMed] [Google Scholar]
- 20.Wainfan E, Poirier LA. Methyl groups in carcinogenesis: effects on DNA methylation and gene expression. Cancer Res 1992;52: 2071s–7s. [PubMed] [Google Scholar]
- 21.Starlard-Davenport A, Tryndyak V, Kosyk O, Ross SR, Rusyn I, Beland FA, Pogribny IP. Dietary methyl deficiency, microRNA expression and susceptibility to liver carcinogenesis. World Rev Nutr Diet 2010;101: 123–30. [DOI] [PMC free article] [PubMed] [Google Scholar]
- 22.Takumi S, Okamura K, Yanagisawa H, Sano T, Kobayashi Y, Nohara K. The effect of a methyl-deficient diet on the global DNA methylation and the DNA methylation regulatory pathways. J Appl Toxicol 2015;35: 1550–6. [DOI] [PubMed] [Google Scholar]
- 23.Wilson MJ, Shivapurkar N, Poirier LA. Hypomethylation of hepatic nuclear DNA in rats fed with a carcinogenic methyl-deficient diet. Biochem J 1984;218: 987–90. [DOI] [PMC free article] [PubMed] [Google Scholar]
- 24.Persson EC, Schwartz LM, Park Y, Trabert B, Hollenbeck AR, Graubard BI, Freedman ND, McGlynn KA. Alcohol consumption, folate intake, hepatocellular carcinoma, and liver disease mortality. Cancer Epidemiol Biomarkers Prev 2013;22: 415–21. [DOI] [PMC free article] [PubMed] [Google Scholar]
- 25.Zhou RF, Chen XL, Zhou ZG, Zhang YJ, Lan QY, Liao GC, Chen YM, Zhu HL. Higher dietary intakes of choline and betaine are associated with a lower risk of primary liver cancer: a case-control study. Sci Rep 2017;7: 679. [DOI] [PMC free article] [PubMed] [Google Scholar]
- 26.Schwartz LM, Persson EC, Weinstein SJ, Graubard BI, Freedman ND, Mannisto S, Albanes D, McGlynn KA. Alcohol consumption, one-carbon metabolites, liver cancer and liver disease mortality. PLoS One 2013;8: e78156. [DOI] [PMC free article] [PubMed] [Google Scholar]
- 27.Butler LM, Arning E, Wang R, Bottiglieri T, Govindarajan S, Gao YT, Yuan JM. Prediagnostic levels of serum one-carbon metabolites and risk of hepatocellular carcinoma. Cancer Epidemiol Biomarkers Prev 2013;22: 1884–93. [DOI] [PMC free article] [PubMed] [Google Scholar]
- 28.Welzel TM, Katki HA, Sakoda LC, Evans AA, London WT, Chen G, O’Broin S, Shen FM, Lin WY, McGlynn KA. Blood folate levels and risk of liver damage and hepatocellular carcinoma in a prospective high-risk cohort. Cancer Epidemiol Biomarkers Prev 2007;16: 1279–82. [DOI] [PubMed] [Google Scholar]
- 29.Wu MY, Kuo CS, Lin CY, Lu CL, Syu Huang RF. Lymphocytic mitochondrial DNA deletions, biochemical folate status and hepatocellular carcinoma susceptibility in a case-control study. Br J Nutr 2009;102: 715–21. [DOI] [PubMed] [Google Scholar]
- 30.Arendt JF, Pedersen L, Nexo E, Sorensen HT. Elevated plasma vitamin B12 levels as a marker for cancer: a population-based cohort study. J Natl Cancer Inst 2013;105: 1799–805. [DOI] [PMC free article] [PubMed] [Google Scholar]
- 31.Schatzkin A, Subar AF, Thompson FE, Harlan LC, Tangrea J, Hollenbeck AR, Hurwitz PE, Coyle L, Schussler N, Michaud DS, Freedman LS, Brown CC, et al. Design and serendipity in establishing a large cohort with wide dietary intake distributions : the National Institutes of Health-American Association of Retired Persons Diet and Health Study. Am J Epidemiol 2001;154: 1119–25. [DOI] [PubMed] [Google Scholar]
- 32.Subar AF, Midthune D, Kulldorff M, Brown CC, Thompson FE, Kipnis V, Schatzkin A. Evaluation of alternative approaches to assign nutrient values to food groups in food frequency questionnaires. Am J Epidemiol 2000;152: 279–86. [DOI] [PubMed] [Google Scholar]
- 33.Willett W, Stampfer MJ. Total energy intake: implications for epidemiologic analyses. Am J Epidemiol 1986;124: 17–27. [DOI] [PubMed] [Google Scholar]
- 34.Chamberlain JA, Dugue PA, Bassett JK, Hodge AM, Brinkman MT, Joo JE, Jung CH, Makalic E, Schmidt DF, Hopper JL, Buchanan DD, English DR, et al. Dietary intake of one-carbon metabolism nutrients and DNA methylation in peripheral blood. Am J Clin Nutr 2018;108: 611–21. [DOI] [PubMed] [Google Scholar]
- 35.Durrleman S, Simon R. Flexible regression models with cubic splines. Stat Med 1989;8: 551–61. [DOI] [PubMed] [Google Scholar]
- 36.Mackey AD DS, Gregory JF III. Vitamin B6. In: Shils ME, Shike M, Ross AC, Caballero B, Cousins RJ, eds. Modern Nutrition in Health and Disease. 10th ed Baltimore, MD: Lippincott Williams & Wilkins; 2006:452–461. [Google Scholar]
- 37.Cotton PA, Subar AF, Friday JE, Cook A. Dietary sources of nutrients among US adults, 1994 to 1996. J Am Diet Assoc 2004;104: 921–30. [DOI] [PubMed] [Google Scholar]
- 38.Larsson SC, Orsini N, Wolk A. Vitamin B6 and risk of colorectal cancer: a meta-analysis of prospective studies. JAMA 2010;303: 1077–83. [DOI] [PubMed] [Google Scholar]
- 39.Penberthy WTKJNIEJ, Macdonald IA, Zeisel SH, eds. Present Knowledge in Nutrition, 10th ed Washington, DC: Wiley-Blackwell; 2012:293–306. [Google Scholar]
- 40.Kirkland JB. Niacin status, NAD distribution and ADP-ribose metabolism. Curr Pharm Des 2009;15: 3–11. [DOI] [PubMed] [Google Scholar]
- 41.Yamamoto K, Tsukidate K, John FL. Differing effects of the inhibition of poly (ADP-ribose) polymerase on the course of oxidative cell injury in hepatocytes and fibroblasts. Biochem Pharmcol 1993;46: 483–91. [DOI] [PubMed] [Google Scholar]
- 42.Wu M-F, Yin J-H, Hwang C-S, Tang C-M, Yang D-I. NAD attenuates oxidative DNA damages induced by amyloid beta-peptide in primary rat cortical neurons. Free Radic Res 2014;48: 794–805. [DOI] [PubMed] [Google Scholar]
- 43.Sun D-Q, Liu W-Y, Wu S-J, Zhu G-Q, Braddock M, Zhang D-C, Shi K-Q, Song D, Zheng M-H. Increased levels of low-density lipoprotein cholesterol within the normal range as a risk factor for nonalcoholic fatty liver disease. Oncotarget 2016;7: 5728. [DOI] [PMC free article] [PubMed] [Google Scholar]
- 44.Boden WE, Sidhu MS, Toth PP. The therapeutic role of niacin in dyslipidemia management. J Cardiovasc Pharmacol Ther 2014;19: 141–58. [DOI] [PubMed] [Google Scholar]
- 45.Navab M, Anantharamaiah GM, Fogelman AM. The role of high-density lipoprotein in inflammation. Trends Cardiovasc Med 2005;15: 158–61. [DOI] [PubMed] [Google Scholar]
- 46.Kirkland JB. Niacin and carcinogenesis. Nutr Cancer 2003;46: 110–8. [DOI] [PubMed] [Google Scholar]
- 47.Ueland PM, McCann A, Midttun O, Ulvik A. Inflammation, vitamin B6 and related pathways. Mol Aspects Med 2017;53: 10–27. [DOI] [PubMed] [Google Scholar]
- 48.Heng B, Lim CK, Lovejoy DB, Bessede A, Gluch L, Guillemin GJ. Understanding the role of the kynurenine pathway in human breast cancer immunobiology. Oncotarget 2016;7: 6506–20. [DOI] [PMC free article] [PubMed] [Google Scholar]
- 49.Polesel J, Talamini R, Montella M, Maso LD, Crovatto M, Parpinel M, Izzo F, Tommasi LG, Serraino D, La Vecchia C, Franceschi S. Nutrients intake and the risk of hepatocellular carcinoma in Italy. Eur J Cancer 2007;43: 2381–7. [DOI] [PubMed] [Google Scholar]
- 50.Lu J, Trabert B, Liao LM, Pfeiffer RM, Michels KA. Dietary intake of nutrients involved in folate-mediated one-carbon metabolism and risk for endometrial cancer. Int J Epidemiol 2019;48: 474–88. [DOI] [PMC free article] [PubMed] [Google Scholar]
Associated Data
This section collects any data citations, data availability statements, or supplementary materials included in this article.
Supplementary Materials
Data Availability Statement
The study data can be made available to researchers upon request to and approval by the NIH-AARP Diet and Health Cohort Study. For instructions on how to apply for data, researchers can visit https://www.nihaarpstars.com/.