Abstract
Antibodies that antagonize extracellular receptor–ligand interactions are used as therapeutic agents for many diseases to inhibit signalling by cell-surface receptors1. However, this approach does not directly prevent intracellular signalling, such as through tonic or sustained signalling after ligand engagement. Here we present an alternative approach for attenuating cell-surface receptor signalling, termed receptor inhibition by phosphatase recruitment (RIPR). This approach compels cis-ligation of cell-surface receptors containing ITAM, ITIM or ITSM tyrosine phosphorylation motifs to the promiscuous cell-surface phosphatase CD452,3, which results in the direct intracellular dephosphorylation of tyrosine residues on the receptor target. As an example, we found that tonic signalling by the programmed cell death-1 receptor (PD-1) results in residual suppression of T cell activation, but is not inhibited by ligand-antagonist antibodies. We engineered a PD-1 molecule, which we denote RIPR-PD1, that induces cross-linking of PD-1 to CD45 and inhibits both tonic and ligand-activated signalling. RIPR-PD1 demonstrated enhanced inhibition of checkpoint blockade compared with ligand blocking by anti-PD1 antibodies, and increased therapeutic efficacy over anti-PD1 in mouse tumour models. We also show that the RIPR strategy extends to other immune-receptor targets that contain activating or inhibitory ITIM, ITSM or ITAM motifs; for example, inhibition of the macrophage SIRPα ‘don’t eat me’ signal with a SIRPα–CD45 RIPR molecule potentiates antibody-dependent cellular phagocytosis beyond that of SIRPα blockade alone. RIPR represents a general strategy for direct attenuation of signalling by kinase-activated cell-surface receptors.
To detect extracellular cues, lymphocytes have developed a sophisticated signalling apparatus that uses multiple, structurally diverse surface receptors that signal through immunoreceptor tyrosine-based motifs (ITAM, ITIM and ITSMs)4. Signalling initiated by these motifs relies on tyrosine phosphorylation that is induced by members of the Src kinase family, such as LCK or FYN4. The degree of receptor phosphorylation is regulated by several processes, including the opposing actions of phosphatases such as CD452. Although ligand binding promotes receptor phosphorylation, ligand-independent signalling has been described for the T cell-receptor (TCR)5,6, cytotoxic T-lymphocyte-associated protein 4 (CTLA-4)7, CD288 and PD-19–11.
Regulation of T cell signalling by co-receptors, such as PD-1 and CTLA-4, has been at the centre of recent breakthroughs in cancer immunotherapy1. Signalling by PD-1 and CTLA-4 contributes to an ‘exhausted’ phenotype, which attenuates the immune response to pathogens and tumours. Binding to PD-L1 or PD-L2 triggers the phosphorylation of PD-1 signalling motifs and results in the recruitment of SHP1 or SHP212. Checkpoint blockade through the inhibition of PD-1 ligand binding aims to reduce PD-L1/2-induced signalling and thereby rescue T cell cytotoxic activity from an exhausted phenotype. Although a substantial percentage of patients respond to checkpoint blockade, many either show a transient delay in tumour growth or fail to respond13.
Here we show that, although anti-PD-1 antibodies block ligand-activated signalling efficiently, they do not inhibit sustained intracellular PD-1 signalling, which continues to suppress T cell function. To address this, we engineered a bispecific molecule to recruit CD45—an abundant and promiscuous receptor tyrosine phosphatase3—to within close proximity of PD-1, such that the intracellular phosphatase domain of CD45 acts intracellularly, in cis, on the phosphorylated tyrosine (p-Tyr) residues of the PD-1 ITIM–ITSM motif, thus inhibiting tonic and ligand-induced signalling. This approach, which we term receptor inhibition by phosphatase recruitment (RIPR), was found to potentiate T cell activity beyond that seen with PD-1/PD-L1 antagonist antibodies, and to reduce tumour growth in mouse models of small-cell lung cancer and colon adenocarcinoma. The potential extension of this approach to modulate signalling by other immunoreceptors is demonstrated for CD28, CTLA-4 and SIRPα, thus offering a general strategy for the enhanced inhibition of kinase-activated receptors.
Tonic PD-1 signalling suppresses T cell activation
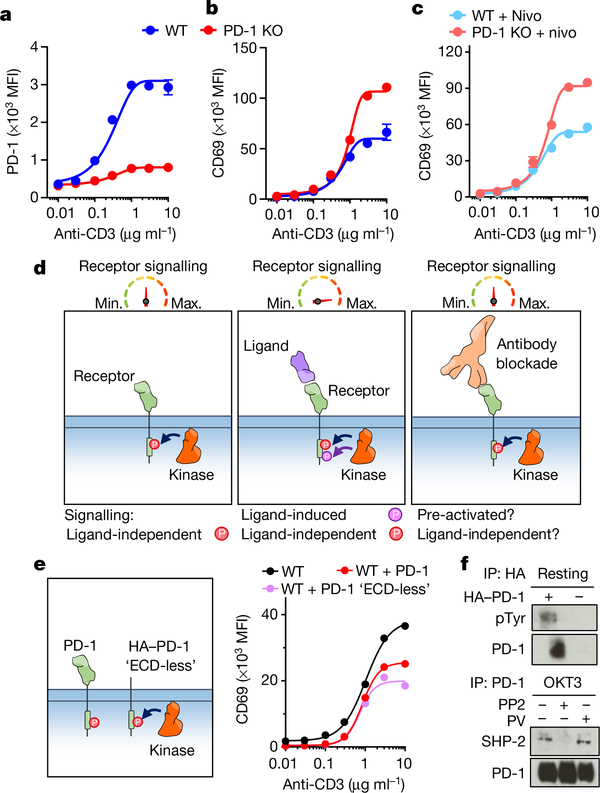
Phosphorylation of PD-1 has been detected in resting T cells11,14, and PD-1 knockout seems to enhance the effector profile of T cells even in the absence of PD-1 ligands15. To investigate whether PD-1 overexpression affects T cell activity, we transduced Jurkat T cells with guide RNAs (gRNAs) targeting PD-1 (also known as PDCD1) to generate a CRISPR–Cas9-mediated PD-1-knockout cell line (Fig. 1a). After activation with anti-CD3ε we observed that, in the absence of PD-1, CD69 and CD25 were upregulated by around 50%, whereas TCR downregulation was not affected (Fig. 1b, Extended Data Fig. 1a). By contrast, overexpression of PD-1 diminished CD69 upregulation upon T cell stimulation (Extended Data Fig. 1b–d). PD-L1 and PD-L2 were not detected in these cells (Extended Data Fig. 1h, i), and treatment with nivolumab did not rescue cells from PD-1-mediated inhibition (Fig. 1c). The incubation of Jurkat T cells with a combination of nivolumab, anti-PD-L1 and anti-PD-L2 antibodies also failed to fully recover CD69 upregulation (Extended Data Fig. 1e, f). These initial experiments suggest the existence of a tonic PD-1-mediated signalling (Fig. 1d). To account for the potential contribution of unknown PD-1 ligands we expressed a truncated version of PD-1 in which the extracellular domain (ECD) was replaced with a haemagglutinin-tag. Expression of this ‘ECD-less’ version of PD-1 reduced CD69 upregulation in response to activation with anti-CD3ε (Fig. 1e, Extended Data Fig. 1g). In agreement with these results, PD-1 phosphorylation was detected in resting Jurkat T cells transduced with PD-1 (Fig. 1f). Furthermore, we detected SHP-2—a proxy for phosphorylated PD-1—after immunoprecipitation of endogenous PD-1 (Fig. 1f). Taken together, these results suggest that PD-1 signalling can occur to some degree before ligand binding, and is not fully reversed by antibody blockade. These observations led us to explore an approach to directly reduce tonic and ligand-induced PD-1 signalling through enforced dephosphorylation of the PD-1 intracellular domain (Fig. 2a).
Fig. 1 |. Ligand-independent PD1 signalling reduces T cell activation.
Jurkat T cells were transduced with gRNA targeting PD-1 (J-CRISPR-PD-1) and stimulated with OKT3. a, Quantification of PD-1 expression. WT, wild-type Jurkat cells. b, c, CD69 expression in the absence (b) or presence (c) of nivolumab (nivo). In a–c, data are mean ± s.d. from n = 3 biological replicates representative of 3 independent experiments. d, Schematic depiction of PD-1 phosphorylation before (left) and after (middle) ligand binding and anti-PD-1 antibody blockade (right). e, Left, Jurkat T cells were transduced with PD-1 lacking the extracellular region. Right, quantification of CD69 expression. Data are mean ± s.d. from n = 2 biological replicates representative of 2 independent experiments. f, Detection of PD-1 phosphorylation and SHP-2 in Jurkat T cells by western blot, after PD-1 immunoprecipitation (IP) and various treatments (PV, pervanadate; PP2, LCK inhibitor). Data are representative of 2 independent experiments. For uncropped gels, see Supplementary Fig. 1.
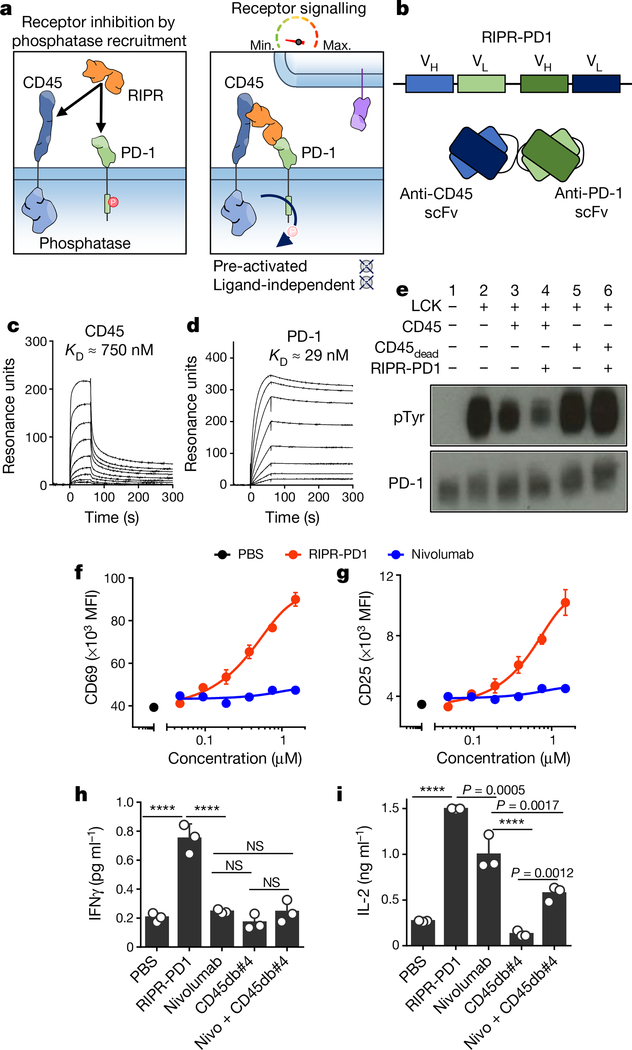
Fig. 2 |. Enforced CD45 phosphatase recruitment reduces PD-1 phosphorylation and potentiates T cell activation.
a, Schematic depiction of RIPR-mediated receptor inhibition. b, Schematic representation of RIPR-PD1 depicting the connection between the variable heavy (VH) and variable light (VL) chains of anti-CD45 and anti-PD-1 antibodies. c, d, SPR of RIPR-PD1 binding to CD45 (c) and PD-1 (d). Data are representative of 2 independent experiments. e, HEK293 cells were transiently transfected with human PD-1, LCK, CD45 or CD45dead, after which cells were incubated with RIPR-PD1. Lysates were analysed for phosphotyrosine and PD-1 by western blot after PD-1 immunoprecipitation. Data are representative of 3 independent experiments. For uncropped gels, see Supplementary Fig. 1. f, g, Quantification of CD69 (f) and CD25 (g) expression in Jurkat T cells stimulated with OKT3 and treated with PBS, RIPR-PD1 or nivolumab. h, i, IFNγ (h) and IL-2 (i) secretion by HER2–4-1BB-CD3ζ CAR T cells treated with various molecules, as indicated, in response to coculture with MG63.3 tumour cells. In f–i, data are mean ± s.d. from n = 3 biological replicates representative of 3 independent experiments. ****P < 0.0001.
CD45 recruitment reduces PD-1 phosphorylation
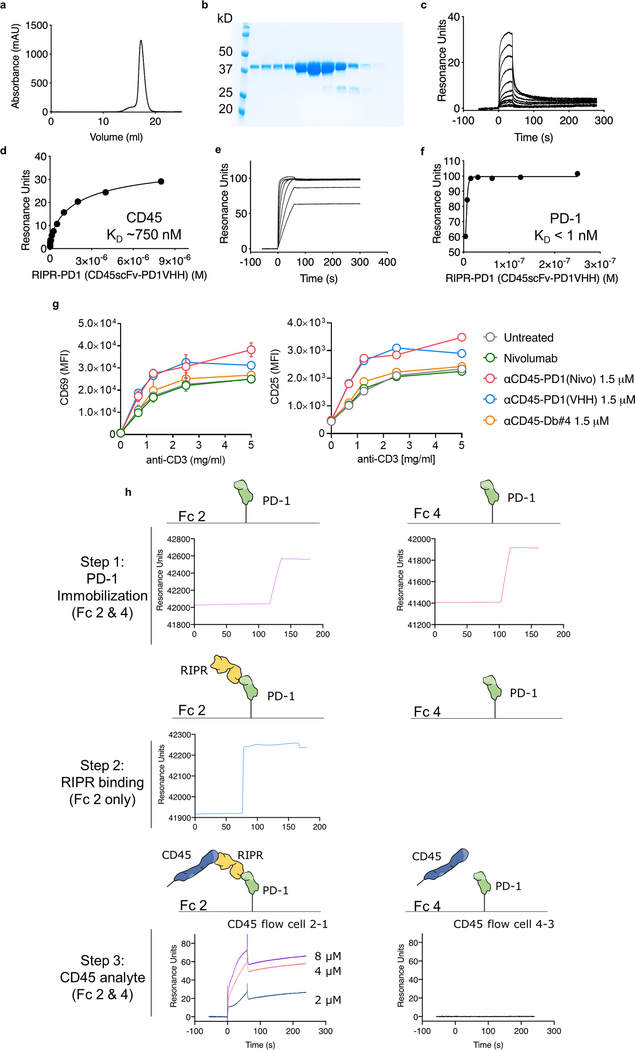
CD45 is a constitutively active cell-surface tyrosine phosphatase that is found in all cells of lymphoid origin16. Notably, CD45 has a large ECD, thus offering the possibility of using anti-CD45 antibodies to effect selective ligation to the PD-1 ECD with a bispecific molecule, in order to promote receptor dephosphorylation through the enforced proximity of the CD45 intracellular domain to the PD-1 ITIM–ITSM motif. We engineered a hetero-bispecific diabody that binds to the CD45 and PD-1 ECDs to compel cis-ligation of PD-1 and CD45 on the T cell surface (RIPR-PD1; Fig. 2a). For the anti-PD1 ‘arm’ we used V-region sequences of the blocking antibodies nivolumab or pembrolizumab (scFv; unless stated otherwise, RIPR-PD1 refers to the diabody with the nivolumab sequence). Using surface plasmon resonance, we confirmed the binding of RIPR-PD1 to CD45 (dissociation constant, Kd ≈ 750 nM) and PD-1 (Kd ≈ 29 nM; Fig. 2c, d, Extended Data Fig. 2a–c). To determine whether this molecule can reduce PD-1 signalling, we reconstituted PD-1 phosphorylation in HEK293 cells. Given that HEK293 cells lack PD-1, LCK and CD45, we transiently transfected each gene sequentially in order to evaluate the contribution of the gene products to PD-1 phosphorylation. In the absence of LCK, PD-1 phosphorylation was not detected (Fig. 2e, lane 1). Upon expression of LCK, PD-1 phosphorylation was readily observed, and the additional expression of CD45 decreased PD-1 phosphorylation, as expected17 (Fig. 2e, lanes 2 and 3, respectively). Next, we incubated HEK293 cells expressing PD-1, LCK and CD45 with RIPR-PD1; this decreased receptor phosphorylation by approximately 50% (Fig. 2e, lane 4). To validate the specificity of the dephosphorylation by CD45, we quantified PD-1 phosphorylation in the presence of a catalytically impaired form of CD45, containing a cysteine-to-serine mutation at residue 853 (CD45(C853S), hereafter denoted CD45dead). PD-1 phosphorylation remained largely intact after the expression of CD45dead in the absence or presence of RIPR-PD1 (Fig. 2e; lanes 5 and 6), suggesting that the effect of RIPR is phosphatase-dependent.
RIPR-PD1 potentiates T cell activation
We sought to determine the effect of RIPR-PD1 on T cell activation. After stimulation with anti-CD3ε, Jurkat T cells treated with RIPR-PD1 showed enhanced expression of CD69 and CD25 as well as an approximately threefold increase in secretion of the cytokine IL-2 (Fig. 2f, g, Extended Data Fig. 2d, e). RIPR-PD1 was also able to potentiate signalling in Jurkat T cells overexpressing PD-1 (Extended Data Fig. 2f–h). Furthermore, RIPR-PD1—but not nivolumab or pembrolizumab—increased secretion of IL-2 upon the stimulation of TCR-transduced SKW-3 T cells with anti-CD3ε or with agonist peptides presented by antigen-presenting cells (Extended Data Fig. 2i, j). In the presence of PD-L1+ surrogate antigen-presenting cells a pronounced reduction in IL-2 secretion was observed, which could be rescued by RIPR-PD1 (Extended Data Fig. 2j).
We asked whether RIPR-PD1 could potentiate the activity of chimeric antigen receptor (CAR) T cells. In a co-culture assay using HER2–4–1BBζ CAR T cells and tumour cells, RIPR-PD1 enhanced the secretion of IFNγ and IL-2 (Fig. 2h, i). The potency of CAR T cells is sensitive to the intracellular signalling motifs used18, so we tested whether RIPR enhanced the activity of less-efficient CARs. After treatment with RIPR-PD1, the secretion of IFNγ and IL-2 was potentiated to different degrees by CAR T cells targeting HER2 or GD2 using a CD28- or a 4–1BB-signalling motif and CD3ζ (Extended Data Fig. 2k, l).
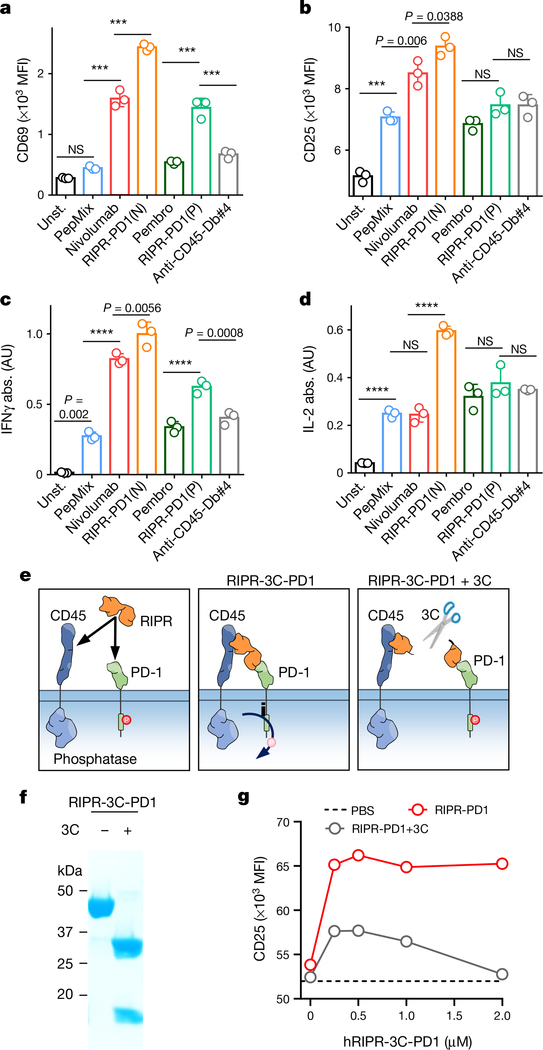
To assess the activity of RIPR-PD1 on antigen-stimulated T cells, we incubated peripheral blood mononuclear cells (PBMCs) with a pool of agonist peptides. Treatment with nivolumab and pembrolizumab enhanced the expression of CD69 and CD25 and the secretion of IFNγ (Fig. 3a–c). Treatment with RIPR-PD1 using the nivolumab scFv—and to a lesser extent the pembrolizumab scFv, denoted RIPR-PD1(P)—further potentiated CD69 and CD25 expression and IFNγ secretion (Fig. 3a–c, Extended Data Fig. 3a, b). RIPR-PD1—but not nivolumab, pembrolizumab or RIPR-PD1(P)—enhanced IL-2 secretion (Fig. 3d), suggesting that IL-2 production may be more sensitive to PD-1-mediated inhibition. RIPR-PD1 also promoted T cell proliferation to significantly higher levels than nivolumab (Extended Data Fig. 3c). Dimerization of CD45 alone using the anti-CD45 scFv diabody (anti-CD45-Db#4) failed to reproduce the effect of RIPR-PD1 (Fig. 3a–d, Extended Data Fig. 3a, b).
Fig. 3 |. Crosslinking of CD45 to PD-1 potentiates T cell activation.
a–d, Peptide-stimulated PBMCs were treated with nivolumab, pembrolizumab, RIPR-PD1(N), RIPR-PD1(P) or an anti-CD45 diabody (anti-CD45-Db#4). Unst., unstimulated; PepMix, stimulated with PepMix only. Quantification of CD69 (a) CD25 (b), IFNγ (c) and IL-2 (d). Data are mean ± s.d. from n = 3 biological replicates representative of 3 independent experiments. e, Schematic depiction of RIPR-3C-PD1 after treatment with 3C. f, SDS–PAGE of intact and 3C-treated RIPR-3C-PD1. g, CD25 expression after activation of PBMCs using anti-CD3 and anti-CD28 and treatment with intact or 3C-treated human RIPR-PD1 (hRIPR-PD1). Data are mean ± s.d. from n = 2 biological replicates representative of 2 independent experiments. ***P < 0.001; ****P < 0.0001.
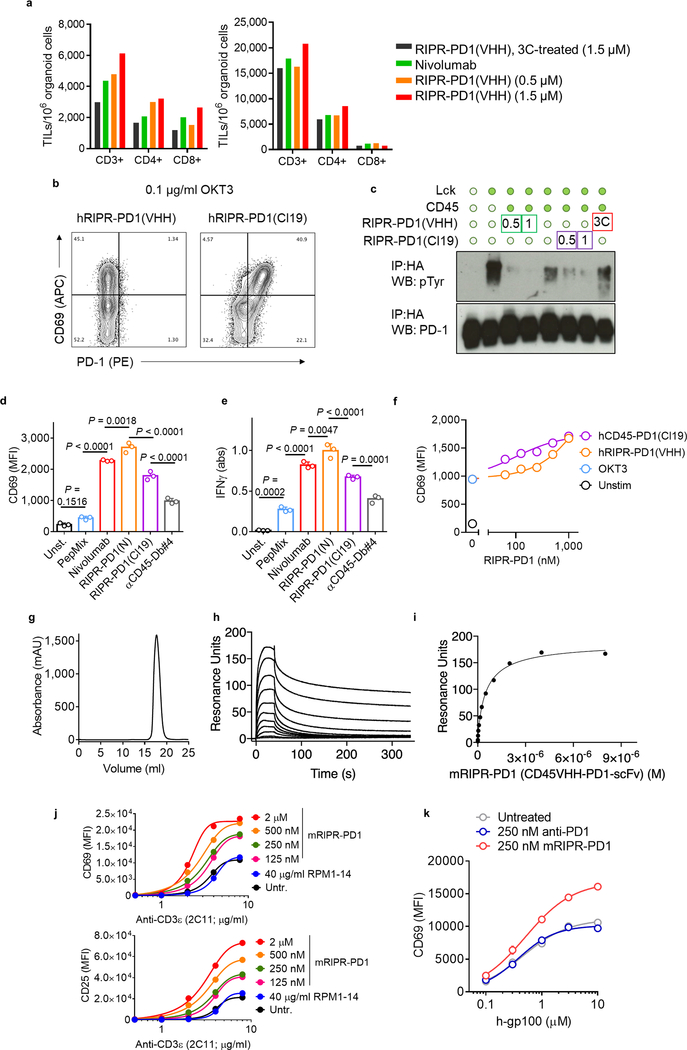
A key assumption underlying the mechanism of RIPR-PD1 is that CD45 and PD-1 are brought into proximity, in cis, by the same, bispecific, molecule. One way to test this is to engineer an anti-PD1/CD45 RIPR molecule with a 3C enzyme cleavage site in the linker that connects the PD1(VHH)- and CD45(scFv)-binding modules, termed RIPR-3C-PD1 (Fig. 3e, Extended Data Fig. 4a–f). Inclusion of the 3C protease during the assays should, in principle, neutralize RIPR activity. We confirmed that RIPR-3C-PD1 potentiated CD69 and CD25 upregulation and that it can simultaneously bind to CD45 and PD-1 (Extended Data Fig. 4g, h). Intact RIPR-3C-PD1, but not 3C-cleaved RIPR-3C-PD1, enhanced T cell activation in response to anti-CD3 antibodies (Fig. 3f, g). Furthermore, RIPR-3C-PD1 potentiated the expansion of tumour-infiltrating lymphocytes (TILs) in tumour organoids19 derived from melanoma and from ovarian tumour samples, whereas 3C-treated RIPR-3C-PD1 failed to enhance T cell proliferation (Extended Data Fig. 5a). We then produced a RIPR molecule that binds to PD-1 using a ‘non-blocking’ scFv, termed RIPR-PD1(Cl19). RIPR-PD1(Cl19) reduced PD-1 phosphorylation in the reconstitution signalling assay in HEK cells and potentiated CD69 upregulation in activated PBMCs, albeit at lower levels than those induced by the blocking RIPR-PD1 molecule using nivolumab (Extended Data Fig. 5b–e). In Jurkat T cells, and therefore in the absence of PD-L1 and PD-L2, RIPR-PD1(Cl19) induced similar levels of CD69 (Extended Data Fig. 5f).
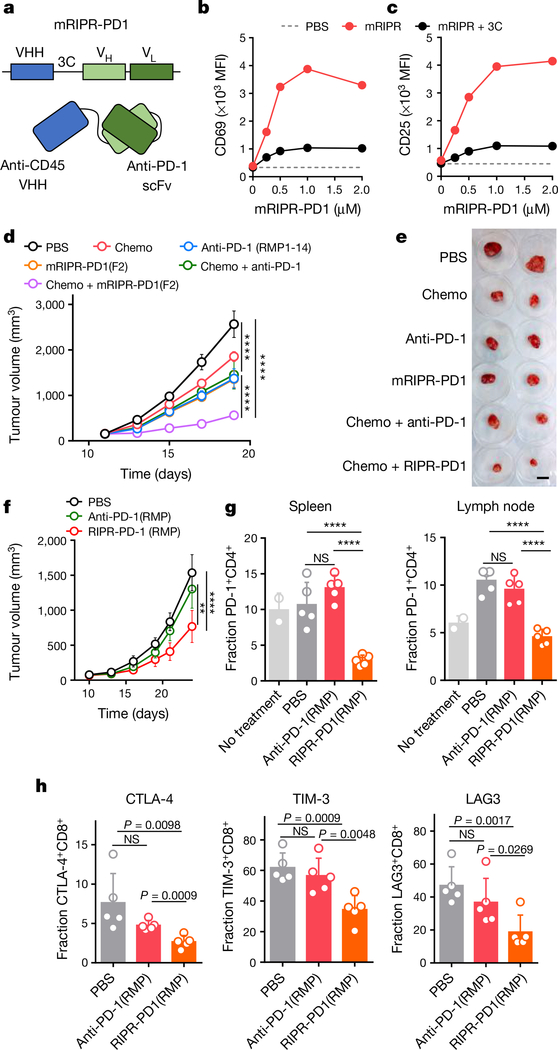
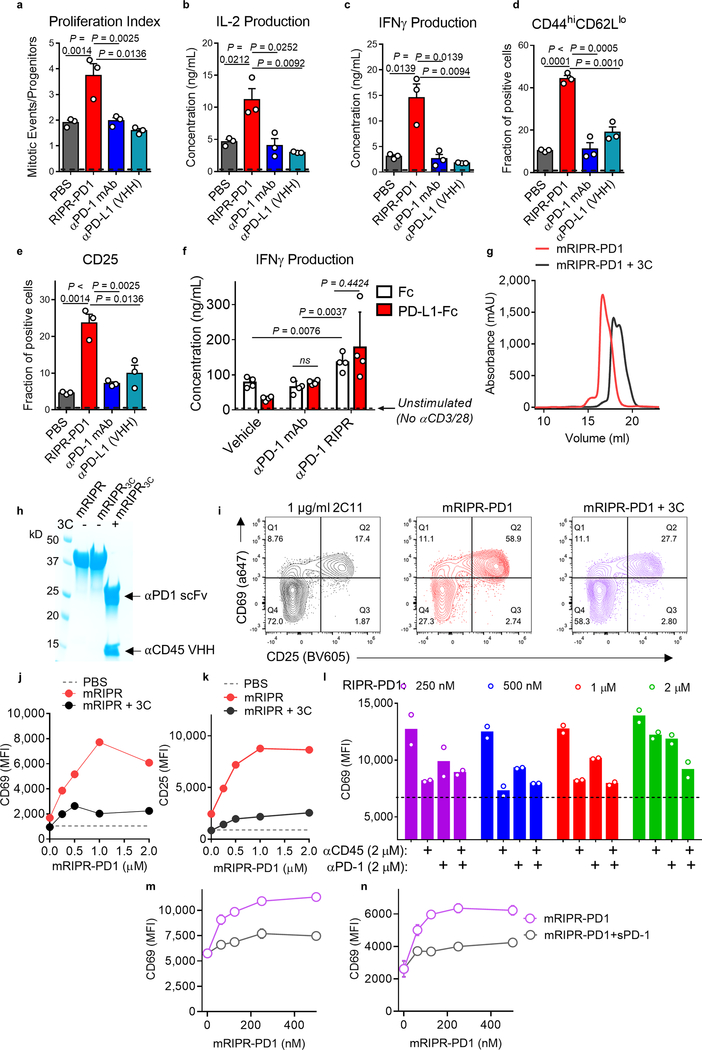
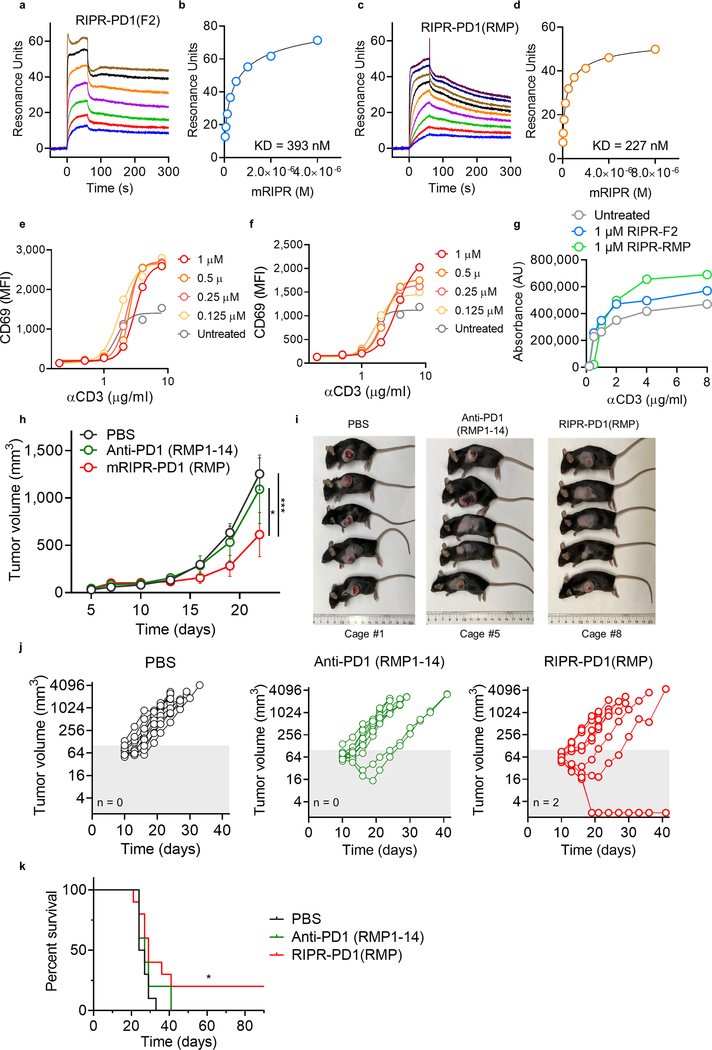
To examine the anti-tumour activity of RIPR-PD1, we engineered a mouse version of RIPR-PD1 that comprises an anti-mouse CD45 nanobody linked to an anti-mouse PD-1 scFv (clone F2) (Fig. 4a, Extended Data Fig. 5g–i). In vitro, mouse RIPR-PD1 (mRIPR-PD1) was found to potentiate CD69 and CD25 expression in response to anti-CD3ε or peptide stimulation (Extended Data Fig. 5j, k), and to enhance CD4+ T cell proliferation, IL-2 secretion and the fraction of CD44highCD62Llow to higher levels than those induced by anti-PD-1 or anti-PD-L1 treatments (Extended Data Fig. 6a–e). Notably, RIPR-PD1 potentiated IFNγ secretion at consistently higher levels than those induced by anti-PD1, in the presence or absence of PD-L1 (Extended Data Fig. 6f). As before, 3C-cleaved mRIPR-PD1 failed to enhance T cell activation (Fig. 4b, c, Extended Data Fig. 6g–k). Moreover, in a competition assay we observed that incubation of mRIPR-PD1 with the identical but monospecific components (anti-CD45 fused to mouse serum albumin (MSA) and anti-PD-1–MSA), in combination or individually, or with soluble PD-1 used as a ‘scavenger’ ligand, also led to a substantial, dose-dependent loss of the RIPR effect (Extended Data Fig. 6l–n).
Fig. 4 |. Mouse RIPR-PD1 reduces tumour progression in mouse models of SCLC and colon cancer.
a, Schematic depiction of mouse RIPR-PD1 (mRIPR-PD1). b, c, CD69 (b) and CD25 (c) expression in activated CD8+ T cells treated with intact or 3C-cleaved mRIPR-3C-PD1. Data are mean ± s.d. from n = 2 biological replicates representative of 3 independent experiments. d, Quantification of KP1 SCLC tumour growth in immunocompetent mice. Data are mean ± s.d., n = 5. e, Representative tumours are shown after collection at day 19. Scale bar, 2 cm. f, Quantification of MC38 tumour growth. Data are mean ± s.e.m., n = 10. g, Quantification of PD-1 expression in CD4+ T cells in spleen (left) and lymph node (right). h, Quantification of CTLA-4 (left), TIM-3 (middle) or LAG-3 (right) in CD8+ cells. In g, h, data are mean ± s.d., n = 5. In d–h, data are representative of 2 independent experiments. **P < 0.01; ***P < 0.001; ****P < 0.0001.
Inhibition of SCLC growth by RIPR-PD1
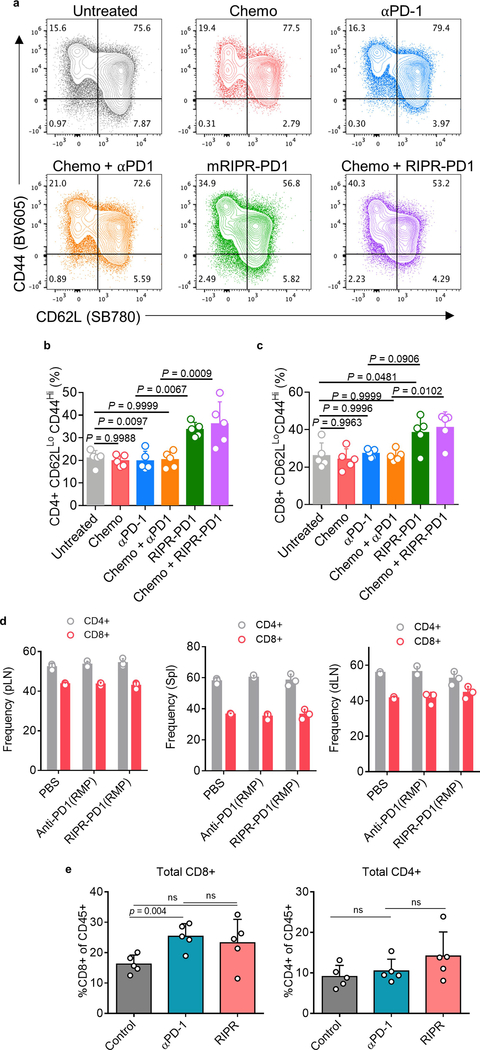
Small-cell lung cancer (SCLC) accounts for up to 15% of lung cancers in humans, with a two-year survival rate for advanced-stage disease that has remained at about 5% for decades20. Immunotherapies that target immune checkpoint molecules in combination with chemotherapy have shown promising but limited success in patients with SCLC21. A mouse model of SCLC that recapitulates the responses of patients to treatment with checkpoint blockade plus chemotherapy was developed on the basis of deletion of the tumour suppressors Rb and p5322, which are frequently inactivated in human SCLC23. We implanted mouse KP1 SCLC cells in wild-type, immunocompetent hosts. At day 11, after tumours were noticeable, treatment was started using one of the following regimens: cisplatin and etoposide (chemo); anti-PD-1 antibody (clone RMP1–14), alone or in combination with chemo; or mRIPR-PD1, alone or in combination with chemo. The strongest reduction in tumour growth was observed with the combination of chemo and mRIPR-PD1: tumour growth was reduced by around fivefold relative to untreated mice and around twofold relative to mice treated with anti-PD-1 antibody, alone or in combination with chemo (Fig. 4d, e). mRIPR-PD1, alone or in combination with chemo, increased the fraction of effector memory T cells in tumour-proximal and tumour-distal lymph nodes (Extended Data Fig. 7a–c). Treatment with mRIPR-PD1 did not change the frequency of occurrence of CD4+ and CD8+ T cells in the spleen or lymph nodes and—similar to treatment with anti-PD1—led to an increase in CD8+, but not CD4+, T cells in brown adipose tissue (Extended Data Fig. 7d, e).
Enhanced checkpoint treatment of MC38 carcinoma
The MC38 is a syngeneic mouse colon adenocarcinoma model that has shown modest response to anti-PD-1 checkpoint inhibition monotherapy24. Here, we matched the anti-PD1 scFv between the anti-PD1 antibody and the RIPR molecule by using the RMP1–14 sequence to generate RIPR-PD1(RMP). The binding affinity of anti-PD-1 for RIPR-PD1(RMP), and the induced in vitro CD69 upregulation and T cell proliferation, was slightly increased compared to that for RIPR-PD1 (Extended Data Fig. 8a–g). Mice inoculated with MC38 tumour cells were treated with PBS, anti-PD-1 antibody (RMP1–14) or RIPR-PD1(RMP) after tumours reached approximately 80 mm3 (n = 10 mice per group). Because RIPR-PD1 is approximately one third of the size of the antibody, its serum half-life and systemic exposure will be reduced in comparison. To compensate for this, mice in the anti-PD-1 treatment group received 200 μg of antibody every 3 days, whereas mice in the RIPR-PD1(RMP) group were treated daily, for a total of two weeks. RIPR-PD1(RMP) was found to reduce tumour growth by approximately 45% relative to anti-PD-1 in two independent experiments (Fig. 5f, Extended Data Fig. 8h–j). In a survival assay, two mice in the RIPR-PD1(RMP) group were found to be completely tumour-free (Extended Data Fig. 8k).
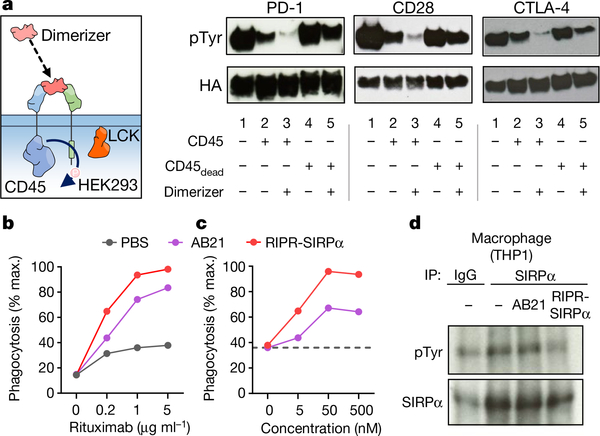
Fig. 5 |. Recruitment of CD45 reduces receptor phosphorylation of diverse immunoreceptor targets.
a, Representation of a chimeric system in which anti-human or anti-hen lysozyme nanobodies were fused to the cytoplasmic domains of CD45 or target receptors of interest (left). Detection of receptor tyrosine phosphorylation after CD45 recruitment to PD-1, CD28 or CTLA-4, by western blot after anti-HA immunoprecipitation. Data are representative of 3 independent biological repeats. For uncropped gels, see Supplementary Fig. 1. b, c, RIPR-SIRPa enhances antibody-dependent cellular phagocytosis. In vitro phagocytosis using primary macrophages co-cultured with Raji B cells, pretreated with anti-CD20 antibody (rituximab) at the indicated concentrations (b), or at 1 μg ml−1 with the indicated concentrations of AB21 or RIPR-SIRPα (c). Data are mean ± s.d. from n = 2 biological replicates. d, Detection of SIRPα phosphorylation in THP-1 macrophages. Cells were incubated with AB21 or RIPR-SIRPα before SIRPα immunoprecipitation. In b–d, data are representative of 2 independent experiments.
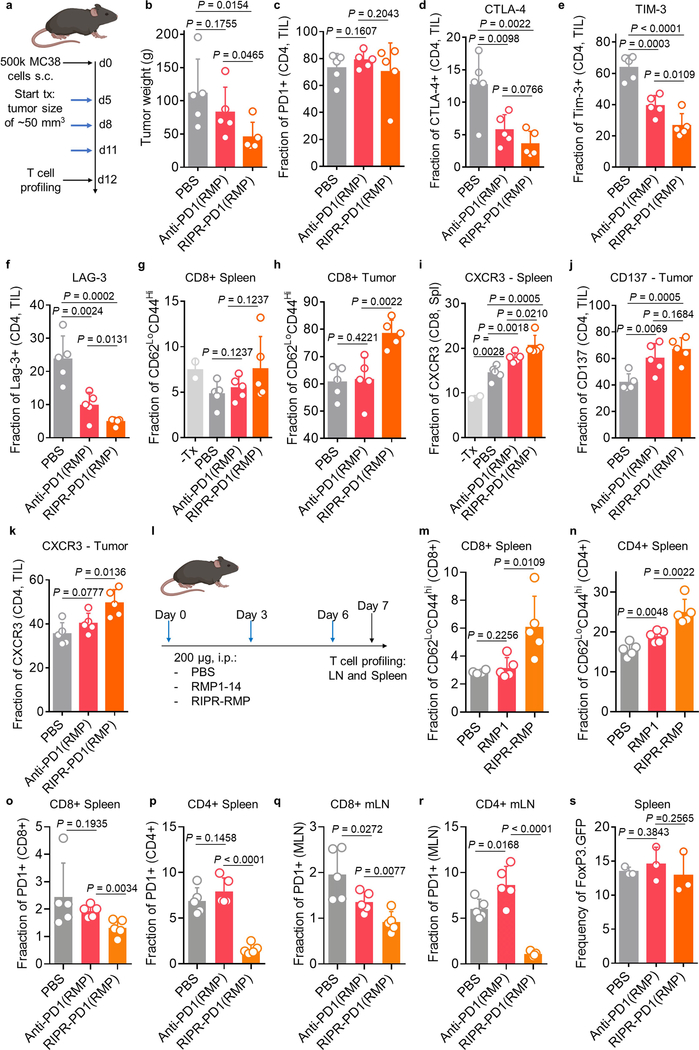
We next sought to characterize differences in the T cell response between the anti-PD-1 and RIPR-PD1(RMP) treatment groups during peak anti-tumour response. MC38 tumours, spleen and lymph nodes were collected on day 12 and T cells were analysed by flow cytometry. Here, anti-PD-1 treatment and RIPR treatment followed the same dosing regimen (3 treatments of 200 μg intraperitoneally for 3 days), which resulted in an approximately 50% reduction in tumour weight in the RIPR-PD1(RMP) group compared to the group receiving antibody treatment (Extended Data Fig. 9a, b). Expression of several exhaustion and activation markers was distinctly affected by treatment with RIPR-PD1. For example, the fraction of PD-1-positive CD4+ T cells in spleen and peripheral lymph nodes, but not in TILs, was significantly reduced compared to anti-PD-1 treatment, and the fraction of CTLA-4+, TIM-3+ and LAG3+ cells was also reduced in both CD4+ and CD8+ TILs (Fig. 4g, h, Extended Data Fig. 9c–f). Furthermore, RIPR-PD1 enhanced the fraction of effector memory CD8+ cells, the fraction of CXCR3+ cells in CD8+ and CD4+ cells and CD137+ in CD4+ cells (Extended Data Fig. 9g–k). The increase in effector memory T cells and the decrease in the fraction of PD-1+ cells was also observed in tumour-free mice, suggesting that some of the phenotypic differences observed are intrinsic to the RIPR effect (Extended Data Fig. 9l–r). Finally, neither RIPR-PD1 nor anti-PD1 affected the fraction of Treg cells (Extended Data Fig. 9s). Taken together, these results suggest that RIPR-PD1 elicits a response characterized by a decrease in the fraction of T cells expressing classic exhaustion markers, while potentiating the fraction of effector memory cells, CXCR3+ and CD137+ cells.
RIPR is applicable to diverse immune receptors
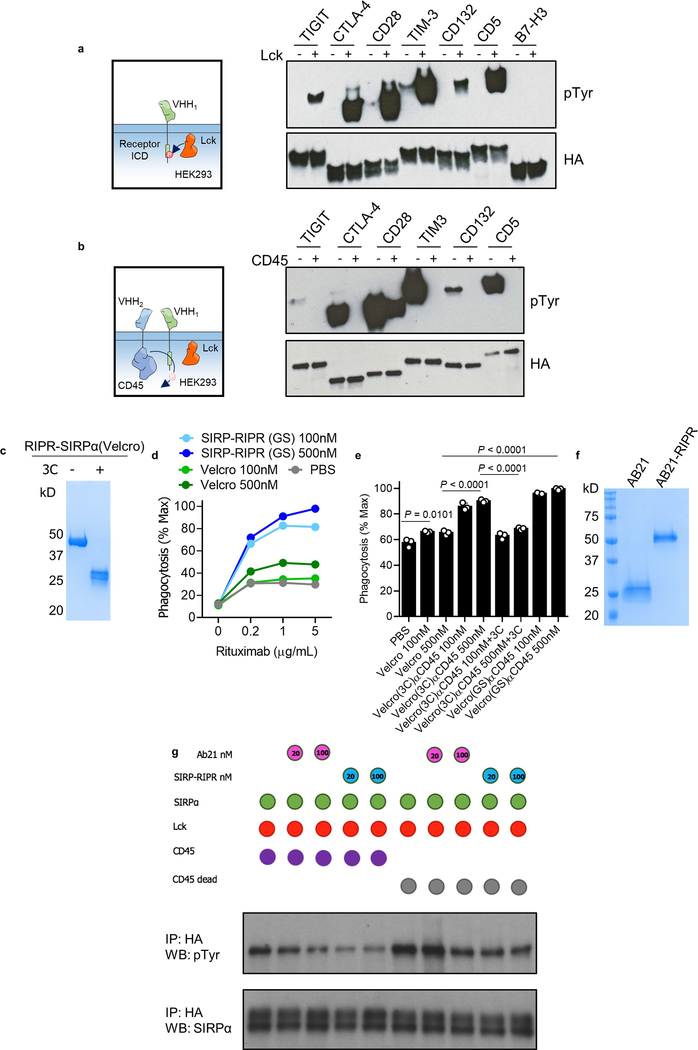
Given the substrate promiscuity of CD45 and its widespread expression in haematopoietic cells, as well as the plethora of ITAM-ITIM-ITSM-containing immunoreceptors, we postulated that the RIPR approach could be readily applicable to other receptors of interest. To rapidly investigate the effects of CD45 recruitment, we developed a chimeric system in which anti-human or anti-hen lysozyme nanobodies were used as ECDs fused to the cytoplasmic domains of CD45 or target receptors of interest and expressed in HEK293 cells transfected with LCK. Transiently transfected LCK phosphorylated TIGIT, CTLA-4, CD28, TIM-3, CD132 and CD5—but not B7-H3, which lacks an intracellular tyrosine (Extended Data Fig. 10a). Addition of CD45 led to a substantial reduction in tyrosine phosphorylation for nearly all proteins studied (Extended Data Fig. 10b). To explore the potential of RIPR to reduce the phosphorylation of CTLA-4 and CD28, in addition to PD-1, we designed a soluble ‘dimerizer’ composed of a human–hen lysozyme chimaera. Incubation with the synthetic dimerizer resulted in decreased phosphorylation for the three receptors (Fig. 5a).
SIPRα, an ITIM-containing inhibitory receptor present in macrophages, delivers a ‘don’t eat me’ signal after engaging CD47 on target cells, and blocking the interaction between SIPRα and CD47 has been shown to potentiate antibody-mediated phagocytosis and enhance anti-tumour effects25. To develop a SIRPα RIPR, we generated two different molecules: an anti-CD45 scFv fused to a modified high-affinity CD47 ectodomain (termed ‘Velcro’26), and an anti-SIRPα blocking scFv (clone AB2127). In an in vitro co-culture assay with human macrophages, Raji B cells and rituximab, the RIPR-SIRPα molecules enhanced phagocytosis compared to simple CD47/SIRPα blockade as seen by treatment with ‘Velcro’ or with AB21 Fab, and treatment with 3C eliminated the RIPR effect (Fig. 5b, c, Extended Data Fig. 10c–f). RIPR-SIRPα, but not AB21 scFv, reduced SIRPα phosphorylation in a signalling reconstitution assay and in macrophages (Fig. 5d, Extended Data Fig. 10g). Thus, RIPR-SIRPα potentiates antibody-dependent cellular phagocytosis, demonstrating that the RIPR strategy is also applicable to inhibitory immunoreceptors, and could serve as a strategy to enhance targeting of the CD47–SIRPα axis.
Growing evidence suggests that diverse immunoreceptors are under the continuous and opposing action of kinases and phosphatases28. Tonic signals seem to be important for immune homeostasis, but tonic signalling remains even after treatment with antagonist antibodies, mitigating the effects of therapeutic ligand blockade. Given the existence of many different cell-surface phosphatases that are expressed on different cell types, the RIPR approach potentially affords the possibility of cell-specific receptor inhibition for a wide range of kinase-linked receptors.
Methods
Cell lines
Cell lines were kept in a humidified incubator at 37 °C with 5% CO2 unless otherwise denoted. SKW-3 (derived from a male with T cell leukaemia), Jurkat T cells (derived from a male with acute T cell leukaemia), Raji B lymphocytes (derived from a male with Burkitt’s lymphoma), THP-1 monocyte cell line (derived from a male with acute monocytic leukaemia), K562 cells and primary human T cells were cultured in RPMI supplemented with 2 mM GlutaMAX (Invitrogen), 10% FBS (Sigma),10 mM HEPES pH 8.0 (Thermo Fisher), 1 mM sodium pyruvate (Gibco) and 50 U ml−1 penicillin and streptomycin (Thermo Fisher). SKW-3 cells were purchased from DSMZ. Jurkat T cells, Raji, THP-1 and K562 cells were purchased from ATCC. Validation of T cell lines was performed by staining with known markers pre- and post-transfection or transduction. HEK293T (LentiX) cells (female-derived kidney cell line) were grown in DMEM complete media (Thermo Fisher) supplemented with 10% FBS, 2 mM L-glutamine, and 50 U ml−1 of penicillin and streptomycin. MC38 cells were purchased from Kerafast, and cultured in DMEM complete media containing 10% FBS, 2 mM L-glutamine, 0.1 mM NEAA, 1 mM sodium pyruvate, 10 mM HEPES, 50 U ml−1 penicillin/streptomycin and 50 μg ml−1 gentamycin sulfate. Cell lines tested negative for mycoplasma (MycoAlert Mycoplasma Detection kit, Lonza).
Mice
All mice were housed at Stanford University according to the protocol and guidelines approved by the Administrative Panel on Lab Animal Care (APLAC). C57BL/6J mice were purchased from the Jackson Laboratory (000664). B6.Cg-Foxp3tm2Tch/J (B6.FoxP3GFP, 006772), and B6.Cg-Thy1a/Cy Tg(TcraTcrb)8Rest/J (pmel-1 TCR tg mice, 005023) were purchased from the Jackson Laboratory and bred in-house. Stanford University vivaria are AAALAC-accredited. Husbandry is performed in accordance with the Guide for the Care and Use of Laboratory Animals and the Public Health Service Policy on Humane Care and Use of Laboratory Animals. Room conditions were as follows: temperature 23 °C ± 2 °C, relative humidity 30%–40%, 12-h:12-h light:dark cycle. Sample sizes were chosen on the basis of previous experience with similar experiments: a minimum of 5 mice for NSCL tumour studies, 10 mice for MC38 tumour growth studies and 5 mice for T cell profiling. For all the in vivo experiments described the mice were randomly distributed and assigned to treatment groups before the start of the treatment. Experiments reported in this study were not blinded.
Protein expression
Wild-type protein sequences were obtained from Uniprot (https://www.uniprot.org/). Insect Tni cells (Expression Systems, 94–002S) were grown in Insect X-press media (Lonza) or ESF 921 media (Expression Systems) with a final concentration of 10 mg l−1 of gentamicin sulfate (Thermo Fisher) at 27 °C and atmospheric CO2. SF9 cells (Thermo Fisher Scientific) were grown in SF900-III or SF900-II serum-free media (Thermo Fisher) with 10% FBS and a final concentration of 10 mg l−1 of gentamicin sulfate and 2 mM GlutaMAX at 27 °C and atmospheric CO2. P1 or P2 virus was used to infect volumes of 1–3 l of Hi5 cells at around 2 × 10⁶ cells per ml. New P1 or P2 preps were made from fresh P0 batches routinely. The supernatant containing expressed protein was treated with 100 mM Tris pH 8.0, 2 mM NiCl2 and 10 mM CaCl2 to precipitate contaminants. The supernatant and precipitate mixture was spun down at 8,000 rpm for 20 min at 4 °C to remove precipitate. The supernatant was incubated with Ni-NTA resin (QIAGEN) for more than 3 h at room temperature. Ni-NTA beads were collected and washed in a Buchner funnel with 20 mM imidazole in 1× HBS pH 7.2 and eluted with 200 mM imidazole in 1× HBS pH 7.2. Protein was concentrated in a 10 kDa filter (Millipore, UFC903024) to around 1 ml or until 10 mg ml−1. When appropriate, proteins were biotinylated with BirA ligase, 100 μM biotin, 40 mM bicine pH 8.3, 10 mM ATP, and 10 mM magnesium acetate at 4 °C overnight. All proteins were further purified by size-exclusion chromatography (SEC) using Superdex Increase S200 or S75, as appropriate (GE Healthcare). All proteins for in vivo studies were cleared of endotoxin. Final endotoxin levels were determined using a chromogenic endotoxin quantitation kit (Thermo Fisher) and were never greater than 1 endotoxin unit per mg of purified protein. RIPR proteins were kept at 4 °C for up to two weeks to prevent freeze–thawing cycles.
RIPR-PD1 design and expression
The first generation of human RIPR-PD1 is composed of an anti-CD45 scFv sequence (clone #4, described in ref. 29) fused to the scFv sequence corresponding to nivolumab (nivo; DrugBank accession number DB09035/DB06132) or pembrolizumab (pembro; DrugBank accession number DB09037) anti-human PD-1 scFv. The bispecific diabody construct follows the following arrangement: Heavy1-(G4S)-Light2-(G4S)3-Heavy2-(G4S)-Light1 and 1 and 2 corresponding to anti-CD45 and anti-PD1 scFv. Non-blocking anti-PD1 scFv sequence, Clone 19, is described in ref. 30. Second-generation human RIPR-PD1 is composed of the same anti-CD45 scFv (clone #4) fused to an anti-human PD-1 nanobody (VHH, described in ref. 31). Connecting the scFv to the VHH, a GGSLEVLFQGPGSGS linker sequence encoding a 3C cleavage site was used. The mouse RIPR-PD1 is composed of a nanobody anti-CD4532 fused to an anti-mouse PD-1 scFv, using the clone PD1-F2 (described in ref. 33) or clone RMP1–1434 using a GGGGTGGS or a GGSLEVLFQGPGSGS (3C) linker. All proteins were cloned in-frame in the pAc67-A (Pharmingen) plasmid for protein expression in Tni cells (BTI-Tn-5B1–4, Expression Systems 94–002S) using the baculovirus expression system. scFv and VHH sequences were cloned using gBlocks (IDT) and final sequence integrity was confirmed by DNA sequencing.
Surface plasmon resonance
A GE Biacore T100 was used to measure the KD by equilibrium methods. Approximately 200 resonance units (RU) of human CD45, PD-1 or mouse PD-1 was captured on an SA-chip (GE Healthcare), including a reference channel with an unrelated protein. SPR runs were performed in HBS-P+ (GE Healthcare). All measurements were made with twofold serial dilutions using 45–60 s association (at 30 μl min−1) followed by a dissociation time of more than 240 s (30 μl min−1) at 25 °C. Regeneration was performed using 2 M MgCl2 or 0.1 M glycine, pH 3.1 for 15–20 s at 50 μl min−1. Measurement of titrations at equilibrium were used to determine the KD using Biacore Analysis Software (v.2.0.4, GE Healthcare). All measurements were repeated twice.
Jurkat, SKW-3 and K562 cell transduction
Jurkat T cell lines stably overexpressing PD-1, or CRISPR–Cas9 plus gRNA were generated using a lentiviral transduction strategy. HEK293T cells were plated in 6-well plates at 6 × 10⁵ cells per well in DMEM (Thermo), 10% FCS (Sigma), 2 mM GlutaMAX and antibiotics. Cells were incubated at 37 °C and 5% CO2 for 24 h, after which 0.75 μg per well per plasmid of the lentiviral packaging vectors p8.91 and pMD.G (second generation; Addgene) and the relevant lentiviral expression vector was used for transfection (pHR-SIN plasmid backbone is available from Addgene, plasmid 79121; lentiCRISPR v2 is available from Addgene, plasmid 52961). The gRNA sequence used was 5′-CACCGCGACTGGCCAGGGCGCCTGT-3′. As a negative control for CRISPR transfections, cells were transfected with a scrambled gRNA or the lentiCRISPR v2 plasmid without the gRNA targeting PD-1. Transfections were made using Fugene HD (Promega) in Optimem (Thermo) as per the manufacturer’s instructions. Then, 48 h after transfection, the supernatant was collected, and dead cells and debris were removed by centrifugation at 4,000 rpm for 5 min. Approximately 3 ml of the lentiviral-conditioned medium was added to around 1.5 × 10⁶ Jurkat T cells. MHC-II was cloned into pHR plasmid and used to transduce K562 cells. MHC-II+ cells were later transduced with PD-L1 plasmid. SKW-3 cells were transduced with appropriate TCRα and β plasmids. To generate the ECD-less PD-1, the extracellular region of PD-1 (as annotated in Uniprot, accession number: Q15116) was substituted for the HA-tag DNA sequence, in frame with the endogenous PD-1 signal peptide sequence and the transmembrane region. Jurkat T cells were lentivirally transduced, as described above, with ECD-less PD-1 or with an irrelevant HA-tagged gene. All plasmids were sequenced to confirm gene integrity. Cell surface expression was determined by fluorescence-activated cell sorting (FACS) using appropriate fluorescently labelled antibodies and isotype controls.
Jurkat and SKW-3 stimulation
Jurkat or SKW-3 T cells were rested overnight or for 2–3 h in fresh RPMI Complete. Cells were co-cultured for 16–48 h with surrogate APCs (K562 cells MHC-II+, ±PD-L1) or with plate-bound OKT3 at the indicated concentrations (BioLegend; OKT3 was diluted in PBS and left for more than 1 h at 37 °C before removal and washing with PBS). Anti-CD28 (BioLegend) was used at 1 or 2 μg ml−1. Cells were treated with control antibodies (nivolumab, Absolute Antibody, 5C4.B8; pembrolizumab, Biovision), RIPR or other appropriate molecules as described in the text at the same time as incubation with OKT3 and anti-CD28.
PBMC stimulation
PBMCs were obtained from the Stanford Blood Bank. Cells in deidentified leukoreduction chambers from healthy platelet donors were processed as soon as possible and no later than 18 h after plateletpheresis. PBMCs were stimulated with plate-bound OKT3 and CD28 (as described in the above section ‘Jurkat and SKW-3 stimulation’) or with 20 μM of CEFX Ultra SuperStim Pool, from the PepMix Peptide Pool series (JPT Peptide Technologies). Later, cells were treated with a second dose of 20 μM of CEFX Ultra SuperStim Pool 24 h after the first incubation. At this time point, cells were incubated with antibodies or RIPR, or CD45 diabodies or appropriate controls. Cells and supernatant were collected 24, 48 and 72 h after incubation with antibodies, RIPR or appropriate molecules. Cells were incubated with 1 μM of RIPR molecules and 1 μM nivolumab or pembrolizumab (Extended Data Fig. 3a–c) or 10 μg ml−1 of nivolumab or pembrolizumab (Fig. 3a–d).
FACS staining
Cells were stained with the indicated antibodies for 30 min on ice in MACS staining buffer (Miltenyi). For the analysis of cells isolated from tissues, after tissue dissection cells were passed through a 70 μm strainer (Corning) twice and were incubated for 10 min on ice with mouse or human Fc-blocking reagent (TruStain, BioLegend). After incubation with fluorescent antibodies, cells were washed and analysed via flow cytometry on an Accuri (BD Biosciences) or Cytoflex (Beckman Coulter) instrument. For the surface detection of MHC class II, TCR, CD3, CD4, CD8, CD62L, CD44, CD25, CD69, PD-1, PD-L1, PD-L2, CTLA-4, TIM-3, LAG3, CXCR3 (CD183) and CD137 (4–1BB), cells were incubated with appropriate antibodies at 1:200 dilution in MACS buffer. Surface expression was quantified by FACS using the CytoFLEX equipped with a high-throughput sampler. Live cells were identified after gating on the basis of forward scatter (FSC) and side scatter (SSC) and propidium iodide (PI)-negative staining. Data were analysed using FlowJo 10.2 (Tree Star). All assays were performed using independent biological replicates. The number of replicates (n) is indicated in the figure legends. Mean fluorescence intensity (MFI) was determined in FlowJo 10.2. Gating strategies used to analyse primary cells from mouse and human origin and Jurkat cells are shown in Supplementary Fig. 2.
Stimulation of mouse T cells
CD8+ T cells or Pan T cells were purified from splenocytes via magnetic isolation using negative selection (130–104-075; Miltenyi) from C57BL/6J mice or pmel-1 mice. Cells were collected by centrifugation, re-suspended in mouse T cell media lacking IL-2 and seeded at a density of 100,000 to 50,000 T cells per well (in 100 μl) in a 96-well round bottom tissue culture plate. T cells were stimulated with plate bound 2C11 at the indicated concentrations plus 1 or 2 μg ml−1 of anti-mouse CD28 and 1 or 2 μM of anti-PD1 antibody (RMP1–14, BioXcell), RIPR-PD1 or indicated control molecules in a total volume of 200 μl and cultured for 1 or 2 days at 37 °C. Surface expression of CD3, CD4, CD8, CD62L, CD44, CD25, CD69, PD-1, PD-L1 and CTLA-4 were quantified by FACS using the CytoFLEX equipped with a high-throughput sampler. Live cells were identified after gating on the basis of FSC and SSC and PI-negative staining. Data were analysed using FlowJo 10.2 (Tree Star). Mouse PD-L1 was from R&D Systems and anti-mouse PD-L1 nanobody (VHH) was purified in-house.
ELISA
Human and mouse IL-2 and IFNγ ELISA were performed as per the manufacturer’s instructions using the following reagents from BioLegend: 431004 (mouse IL-2), 430804 (mouse IFNγ), 431805 (human IL-2) and 430104 (human IFNγ).
ITAM, ITIM and ITSM signalling reconstitution in HEK293 cells
HEK 293 cells were transiently transfected with described genes cloned in pHR-SFFV or LeGo-G2 (Addgene plasmid 25917). Plasmids were transfected using Fugene HD. The amount of DNA transfected was determined empirically and ranged from 100–500 ng per well of a 6-well plate for CD45 and 500–750 ng per well for LCK and target genes (TIGIT, CTLA4, CD28, TIM-3 (also known as HAVCR2), CD132 (also known as IL2RG), CD5, B7H3 (also known as CD276) and PD-1). The transmembrane and intracellular domains were identified in UniProt. DNA gBlocks (IDT) were ordered for sequences corresponding to full-length proteins (PD-1, CD45, LCK) or chimaeras corresponding to the fusion of anti-human or anti-hen nanobodies sequences35,36 with Myc or HA tag followed by the transmembrane and intracellular region of the target proteins. The mutant CD45(C853S) was generated by PCR reaction. Then, 24- or 48-h after transfection, cells were collected and washed once in PBS. For RIPR or human–hen lysozyme treatment, cells were resuspended in 200 μl of PBS and incubated with 100 nM–1 μM for 15 min at 37 °C. Cells were lysed in 40 mM HEPES, 150 mM NaCl, 2× phosphatase inhibitor cocktail (Abcam and Promega), protease inhibitor cocktail tablet (Roche), orthovanadate (NEB), 2 mM EDTA and 1% (w/v) of n-dodecyl β-D-maltoside (Anatrace) for 30 min on ice with vigorous vortexing for 30 s every 10 min The insoluble material was collected by centrifugation at 21,000g for 30 min at 4 °C and discarded. Solubilized cell lysates were used immediately for SDS–PAGE followed by protein or tyrosine phosphorylation detection by western blot, or incubated with appropriate antibodies for immunoprecipitation (IP). Anti-HA magnetic beads (Pierce Thermo Fisher Scientific, 88836) and anti-Myc magnetic beads (Pierce Thermo Fisher Scientific, 88842) were used for IP. For PD-1 IP, biotinylated anti-PD1 antibody (BioLegend, 367418 or J105 clone, eBioscience 13–2799-82) was used in combination with streptavidin magnetic beads. Beads were washed four times with Pierce IP Lysis Buffer (Pierce, 87787) using a magnetic stand, after which they were pelleted by centrifugation and incubated with an appropriate volume of SDS loading buffer (non-reducing) at 95 °C for 3 min. After SDS–PAGE, proteins were transferred to a PVDF mini membranes (BioRad, 1704272) using a Trans-Blot Turbo RTA system for 7 min at room temperature. Phosphoylated tyrosine (pTyr) was detected using P-Tyr-1000 Multimab or P-Tyr-100 (Cell Signaling), HA was detected with anti-HA monoclonal antibody clone 3F10 (Sigma) and PD-1 was detected with anti-PD1 J105 clone or NAT105 clone (BioLegend, 367418). LI-COR blocking buffer was used for membrane blocking and antibody dilutions. Membranes were washed in TBS-Tween (0.01 to 0.1% w/v) and incubated for 3 min at room-temperature with ECL western blotting detection reagent (GE RPN2232) before exposure to Hyperfilm ECL (GE 28–9068-39). Multiple exposures were obtained. Data shown corresponds to non-overexposed films.
CAR T cell activation
CAR T cells were generated by retroviral transduction of primary T cells from healthy donors (Stanford Blood Bank) after activation with CD3/CD28 Dynabeads, as previously described18. Several different CAR constructs were tested, including HER2 CARs containing the 4D5 scFv and either a CD28 or a 4–1BB costimulatory domain (HER2-CD28ζ and HER2–4-1BBζ) and a high-affinity GD2 CAR containing the 14g2a scFv harbouring an E101K mutation and containing the CD28 costimulatory domain (HA-GD2-CD28ζ)37,38. On day 10 after activation, 100,000 CAR+ T cells were co-cultured with MG63.3 tumour cells for 24 h in the presence of the indicated molecules at 1 μM (Fig. 2h, i) or at increasing concentration of RIPR-PD1 (Extended Data Fig. 2k, l) and IFNγ and IL-2 were measured in the supernatant by ELISA.
SCLC tumour growth and treatments
The mice were inoculated subcutaneously in the flanks with mouse KP1 cells (5 × 10⁵), in medium containing 50% growth factor reduced, phenol red-free Matrigel (Corning). Tumours were measured by caliper 3 times weekly for the duration of the experiment. When tumours reached around 150 mm3 (day 11 in the first repeat and day 9 in the second repeat) the mice were divided into different groups, including control (no treatment) and treatment groups that received either cisplatin and etoposide (chemo), or anti-PD1 antibody, or chemo plus anti-PD1 antibody, or mRIPR-PD1, or chemo plus mRIPR-PD1 (n = 5 to 6 mice per group). Treatments were started on day 11 using cisplatin (5 mg kg−1, i.p.), etoposide (4 mg kg−1, i.p.) 3 days per week, anti-PD1 antibody (200 μg per mouse) 2 days per week or mRIPR-PD1 (200 μg per mouse) daily. Treatments were given as described for 3 weeks, or until the tumours reached approximately 2,000 mm3, at which time mice were euthanized. Tumour volumes (v; mm3) were calculated using the volume for a prolate spheroid: v = 4/3πa2b, where a is minor radius and b is major radius. Proximal and distal (opposing side) lymph nodes were collected for isolation of T cells (Pan T cell isolation kit II, Miltenyi) for surface staining with appropriate surface markers. Tumour cells were prepared for FACS analysis by incubation with collagenase and dispase for 30–45 min with shaking at 200 rpm at 37 °C followed by incubation with DNase for 5 min on ice. After filter through a 40 μm filter cells were pelleted and incubated with RBC lysis buffer for 90 s. After washing in DMEM twice, cells were washed once in MACS staining buffer and incubated with the appropriate antibody panel for cell surface marker staining as described above.
MC38 tumour growth and treatments
The mice were inoculated subcutaneously in the flanks with mouse MC38 cells (5 × 10⁵), in medium containing 50% growth factor reduced, phenol red-free Matrigel (Corning). Tumours were measured by caliper 3 times weekly for the duration of the experiment. When tumours reached around 40 mm3 the mice were divided into three different groups, with n = 10 mice per group. When tumours reached around 80 mm3 (on around day 7 to day 9), mice received 200 μl of PBS or 200 μg of anti-PD1 (clone RMP1–14, BioXCell, BE0146) every three days or 200 μg of RIPR-PD1(RMP) daily. Treatments were given as described for 2 weeks, after which tumour measurements and mouse weights were determined every 3 days. For the survival experiment (second repeat), mice were monitored every 3 days and per established APLAC guidelines, animals were euthanized when tumours volumes reached around 2,400 mm3 or showed profound ulceration, or when animals displayed limited locomotion or were moribund. Tumour volumes (v; mm3) were calculated using the formula: v = a2b/2, where a is minor radius and b is major radius. Proximal and distal (opposing side) lymph nodes, spleen and tumours were collected for isolation of T cells, for surface staining with appropriate surface markers. Tumour cells were prepared for FACS analysis by incubation with collagenase and dispase for 30–45 min with shaking at 200 rpm at 37 °C followed by incubation with DNase for 5 min on ice. After filtering twice through a 40 μm filter, cells were pelleted and incubated with RBC lysis buffer for 90 s at room temperature. After washing in RPMI with 10% FBS twice, cells were washed once in MACS staining buffer and incubated with an appropriate antibody panel for cell surface marker staining as described in ‘SCLC tumour growth and treatments’ for data collection in a Cytoflex (Beckman Coulter). For the T cell profiling at day 12, mice were inoculated with MC38 tumour cells and treated with PBS, RIPR-PD1(RMP) and anti-PD1 (clone RMP1–14, BioXCell), as before, except that dosing of treatment molecules was performed every 3 days and there were n = 5 mice per group. Lymph nodes, spleen and tumours were removed and treated as described for the NSCL experiments. Cells were analysed by flow cytometry in a CytoFLEX Flow Cytometer.
Human specimen collection and IRB approval
Tumour specimens were collected through the Stanford Tissue Bank from patients undergoing surgical resection at Stanford University Medical Center (SUMC). Studies involving human tissues were approved by the SUMC Institutional Review Board under protocols 28908, 12597 and 18325. Written informed consent for research was obtained from donors before tissue collection.
Culture of patient-derived organoids
To assemble the 3D air–liquid interface (ALI) culture system, an inner dish (PICM03050, Millicell-CM, Millipore) with a membrane bottom (0.4-μm pore size, 30 mm) was placed into an outer tissue culture dish (60 × 15 mm), as previously described19. Collagen gel matrix components were reconstituted on ice by first mixing collagen matrix (Cellmatrix type I-A; solution A) and 10× concentrated sterile culture medium (Ham’s F-12; solution B), then adding the sterile reconstitution buffer (0.05 M NaOH, 200 mM HEPES, and 2.2 g NaHCO3 in 100 ml sterile milli-Q water; solution C) at a ratio of 8:1:1 for solution A, B and C. The reconstituted collagen gel mixture was ready for use when the colour turned pink, or to store on ice to maintain the liquid phase before use. To make a non-cellular bottom layer of collagen gel matrix, 1 ml of reconstituted collagen gel solution was gently added into the inner dish, avoiding the formation of bubbles. The bottom layer was left in a 37 °C incubator to solidify for 30 min. Meanwhile, tumour tissues were finely minced on ice, washed twice in ADMEM/F12 containing 1× normocin (InvivoGen), resuspended in 1 ml of reconstituted collagen gel with gentle pipetting to avoid bubbles, and layered on top of the pre-solidified 1 ml collagen gel within the inner dish to form the ALI culture system as described above. After 30 min solidification in 37 °C incubator, 1.5 ml complete culture medium was added into the outer 60 mm cell culture dish containing ADMEM/F12 supplemented with 50% Wnt3a, RSPO1, Noggin-conditioned media (L-WRN, ATCC) with HEPES (1 mM, Invitrogen), GlutaMAX (1×, Invitrogen), nicotinamide (10 mM, Sigma), N-acetylcysteine (1 mM, Sigma), B-27 without vitamin A (1×, Invitrogen), A83–01 (0.5 mM, Tocris), pen-strep glutamine (1×, Invitrogen), gastrin (10 nM, Sigma), and EGF (50 ng ml−1, Invitrogen). The medium was changed every three days.
Human RIPR-PD1 assay for TILs activation within patient-derived organoids
Organoids were maintained in the abovementioned culture medium, supplemented with RIPR-PD1 3C-treated (1.5 μM), hivolumab (1.5 μM), and hRIPR-PD1 (0.5 μM and 1.5 μM) for treatment starting at day 0. After 7 days, the collagen gel layer was dissociated in 200 units per ml collagenase IV (Worthington) in ADMEM/F12 at 37 °C for 45 min, washed twice in ADMEM/F12, and digested in Liberase-TL (Roche; 50 mg ml−1 final concentration) at 37 °C for 15 min. Digested samples were washed twice in ADMEM/F12, passed through a P1000 pipet tip, and filtered by a 70-μm cell strainer for further dissociation. Single cells were then pelleted, resuspended in 100 μl FACS buffer containing 2% FBS in PBS, and stained for live/dead dye and FACS antibodies. TILs proliferation and activation was analysed by a BD Aria II flow cytometer.
RIPR-SIRPα design and expression
Two RIPR-SIRPα molecules were developed. First-generation RIPR-SIRPα is composed of an anti-CD45 scFv (clone #4, as described before) fused to ‘Velcro’, a high-affinity CD47 molecule. The second-generation RIPR-SIRPα is composed from the same anti-CD45 scFv fused to an anti-SIRPα scFv, clone AB21 (described in ref. 39). 3C cleavage site was inserted in the linker region connecting the anti-CD45 and anti-SIRPα arms, as described before for human and mouse RIPR-PD1 molecules. RIPR-SIRPα proteins were produced in Tni cells as described above for RIPR-PD1 in the section ‘RIPR-PD1 design and expression’. Velcro was produced as described previously26. The sequences corresponding to the AB21 Fab were ordered as gblocks, cloned in the appropriate plasmids for protein expression in Expi293 cells. All proteins were purified using Ni-NTA and the fractions corresponding to a monodisperse peak after SEC were pooled and concentrated. Protein integrity was further confirmed by reduced and non-reducing SDS–PAGE electrophoresis followed by Coomassie blue staining. Protein was kept at 4 °C for immediate use or stored frozen at −80 °C.
SIRPα phosphorylation and phagocytosis assay
To reconstitute the SIRPα phosphorylation, approximately 4 × 10⁶ HEK293 cells were transiently transfected with plasmids encoding full-length human LCK, CD45, CD45dead or SIRPα at an optimized ratio. Cells were treated with RIPR-SIRPα 24 h after transfection for 30 min at 37 °C. As a control, RIPR-SIRPα was treated with 3C enzyme (100 μg mL−1) for 14 h at 4 °C. Cleavage efficiency was analysed by Coomassie blue staining after SDS–PAGE electrophoresis. Cleaved RIPR-SIRPα was added to the cells for 30 min at 37 °C. After treatment, cells were collected and cell lysates (prepared as described above) were incubated with anti-HA magnetic beads (Pierce, Thermo Fisher Scientific) for immunoprecipitation. Cells lysates were analysed by western blot for HA, SIRPα and phosphotyrosine as described in ‘ITAM, ITIM and ITSM signalling reconstitution in HEK293 cells’. To quantify endogenous SIRPα phosphorylation levels, approximately 1 × 10⁷ THP-1 macrophages were incubated with 100 nM of AB21 Fab or RIPR-SIRPα for 30 min at 37 °C after which cells were collected and cell lysates were incubated with 5 μg of anti-SIRPα antibody for 1 h at 4 °C and incubated overnight with 30 μl of Protein A/G magnetic beads (Pierce, Thermo Fisher Scientific). All cells were lysed in Pierce IP Lysis Buffer (Pierce Thermo Fisher Scientific, 87787) supplemented with 2× Phosphatase Inhibitor Cocktail (Abcam and Promega), Protease Inhibitor Cocktail Tablet (Roche), orthovanadate (NEB), 2 mM EDTA and 1% (w/v) of n-dodecyl β-D-maltoside (Anatrace). After immunoprecipitation, SIRPα phosphorylation was analysed by western blot. For the phagocytosis assay, approximately 5 × 10⁴ human PBMC macrophages were pretreated with or without human RIPR-SIRPα, Velcro or anti-SIRPα Fab, clone AB21 for 30 min at 37 °C, and around 1 × 10⁵ human tumour Raji B cells were pretreated with varying concentrations of rituximab (from 0 to 5 μg ml−1) for 30 min at 37 °C. After incubation, macrophage cells were co-cultured with 1 × 10⁴ CFSE-labelled Raji B cells for 2 h at 37 °C. Cells were collected and stained with the macrophage marker CD11b for 20 min at 4 °C and analysed by a CytoFLEX flow cytometer.
Statistics
All figures are representative of two (SCLC and MC38 model) or at least three (in vitro) experiments unless otherwise noted. Sample sizes were chosen on the basis of our experience with similar experiments (n = 5 mice for the SCLC, n = 10 mice for the MC38 tumour models, and n = 3 mice for Treg analysis studies, or 2 or more biological replicates for in vitro assays, as indicated in figure legends). Statistical significance was assayed by Student’s t-test or two-way ANOVA (for comparisons between treatment groups where n > 3) using GraphPad Prism 6.0 or 8.1. In all figures *P < 0.05; **P < 0.01; ***P < 0.001; ****P < 0.0001; NS: not significant. Data are represented as mean ± s.d., unless otherwise stated.
Reporting summary
Further information on research design is available in the Nature Research Reporting Summary linked to this paper.
Data availability
Data that support the findings of this study are available from the corresponding author upon reasonable request. Source data are provided with this paper.
Extended Data
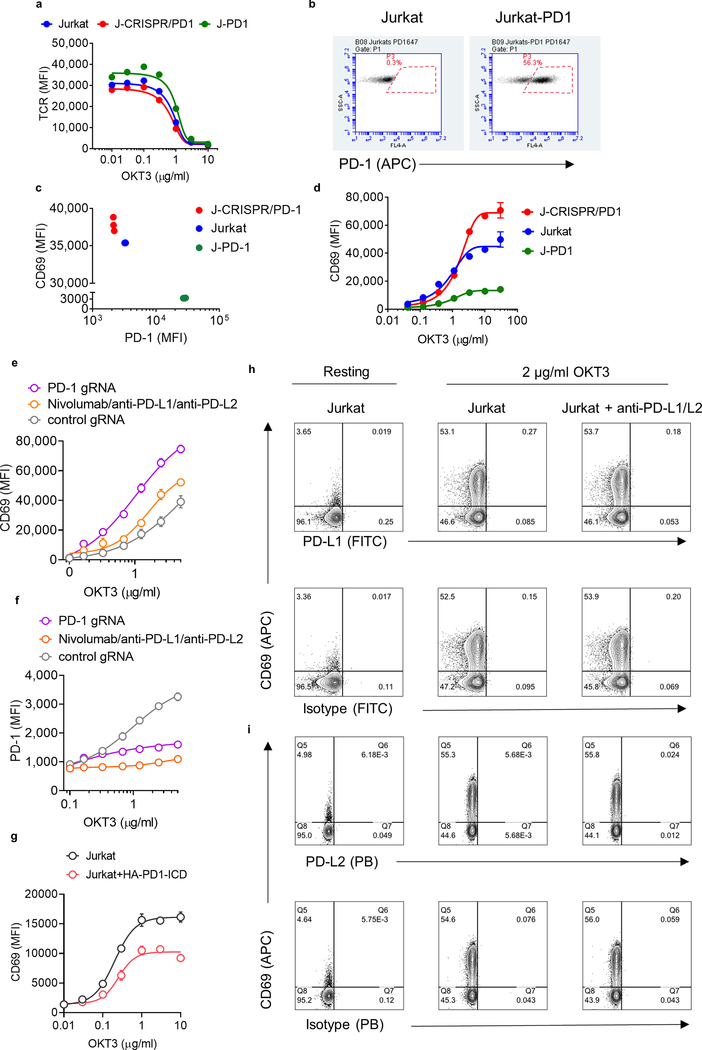
Extended Data Fig. 1 |. Tonic PD-1 signalling dampens T cell activation.
a, TCR downregulation in wild-type or transduced Jurkat T cells with CRISPR/Cas9 and gRNA targeting PD-1 (J-CRISPR-PD-1) upon OKT3 stimulation overnight. b, Jurkat T cells transduced with wild-type human PD-1 (Jurkat-PD1). c, PD-1 versus CD69 expression for Jurkat T cells stimulated overnight with OKT3. Data are shown as individual biological replicates, n = 3. d, CD69 upregulation after OKT3 and anti-CD28 stimulation overnight of wild-type Jurkat cells or Jurkat-PD1 cells (shown in b) or PD-1 KO cells (J-CRISPR-PD-1). In a, d, data are shown as mean ± s.d., n = 3 biological replicates from 1 representative of 3 independent experiments. e, f, Jurkat cells were transduced with control gRNA/CRISPR plasmid or gRNA targeting the endogenous PD-1 gene and activated at increasing concentrations of plate-bound OKT3 overnight. In a separate control group, Jurkat cells were treated with anti-PD1 (Nivolumab), anti-PD-L1 and anti-PD-L2 antibodies (50 μg ml−1 for each antibody). CD69 (e) and PD-1 (f) expression was quantified by flow cytometry. Data are mean ± s.d. from n = 2 biological replicates from 1 representative of 2 independent experiments. g, Expression of HA–PD1-ICD (ECD-less) reduced the upregulation of CD69 12 h after activation with plate-bound OKT3 at the indicated concentrations. Data are mean ± s.d. from n = 3 biological replicates from 1 representative of 2 independent experiments. h, i, Quantification of PD-L1 and PD-L2 in resting and activated Jurkat cells. Resting or activated Jurkat T cells, were incubated with anti-PD-PL1 (h), anti-PD-L2 (i) or with appropriate isotype controls and analysed by flow cytometry. Expression of PD-L1 and PD-L2 was not detected in either resting or activated Jurkat T cells. Non-fluorescent anti-PD-L1 or L2 antibody (right) was added before labelling as a ‘blocking’ control. In h, i, data are representative of 3 independent experiments.
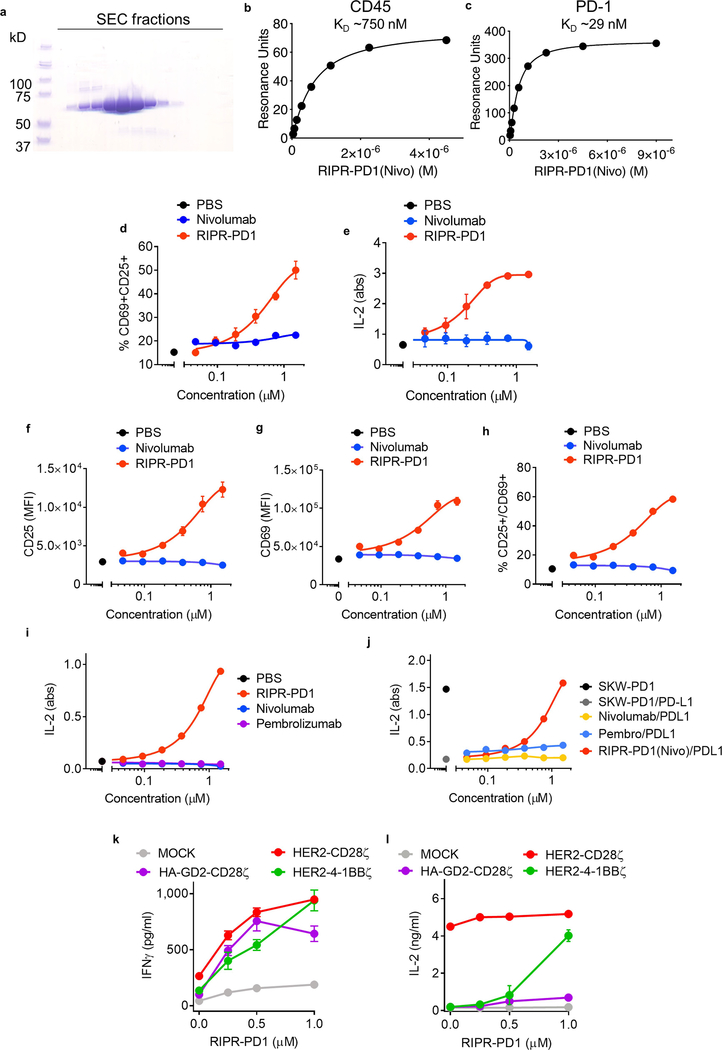
Extended Data Fig. 2 |. Development and in vitro testing of RIPR-PD1.
a, Coomassie-stained SDS–PAGE of SEC-purified RIPR-PD1(nivo). b, c, Curve fitting of recorded resonance units at steady state for RIPR-PD1 binding to immobilized CD45 (b) and PD-1 (c). Data shown for RIPR-PD1 concentrations ranging from 4 μM to 35 nM (b), and from 8 μM to 17.5 nM (c). Data are representative of 2 independent experiments. d, e, Fraction of CD25+CD69+ (d) and IL-2 (e) expression for wild-type Jurkat T cells stimulated with 2 μg ml−1 of plate-bound OKT3 and treated with nivolumab or RIPR-PD1 at the concentrations indicated for 24 h. f–i, Quantification of CD25 (f) or CD69 (g) expression and fraction of CD25+CD69+ (h) for Jurkat T cells transduced with wild-type PD-1 (shown in Extended Data Fig. 1b) and IL-2 secretion (i) for SKW-3 T cells stimulated with 2 μg ml−1 of plate-bound OKT3 and treated with nivolumab or RIPR-PD1 at the indicated concentrations for 24 h. j, Quantification of IL-2 secretion by TCR transduced SKW-T cells after stimulation for 24 h with cognate peptide in the presence or absence of PD-L1 and nivolumab or RIPR-PD1 at the indicated concentrations. k, l, IFNγ (k) and IL-2 (l) secretion by indicated CAR T cells (or mock untransduced T cells) after incubation with tumour target cells in the presence of increasing concentrations of RIPR-PD1. In d–l, data are mean ± s.d. from n = 3 biological replicates representative of 3 independent experiments.
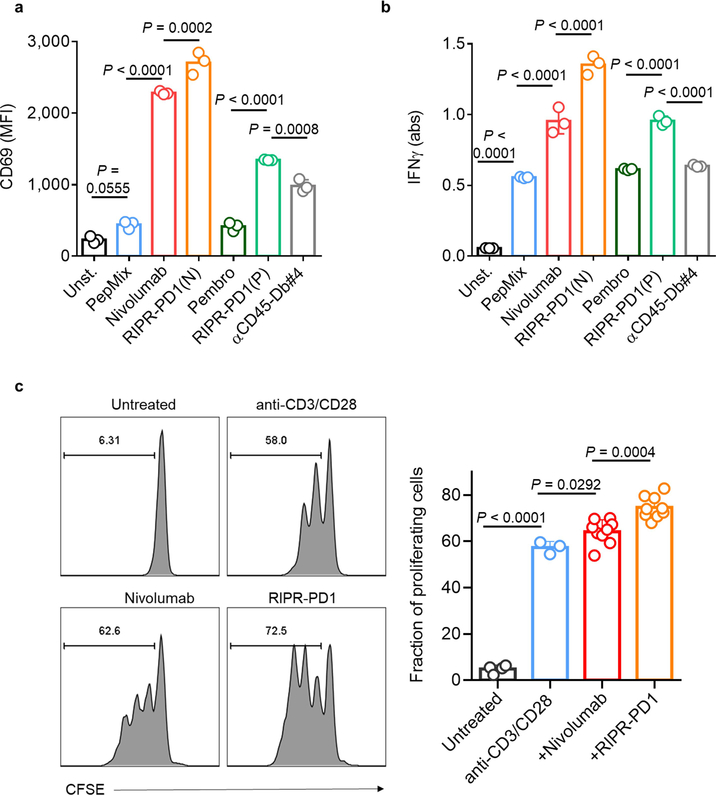
Extended Data Fig. 3 |. Antigen stimulation of PBMCs is potentiated by RIPR molecules.
a, b, Peptide-pulsed PBMCs (PepMix, JPT) were treated with 1 μM of nivolumab, pembrolizumab, RIPR-PD1 with nivo (N) or pembro (P) scFv and anti-CD45 diabody (anti-CD45-Db#4). CD69 was analysed by flow cytometry and IFNγ was quantified by ELISA. Data are mean ± s.d. from n = 3 biological replicates from 1 representative of 2 independent experiments. c, CFSE-labelled CD8+ human T cells were stimulated with anti-CD3 and anti-CD28 in the presence or absence of nivolumab or RIPR-PD1 at 1 μM. T cell proliferation was analysed by FACS on day 3. Data are mean ± s.d. from n = 4 (untreated and anti-CD3/CD28) or n = 9 (nivolumab and RIPR-PD1) biological replicates from 1 representative of 2 independent experiments.
Extended Data Fig. 4 |. RIPR-PD1 binds to CD45 and PD-1 ectodomains.
a, b, Size-exclusion chromatography profile (a) and Coomassie-stained SDS–PAGE (b) of RIPR-PD1(VHH). c–f, SPR binding curves for RIPR-PD1(VHH) binding to CD45 (c) and PD-1 (e), and curve-fitting to resonance units measured at steady state for multiple RIPR-PD1 concentrations during binding to immobilized CD45 (d) and PD-1 (f). In c, d, data shown is for RIPR-PD1 concentrations ranging from 9 μM to 35 nM. In e, f, data shown is for RIPR-PD1 concentrations ranging from 250 nM to 3.5 nM. Kd values were found to be around 700 nM for binding to CD45 and around 3 nM for binding to PD-1. Data shown are representative of 2 independent experiments. g, Jurkat T cells were stimulated with OKT3 at the indicated concentrations and treated with 1 μM of nivolumab, RIPR-PD1(nivo), RIPR-PD1(VHH) or anti-CD45 diabody (anti-CD45-Db#4). CD69 (left) and CD25 (right) were quantified by FACS 24 h after stimulation. Data are mean from n = 2 biological replicates representative of 3 independent experiments. h, SPR analysis of RIPR-PD1 simultaneously binding to CD45 and PD-1. Biotinylated human PD-1 was immobilized in two independent flow cells using a streptavidin coated surface (top). RIPR-PD1(VHH) was used as an analyte at 1 μM in channel 2 (Fc2; middle). CD45 was then used as an analyte in both channels at the indicated concentrations (bottom). Binding of CD45 was detected only in the channel in which both PD-1 and RIPR were present, Fc2, indicating that RIPR-PD1(VHH) bound to PD-1 was able to bind CD45. Fc, Flow cell. Data are representative of 2 independent experiments.
Extended Data Fig. 5 |. RIPR-PD1 potentiates T cell expansion in tumour organoids, and RIPR activity is not strictly dependent on PD-1 blockade.
a, Quantification of TILs treated with intact RIPR (hRIPR-PD1(VHH)), 3C-digested control RIPR-PD1(VHH) (black) or nivolumab (nivo) in melanoma (left) or ovarian (right) patient-derived tumour organoids, at the indicated concentrations. b, Activated Jurkat T cells upregulate PD-1 (x axis) and CD69 (y axis). Anti-PD-1 staining is blocked by RIPR-PD1(VHH) (left) but is not affected by non-blocking RIPR-PD1(Cl19) (right). c, HEK293 cells were transfected with HA–PD-1 (N-term HA-tag fused to full-length PD-1) and LCK and CD45, as indicated. 48 h after transfection cells were treated with RIPR-PD1(VHH) or RIPR-PD1(Cl19) for 30 min at 37 °C at 0.5 or 1 μM, or 3C-cleaved RIPR-PD1(VHH) (1 μM) as indicated. Anti-HA magnetic beads were used for immunoprecipitation and samples were probed for anti-phosphotyrosine or anti-PD1 by western blot. Data are representative of two independent replicates. For raw source image, see Supplementary Fig. 1. d, e, Quantification of CD69 expression (d) and IFNγ secretion (e) after PBMC stimulation (as described in Fig. 3) for cells treated with 1 μM of nivolumab, RIPR-PD1(nivo) or non-blocking RIPR-PD1(Cl19). Data are mean ± s.d. from n = 3 biological replicates from 1 representative of 2 independent experiments. For representative gating strategy, see Supplementary Fig. 2. f, Jurkat T cells were activated overnight with plate-bound OKT3 at 0.1 μg ml−1 and incubated with 1 μM of RIPR-PD1(VHH) (blocking) or RIPR-PD1(Cl19) (non-blocking). Data are mean from n = 2 biological replicates from 1 representative of 2 independent experiments. g, Size exclusion chromatography of mouse RIPR-PD1. h, SPR binding curves for mRIPR-PD1 (clone F2) binding to immobilized mouse PD-1. i, Resonance units measured at steady state for multiple mRIPR-PD1 concentrations tested for binding to mouse PD-1. RIPR-PD1 concentration shown ranges from 8 μM to 35 nM. Kd values were found to be around 750 nM for binding to mPD-1. In h, i, data are representative from 2 independent experiments. j, Mouse CD8+ T cells were isolated from spleen and lymph nodes of C57/B6 mice and stimulated with plate-bound anti-CD3 (2C11) antibody at the indicated concentrations plus soluble CD28 (2 mg ml−1). During activation with 2C11 and anti-CD28, cells were either left untreated or were incubated with anti-PD-1 antibody (clone RMP1–14) or mouse RIPR-PD1(RMP1–14) for 24 h. CD69 (top) and CD25 (bottom) expression was quantified by FACS. k, Pmel-1 mouse CD8 T cells were stimulated with peptide pulsed APCs and 250 nM of anti-PD1 (RMP1–14) antibody or RIPR-PD1(RMP) for 24 h. CD69 were analysed by flow cytometry. In j, k, data are mean ± s.d. from n = 2 biological replicates from 1 representative of 3 independent experiments.
Extended Data Fig. 6 |. In vitro testing of mouse RIPR-PD1.
a–e, CD4+ T cells were stimulated for 3 days in the presence of anti-CD3/CD28 and anti-PD1, anti-PD-L1(VHH) or RIPR-PD1, all at 1 μM, after which cells and supernatant were collected by analysis for proliferation (a), IL-2 (b) or IFNγ (c) secretion, fraction of CD44highCD62Llow (d) and CD25 (e). Cell proliferation was quantified using CellTiter-Glo, surface expression by flow cytometry and cytokine secretion by ELISA. f, Mouse CD4+ T cells were stimulated with plate-bound anti-CD3 and soluble CD28 in the presence of absence of plate-bound PD-L1 or isotype control. Cells were treated with anti-PD1 antibody (RMP1–14) or RIPR-PD1 at 1 μM and supernatant was collected for quantification of IFNγ production on day 3. In a–f, data are mean ± s.d. from n = 3 biological replicates from 1 representative of 2 independent experiments. g, Size-exclusion chromatography of intact or 3C-cleaved mouse RIPR-PD1. h, Coomassie-stained SDS–PAGE of mouse mRIPR-PD1 uncleaved or treated with 3C overnight. i, Mouse CD8+ T cells were activated with plate-bound 2C11 (1 mg ml−1) and soluble CD28 (2 mg ml−1) for 24 h and treated with 1 μM of intact (middle) or 3C-treated (right) mRIPR-PD1. j, k, Quantification of the CD69 (j) and CD25 (k) expression of representative data shown in i. Data are mean from n = 2 biological replicates from 1 representative of 3 independent experiments. l, Competition experiment between mRIPR-PD1 at the indicated concentrations and anti-CD45-MSA (2 μM), anti-PD-1-MSA (2 μM) or both, as indicated. Mouse CD8+ T cells were stimulated with 8 μg ml−1 of 2C11 and 2 μg ml−1 of anti-CD28. Black line indicates CD69 expression (with 2C11 and anti-CD28 only). CD69 expression was quantified by FACS 24 h post-stimulation. Data are mean from n = 2 biological replicates from 1 representative of 3 independent experiments. m, n, Competition experiment between mRIPR-PD1 and soluble mouse PD-1 (5 μM). Mouse CD8+ T cells were stimulated with 2 μg ml−1 (m) or 4 μg ml−1 (n) of plate-bound 2C11 and 2 μg ml−1 of soluble anti-CD28. CD69 was quantified by FACS 24 h after stimulation. Data are mean from n = 2 biological replicates from 1 representative of 3 independent experiments.
Extended Data Fig. 7 |. RIPR-PD1 induces T cells with an effector memory phenotype in a SCLC tumour model.
a, Representative analysis of CD44 and CD62L expression in lymphocytes isolated from tumour-proximal lymph nodes collected at day 19 post inoculation with KP1 (SCLC) cells for various treatments, as indicated. Data are representative from n = 5 biological replicates from 2 independent experiments. b, c, Quantification of the representative data shown in a for CD4+ (b) and CD8+ (c) cells. In b, c, data are mean ± s.d. from n = 5 biological replicates representative of 2 independent experiments. d, Quantification of the frequency of CD4+ and CD8+ cells in spleen (left) peripheral (middle) and distal (right) lymph nodes from wild-type mice treated with 200 μg anti-PD1 or RIPR-PD1 every 3 days for one week. e, Quantification of CD4+ and CD8+ infiltrates in brown adipose tissue. Mice were treated as described in d. In d, e, data are mean ± s.d. from n = 3 (d) and n = 5 (e) biological replicates representative of 2 independent experiments. For representative gating strategy, see Supplementary Fig. 2.
Extended Data Fig. 8 |. RIPR-PD1 reduces MC38 colon carcinoma tumour growth.
a, b, Analysis of the RIPR-PD1(F2) binding affinity to mouse PD-1 by SPR. c, d, Analysis of RIPR-PD1(RMP) binding affinity to mouse PD-1 by SPR. In a–d, data are representative of 2 independent experiments. CD8+ mouse T cells were stimulated with plate-bound 2C11 overnight. e, f, Quantification of CD69 upregulation for cells treated with RIPR-PD1(F2) (e) or RIPR-PD1(RMP) (f). g, Proliferation (CellTiter-Glo) analysis of anti-CD3 treated CD4+ mouse T cells in the presence of F2 or RMP RIPR-PD1. In e–g, data are mean ± s.d. from n = 2 biological replicates from 1 representative of 3 independent experiments. h, MC38 tumour growth for mice treated with PBS, anti-PD1 (clone RMP1–14, 200 μg every 3 days) or RIPR-PD1(RMP) (200 μg daily). Data are mean ± s.e.m. from n = 10 mice. i, Representative images of the mice 24 days after inoculation with MC38 cells for the indicated treatments. Data shown are representative of 2 independent experiments, n = 10 mice per group. j, Individual tumour volume measurements for the data shown in Fig. 4f. The n values stated are the number of tumour-free mice. k, Percent survival for mice treated as described in h–j. In h–j, data shown are representative of 2 independent experiments, n = 10 mice per group.
Extended Data Fig. 9 |. Profiling of mouse T cells in response to anti-PD1 or RIPR-PD1 treatment.
a, Mice inoculated with MC38 tumour cells were treated with PBS, anti-PD1 or RIPR-PD1(RMP), 200 μg, every 3 days starting at day 5 post tumour inoculation. On day 12 T cells from spleen (Spl), peripheral and distal lymph nodes (pLN, dLN) and tumour infiltrating lymphocytes (TILs) were collected and analysed by flow cytometry. b, Quantification of tumour weight. c, Quantification of PD-1+ CD4+ T cells in TILs. d–f, Quantification of the fraction of positive CTLA-4 (d), TIM-3 (e) and LAG3 (f) from TILs for CD4+ T cells. g, h, Quantification of the fraction of CD62LlowCD44high effector memory CD8+ T cells isolated from the spleen (g) or tumour (h). i, Quantification of the fraction of CXCR3-positive cells for splenic CD8+ cells. Analysis of CD4+ cells showed increased fraction of CD137 (4–1BB) (j) and CXCR3 (k) in TILs. l, Quantification of effector memory and PD-1+ cells in tumour-free mice. Mice were treated with PBS, anti-PD1 or RIPR-PD1 every 3 days from day 0 to day 6 and T cells were isolated and analysed on day 7. m–r, CD8+ and CD4+ T cells were analysed on day 7 for CD44, CD62L (m, n; CD8+, spleen) and PD-1 expression in the spleen (o, p) and lymph nodes (mLN; q, r). s, Quantification of Treg cells in tumour-free mice. Tumour-free FoxP3–GFP mice were treated with PBS, anti-PD1 or RIPR-PD1 (200 μg every 3 days) from day 0 to day 6, n = 3 mice per group. T cells were analysed on day 7. Quantification of the fraction of FoxP3–GFP-positive cells (gated on the CD3+CD4+ population) for cells isolated from the spleen. All data are mean ± s.d. from n = 5 mice (b–k, m–q) or n = 3 (s) representative from 2 independent experiments. For representative gating strategy, see Supplementary Fig. 2.
Extended Data Fig. 10 |. RIPR-SIRPα development and in vitro testing.
a, b, HEK293 cells were transiently transfected with target receptors and LCK (a), or LCK plus CD45 (b). After lysis, chimeric receptors were immunoprecipitated with anti-HA antibody directly conjugated to magnetic beads. Samples were probed for phosphotyrosine and HA by western blot. Data are representative of three independent biological repeats. For raw source image, see Supplementary Fig. 1. c, RIPR-SIRPα(3C) was treated with 3C (100 μg ml−1) for 14 h at 4 °C. 3C-digestion was analysed by Coomassie blue staining on SDS–PAGE gel. d, Human PBMC macrophages were pretreated with RIPR-SIRPα or ‘Velcro’ protein for 30 min at 37 °C and incubated with human tumour cells (Raji) pretreated with varying concentrations of rituximab (from 0 to 5 μg ml−1) for 30 min at 37 °C. Macrophages were co-cultured with 1 × 10⁴ CFSE+ Raji cells for 2 h at 37 °C. e, Quantification of phagocytosis as described in d for a fixed concentration of rituximab (1 μg ml−1) for cells treated with 100 nM or 500 nM of intact or 3C-digested RIPR-SIRPα or Velcro, as indicated. In d, e, data are mean ± s.d. from n = 2 (d) or n = 3 (e) biological replicates representative from 2 independent experiments. For representative gating strategy, see Supplementary Fig. 2. f, Coomassie blue staining on SDS–PAGE gel for AB21 Fab and RIPR-SIRPα(AB21). g, HEK293 cells were transiently transfected with LCK, CD45, CD45dead and SIRPα as indicated. HEK293 cells were treated with RIPRSIPRα 24 h after transfection for 30 min at 37 °C. Cells were collected and cell lysates were incubated with HA beads, HA–SIRPα was immunoprecipitated and analysed by western blot assay as indicated. Data are representative from 2 independent experiments. For raw source image, see Supplementary Fig. 1.
Supplementary Material
Acknowledgements
We thank members of the Garcia Laboratory for advice and discussion, and M. M. Davis for support with the MC38 tumour model. This work was supported by the Howard Hughes Medical Institute and National Institute (K.C.G.), NIH (R01 AI103867 to K.C.G., U01 CA213273 and R35 CA2311997 to J.S., K00 CA223019 to N.C.), Mathers Foundation (K.C.G.), Stanford Cancer Institute seed grant (K.C.G.), Ludwig Foundation (K.C.G.), Wellcome Trust (Sir Henry Wellcome Fellowship, WT101609MA to R.A.F.), Taube Distinguished Scholar for Pediatric Immunotherapy at Stanford University School of Medicine (R.G.M.), Mentored Clinical Scientist Development Award 1K08DK114563-01 (M.D.) and the American Gastroenterological Association Research Scholars Award (M.D.)
Footnotes
Competing interests RIPR is the subject of a pending patent application (63/056,156), with K.C.G. and R.A.F. listed as inventors. K.C.G. is the founder of Synthekine Therapeutics Inc.
Additional information
Supplementary information is available for this paper at https://doi.org/10.1038/s41586-020-2851-2.
Peer review information Nature thanks Enfu Hui and the other, anonymous, reviewer(s) for their contribution to the peer review of this work.
Online content
Any methods, additional references, Nature Research reporting summaries, source data, extended data, supplementary information, acknowledgements, peer review information; details of author contributions and competing interests; and statements of data and code availability are available at https://doi.org/10.1038/s41586-020-2851-2.
References
- 1.Wei SC, Duffy CR & Allison JP Fundamental mechanisms of immune checkpoint blockade therapy. Cancer Discov. 8, 1069–1086 (2018). [DOI] [PubMed] [Google Scholar]
- 2.Hermiston ML, Xu Z & Weiss A CD45: a critical regulator of signaling thresholds in immune cells. Annu. Rev. Immunol. 21, 107–137 (2003). [DOI] [PubMed] [Google Scholar]
- 3.Barr AJ et al. Large-scale structural analysis of the classical human protein tyrosine phosphatome. Cell 136, 352–363 (2009). [DOI] [PMC free article] [PubMed] [Google Scholar]
- 4.Smith-Garvin JE, Koretzky GA & Jordan MS T cell activation. Annu. Rev. Immunol. 27, 591–619 (2009). [DOI] [PMC free article] [PubMed] [Google Scholar]
- 5.Chang VT et al. Initiation of T cell signaling by CD45 segregation at ‘close contacts’. Nat. Immunol. 17, 574–582 (2016). [DOI] [PMC free article] [PubMed] [Google Scholar]
- 6.Stefanová I, Dorfman JR & Germain RN Self-recognition promotes the foreign antigen sensitivity of naive T lymphocytes. Nature 420, 429–434 (2002). [DOI] [PubMed] [Google Scholar]
- 7.Vijayakrishnan L et al. An autoimmune disease-associated CTLA-4 splice variant lacking the B7 binding domain signals negatively in T cells. Immunity 20, 563–575 (2004). [DOI] [PubMed] [Google Scholar]
- 8.Hanawa H et al. A novel costimulatory signaling in human T lymphocytes by a splice variant of CD28. Blood 99, 2138–2145 (2002). [DOI] [PubMed] [Google Scholar]
- 9.Wei F et al. Strength of PD-1 signaling differentially affects T-cell effector functions. Proc. Natl Acad. Sci. USA 110, E2480–E2489 (2013). [DOI] [PMC free article] [PubMed] [Google Scholar]
- 10.Wang S-F et al. Early T cell signalling is reversibly altered in PD-1+ T lymphocytes infiltrating human tumors. PLoS ONE 6, e17621 (2011). [DOI] [PMC free article] [PubMed] [Google Scholar]
- 11.Bardhan K et al. Phosphorylation of PD-1-Y248 is a marker of PD-1-mediated inhibitory function in human T cells. Sci. Rep. 9, 17252 (2019). [DOI] [PMC free article] [PubMed] [Google Scholar]
- 12.Riley JL PD-1 signaling in primary T cells. Immunol. Rev. 229, 114–125 (2009). [DOI] [PMC free article] [PubMed] [Google Scholar]
- 13.Gong J, Chehrazi-Raffle A, Reddi S & Salgia R Development of PD-1 and PD-L1 inhibitors as a form of cancer immunotherapy: a comprehensive review of registration trials and future considerations. J. Immunother. Cancer 6, 8 (2018). [DOI] [PMC free article] [PubMed] [Google Scholar]
- 14.Marasco M et al. Molecular mechanism of SHP2 activation by PD-1 stimulation. Sci. Adv. 6, eaay4458 (2020). [DOI] [PMC free article] [PubMed] [Google Scholar]
- 15.Beane JD et al. Clinical scale zinc finger nuclease-mediated gene editing of PD-1 in tumor infiltrating lymphocytes for the treatment of metastatic melanoma. Mol. Ther. 23, 1380–1390 (2015). [DOI] [PMC free article] [PubMed] [Google Scholar]
- 16.Tonks NK Protein tyrosine phosphatases: from genes, to function, to disease. Nat. Rev. Mol. Cell Biol. 7, 833–846 (2006). [DOI] [PubMed] [Google Scholar]
- 17.Hui E et al. T cell costimulatory receptor CD28 is a primary target for PD-1–mediated inhibition. Science 355, 1428–1433 (2017). [DOI] [PMC free article] [PubMed] [Google Scholar]
- 18.Majzner RG et al. Tuning the antigen density requirement for CAR T-cell activity. Cancer Discov. 10, 702–723 (2020). [DOI] [PMC free article] [PubMed] [Google Scholar]
- 19.Neal JT et al. Organoid modeling of the tumor immune microenvironment. Cell 175, 1972–1988.e16 (2018). [DOI] [PMC free article] [PubMed] [Google Scholar]
- 20.Sabari JK, Lok BH, Laird JH, Poirier JT & Rudin CM Unravelling the biology of SCLC: implications for therapy. Nat. Rev. Clin. Oncol. 14, 549–561 (2017). [DOI] [PMC free article] [PubMed] [Google Scholar]
- 21.Zimmerman S et al. 2017–2018 scientific advances in thoracic oncology: small cell lung cancer. J. Thorac. Oncol. 14, 768–783 (2019). [DOI] [PubMed] [Google Scholar]
- 22.Meuwissen R et al. Induction of small cell lung cancer by somatic inactivation of both Trp53 and Rb1 in a conditional mouse model. Cancer Cell 4, 181–189 (2003). [DOI] [PubMed] [Google Scholar]
- 23.George J et al. Comprehensive genomic profiles of small cell lung cancer. Nature 524, 47–53 (2015). [DOI] [PMC free article] [PubMed] [Google Scholar]
- 24.Woo SR et al. Immune inhibitory molecules LAG-3 and PD-1 synergistically regulate T-cell function to promote tumoral immune escape. Cancer Res. 72, 917–927 (2012). [DOI] [PMC free article] [PubMed] [Google Scholar]
- 25.Weiskopf K et al. Engineered SIRPα variants as immunotherapeutic adjuvants to anticancer antibodies. Science 341, 88–91 (2013). [DOI] [PMC free article] [PubMed] [Google Scholar]
- 26.Ho CCM et al. “Velcro” engineering of high affinity CD47 ectodomain as signal regulatory protein α (SIRPα) antagonists that enhance antibody-dependent cellular phagocytosis. J. Biol. Chem. 290, 12650–12663 (2015). [DOI] [PMC free article] [PubMed] [Google Scholar]
- 27.Sim J et al. Discovery of high affinity, pan-allelic, and pan-mammalian reactive antibodies against the myeloid checkpoint receptor SIRPα. MAbs 11, 1036–1052 (2019). [DOI] [PMC free article] [PubMed] [Google Scholar]
- 28.Davis SJ & van der Merwe PA The kinetic-segregation model: TCR triggering and beyond. Nat. Immunol. 7, 803–809 (2006). [DOI] [PubMed] [Google Scholar]
- 29.Kolbinger F et al. Therapeutic binding molecules. WIPO patent WO/2005/026210 (2005).
- 30.Davis S & Tyson KL PD-1 specific antibodies and uses thereof. US patent US8927697B2 (2009).
- 31.Bowman E et al. PD1 and/or LAG3 binders. US patent US20170137517A1 (2016).
- 32.Rossotti M et al. Streamlined method for parallel identification of single domain antibodies to membrane receptors on whole cells. Biochim. Biophys. Acta 1850, 1397–1404 (2015). [DOI] [PMC free article] [PubMed] [Google Scholar]
- 33.Collins M et al. Antibodies against PD-1 and uses thereof. WIPO patent WO2004056875A1 (2002).
- 34.Zhao P et al. Depletion of PD-1-positive cells ameliorates autoimmune disease. Nat. Biomed. Eng. 3, 292–305 (2019). [DOI] [PMC free article] [PubMed] [Google Scholar]
- 35.Dumoulin M et al. A camelid antibody fragment inhibits the formation of amyloid fibrils by human lysozyme. Nature 424, 783–788 (2003). [DOI] [PubMed] [Google Scholar]
- 36.Dumoulin M et al. Single-domain antibody fragments with high conformational stability. Protein Sci. 11, 500–515 (2002). [DOI] [PMC free article] [PubMed] [Google Scholar]
- 37.Majzner RG, Weber EW, Lynn RC, Xu P & Mackall CL Neurotoxicity associated with a high-affinity GD2 CAR—Letter. Cancer Immunol. Res. 6, 494–495 (2018). [DOI] [PubMed] [Google Scholar]
- 38.Lynn RC et al. c-Jun overexpression in CAR T cells induces exhaustion resistance. Nature 576, 293–300 (2019). [DOI] [PMC free article] [PubMed] [Google Scholar]
- 39.Pons J et al. Antibodies against signal-regulatory protein alpha and methods of use. WIPO patent WO2018057669A1 (2016).
Associated Data
This section collects any data citations, data availability statements, or supplementary materials included in this article.
Supplementary Materials
Data Availability Statement
Data that support the findings of this study are available from the corresponding author upon reasonable request. Source data are provided with this paper.


