Abstract
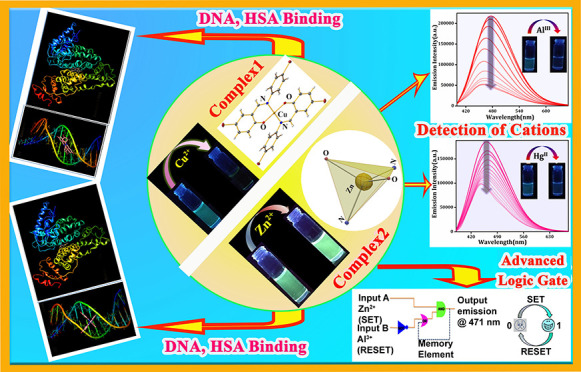
Two fluorescence active bromoaniline-based Schiff base chemosensors, namely, (E)-4-bromo-2-(((4-bromophenyl)imino)methyl)phenol (HL1) and (E)-2-(((4-bromophenyl)imino)methyl)phenol (HL2), have been employed for the selective and notable detection of Cu2+ and Zn2+ ions, respectively, with the simultaneous formation of two new metal complexes [Cu(L1)2] (1) and [Zn(L2)2] (2). X-ray single crystal analyses indicate that complexes 1 and 2 are tetra-coordinated systems with substantial CH...π/π...π stacking interactions in the solid-state crystal structures. These two complexes are exploited for the next step detection of Al3+ and Hg2+ where complex 2 exhibits impressive results via turn-off fluorescence quenching in (DMSO/H2O) HEPES buffer medium. The sensing phenomena are optimized by UV–vis spectral analyses as well as theoretical calculations (density functional theory and time-dependent density functional theory). The combined detection phenomena of the ligand (HL2) and complex 2 are exclusively utilized for the first time to construct a molecular memory device, intensifying their multisensoric properties. Furthermore, the DNA- and human serum albumin (HSA)-binding efficacies of these two complexes are examined by adopting electronic and fluorometric titration methods. Complex 2 shows a higher DNA-binding ability in comparison with complex 1, whereas in the case of HSA, the reverse situation is observed. Finally, the binding modes of both the complexes with DNA and HSA have been investigated through molecular docking studies, suggesting good agreement with the experimental results.
Introduction
Fluorescence-based techniques have gained great momentum in modern-day research for efficient and ultrafast detection of metal ions having physiological and environmental pertinences.1−4 The upsurge of research efforts for the construction of fluorescence-based chemosensors could be attributed to their better applicability for the selective and specific recognition of analytes compared to other analytical methods such as cyclic voltametry,5 inductively coupled plasma mass spectroscopy,6 inductively coupled plasma-atomic emission spectroscopy,7 EPR spectral studies, etc. that are mostly expensive, single-analyte-driven scrupulous systems. The implementation of metal–organic complexes as a possible chemosensory platform attracts much attention to this end due to their ease of synthesis, large choice of building precursors, diverse structural features, and most importantly potential luminescence properties.8−10 However, to endow a chemosensor with all such prerequisites, the organic skeleton should be rationally engineered and synthesized, which demands extensive future studies.
Aluminum and mercury are two well-known metals where the former is largely used in the cosmetics industry, pharmaceutical industry, food and packaging industry, etc., and the latter is one of the large-scale heavy metal contaminants that are discharged with industrial effluents.11−13 The abnormal accumulation of both these metals may cause several life-threatening diseases such as Alzheimer’s disease, Minamata disease, Parkinson’s disease, Hunter–Russel Syndrome, etc.14−18 Abnormal chromosomal disorder is also a malicious effect of HgII poisoning, leading to long-term genetic deformities. Hence, the detection of these two metals is an utmost requirement. However, due to the inconvenience of the traditional analytical methods, finding a suitable recognition tool seems more challenging to chemists. According to our previous discussion, fluorescence spectroscopic techniques could be an effective alternative, involving the synthesis of fluorescence active sensors appropriately designed for the recognition of metal ions of interest. In fact, this process could also be advantageous for the detection of other physiologically important metals such as Cu, Zn, etc.19−27 These two metals play an indispensible role in numerous biological processes.28−34 Unfortunately, the industrial revolution has led to critical environmental problems, which introduce these essential elements in a new perspective as “pollutants”. The excess release of CuII and ZnII ions in the soil and ground and surface water causes severe risk to the ecosystem at its current levels of exposure.35,36 Thus, the detection of these two biologically and environmentally related metal ions is as an urgent need.
Apart from metal sensing, the fluorometric detection platform can also be utilized to study the interactions of metal–organic complexes with primary macromolecules present within living systems.37 This investigation is not only important to establish a relationship between the two disciplines, chemistry and biology, but at the same time, it is highly interesting in pharmacology to realize the probable interaction of drug molecules with system proteins. Designing metal complexes having structural and compositional variations and investigation of their binding efficacy with DNA are proved to be advantageous for developing effective cancer therapeutic drugs.38−40 The determination of different binding modes of DNA with studied complexes also helps in the systematic modulation of the drug molecules to have better efficacy. On the other hand, human serum albumin (HSA), the most abundant circulating protein present in human blood plasma, binds and transports therapeutic agents, acting as a potential drug carriage system.41 The HSA–drug interactions generally govern the extent of transportation, distribution, toxic side effects, and finally excretion of drug molecules in the human body.42,43 Hence, the exploration of the interaction of metal-based pharmaceuticals with DNA/HSA is still under investigation.
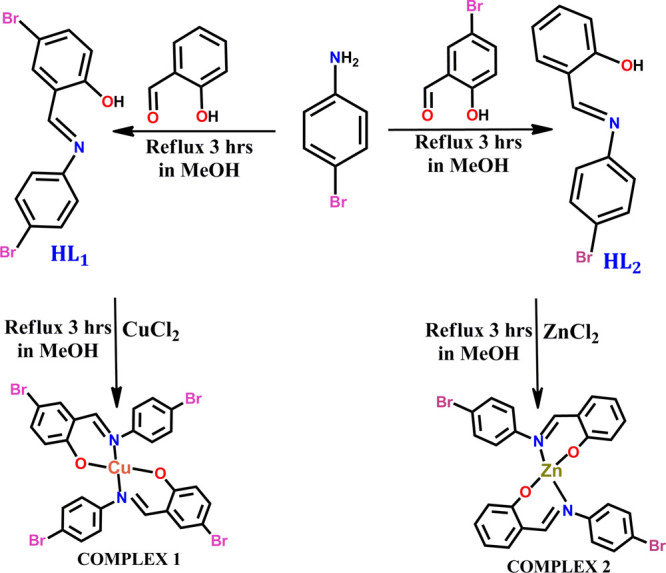
Addressing all these requirements, primarily, we have developed two fluorescence active Schiff base probes HL1 and HL2 by coupling of bromoaniline with salicylaldehyde and 5-bromo salicylaldehyde, respectively (Scheme 1). The ligands HL1 and HL2 induce remarkable UV colorimetric and fluorometric changes, specifically for Cu2+ and Zn2+ among different metal cations, with the crystallization of two new complexes [Cu(L1)2] (1) and [Zn(L2)2] (2), respectively (Scheme 1). The strong emissive nature of complex 2 is further utilized for the specific and rapid detection of Al3+ and Hg2+ with a low detection limit. Density functional theory (DFT) and time-dependent density functional theory (TD-DFT) calculations reveal the probability of formation of a bimetallic complex between Al3+ and complex 2 governing such efficient sensing phenomena. Considering the two-step detection achieved by the successive selection of HL2 and its complex (2), a molecular memory device is formulated. Finally, the binding efficacies of both the complexes with ctDNA and HSA are studied thoroughly. The binding modes as well as the extent of binding of both the complexes are revealed via the help of combined experimental and theoretical techniques involving electronic and fluorescence spectral titration, circular dichroism (CD) analysis, and molecular docking studies.
Scheme 1. Synthesis of the Ligands HL1 and HL2 and Complexes 1 and 2.
Results and Discussion
Synthesis and General Characterization
Complexes 1 and 2 are synthesized by reacting CuCl2 and ZnCl2 solution with HL1 and HL2 in respective solvents and are subjected to the following spectral analysis. The FT-IR spectral outcomes are primarily assessed to get an initial idea of the structural skeleton. The “C=N” stretching is observed in two cases within 1630–1660 cm–1, suggesting the presence of an imine bond. The sharp bands ranging from 1410 to 1430 cm–1 could be attributed to the skeleton benzene vibration in both complexes (Figure S1 in the Supporting Information). The electronic spectra of complexes 1 and 2 are recorded in DMSO medium (Figure S2 in the Supporting Information). The absorption bands arise due to charge transfer transition in complexes 1 and 2 appearing at 337 nm and 401 nm, respectively. Unlike complex 2, the absorption band at 568 nm (visible region) for complex 1 is presumably due to the d–d transition. The 1H NMR (d6-DMSO at 25 °C) spectrum of complex 2 shows a signal for two imine protons at δ = 8.6 ppm, whereas all of the aromatic protons appeared at δ = 7.2–7.5 as a multiplate.
Structure Description of Complexes
Complex 1 [Cu(L1)2]
Complex 1 is a mononuclear Cu complex that crystallizes in the monoclinic P21/c space group. The asymmetric unit comprises one fully occupied L1 ligand and a half occupied Cu2+ ion located over a crystallographic inversion center. The central metal ion crystallizes in a square planar geometry in which the four positions are coordinated with two imine nitrogen and two phenoxo oxygen arising from the ligand backbone, resulting in six-membered chelate rings (Figure 1a). The obtained O1–Cu1–O1 and N1–Cu1–N1 bond angles are equal to 180°, indicating the formation of a perfect planar environment around the central atom. Structural analysis indicates that the phenolic −OH residue of the ligand undergoes deprotonation during crystallization, producing phenoxo ions, which further bears the counter charge, maintaining the electroneutrality of the complex. The crystal packing presumably takes place, favoring CH...π interactions [CH...centroid 2.874 Å] between the adjacent structural units (Figure 1b). The observed Cu1–N1 and Cu1–O1 bond lengths are 2.011 and 1.888 Å, respectively. The other relevant bond lengths and bond angles are tabulated in Table S1 in the Supporting Information.
Figure 1.
(a) ORTEP view of complex 1 with 40% ellipsoid probability (H atoms are not shown for clarity) and (b) crystal packing favoring CH...π interactions.
Complex 2 [Zn(L2)2]
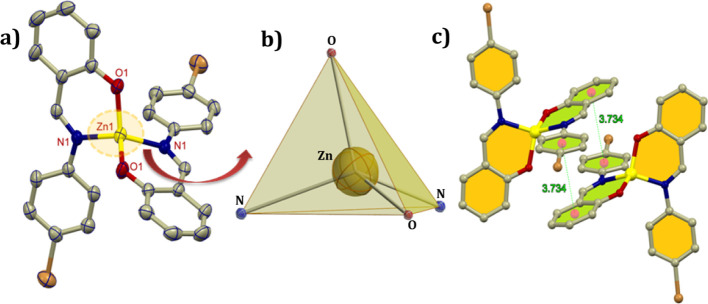
Complex 2 crystallizes in the monoclinic C2/c space group with the central metal ion located on a twofold crystallographic axis with the center of symmetry passing through it. Thus, the asymmetric unit contains one fully occupied L2 ligand and one Zn2+ center situated over a special position (Figure 2), as mentioned above. The immediate environment around the central metal is a distorted tetrahedral where the four positions of the tetrahedron is coordinated with two imine nitrogen and two phenoxo oxygen arising from the ligand skeleton. Similar to the previous complex, here also the ligand undergoes deprotonation during crystallization. The contagious units are stacked with each other through extensive π....π stacking interactions [centroid...centroid 3.734 Å]. The Zn1–N1 and Zn1–O1 bond distances are found to be 2.022 and 1.898 Å, respectively. The other required bond lengths and the bond angles are provided in Table S1 in the Supporting Information.
Figure 2.
(a) ORTEP view with 40% ellipsoid probability (H atoms are not shown for clarity), (b) polyhedral view around the central atom, and (c) crystal assembly.
Fluorescence and UV–vis Spectroscopic Signature of Ligand HL1 and HL2
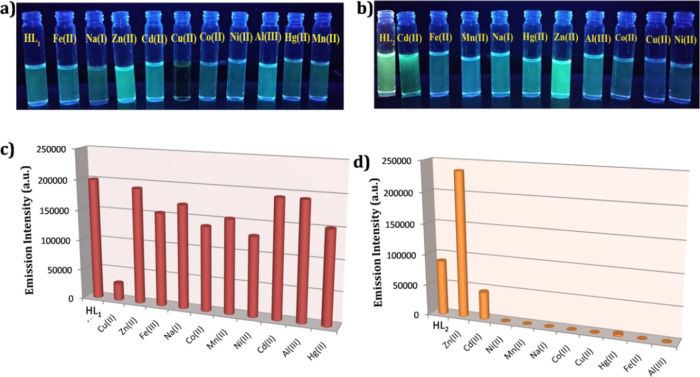
As both the prepared ligands exhibit potential luminescence features, we commence our work by investigating the sensing power of HL1 and HL2 toward various cations such as Co2+, Fe3+, Na+, Cu2+, Ni2+, Cd2+, Mn2+, Zn2+, and Hg2+ in DMSO/H2O (9:1) HEPES buffer medium (pH 7.4). Under a UV lamp (λ = 365 nm), a prominent change in the luminescence of HL1 and HL2 was visualized by the naked eye via the selective addition of Cu2+ and Zn2+, respectively. No such significant changes were observed for other analytes, which instigated us to investigate the fluorescence spectral changes of the ligand via the addition of the said metal ions (Figure 3 and Figure S3 in the Supporting Information).
Figure 3.
Color changes visible by the naked eye after addition of (a) Cu2+ in the HL1 and (b) Zn2+ in HL2 ligand; fluorescence emission spectral change of (c) HL1 ligand (4 × 10⁻⁷ M) at 485 nm in the presence of different cations, showing considerable fluorescence quenching for Cu2+ ions and (d) HL2 ligand (4 × 10⁻⁷ M) at 471 nm in the presence of different cations, showing considerable fluorescence quenching for Cu2+ ions in 9:1 (DMSO/H2O) HEPES buffer (pH = 7.4) solution.
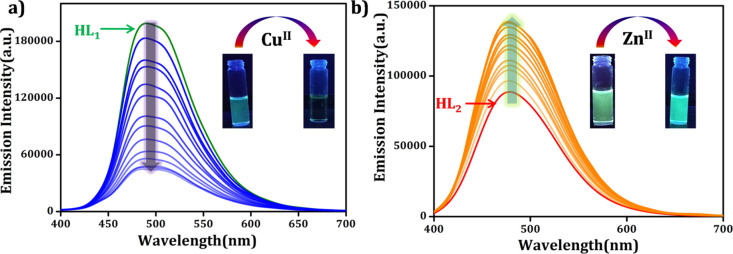
The ligands HL1 and HL2 showed emission maxima at 485 and 471 nm, respectively. To obtain a quantitative appraisal uniting the change in the fluorescence intensity of HL1 and HL2 with the added amount of Cu2+ and Zn2+, detailed fluorometric titration experiments were conducted in two cases, and the titration results are shown in Figure 4. The figure clearly depicts that after incremental addition of Cu2+ to HL1, the fluorescence intensity, centered at 485 nm, gradually decreases with a blue shift of 6 nm (Figure S3 in the Supporting Information), whereas a considerable enhancement in the fluorescence intensity, centered at 471 nm, was observed when Zn2+ was added to HL2 solution (red shift 5 nm). The quenching constant for HL1 was determined to be 1.7 × 10⁵ M–1 using the Stern–Volmer equation, F0/F = KSV[Q] +1; where F0 and F denote the emission intensity in the absence and presence of the analyte, respectively, [Q] stands for the concentration of the added analyte, and KSV refers to the quenching constant value (Figure S4 in the Supporting Information). The limit of detection (LOD) was found to be 31.74 × 10⁻⁸ M and 39.8 × 10⁻⁸ M for HL1 to Cu2+ and to Zn2+, respectively, based on LOD = K × σ/S, where K = 3, σ indicates the standard deviation of the blank solution and S stands for the slope of the calibration curves (Figure S5 in the Supporting Information).
Figure 4.
(a) HL1 upon incremental addition of Cu2+ solution (0.5–10 × 10–7 M) in (DMSO/H2O) HEPES buffer (pH = 7.4) solution (λex = 360 nm and λem = 485 nm). Inset: visual color change observed with the addition of Cu2+ to HL1 solution under UV light (λ = 365 nm) and (b) HL2 (3 × 10⁻⁷ M) upon incremental addition of Zn2+ solution (0.5–10 × 10–7 M) in (DMSO/H2O) HEPES buffer (pH = 7.3) solution (λex = 360 nm, λem = 471 nm). Inset: visual color change observed after the addition of Zn2+ to HL2 solution under UV light (λ = 365 nm).
The remarkable quenching constant value for Cu2+–HL1 and significant enhancement of the fluorescence intensity for Zn2+–HL2 along with the shifting of spectral positions may be considered as the indication of the complex formation as the ligands contain potential donor centers that are able to form bonds with metal cores.44 To investigate and to evaluate the binding constants for HL1–Cu2+ and HL2–Zn2+ adducts, the UV metric titration was performed successively. The titration pictorial graph is depicted in Figure S6 in the Supporting Information. The stability of HL1 and HL2 in DMSO/water (9:1) solvent at a fixed pH value (7.4) was confirmed by means of a time-scan UV–vis experiment (Figure S7, Supporting Information). At the same time, the stability of the two ligands are also examined at different pH values and is shown in Figure S7, which justifies accomplishing the whole study at the fixed pH 7.4. After the addition of incremental concentration of metal ions to ligands, the absorbance at 353 and 339 nm for HL1 and HL2 gradually decreases along with the formation of two isosbestic points at 382 and 371 nm, as expected, indicating the generation of single species in HL1–Cu2+ solution and HL2–Zn2+ solution. The calculated binding constants for the HL1–Cu2+ ion and HL2–Zn2+ ion adducts are 1.019 × 10⁵ M–1 and 4.59 × 10⁵ M–1, respectively, indicating complex formation in two cases. According to the supposition, we were able to isolate two single crystals and characterize them accordingly, as we have mentioned in the previous section.
Response of Complex 2 toward Al3+ and Hg2+ by Fluorescence and UV–vis Spectroscopy
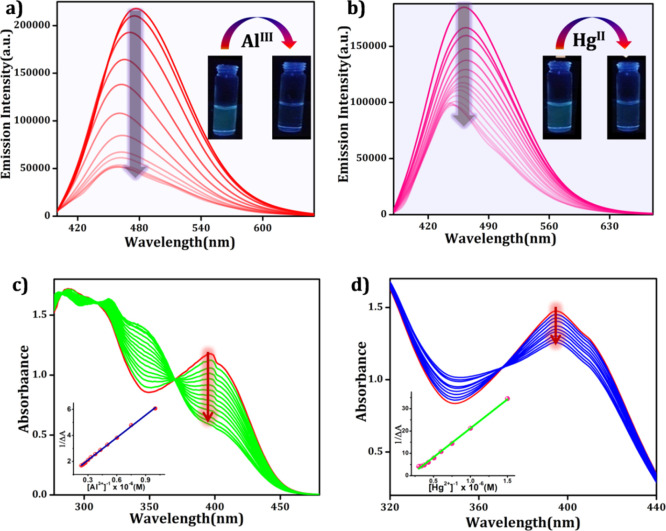
Among the two complexes, complex 2 possessed a potential luminescent character, as observed from the fluorescence responses. It displays a strong emission at 471 nm upon excitation with 360 nm light in DMSO/H2O (9:1) medium at pH 7.4. Thus, complex 2 can be reutilized for the second-step detection procedure. Keeping this point in mind, we further exploited complex 2 for the effective detection of metal ions where it showed the selective recognition of Al3+ and Hg2+ among all (Figure S8 in the Supporting Information). The fluorometric titration profile of complex 2 was recorded upon incremental addition of Al3+ and Hg2+ (5–100 μM) solutions to a fixed concentration of complex 2 in DMSO/H2O (9:1) HEPES buffer solution at pH 7.4 (Figure 5). In both the cases, the fluorescence intensity rapidly diminishes with the blue shift of 13 nm and 22 nm, respectively. The quenching constant values (KSV) are found to be 1.78 × 10⁵ M–1 and 1.19 × 10⁴ M–1 using the Stern–Volmer equation, as mentioned previously (Figure S9 in the Supporting Information). The detection limits of complex 2 for Al3+ and Hg2+ ions are found to be 1.78 × 10⁻⁸ M and 2.29 × 10⁻⁸ M, respectively (Figure S10 in the Supporting Information). From the quenching constants and detection limit values, it can be further concluded that the sensing efficacy of complex 2 is higher in the case of Al3+ than in that of Hg2+ ions. The quenching constant values are very much comparable with other Al3+ and Hg2+ sensing organic probes,45,46 indicating the strong bonding association between the studied analytes and complex 2.
Figure 5.
Fluorescence spectral analyses of complex 2 in (DMSO/H2O) HEPES buffer solution (pH = 7.3) (a) upon incremental addition of Al3+ ions (λex = 360 nm and λem = 481 nm) and (b) upon incremental addition of Hg2+ ions (λex = 360 nm and λem = 481 nm). Inset: visual color change observed under UV light (λ = 365 nm) and UV–vis spectral change of complex 2 in DMSO/H2O HEPES buffer solution upon incremental addition of (c) Al3+ and (d) Hg2+.
This fact is further substantiated by UV–vis spectral titration via the evaluation of the respective host–guest binding constants values. The absorbance is recorded after individual addition of Al3+ and Hg2+ (5–100 μM) to complex 2 in DMSO/H2O HEPES buffer solution at pH 7.4 (Figure 5). As expected, the peak at 395 nm of free complex 2 gradually decreases and two new bands at 339 and 348 nm appeared after the addition of Al3+ and Hg2+, respectively. An isosbestic point at 360 and 375 nm, respectively, for Al3+ and Hg2+ appeared on the titration curve, indicating the existence of equilibrium, which further indicates the conversion of the free chemosensor to its bimetal complexes. The binding constants for complex 2 to Al3+ and complex 2 to the Hg2+ adduct are found to be 1.5 × 10⁶ M–1 and 5.5 × 10⁵ M–1, respectively. Due to the high binding constant value in Al3+ sensing, DFT studies and molecular advanced logic gate formation are performed for Al3+ sensing.
DFT Calculations
The lack of supporting experimental evidence regarding the formation of the Zn/Al bimetal complex, after the detection of Al3+ by complex 2, forces us to perform structure optimization with the help of DFT calculations. Since we have the crystal structure of complex 2, we again optimized the same in the B3LYP level of theory with SDD as a basis set in the gas phase. We observed that this basis set reproduces the geometrical parameters quite well. Hence, we have modeled the complex 2–Al3+ adduct and optimized with the identical level of theory and basis set to obtain the ground-state geometry. The polarizable continuum model (PCM) embedded in G09w has been used to create the solvent environment. Furthermore, it has been observed that CAM-B3LYP, which has the combination of the hybrid qualities of B3LYP and the long-range correction, can elucidate the UV–vis spectral properties efficiently.47,48 The geometry of the possible binding mode of complex 2 with Al3+ is shown in Scheme 2. The scheme depicts that after the detection of Al3+, a bimetal is formed where the Al3+ center occupies a distorted octahedral atmosphere. An experimentally performed UV–vis spectral titration exhibits a gradual decrease in the absorption maxima, centered at 394 nm, with the formation of a new band at 339 nm after the incremental addition of Al3+ to complex 2.
Scheme 2. (a) Formation Mechanism and Structure of the Zn/Al Bimetal Complex and (b) Major HOMO–LUMO Transitions in the Zn Complex and the Zn/Al Bimetal Complex.
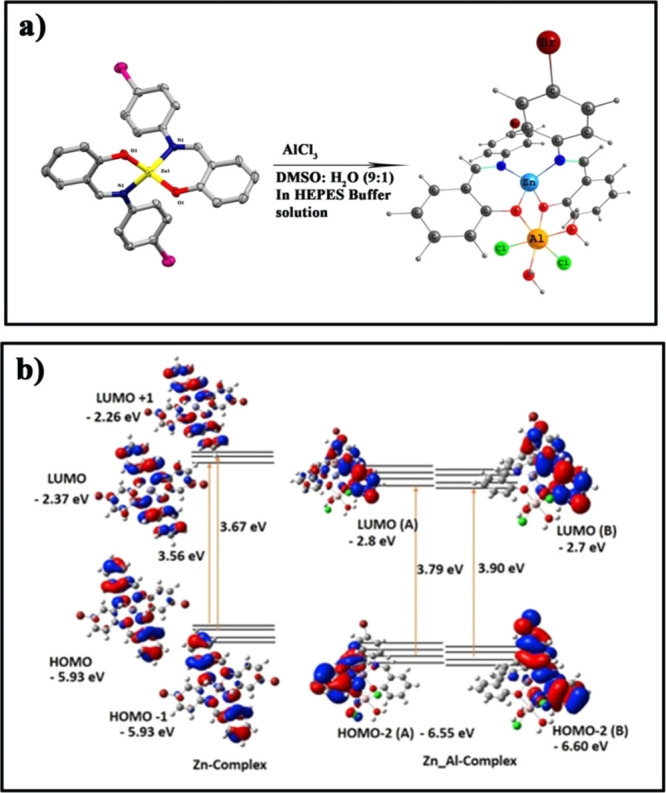
Theoretical calculations well supported the experimental results, indicating a decrease in the absorption maxima at 370 nm with the formation of a new band at 329 nm. From TD-DFT vertical excited-state calculations, the strong highest occupied molecular orbital (HOMO) (π type) to the lowest unoccupied molecular orbital (LUMO; π* type) transition with an oscillator strength of f = 0.402 (329 nm) (Table 1) is observed in the case of the Zn/Al bimetal complex, whereas in complex 2, this energy gap is found to be slightly lower, with an oscillator strength of f = 0.2907 (370 nm). The energy diagram is shown in Scheme 2. This lower HOMO–LUMO energy gap in pure complex 2 in comparison with the bimetal complex may be attributed to the formation of a bimetal complex after the addition of Al3+ to complex 2.
Table 1. Major Transitions with Osc. Strength and λex of Complex 2 and Complex 2–Al Adduct Calculateda.
| compound | wavelength (nm) | osc. strength | major contributions |
|---|---|---|---|
| complex 2 | 359.37 | 0.2907 | H-1- > LUMO (56%), HOMO- > L + 1 (40%) |
| 356.88 | 0.5296 | H-1- > L + 1 (43%), HOMO- > LUMO (54%) | |
| 296.44 | 0.1123 | H-1- > L + 1 (29%), HOMO- > LUMO (22%) | |
| 279.35 | 0.6025 | H-3- > LUMO (36%), H-2- > L + 1 (28%), H-1- > L + 1 (14%), HOMO- > LUMO (14%) | |
| 278.52 | 0.1389 | H-3- > L + 1 (27%), H-2- > LUMO (32%), H-1- > LUMO (14%), HOMO- > L + 1 (20%) | |
| 263.67 | 0.3036 | H-9- > LUMO (12%), H-5- > L + 1 (27%), H-4- > LUMO (24%), H-1- > L + 1 (12%) | |
| complex 2–AlIII adduct(bimetal complex) | 451.55 | 0.1393 | HOMO(A)- > L + 6(A) (11%), HOMO(A)- > L + 8(A) (49%) |
| 367.72 | 0.3161 | HOMO(A)- > L + 8(A) (12%), HOMO(B)- > L + 1(B) (33%) | |
| 363.44 | 0.3904 | HOMO(A)- > L + 1(A) (11%), HOMO(A)- > L + 11(A) (12%), HOMO(B)- > L + 1(B) (22%) | |
| 341.42 | 0.1553 | HOMO(B)- > LUMO(B) (73%) | |
| 329.62 | 0.402 | H-2(A)- > LUMO(A) (23%), H-2(B)- > LUMO(B) (36%), HOMO(B)- > LUMO(B) (18%) | |
| 295.34 | 0.3489 | H-4(A)- > LUMO(A) (38%), H-3(B)- > LUMO(B) (37%) |
Bimetal complex using the CAM-B3LYP/SDD level of theory in DMSO solvent
Molecular Logic Gate
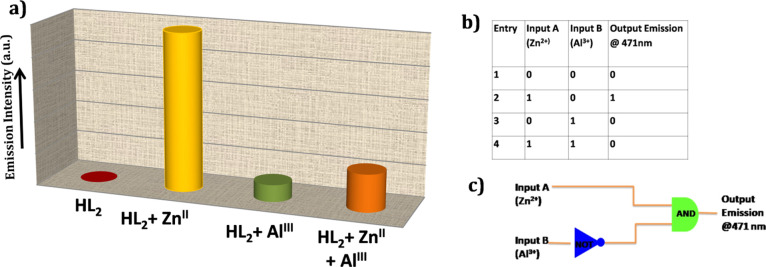
The photoluminescence experiment of the receptor HL2 forced us to investigate its behavior in numerous logic gates by successive addition of inputs like various cations such as Zn2+ and Al3+ and monitoring their photoluminescence changes at 471 nm as an output. HL2 has showed a much lower potential photoluminescence intensity than complex 2. Hence, here we investigated this experiment by considering the incremental photoluminescence properties of complex 2 and its quenching of emission intensity via sensing with Al3+. Inputs are contemplated as “1” in their presence and “0” in their absence. The results obtained by the instrument are considered as “1” when the emission intensity crosses the certain emission barrier (25% maximum of complex 2) and “0” when it failed to cross the emission barrier (Figure 6a). In the initial stage, in the absence of any inputs, no significant emission intensity was observed (ignoring the emission intensity of HL2) and is marked as “0” (off state). Addition of input A (Zn2+) to probe HL2 resulted in an output signal at 471 nm, marked as “1” (on state). With further addition of input B (Al3+), no significant output signal is obtained. Again, with the simultaneous addition of both inputs to probe HL2, no output signal is observed and is expressed as “0” (off state). It is observed that HL2 exhibits a high photoluminescence output signal in this experiment with addition of input A. Now, we envision the consideration of “AND” operation and “NOT” operation with input B. Thereafter, it is noticed that the photoluminescence intensity decreases when both the inputs were present in the probe, which suggests the off state by examining the truth table. It can be concluded that this investigation is related to an “INHIBIT” logic gate, which consists of a specific arrangement of logical functions “AND” and “NOT” (Figure 6b,c).
Figure 6.
(a) Emission intensity variation graph of receptor and complexes, (b) truth table for advance-level molecular logic gates, and (c) circuit diagram of logic construction.
Molecular Memory Devices
All of the information gathered from previous experimentation can further be congregated through successive logic circuits. These circuits hold the following response loop. In this memory device, one input is taken as the “memory element” by considering the output signal as an input. The memory device works on a binary logic gate function: either it will be “0” or “1,” alternatively the two crisp states. In the model that we have introduced here for the advancement of a significant mimicking of the memory element, we use Zn2+ and Al3+ designated as the set (S) and reset (R) inputs correspondingly and the photoluminescence was recorded at 524 nm as the output signal (Figure 7a). When Zn2+ acts as an input in this memory function, the device recognizes the binary state “1,” while under the reset situation Al3+ acts as an input. As a result, it is found that the device considered the binary state “0” (Figure 7b). Hence, it can be concluded that we have successfully constructed a consecutive logic circuit on the basis of the “Write–Read–Erase–Read” property. As a result, one can easily observe that by using the same solution of the complex, the write–erase cycles can be repeated many times without a significant decrease in the emission intensity. In summary, this system can be properly utilized in the technological field. Hence, molecular successive logic function circuits can be designed to show a comparable behavior with the logic devices of conventional semiconductors, and it can be expected that it can be a better technique for the construction of molecular microprocessors of integrated circuits. When Hg2+ is used instead of Al3+, the same result will be obtained.
Figure 7.
(a) Consecutive logic circuit of a memory unit and (b) schematic presentation of the reversible logic operation for the memory element with write–read–erase–read properties.
DNA-Binding Studies
In this section, the photophysical properties of complex 2 along with the sensing efficacy to different cations as a metalloreceptor have been discussed. Next, we evaluate these complexes with respect to their DNA interaction ability. Several spectroscopic techniques are used to establish the binding potentiality of the complexes with ctDNA as well as to identify the mode of interaction. Initially, the electronic absorption spectroscopic technique has been adopted to determine the binding constant of the ctDNA–complex moiety. The binding efficacy of complexes 1 and 2 with ctDNA was monitored using a UV spectrophotometer with regular addition of ctDNA (10–100 and 10–100 μM for complexes 1 and 2, respectively) in a fixed concentration of every complex (60 μM for complexes 1 and 2). To eliminate the absorbance of DNA, the total absorbance is recorded within the 300–400 nm region to understand the interaction of complexes with ctDNA. The change in the absorption of complexes 1 and 2 with an addition of incremental concentration of ctDNA is shown in Figure S11 in the Supporting Information. The absorption titration spectrum clearly indicates that complexes 1 and 2 show the absorption maxima at 374 and 335 nm, respectively, and after the addition of ctDNA, the absorption maxima gradually decreases along with a blue shift of 2–5 nm.49 The binding constant Kb of each complex is measured from the ratio of the slope to the intercept in plots [DNA]/εa – εf versus [DNA] using eq 1 (Experimental Section). The best fit of the experimental values for complexes 1 and 2 (using eq 1) is also represented in the inset of Figure S11 in the Supporting Information. The binding constant values of complexes 1 and 2 with ctDNA are 1.87 × 10⁵ M–1 and 3.4 × 10⁵ M–1, respectively, indicating a significant binding potential of complex 2 in comparison with complex 1. The partial intercalation of complex 2 inside the base pairs of DNA along with groove binding may be responsible for its relatively higher binding affinity, whereas complex 1 only showed groove binding with ctDNA due to its more hindered structure. This is elaborately discussed in the section molecular docking.
Ethidium Bromide (EB) Displacement Study
The electronic titration results clearly revealed the effective binding potentiality of the complexes with the ctDNA. To get a clear idea about the nature of bonding and also the binding power, EtBr displacement experiments have been carried out.50,51 Actually, ethidium bromide (EtBr = 3,8-diamino-5-ethyl-6-phenyl phenanthridinium bromide) exhibits strong orange fluorescence whenever it is exposed to ultraviolet radiation. The luminescence intensity of EtBr increases up to 20-fold in the presence of ctDNA due to the strong intercalation between the adjacent base pair of the DNA double helix.52 This can be attributed to the fact that the planar phenanthridine ring is ideally fitted in to the adjoining base pairs of the double helix. After addition of the complex to the EtBr–DNA domain, the complex displaces EtBr and as a result of which the fluorescence intensity decreases. This is the main technique used in this displacement study.50Figure S12 in the Supporting Information shows the emission spectra of the EtBr bonded with ctDNA in the absence and presence of complexes 1 and 2. It is to be noted that the emission spectra range between 500 and 700 nm with an excitation of 450 nm, and for complexes 1 and 2, the emission maxima are obtained at 618 and 623 nm, respectively. A remarkable decrease in the emission intensities is observed upon addition of incremental concentration of complexes 1 and 2 ( 8–80 μM for complex 1 and 8–80 μM for complex 2) separately to the EB–DNA adduct. This observation indicates that both the complexes have the ability to bind with ctDNA by replacing the fluorescence active dye EtBr. The quenching parameters were determined using the Stern–Volmer equation F0/F = Ksv[Q] + 1, as discussed in the previous section. The Ksv value can be calculated as the slope from the plot of F0/F versus [Q]. The quenching constants for complexes 1 and 2 are 6.17 × 10⁴ M–1 and 1.12 × 10⁵ M–1, respectively.
Furthermore, the apparent DNA-binding constants (Kapp) are measured using the equation KEtBr[EtBr] = Kapp[complex], where [complex] stands for the value at 50% decrease in the fluorescence intensity of EtBr, KEtBr (1.24 × 10⁷ M–1) represents the DNA-binding constant of EtBr, and [EtBr] is the concentration of EtBr (5 μM). The Kapp values are found to be 0.37 × 10⁵ M–1and 1.34 × 10⁵ M–1 for complexes 1 and 2, respectively. The quenching value and binding parameters force us to draw a concluding remark regarding the greater interaction of complex 2 with ctDNA than complex 1. This is due to the fact that complex 2 interacts with DNA through the minor groove in addition to partial intercalation, and this is the main reason behind the higher binding constant of complex 2 than complex 1.
DAPI Displacement Study
To determine the concrete support of minor groove-binding mode of the complexes with ctDNA, 4’,6-diamidino-2-phenylindole dihydrochloride (DAPI) displacement assay is performed. DAPI is a highly fluorescence active dye and a good minor binder to DNA.53 In this study, actually the fluorescence intensity changes are noted after the gradual addition of the complex to the DAPI–DNA adduct. The displacement of DAPI from DNA–DAPI adducts in the presence of a complex decreases the fluorescence intensity, and this is the main approach used for this displacement study. Figure S13 in the Supporting Information shows the emission spectral change of the DAPI–DNA domain in the absence and presence of complexes 1 and 2 (8–80 μM). It is to be noted that the emission spectra range between 450 and 535 nm with an excitation of 390 nm. An exceptional fluorescence quenching is observed after the addition of complex 1 to the DAPI–DNA adduct compared to the addition of complex 2 to the DAPI–DNA adduct.
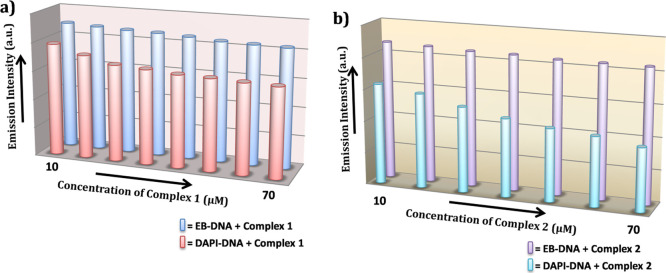
Figure 8 depicts a comparison of the fluorescence quenching of the EB–DNA and DAPI–DNA adduct after the addition of incremental concentration of complexes 1 and 2. The quenching constants measured using the Stern–Volmer equation for complexes 1 and 2 in the DAPI displacement study are 3.16 × 10⁵ M–1 and 1.62 × 10⁵ M–1, respectively. Based on the fluorescence quenching bar diagram as well as the quenching constant value (DAPI displacement), a conclusion can be drawn that complex 1 can bind with DNA via a pure groove-binding mode. However, in the case of complex 2, there is some partial intercalation along with groove binding as a result of which complex 2 shows a lower binding constant than 1 in the DAPI displacement study. This explanation is further highlighted in the section molecular docking.
Figure 8.
Fluorescence quenching of (a) EB–DNA and (b) DAPI–DNA adduct after the addition of incremental concentration (10–70 μM) of complexes 1 and 2
Circular Dichroism Study
After completion of fluorescence quenching experiments, the circular dichroism study was carried out to determine the minor groove-minding mode in the interaction of complexes 1 and 2 with ctDNA. The CD spectra of ctDNA in the presence and absence of the guest (complexes 1 and 2) are shown in Figure S14 in the Supporting Information. The figure clearly indicates that a positive lobe and a negative lobe appear at 278 and 248 nm for free DNA, respectively. These values reveal the presence of the canonical B form of DNA. After the addition of complexes 1 and 2 to DNA, very slight increases in the positive lobes occur. This indicates that after the addition of the guest to DNA, the canonical B form does not change during interactions. Actually, if the interaction phenomena of DNA and the guest occur via the minor groove-binding mode, then the canonical B form will remain more or less unchanged; however, in the positive zone, a very small peak will appear in the ≫ 300 nm region, and this is observed in the CD spectrum (Figure S14) after the addition of the complex to DNA.54,55 This new small peak appears due to the presence of the guest, which interacts with DNA via groove binding. In the CD spectrum, this type of new small peak appears in the region of 345–550 nm after the addition of each complex to DNA. This peak is more prominent in the spectrum of complex 1 than in that of complex 2, indicating pure groove binding in the case of complex 1.
Protein-Binding Study
From the foregoing discussion, we have achieved the first-step success in the biomedical application of the synthesized complexes, which is the effective binding efficacy of the complexes with ctDNA. HSA, the most abundant protein in plasma, is a monomeric multidomain macromolecule, representing the principal determinant of plasma oncotic pressure and the chief indicator of fluid distribution in between different body compartments, as it increases drug solubility in plasma, decreases toxicity, and protects from oxidation. Hence, as a next target, it is necessary to investigate the binding potential of complexes 1 and 2 with HSA. The interaction mechanism of HSA with the metal complex is the fundamental point to realize pharmacodynamics and pharmacokinetics. To understand the binding mechanism between complexes 1 and 2 with HSA, the electronic titration and fluorescence quenching experiments have been carried out.
Absorption Titration
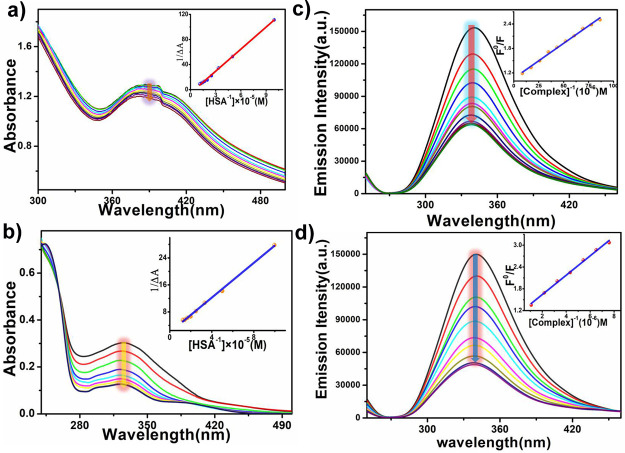
In this process, actually the change in the absorbance is recorded after the addition of incremental concentration of HSA to a fixed concentration of the complex. Prior to this, we have recorded the UV–vis spectra of complexes 1 and 2 in the Tris buffer medium at different time intervals (12, 24, 36, and 48 h), which ascertain the extensive stability of the two complexes in the working buffer medium (Figure S15 in the Supporting Information). The UV–vis spectral changes of complexes 1 and 2 with the addition of HSA are shown in Figure 9. From this experiment, it is noted that the peak maxima of the UV–vis spectral band (in tris buffer) appear at 330 nm and 385 nm, respectively, for complexes 1 and 2 ([complex 1] = 80 μM; [complex 2] = 80 μM), and the absorbance of complexes 1 and 2 is decreased with a blue shift (3 nm for complex 1 and 5 nm for complex 2) after gradual addition of HSA (2–16 μM and 2–20 μM for complexes 1 and 2, respectively). The apparent binding constants (Kapp) during the interaction of the compounds with HSA are measured by using eq 2 (Experimental Section). The association constants for complexes 1 and 2 are found to be 2.07 × 10⁵ M–1 and 1.926 × 10⁵ M–1, respectively. The binding constants indicate that both the complexes can effectively bind with HSA, but the binding constant is slightly higher for complex 1. This is clearly discussed in the molecular docking section.
Figure 9.
Absorption spectra of (a) complex 1 and (b) complex 2 after gradual addition of HSA at 300 K; change in the fluorescence of HSA (40 μM) upon gradual addition of (c) complex 1 and (d) complex 2 at 300 K.
Fluorometric Titration Study
HSA shows an inherent luminescence due to two chromophores, tryptophan (Trp) and tyrosine (Tyr). Under appropriate conditions, if tyrosine ionizes, then the emission intensity of HSA decreases, exhibiting the sole contribution of tryptophan. After analyzing the results obtained from the electronic titration profile, their interaction ability is checked using fluorometric analysis. In this procedure, the fluorescence intensity is recorded upon gradual addition of incremental concentration of complexes 1 and 2 to a fixed concentration of HSA. Impressively, a strong decrease in the emission maxima of HSA (40 μM) centered at 340 nm is observed after the addition of complex 1 (10–90 μM) and complex 2 (10–90 μM), adopting a concentration-dependent pathway (Figure 9). The titration profile is further utilized to measure the quenching constant value using the Stern–Volmer equation. The quenching constants for complexes 1 and 2 are found to be 2.1 × 10⁵ M–1 and 1.4 × 10⁵ M–1, respectively, which indicates the interaction ability of HSA with the two complexes. However, we have also calculated the bimolecular quenching rate constant (Kq) of HSA for both the complexes using the equation KSV=Kq × τ0, where τ0 stands for the average decay lifetime of HSA in the absence of a quencher.56 The Kq values are found to be 3.91 × 10¹³ M–1S–1 and 2.60 × 10¹³ M–1S–1 for complexes 1 and 2, respectively. During the quenching procedure, the titration pictograph clearly showed that a hypsochromic shift is observed in both the cases. This could be explained as a result of the association of the complexes with the Trp residue of HSA mainly in the hydrophobic domain. The higher binding efficacy of complex 1 to HSA is clearly explained in the molecular docking section.
Molecular Docking Study
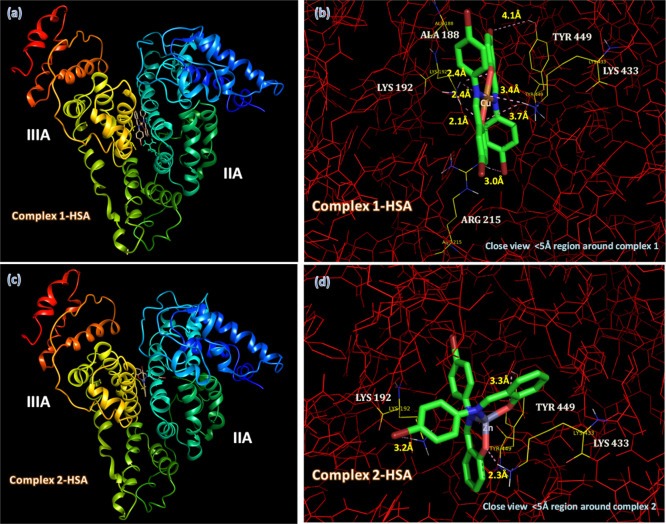
Computer-aided docking techniques are very useful to measure the binding efficacy and identify the binding location of biologically active drug molecules in macromolecules. The mechanistic study of this binding procedure to determine the active sites of the targeted macromolecules is very essential to render biologically active drug molecules as therapeutic agents.57,58 In this perspective, after successful experimental studies with HSA and ctDNA of our synthesized complex 1 and complex 2, their active binding sites and binding locations have been interpreted theoretically. The docking space gives a chance to dock the whole binding sites of HSA and ctDNA molecules individually while generating the binding location with complexes 1 and 2. In the perspective of HSA, mostly targeted molecules prefer the binding location either Sudlow site I (subdomain IIA) or Sudlow site II (sub-domain IIIA), depending on the nature of the functional groups.59,60 In our complexes, from Figure 10a,c it can be seen that both complexes 1 and 2 are buried inside the deep hydrophobic cavity between the protein subdomains IIA and IIIA and below IB. The most reasonable approach to represent the HSA–metal complex interaction is only through the residues in the 5 Å range around complexes 1 and 2, which are shown in Figure 10b,d. The attachment of complex 1 surrounded by the residues ALA-188, LYS-192, ARG-215, LYS-433, and TYR-449 is through five strong hydrogen bonds (3 H-bonds 2.4, 2.4, and 2.1 Å with LYS-192; 1 H-bond 3.0 Å with ARG-215; and 1 H-bond 3.4 Å with LYS-433) and two weak hydrogen bonds (1 H-bond 3.7 Å with LYS-433 and 1 H-bond 4.1 Å with TYR-449). However, binding residues present around complex 2 are LYS-192, LYS-433, and TYR-449 through three strong H bonds (1 H-bond 3.2 Å with LYS-192; 1 H-bond 2.3 Å with LYS-433; and 1 H-bond 3.3 Å with TYR-449). These H-bonding and van der Waals force of interaction play a major role in the binding affinity of the complexes inside the HSA domain. From the above investigated docking results, one can easily interpret that complex 1 binds more strongly with HSA than complex 2, and the respective docked binding energy values obviously follow similar trends, as shown in Table S3 (Supporting Information). The binding energy for the complex 1–HSA adduct is −8.96 kcal/mol higher than that of the complex 2–HSA adduct, having energy −8.29 kcal/mol. These theoretical findings are in agreement with UV–vis experimental results.
Figure 10.
Minimum energy docked pose of (a) complex 1 and (c) complex 2 with close view around complexes within HSA (b,d).
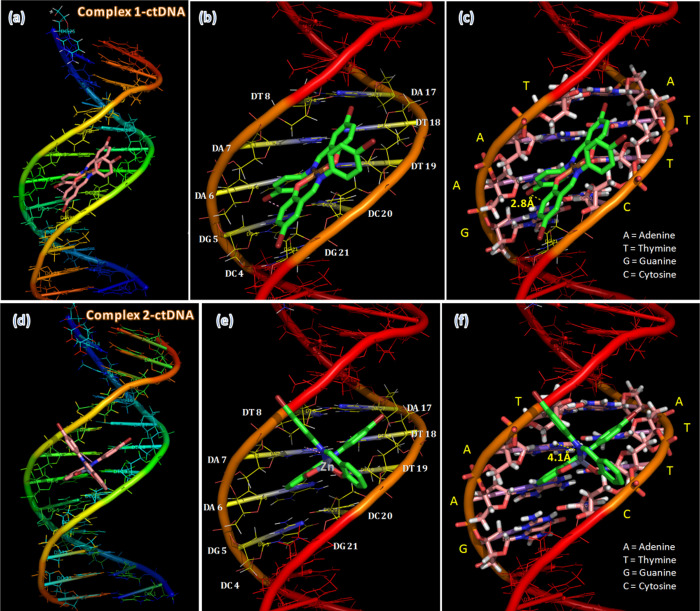
In the case of ctDNA–metal complexes, both complexes 1 and 2 are well fitted preferentially in the A–T-rich region of ctDNA, as shown in Figure 11. The docking results reveal that the binding positions of the metal complexes are within three A–T base pairs (DT8–DA17 to DA6–DT19) and one G–C pair (DG5-DC20). From the docked structure, it is interesting to see that complex 2 has the ability to entrap in the groove and slide between A and T base pairs as partial intercalation (Figure 11d–f). In this partial intercalation, the planar heterocyclic portion of complex 2 is present between adenine and thymine base pairs, whereas the remaining perpendicular part is extended in the minor groove of ctDNA. Alternatively, complex 1 manages to fit around the minor groove of DNA only. Decreasing the spatial hindrance around the sliding moiety increases the intercalative ability of complex 2 compared to that of complex 1. From the binding energy values (−5.96 kcal/mol for complex 2 and −5.61 kcal/mol for complex 1), there is a clear reflection of the spatial hindrance effect, indicating that the partial intercalating complex 2 has greater binding energy than complex 1, which has groove-binding ability.
Figure 11.
Docking orientations of (a–c) complex 1 and (d–f) complex 2 in ctDNA.
It can be noticed that complex binding is stabilized through H-bonding with adenine bases (2.8 Å for complex 1 and 4.1 Å for complex 2) and van der Waals interactions with the functional groups.
In partial intercalation, the gap between base pairs is slightly increased during the partial tilting60 of complex 2, and this orientation favored the possibility of strong van der Waals interaction in comparison with only the minor groove-binding complex 1.
The experimental results of UV–vis analysis is completely in agreement with the computational modeling results. Ligand efficiency and intermolecular energies are also tabulated in Table S2 in the Supporting Information, and they show the trends similar to binding energy. Therefore, from the above discussion on computational modeling, one can understand that Cu-based complex 1 has a high binding efficiency with HSA having strong H-bonding compared to Zn-based complex 2. In contrast, ctDNA favors less hindrance complex 2 through partial intercalation in A–T-rich base pairs compared to complex 1.
Conclusions
In summary, the treatment of bromoaniline with salicylaldehyde and 5-bromo salicylaldehyde leads to the formation of two fluorescence active Schiff base probe (E)-4-bromo-2-(((4-bromophenyl)imino)methyl)phenol (HL1) and (E)-2-(((4-bromophenyl)imino)methyl)phenol (HL2), having specific sensing ability toward Cu2+ and Zn2+ ions, respectively, through turn-off and turn-on fluorescence spectral changes. The electronic titration method reveals the high binding constant of the aforementioned metal ions with HL1 and HL2, which is in agreement with the formation of two new complexes, namely, [Cu(L1)2] (1) and [Zn(L2)2] (2). The sensing ability of complex 2 as a metalloreceptor for Al3+ and Hg2+ ions was tested by using fluorometric and electronic spectral titrations. DFT calculations have also been carried out to investigate the possible association of the mentioned analytes with complex 2. Furthermore, the two-step sensing phenomenon was utilized to formulate an INHIBIT logic circuit, which is additionally extended to construct a molecular memory device. Knowing the ability of the fluorometric method to determine the association of complexes with biomacromolecules, the binding efficacies of these two complexes with DNA and HSA are examined. On the basis of numerous spectroscopic investigations, it can be concluded that complex 2 has a higher binding potential toward DNA, whereas complex 1 shows better affinity toward HSA protein. Theoretical calculations and molecular docking studies have finally been performed to obtain a better view of the interaction region of the macromolecules with the newly developed complexes (1 and 2).
Experimental Section
Materials and Physical Measurements
All reagents and solvents used in this synthesis were commercially available. Reagent-grade chemicals were used in this experiment. Hence, no further purification was needed. Salicylaldehyde, 5-bromo salicylaldehyde, 4-bromo aniline, ctDNA, HSA, EB, and DAPI were obtained from Sigma-Aldrich Chemicals. CuCl2, ZnCl2, and triethyl amine (Et3N) were purchased from Merck. Elemental analyses were performed using a PerkinElmer 240C elemental analyzer. Electronic absorption spectral data were collected by using a PerkinElmer UV–vis Lambda 365 spectrophotometer at room temperature. The concentration of ctDNA per nucleotide was determined by absorption spectroscopy using a molar extinction coefficient (€) 6600 (M–1 cm–1) at 260 nm. ctDNA interaction studies were performed in a citrate-phosphate (CP) buffer of 10 mM [Na+] at pH 7.40 containing 0.5 mM Na2HPO4, and HSA interaction studies were performed in Tris buffer.
Caution! Mercury salts are extremely toxic, so proper caution should be taken before use.
Synthesis of Ligands HL1 and HL2
The ligands HL1 and HL2 were prepared by the condensation reaction of the corresponding amine and aldehydes following the literature method61 and were exploited as sensors for the first time. Methanol was used as solvent during synthesis. 1H NMR [HL1, CDCl3, 25 ° C]: δ = 6.630–7.524 (m, 7H), 8.604 (s, 1H), 12.988 (s, 1H); 13C NMR [HL1, CDCl3, 25 ° C]: δ = 161.622 (Ar-C-O), 160.117 (HC=N), 147.042 (Ar–C–N), 135.714 (C, Ar–C), 133.435 (2C, Ar–C), 132.704 (Ar–C), 122.912 (2C, Ar), 121.033 (Ar–C), 120.006 (Ar–C), 119.515 (Ar–C), 110.800 (Ar–C).
1H NMR [HL2, CDCl3, 25 ° C]: δ = 6.951–7.403 (m, 8H), 8.653 (s, 1H), 13.135 (s, 1H); 13C NMR [HL2, CDCl3, 25 ° C]: δ = 163.092 (Ar–C–O), 161.117 (HC=N), 147.524 (Ar–C–N), 133.481 (2C, Ar–C), 132.586 (Ar–C), 132.500 (Ar–C), 122.903 (2C, Ar), 120.467 (Ar–C), 119.306 (Ar–C), 119.030 (Ar–C), 117.422 (Ar–C).
Synthesis of [Cu(L1)2] (1)
CuCl2 (0.119 g, 0.7 mmol) was dissolved in methanol (30 mL) and was added to 25 mL methanolic solution of the HL1 ligand (0.248 g, 0.7 mmol) under continuous stirring conditions. The resulting solution was then refluxed for additional 3 h. The green colored solution formed was filtered, and from the filtrate single crystals were obtained within 1 day. Yield 0.462 g (75%).
Anal. Calc.: For C26H16Br4CuN2O2 (771.56): C 40.43; H 2.07; N 3.62%. Found: C 40.39; H 2.10; N, 3.47%, UV: 373 (ε, 9600 CT spectra), 568 (ε, 371 d–d transition). IR: ν (C=N) 1636 cm–1; ν (skeletal vibration) 1572 cm–1.
Synthesis of [Zn(L2)] (2)
Complex 2 was synthesized by adopting exactly the same method used for the preparation of complex 1. In case of complex 2, ZnCl2 (0.095 g, 0.7 mmol) was dissolved in methanol and added to the HL2 solution and by adopting the same method single crystals were obtained. Yield 0.356 g (72%).
Anal. Calc.: For C26H18Br2ZnN2O2 (615.61): C 50.68; H 2.92; N 4.54%. Found: C 50.62; H 2.88; N 4.53%, UV: 401 (ε, 7600 CT spectra), IR: ν (C=N) 1634 cm–1; ν (skeletal vibration) 1576 cm–1.
Sample Preparation for Fluorescence and UV Spectral Studies
The stock solutions of HL1, HL2, and complex 2 (3 × 10⁻² M) were prepared in DMSO/H2O (9:1) HEPES buffer medium, and the stock solution of various metal ions (5 × 10⁻³ M) were prepared in the same medium by using their chloride salts.
X-ray Crystal Structure Determination
Single-crystal X-ray diffraction data of the two complexes were collected using a Bruker APEX-II CCD diffractometer equipped with graphite monochromated MoKα radiation. Data reduction and structure solution refinement were carried out using APEX II.62,63 The structures of complexes 1 and 2 were solved by the direct method and refined in a routine procedure. All hydrogen atoms were refined isotropically where the nonhydrogen atoms are treated anisotropically. The summary of the crystal data and other structure refinement parameters are provided in Table 2. Complexes 1 and 2, CCDC 2006526, 2006525, contain the supplementary crystallographic data for this paper.
Table 2. Crystallographic Data and Refinement Parameters of Complexes 1 and 2.
| 1 | 2 | |
|---|---|---|
| CCDC number | 2006526 | 2006525 |
| empirical formula | C26H16Br4CuN2O2 | C26H18Br2ZnN2O2 |
| fw | 771.56 | 615.61 |
| crystal size/mm | 0.21 × 0.16 × 0.09 | 0.17 × 0.12 × 0.089 |
| crystal system | monoclinic | monoclinic |
| space group | P21/c | C2/c |
| a/Å | 9.8183(6) | 21.738(3) |
| b/Å | 10.6368(5) | 9.0322(14) |
| c/Å | 12.0379(6) | 11.8880(18) |
| α/° | 90 | 90 |
| β/° | 100.785(2) | 96.105(7) |
| γ/° | 90 | 90 |
| V/Å3 | 1234.98(11) | 2320.9(6) |
| Dcalcd/g cm–3 | 2.075 | 1.762 |
| Z | 2 | 4 |
| F(000) | 742 | 1216.0 |
| μ/mm–1Mo Kα radiation | 7.384λ =0.71073 Å | 4.528λ =0.71073 Å |
| T/K | 296(2) | 296(2) |
| Rint | 0.0618 | 0.0721 |
| range of h,k,l | –12/11,-13/11,-15/15 | –30/30,-12/12,-16/16 |
| θmin/max/° | 3.120/27.127 | 2.444/ 30.414 |
| reflections collected/unique/observed [I > 2σ(I)] | 7951/ 2683/2091 | 28,329/ 3503/ 2552 |
| data/restraints/parameters | 2683/0/160 | 3503/0/152 |
| GOF on F2 | 1.047 | 1.065 |
| finalRindices[I > 2σ(I)] | R1 = 0.0538wR2 = 0.1390 | R1 = 0.0503wR2 = 0.1574 |
| Rindices(all data) | R1 = 0.0713wR2 = 0.1498 | R1 = 0.0717wR2 = 0.1726 |
Computational Details
The energies of the optimized geometries of complex 2 and the Zn–Al bimetal complex were determined in the gas phase. For free and oxidized ligands, the solvent environment was determined by the DFT method with the Becke, three-parameter, Lee–Yang–Parr (B3LYP)64,65 hybrid functional for exchange correlation and SDD66 in the form of a basis set. To study the UV–vis spectral properties in detail, we have computed the major transitions by adopting the TD-DFT methodology using the CAM-B3LYP/SDD level of theory in DMSO solvent. The polarizable continuum model (PCM) has been used to account for the solvent effect. All of the calculations were performed using Gaussian 098367 and GaussSum68 software.
ctDNA/HSA Interaction Studies
Absorption Spectral Titrations
For the absorption spectral titration study, a fixed concentration of the metal complex was treated with an incremental concentration of ctDNA/HSA. The binding constant (K) for the association of complexes with ctDNA was calculated using eq 1,69
| 1 |
where [DNA] stands for the concentration of ctDNA in the base pairs, εa represents the apparent absorption coefficient corresponding to Aobs/[complex 1, 2], εf is the extinction coefficient of the free complex, and εb is the extinction coefficient of the complex, fully bound to ctDNA. The intrinsic binding constant K could be calculated from the ratio of the slope to the intercept by using the graph of [DNA]/(εa – εf) vs [DNA].
At the same time, considering an equilibrium binding system, a quantitative assessment of the association of HSA was realized by determining the equilibrium constant for complex formation adopting the double reciprocal equation (eq 2),70
| 2 |
Where ε represents the extinction coefficient, the subscripts b, f, and T stand for the bound, free, and total complex concentrations. L represents the metal complex concentration, M is the concentration of the macromolecule (HSA), and ΔA stands for the absorbance change at a given wavelength. The association constant for complex formation (Ka) can be evaluated from the ratio of the intercept.
Fluorescence Spectral Studies
EB was used for the displacement assay study to understand the competitive binding ability of the two complexes with ctDNA. The fluorescence intensities were noted after incremental addition of every complex solution to the ctDNA–EB adduct separately.
For proper identification of the interaction mode, DAPI displacement assay was also performed. In this case, the change in the fluorescence intensity of the DAPI–ctDNA moiety was recorded after incremental addition of each complex solution into the ctDNA–DAPI adduct.
In the case of HSA protein, fluorescence titration was monitored within the region of 250–450 nm upon excitation at 240 nm. In this study, after gradual addition of complexes 1 and 2 separately into the HSA solution, an impressive decrease in the emission intensity was noted.
Circular Dichroism Study
CD titration was carried out after the addition of incremental concentrations of complexes 1 and 2 to a fixed concentration of DNA (60 μM). The molar ellipticity values [θ] were measured by using the equation [θ] = 100 × θ/(C × l), where θ stands for the observed ellipticity in milli degrees, C represents the concentration in mol/L, and l refers to the cell path length of the cuvette in cm. The molar ellipticity [θ] (deg.cm–2/dmol) results are presented in terms of base pairs within the region of 200–400 nm.71,72
Molecular Docking
The crystal structures of Cu-based complex 1 and Zn-based complex 2 were used as received from the crystallographic data for the input file of Auto Dock 4.2 software.73 Macromolecular crystal structures of HSA and ctDNA were used as obtained from the Protein Data Bank (PDB) identifier 1UOR and 1COC, respectively.74 Polar hydrogen and Gasteiger charges were added as required. For grid preparation, all domains of the HSA structure were kept under inspection. In ctDNA, the grid was maintained in such a way that the A–T and G–C bases were emphasized equally. Among 20 several docked structures in each category of the complex-macromolecular adduct, a minimum energy conformer was taken for further analysis. Other docking parameters were kept as default, as obtained by software programming. The docked files from Auto Dock were finally analyzed using the PyMOL and Chimera software package.75
Acknowledgments
The authors are thankful to “West Bengal DST” for the financial assistance through the scheme Gabesanay Bangla. S.M. acknowledges CSIR India for research fellowship (CSIR Grant No. 09/028(1009)/2017-EMR-I). S.S.M. gratefully acknowledges the SERB for grant in project (Project Number TAR/2019/000030). T.M. is thankful to the authority, P.K. College, Contai, for their constant help and support. The authors sincerely acknowledge Prof. Debasis Das, Department of Chemistry, University of Calcutta, for the beneficial scientific discussion.
Supporting Information Available
The Supporting Information is available free of charge at https://pubs.acs.org/doi/10.1021/acsomega.0c05189.
Author Present Address
The current affiliation of S. S. M. associated with this work is Department of Chemistry, Government General Degree College, Keshiary, India, which differs from his previous affiliation.
The authors declare no competing financial interest.
Supplementary Material
References
- Wu D.; Sedgwick A. C.; Gunnlaugsson T.; Akkaya E. U.; Yoonand J.; James T. D. Fluorescent Chemosensors: The Past, Present and Future. Chem. Soc. Rev. 2017, 46, 7105–7123. 10.1039/C7CS00240H. [DOI] [PubMed] [Google Scholar]
- He L.; Dong B.; Liuand Y.; Lin W. Fluorescent chemosensors manipulated by dual/triple interplaying sensing mechanisms. Chem. Soc. Rev. 2016, 45, 6449–6461. 10.1039/C6CS00413J. [DOI] [PubMed] [Google Scholar]
- Gupta A.; Kumar N. A review of mechanisms for fluorescent “turn-on” probes to detect Al3+ ions. RSC Adv. 2016, 6, 106413–106434. 10.1039/C6RA23682K. [DOI] [Google Scholar]
- Saleem M.; Lee K. H. Optical sensor: a promising strategy for environmental and biomedical monitoring of ionic species. RSC Adv. 2015, 5, 72150–72287. 10.1039/C5RA11388A. [DOI] [Google Scholar]
- Ensafi A. A.; Khayamian T.; Benvidi A.; Mirmomtaz E. Simultaneous determination of copper, lead and cadmium by cathodic adsorptive strippingvoltammetry using artificial neural network. Anal. Chim. Acta 2006, 561, 225–232. 10.1016/j.aca.2006.01.015. [DOI] [Google Scholar]
- Tong A.; Akama Y.; Tanaka S. Pre-concentration of copper, cobalt and nickel with 3-methyl-1-phenyl-4-stearoyl-5-pyrazolone loaded on silica gel. Analyst 1990, 115, 947–949. 10.1039/an9901500947. [DOI] [Google Scholar]
- Rao G. P. C.; Seshaiah K.; Rao Y. K.; Wang M. C. Solid Phase Extraction of Cd, Cu, and Ni from Leafy Vegetables and Plant Leaves Using Amberlite XAD-2 Functionalized with 2-Hydroxy-acetophenone-thiosemicarbazone (HAPTSC) and Determination by Inductively Coupled Plasma Atomic Emission Spectroscopy. J. Agric. Food Chem. 2006, 54, 2868–2872. 10.1021/jf0600049. [DOI] [PubMed] [Google Scholar]
- Zhang X. Q.; Gao Y. F.; Liu H. T.; Liu Z. L. Fabrication of porous metal–organic frameworks via a mixed-ligand strategy for highly selective and efficient dye adsorption in aqueous solution. CrystEngComm 2015, 17, 6037–6043. 10.1039/C5CE00862J. [DOI] [Google Scholar]
- Banerjee K.; Roy S.; Kotal M.; Biradha K. Coordination Polymers Containing Tubular, Layered, and Diamondoid Networks: Redox, Luminescence, and Electron Paramagnetic Resonance Activities. Cryst. Growth Des. 2015, 15, 5604–5613. 10.1021/acs.cgd.5b01329. [DOI] [Google Scholar]
- Guang L.; Hupp J. T. Metal–Organic Frameworks as Sensors: A ZIF-8 Based Fabry–Pérot Device as a Selective Sensor for Chemical Vapors and Gases. J. Am. Chem. Soc. 2010, 132, 7832–7833. 10.1021/ja101415b. [DOI] [PubMed] [Google Scholar]
- Maity D.; Govindaraju T. Naphthaldehyde–Urea/Thiourea Conjugates as Turn-On Fluorescent Probes for Al3+ Based on Restricted C=N Isomerization. Eur. J. Inorg. Chem. 2011, 2011, 5479–5485. 10.1002/ejic.201100772. [DOI] [Google Scholar]
- Pu S.; Zhang C.; Fan C.; Liu G. Multi-controllable properties of an antipyrine-based diarylethene and its high selectivity for recognition of Al3+. Dyes Pigm. 2016, 129, 24–33. 10.1016/j.dyepig.2016.02.001. [DOI] [Google Scholar]
- Halder S.; Mondal J.; Ortega-Castro J.; Frontera A.; Roy P. A Ni-Based MOF for Selective Detection and Removal of Hg2+ in Aqueous Medium: A Facile Strategy. Dalton Trans. 2017, 46, 1943–1950. 10.1039/C6DT04722J. [DOI] [PubMed] [Google Scholar]
- Fasman G. D. Aluminum and Alzheimer’s disease: model studies. Coord. Chem. Rev. 1996, 149, 125–165. 10.1016/S0010-8545(96)90020-X. [DOI] [Google Scholar]
- Flaten T. P. Aluminium as a risk factor in Alzheimer’s disease, with emphasis on drinking water. Brain Res. Bull. 2001, 55, 187–196. 10.1016/S0361-9230(01)00459-2. [DOI] [PubMed] [Google Scholar]
- Walton J. R. Aluminum in hippocampal neurons from humans with Alzheimer’s disease. Neurotoxicology 2006, 27, 385–394. 10.1016/j.neuro.2005.11.007. [DOI] [PubMed] [Google Scholar]
- Nayak P. Aluminum: Impacts and Disease. Environ. Res. 2002, 89, 101–115. 10.1006/enrs.2002.4352. [DOI] [PubMed] [Google Scholar]
- Hao E.; Meng T.; Zhang M.; Pang W.; Zhou Y.; Jiao L. Solvent Dependent Fluorescent Properties of a 1,2,3-Triazole Linked 8-Hydroxyquinoline Chemosensor: Tunable Detection from Zinc(II) to Iron(III) in the CH3CN/H2O System. J. Phys. Chem. A. 2011, 115, 8234–8241. 10.1021/jp202700s. [DOI] [PubMed] [Google Scholar]
- Yang Y.; Zhao Q.; Feng W.; Li F. Y. Luminescent Chemodosimeters for Bioimaging. Chem. Rev. 2012, 113, 192–270. 10.1021/cr2004103. [DOI] [PubMed] [Google Scholar]
- Xie H.; Yu C.; Huang Y.; Xu H.; Zhang Q.; Sun X.; Feng X.; Redshaw C. A turn-off fluorescent probe for the detection of Cu2+ based on a tetraphenylethylenefunctionalized salicylaldehyde Schiff-base. Mater. Chem. Front. 2020, 4, 1500–1506. 10.1039/C9QM00759H. [DOI] [Google Scholar]
- Lv F.; Feng X.; Tang H.; Liu L.; Yang Q.; Wang S. Visual detection of copper ions based on azide- and alkyne-functionalized polydiacetylene vesicles. Adv. Funct. Mater. 2011, 21, 845–850. 10.1002/adfm.201001738. [DOI] [Google Scholar]
- Xue L.; Liu C.; Jiang H. A ratiometric fluorescent sensor with a large Stokes shift for imaging zinc ions in living cells. Chem. Commun. 2009, 9, 1061–1063. [DOI] [PubMed] [Google Scholar]
- Liu Y.; Zhang N.; Chen Y.; Wang L. H. Fluorescence Sensing and Binding Behavior of Aminobenzenesulfonamidoquinolino-β-cyclodextrin to Zn2+. Org. Lett. 2007, 9, 315–318. 10.1021/ol062816w. [DOI] [PubMed] [Google Scholar]
- Michaels H. A.; Murphy C. S.; Clark R. J.; Davidson M. W.; Zhu L. 2-Anthryltriazolyl-containing multidentate ligands: zinc-coordination mediated photophysical processes and potential in live-cell imaging applications. Inorg. Chem. 2010, 49, 4278–4287. 10.1021/ic100145e. [DOI] [PubMed] [Google Scholar]
- Jin H. K.; Jin Y. N.; Hwang I. H.; Kang J.; Kim J.; Kim C. A highly selective “turn-on” fluorescent sensor for zinc ion based on a cinnamyl pyrazoline derivative and its imaging in live cells. Tetrahedron Lett. 2018, 10, 1833–1841. 10.1039/C8AY00037A. [DOI] [Google Scholar]
- Maity D.; Govindaraju T. A differentially selective sensor with fluorescence turn-on response to Zn2+ and dual-mode ratiometric response to Al3+ in aqueous media. Chem. Commun. 2012, 48, 1039–1041. 10.1039/C1CC16064H. [DOI] [PubMed] [Google Scholar]
- Andrews N. C. Metal transporters and disease. Curr. Opin. Chem. Biol. 2002, 6, 181–186. 10.1016/S1367-5931(02)00307-1. [DOI] [PubMed] [Google Scholar]
- Chen J.; Ying G. G.; Deng W. J. Antibiotic Residues in Food: Extraction, Analysis, and Human Health Concerns. J. Agric. Food Chem. 2019, 67, 7569–7586. 10.1021/acs.jafc.9b01334. [DOI] [PubMed] [Google Scholar]
- Prohaska J. R. Impact of copper limitation on expression and function of multicopper oxidases (ferroxidases). Adv. Nutr. 2011, 2, 89–95. 10.3945/an.110.000208. [DOI] [PMC free article] [PubMed] [Google Scholar]
- Linder M. C.; Hazegh-Azam M. Copper Biochemistry and Molecular Biology. Am. J. Clin. Nutr. 1996, 63, 797S–811S. [DOI] [PubMed] [Google Scholar]
- Berg J. M.; Shi Y. The galvanization of biology: a growing appreciation for the roles of zinc. Science 1996, 271, 1081–1085. 10.1126/science.271.5252.1081. [DOI] [PubMed] [Google Scholar]
- Frederickson C. J. Neurobiology of zinc and zinc-containing neurons. Rev. Neurobio. 1989, 31, 145–238. 10.1016/S0074-7742(08)60279-2. [DOI] [PubMed] [Google Scholar]
- Xie X.; Smart T. G. A physiological role for endogenous zinc in rat hippocampal synaptic neurotransmission. Nature 1991, 349, 521–524. 10.1038/349521a0. [DOI] [PubMed] [Google Scholar]
- Narayanaswamy N.; Govindaraju T. Aldazine-based colorimetric sensors for Cu2+ and Fe3+. Sens Actuators. B 2012, 161, 304–310. 10.1016/j.snb.2011.10.036. [DOI] [Google Scholar]
- Buck K. N.; Ross J. R. M.; Flegal A. R.; Bruland K. W. A review of total dissolved copper and its chemical speciation in San Francisco Bay. California Environ. Res. 2007, 105, 5–19. 10.1016/j.envres.2006.07.006. [DOI] [PubMed] [Google Scholar]
- Winston C. T.; Dale L. B. A Fluorescent Intercalator Displacement Assay for Establishing DNA Binding Selectivity and Affinity. Inorg. Chem. 2004, 37, 61–69. [DOI] [PubMed] [Google Scholar]
- Sahabadi N.; Mahammadi S. Synthesis Characterization and DNA Interaction Studies of a New Zn(II) Complex Containing Different Dinitrogen Aromatic Ligands. Bioinorg. Chem. Appl. 2012, 2012, 1–8. 10.1155/2012/571913. [DOI] [PMC free article] [PubMed] [Google Scholar]
- Chandra S.; Jain D.; Sharma A. K.; Sharma P. Coordination Modes of a Schiff Base Pentadentate Derivative of 4-Aminoantipyrine with Cobalt(II), Nickel(II) and Copper(II) Metal Ions: Synthesis, Spectroscopic and Antimicrobial Studies. Molecule 2009, 14, 174–190. 10.3390/molecules14010174. [DOI] [PMC free article] [PubMed] [Google Scholar]
- Zhou C.-Y.; Zhao J.; Wu Y.; Yin C.-X.; Yang P. Synthesis, characterization and studies on DNA-binding of a new Cu(II) complex with N1,N8-bis(l-methyl-4-nitropyrrole-2-carbonyl)triethylenetetramine. J. Inorg. Biochem. 2007, 101, 10–18. 10.1016/j.jinorgbio.2006.07.011. [DOI] [PubMed] [Google Scholar]
- Sendzik M.; Pushie M. J.; Stefaniak E.; Haas K. L. Structure and Affinity of Cu(I) Bound to Human Serum Albumin. Inorg. Chem. 2017, 56, 15057–15065. 10.1021/acs.inorgchem.7b02397. [DOI] [PubMed] [Google Scholar]
- Kabeer H.; Hanif H.; Arsalan A.; Asmat S.; Younus H.; Sakir M. Structural-Dependent N,O-Donor Imine-Appended Cu(II)/Zn(II) Complexes: Synthesis, Spectral, and in Vitro Pharmacological Assessment. ACS Omega 2020, 5, 1229–1245. 10.1021/acsomega.9b03762. [DOI] [PMC free article] [PubMed] [Google Scholar]
- Yinhua D.; Foroughi M. M.; Aramesh-Boroujeni Z.; Jahani Z.; Peydayesh M.; Borhani F.; Khatami M.; Rohani M.; Dusek M.; Eigner V. The synthesis, characterization, DNA/BSA/HSA interactions, molecular modeling, antibacterial properties, and in vitro cytotoxic activities of novel parent and niosome nano-encapsulated Ho(iii) complexes. RSC Adv. 2020, 10, 22891–22908. 10.1039/D0RA03436C. [DOI] [PMC free article] [PubMed] [Google Scholar]
- Solaiman H.; Leena A.; Suad A.; Yaser T.; Rabah I.; Nail S. Antipathogenic Effect of Structurally Related Schiff Base Derivatives: Structure Activity Relationship. Arabian J. Chem. 2015, 8, 828–836. [Google Scholar]
- Lee H.; Reibenspies H.; Hancock R. T. D. Mechanism of “Turn-on” Fluorescent Sensors for Mercury(II) in Solution and Its Implications for Ligand Design. Inorg. Chem. 2012, 51, 10904–10915. 10.1021/ic301380w. [DOI] [PubMed] [Google Scholar]
- Arjmand F.; Jamsheera A.; Mahapatra D. K. Synthesis, characterization and in vitro DNA binding and cleavage studies of Cu(II)/Zn(II) dipeptide complexes. J. Photochem. Photobiol. B 2013, 121, 75–85. 10.1016/j.jphotobiol.2012.12.009. [DOI] [PubMed] [Google Scholar]
- Baguley B. C.; Le Bret M. Quenching of DNA-ethidium fluorescence by amsacrine and other antitumor agents: a possible electron-transfer effect. Biochemistry 2002, 23, 937–943. 10.1021/bi00300a022. [DOI] [PubMed] [Google Scholar]
- Yanai T.; Tew D. P.; Handy N. C. A new hybrid exchange–correlation functional using the Coulomb-attenuating method (CAM-B3LYP). Chem. Phys. Lett. 2004, 393, 51–57. 10.1016/j.cplett.2004.06.011. [DOI] [Google Scholar]
- Kobayashi R.; Amos R. D. The application of CAM-B3LYP to the charge-transfer band problem of the zincbacteriochlorin–bacteriochlorin complex. Chem. Phys. Lett. 2006, 420, 106–109. 10.1016/j.cplett.2005.12.040. [DOI] [Google Scholar]
- Boger D. L.; Fink B. E.; Brunette S. R.; Tse W. C.; Hedrick M. P. A simple, high-resolution method for establishing DNA binding affinity and sequence selectivity. J. Am. Chem. Soc. 2001, 123, 5878–5891. 10.1021/ja010041a. [DOI] [PubMed] [Google Scholar]
- Lepecq J. B.; Paoletti C. A fluorescent complex between ethidium bromide and nucleic acids Physical-chemical characterization. J. Mol. Biol. 1967, 27, 87–106. 10.1016/0022-2836(67)90353-1. [DOI] [PubMed] [Google Scholar]
- Morgan A. R.; Lee J. S.; Pulleyblank D. E.; Murray N. L.; Evans D. H. Review: ethidium fluorescence assays. Part 1. Physicochemical studies. Nucleic Acids Res. 1979, 7, 547–565. 10.1093/nar/7.3.547. [DOI] [PMC free article] [PubMed] [Google Scholar]
- Zaitsev E. N.; Kowalczykowski S. C. Binding of double-stranded DNA by Escherichia coli Rec A protein monitored by a fluorescent dye displacement assay. Nucleic Acids Res. 1998, 26, 650–654. 10.1093/nar/26.2.650. [DOI] [PMC free article] [PubMed] [Google Scholar]
- Errikson S.; Kim S. K.; Kubista M.; Norden B. Binding of 4′,6-diamidino-2-phenylindole (DAPI) to AT regions of DNA: Evidence for an allosteric conformational change. Biochemistry 2002, 32, 2987–2998. 10.1021/bi00063a009. [DOI] [PubMed] [Google Scholar]
- List N. H.; Knoops J. M.; Rubio-Magnieto J.; Ide J.; Beljonne D.; Norman P.; Surin M.; Linares M. Origin of DNA-Induced Circular Dichroism in a Minor-Groove Binder. J. Am. Chem. Soc. 2017, 139, 14947–14953. 10.1021/jacs.7b05994. [DOI] [PubMed] [Google Scholar]
- Mati S. S.; Roy S. S.; Chall S.; Bhattacharya S.; Bhattacharya S. C. Unveiling the Groove Binding Mechanism of a Biocompatible Naphthalimide-Based Organoselenocyanate with Calf Thymus DNA: An “Ex Vivo” Fluorescence Imaging Application Appended by Biophysical Experiments and Molecular Docking Simulations. J. Phys. Chem. B 2013, 117, 14655–14665. 10.1021/jp4090553. [DOI] [PubMed] [Google Scholar]
- Yuqin L.; Guirong Y.; Zhen Y.; Caihong L.; Baoxiu J.; Jiao C.; Yurong G. Investigation of the Interaction between Patulin and Human Serum Albumin by a Spectroscopic Method, Atomic Force Microscopy, and Molecular Modeling. BioMed. Res Inter. 2014, 2014, 1. 10.1155/2014/734850. [DOI] [PMC free article] [PubMed] [Google Scholar]
- Paul P.; Mati S. S.; Bhattacharya S. C.; Kumar G. S. Exploring the interaction of phenothiazinium dyes methylene blue, new methylene blue, azure A and azure B with tRNAPhe: spectroscopic, thermodynamic, voltammetric and molecular modeling approach. Phys. Chem. Chem. Phys. 2017, 19, 6636–6653. 10.1039/C6CP07888E. [DOI] [PubMed] [Google Scholar]
- Chibber S.; Ahmad I. Molecular docking, a tool to determine interaction of CuO and TiO2 nanoparticles with human serum albumin. Biochem. and Biophys. Rep. 2016, 6, 63–67. 10.1016/j.bbrep.2016.03.004. [DOI] [PMC free article] [PubMed] [Google Scholar]
- Salema A. A.; Lotfyb M.; Aminb A.; Ghattasc M. A. Characterization of human serum albumin’s interactions with safranal and crocin using multi-spectroscopic and molecular docking techniques. Biochem. and Biophys. Rep. 2019, 20, 100670 10.1016/j.bbrep.2019.100670. [DOI] [PMC free article] [PubMed] [Google Scholar]
- Paul P.; Mati S. S.; Kumar G. S. Insights on the interaction of phenothiazinium dyes methylene blue and new methylene blue with synthetic duplex RNAs through spectroscopy and modeling. Biochem. and Biophys. Rep. 2020, 202, 111804. [DOI] [PubMed] [Google Scholar]
- Bruker S.Version 6.36a; Bruker AXS Inc.: Madison, Wisconsin, USA, 2002. [Google Scholar]
- Bruker S., Version 5.625 and SADABS, Version 2.03a; Bruker AXS Inc.: Madison, Wisconsin, USA, 2001. [Google Scholar]
- Becke D. Density-functional Thermochemistry III: The role of exact exchange. J. Chem. Phys. 1993, 98, 5648–5652. 10.1063/1.464913. [DOI] [Google Scholar]
- Lee C.; Yang W.; Parr R. G. Development of the colic-salvetti correlation-energy formula into a functional of the electron density. Phys. Rev. B: Condens. Matter Mater. Phys. 1988, 37, 785–789. 10.1103/PhysRevB.37.785. [DOI] [PubMed] [Google Scholar]
- Dunning T. H. Jr.; Hay P. J.. Spin–orbit electronic structure of the ScBr molecule. In Modern Theoretical Chemistry; Schaefer H. F., III, Eds.; Plenum: New York, 1977; 3, 1–28. [Google Scholar]
- Frisch M. J.; Trucks G. W.; Schlegel H. B.; Scuseria G. E.; Robb M. A.; Cheeseman S. G.; Barone V.; Mennucci B.; Petersson G. A.. et al. Gaussian 09, revision B.01; Gaussian, Inc.: Wallingford, CT, 2010. [Google Scholar]
- O’Boyle N. M.; Tenderfoot A. L.; Langner K. M. J. Comput. Chem. 2008, 29, 839–845. 10.1002/jcc.20823. [DOI] [PubMed] [Google Scholar]
- Gradinaru J.; Forni A.; Druta V.; Tessore F.; Zecchin S.; Quici S.; Garbalau N. Inorg. Chem. 2007, 46, 884–895. 10.1021/ic062035r. [DOI] [PubMed] [Google Scholar]
- Benesi H. A.; Hildebrand J. H. A Spectrophotometric Investigation of the Interaction of Iodine with Aromatic Hydrocarbons. J Am Chem.Soc. 1949, 71, 2703–2707. 10.1021/ja01176a030. [DOI] [Google Scholar]
- Basu A.; Jaisankar P.; Kumar G. S. Synthesis of novel 9-O-N-aryl/aryl-alkyl amino carbonyl methyl substituted berberine analogs and evaluation of DNA binding aspects. Bioorg. Med. Chem. 2012, 20, 2498–2505. 10.1016/j.bmc.2012.03.006. [DOI] [PubMed] [Google Scholar]
- Pasini A.; Gullotti M.; Ugo R. Optically active complexes of Schiff bases. Part 4. An analysis of the circular-dichroism spectra of some complexes of different co-ordination numbers with quadridentate Schiff bases of optically active diamines. Dalton Trans. 1973, 4, 754. 10.1039/DT9730000754. [DOI] [Google Scholar]
- Berman H. M.; Westbrook J.; Feng Z.; Gilliland G.; Bhat T. N.; Weissig H.; Shindyalov I. N.; Bourne P. E. The Protein Data Bank. Nucleic Acids Res. 2000, 28, 235–242. 10.1093/nar/28.1.235. [DOI] [PMC free article] [PubMed] [Google Scholar]
- Morris G. M.; Huey R.; Lindstrom W.; Sanner M. F.; Belew R. K.; Goodsell D. S.; Olson A. J. AutoDock4 and AutoDockTools4: Automated docking with selective receptor flexibility. J. Comput. Chem. 2009, 16, 2785–2791. 10.1002/2Fjcc.21256. [DOI] [PMC free article] [PubMed] [Google Scholar]
- De Lano W. L.. The PyMOL molecular graphics system. De Lano Scientific: San Carlos, CA: 2004. [Google Scholar]
- Mal K.; Naskar B.; Chaudhuri T.; Prodhan C.; Goswami S.; Chaudhuri K. Synthesis of quinoline functionalized fluorescent chemosensor for Cu (II), DFT studies and its application in imaging in living HEK 293 cells. J. Photochem. and Photobiol. A: Chem. 2020, 389, 112211 10.1016/j.jphotochem.2019.112211. [DOI] [Google Scholar]
Associated Data
This section collects any data citations, data availability statements, or supplementary materials included in this article.


