Abstract
Approximately 75% of all breast cancers express the oestrogen and/or progesterone receptors. Endocrine therapy is usually effective in these hormone-receptor-positive tumours, but primary and acquired resistance limits its long-term benefit1,2. Here we show that in mouse models of hormone-receptor-positive breast cancer, periodic fasting or a fasting-mimicking diet3–5 enhances the activity of the endocrine therapeutics tamoxifen and fulvestrant by lowering circulating IGF1, insulin and leptin and by inhibiting AKT–mTOR signalling via upregulation of EGR1 and PTEN. When fulvestrant is combined with palbociclib (a cyclin-dependent kinase 4/6 inhibitor), adding periodic cycles of a fasting-mimicking diet promotes long-lasting tumour regression and reverts acquired resistance to drug treatment. Moreover, both fasting and a fasting-mimicking diet prevent tamoxifen-induced endometrial hyperplasia. In patients with hormone-receptor-positive breast cancer receiving oestrogen therapy, cycles of a fasting-mimicking diet cause metabolic changes analogous to those observed in mice, including reduced levels of insulin, leptin and IGF1, with the last two remaining low for extended periods. In mice, these long-lasting effects are associated with long-term anti-cancer activity. These results support further clinical studies of a fasting-mimicking diet as an adjuvant to oestrogen therapy in hormone-receptor-positive breast cancer.
Growth factor signalling through the phosphoinositide 3-kinase (PI3K)–AKT–mammalian target of rapamycin (mTOR) and mitogen-activated protein kinase (MAP kinase) axes enhances oestrogen receptor activity and frequently underlies endocrine resistance in breast tumours1,2,6. Water-only fasting or plant-based diets that are simultaneously low in calories, sugar and protein and proportionally high in fat (fasting-mimicking diets (FMDs)) reduce circulating growth factors such as insulin and IGF12,6,7. Therefore, we hypothesized that these dietary interventions could be used to enhance the activity of oestrogen therapy (ET) and delay endocrine resistance.
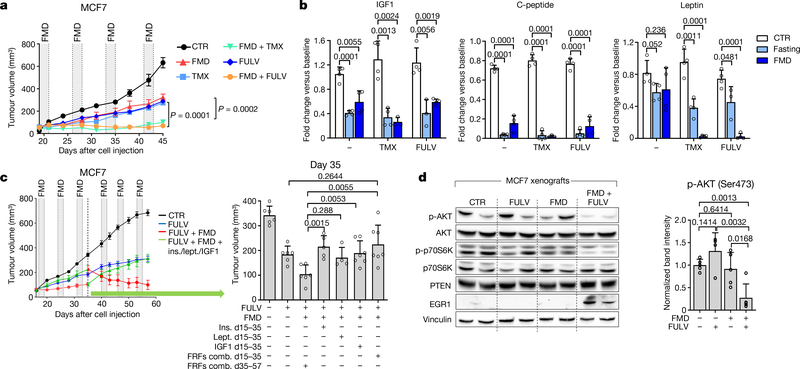
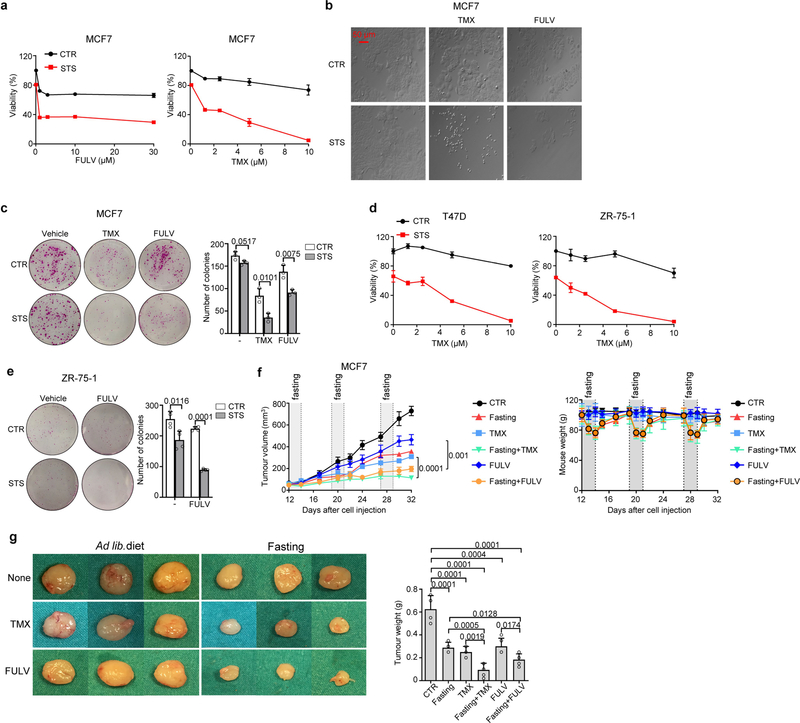
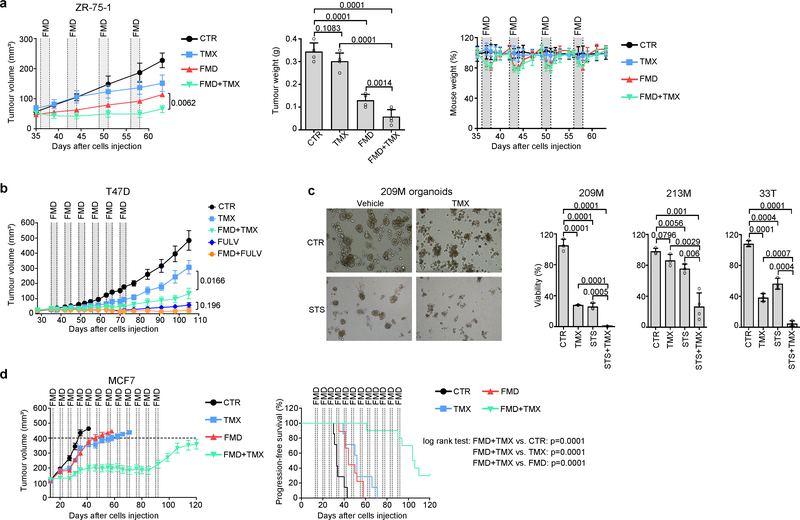
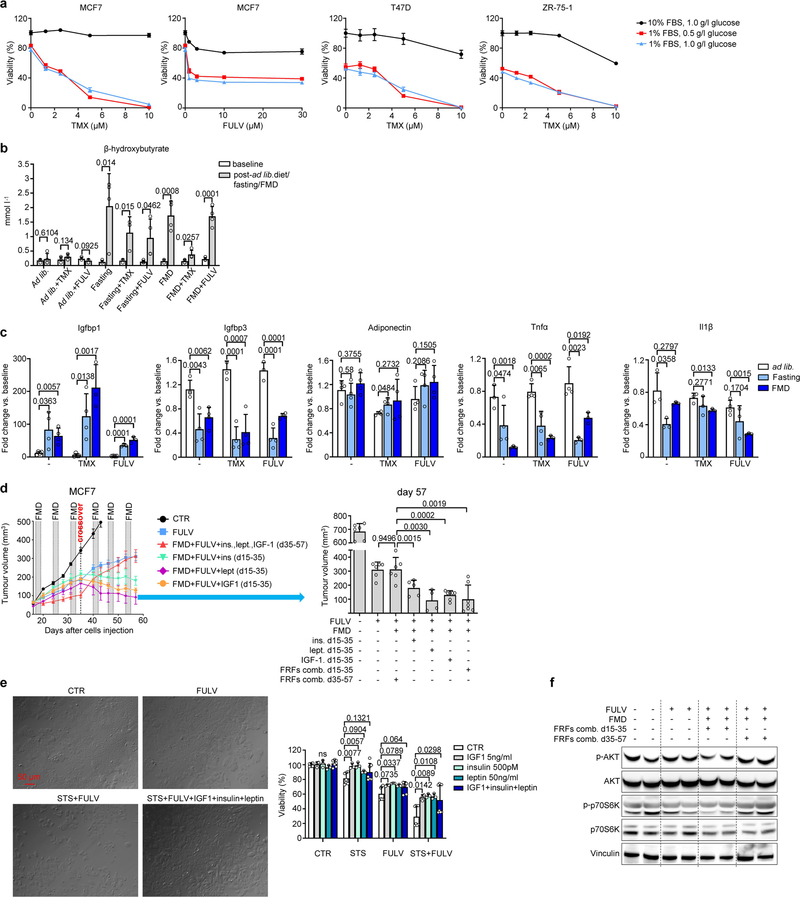
Low-serum, low-glucose cell culture conditions designed to mimic the effects of fasting or FMD (referred to as short-term starvation, STS) increased the anti-tumour activities of tamoxifen and fulvestrant in HR+/HER2− breast cancer (BC) cell lines, and similar results were obtained in mouse xenografts of the same cell lines subjected to weekly cycles of fasting or FMD (Fig. 1a, Extended Data Figs. 1, 2a, b). STS also increased the anti-tumour activity of tamoxifen in tumour organoids from patients with HR+ BC8, and weekly FMD cycles prevented acquired resistance to tamoxifen in mice (Extended Data Fig. 2c, d). Enhancement of ET activity through STS was dependent on the reduction in serum, but not glucose, as adding back glucose to the growth medium did not affect the observed potentiation (Extended Data Fig. 3a).
Fig. 1 |. Fasting or FMD potentiates the activity of ET in HR+ BC by reducing circulating growth-promoting factors.
a, Growth of MCF7 xenografts in 6–8-week-old female BALB/c nude mice treated with ad libitum diet (control, CTR; n = 6), weekly 48-h FMD (n = 6), tamoxifen (TMX; n = 6), fulvestrant (FULV; n = 8), or combined TMX + FMD (n = 8) or FULV + FMD (n = 10). b, Changes in serum IGF1, C-peptide and leptin concentration in female 6–8-week-old BALB/c nude mice treated with fasting or FMD (or ad libitum diet) with or without TMX or FULV. Serum was collected at the end of the fast or FMD. c, Six-to-eight-week-old female BALB/c nude mice were inoculated with MCF7 cells; when tumours became palpable, mice were randomized to be treated with ad libitum diet (n = 6), FULV (n = 6), FULV plus weekly FMD (n = 6), FULV plus weekly FMD plus intraperitoneal (i.p.) insulin (ins.; n = 5), IGF1 (n = 5), leptin (lept.; n = 5) or combined insulin + IGF1 + leptin (FRFs comb.; n = 7). At day 35 (crossover), FRF administration was withdrawn, whereas it was started in mice that had received only FULV + FMD. Left, MCF7 xenograft growth in response to ad libitum diet, fulvestrant, fulvestrant plus FMD, or fulvestrant, FMD and re-addition of the three FRFs (for the first 35 days or starting from day 35). Right, volume of MCF7 xenografts in response to the different treatments at day 35. d, Six-to-eight-week-old female BALB/c nude mice were inoculated with MCF7 cells. When tumours became palpable, mice were randomized to be treated with ad libitum diet, FULV, 48-h FMD or FULV + FMD. Mice were killed at the end of the fourth FMD cycle. Left, phosphorylated (p-) (Ser473 for AKT; Thr389 for p70S6K) and total AKT and p70S6K, EGR1, PTEN and vinculin (on the same gel) in the tumours were detected by immunoblotting. Right, phosphorylated AKT bands were quantified and normalized to total AKT (data points are biological replicates). For gel source data, see Supplementary Fig. 1. n, number of tumours per treatment group. Data are mean ± s.e.m. (a, c) or s.d. (b, d, right). a, P values determined by two-way ANOVA with Bonferroni post-hoc test and two-tailed Student’s t-test (day 45); b–d, by two-tailed Student’s t-test.
In mice, besides increasing β-hydroxybutyrate levels (Extended Data Fig. 3b) and lowering blood glucose (from 6.3 ± 0.6 mmol l−1 to 4.1 ± 0.3 mmol l−1 and 4.0 ± 0.9 mmol l−1, respectively; n = 4), fasting or FMD modified the levels of circulating growth factors and adipokines (Fig. 1b, Extended Data Fig. 3c). Both dietary interventions reduced serum C-peptide (a proxy of endogenous insulin production). They also reduced both circulating insulin-like growth factor 1 (IGF1) and insulin-like growth factor-binding protein 3 (IGFBP3, which binds to circulating IGF1, protecting it from rapid degradation9), while increasing IGFBP1 (which inhibits IGF1 action by preventing its binding to IGF receptors9). Thus, fasting or FMD reduced IGF1 levels and bioavailability. Fasting or FMD combined with ET also reduced the levels of leptin (Fig 1b), an adipokine that acts as a growth factor for HR+ BC cells and reduces ET efficacy10,11. Notably, adiponectin, which exerts anti-tumour effects10, was increased when fasting was added to the tamoxifen treatment(Extended Data Fig. 3c).
Adding back insulin, leptin or IGF1—which we collectively refer to as fasting-reduced factors (FRFs)—in mice bearing MCF7 xenografts that were treated with fulvestrant plus FMD was sufficient to revert the FMD-induced enhancement of fulvestrant activity (Fig. 1c, Extended Data Fig. 3d). We obtained similar results in cultured MCF7 cells (Extended Data Fig. 3e). In mice, withdrawing FRFs after three cycles of FMD (day 35) restored tumour sensitivity to ET plus FMD, whereas administering FRFs to mice treated with fulvestrant plus FMD stimulated tumour growth and abrogated fulvestrant potentiation via FMD (Fig. 1c). These data are consistent with a previous study demonstrating that insulin reduction enhances PI3K inhibitor activity in various cancer types12. That these FRFs have overlapping effects in activating signalling cascades affecting HR+ BC sensitivity to ET—such as the PI3K–AKT–mTOR pathway10–15—may explain why reducing all three factors maximizes the enhancement of ET anti-tumour activity. Consistent with this notion, tumours isolated from mice from which FRFs were withdrawn showed reduced phosphorylation of AKT and of p70S6K (an mTOR target), whereas tumours from mice that were given FRFs during treatment with fulvestrant plus FMD showed AKT and p70S6K phosphorylation levels comparable to those in mice fed ad libitum (Extended Data Fig. 3f).
In addition to IGF1, insulin and leptin, fasting or FMD (with or without tamoxifen or fulvestrant) lowered tumour necrosis factor (TNF), which can promote cancer growth by upregulating aromatase in the tumour microenvironment and by enhancing angiogenesis and cell invasion (Extended Data Fig. 3c). By contrast, interleukin 1β (IL-1β), which enhances HR+ BC cell migration and metastasis15,16, was reduced by combined tamoxifen or fulvestrant and FMD. Because downregulation of insulin, IGF1 and leptin proved essential for FMD-induced potentiation of ET anti-tumour activity, we focused on these FRFs for subsequent mechanistic experiments. However, it is likely that the benefit of adding fasting or FMD to ET involves other mediators, such as TNF and IL-1β.
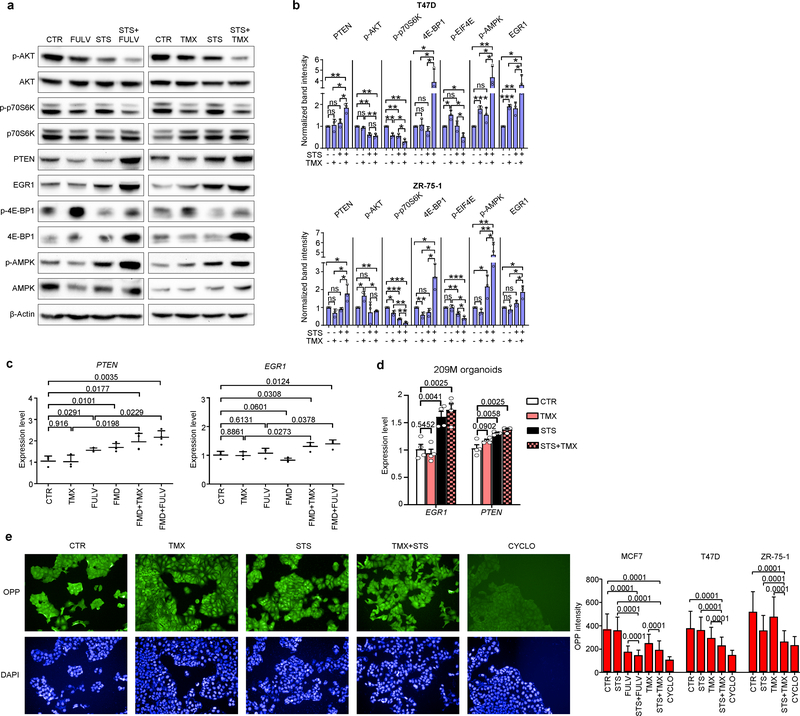
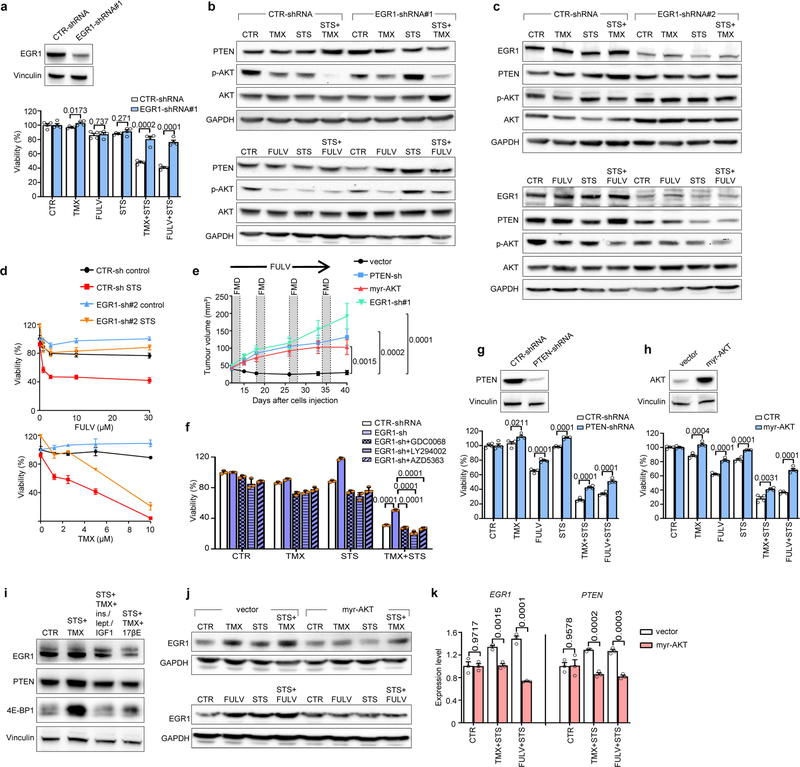
STS and the FMD (in experiments with MCF7 xenografts) cooperated with ET to increase the expression of PTEN, a negative regulator of AKT–mTOR signalling13, in HR+ BC cell lines (in vitro and in vivo) and in HR+/HER2− BC organoids (Fig. 1d, Extended Data Fig. 4a–d). In line with the previously described reduction of AKT phosphorylation and mTOR activity, these treatment combinations reduced p70S6K and eIF4E phosphorylation; increased the abundance of the translational repressor 4E-BP1, primarily in its unphosphorylated form; and inhibited protein synthesis (Extended Data Fig. 4a, b, e). Among the known enhancers of PTEN expression, we focused on the tumour suppressor early growth response protein 1 (EGR1), the expression of which is associated with good prognosis in patients with BC17,18, and which is upregulated in healthy tissues during fasting19 and is suppressed by oestrogen receptor activity20. EGR1 levels increased in HR+ BC cell lines and HR+ BC organoids after treatment with ET plus STS/FMD (Fig. 1d, Extended Data Fig. 4a–d). EGR1 silencing reduced the anti-tumour activity of coupled ET and STS/FMD and prevented ET–STS-induced PTEN accumulation and AKT inhibition (Extended Data Fig. 5a–e). BC cell protection from combined ET and STS through EGR1 silencing reflected persistent AKT activity, as the AKT inhibitors GDC0068 and AZD5363 and the PI3K inhibitor LY294002 all abolished this protection (Extended Data Fig. 5f). PTEN silencing and expression of a constitutively active AKT (myristoylated (myr)-AKT) also reduced the sensitivity of MCF7 to combined ET and STS/FMD (Extended Data Fig. 5e, g, h). Supplementation with insulin, IGF1 and leptin, or with 17β-oestradiol, prevented increases in EGR1, PTEN and 4E-BP1 in response to combined tamoxifen and STS in MCF7 cancer cells (Extended Data Fig. 5i). Myr-AKT also abolished upregulation of EGR1 and PTEN (Extended Data Fig. 5j, k). Therefore, fasting or FMD and ET appear to cooperate to reduce AKT-mediated inhibition of EGR1 expression. In turn, increased EGR1 raises PTEN levels and strengthens AKT inhibition. AMP-activated kinase (AMPK), which reduces mTOR activity, was also phosphorylated in BC cells exposed to combined ET and STS (Extended Data Fig. 6a). This effect was prevented by silencing of either PTEN or myr-AKT, indicating that AMPK stimulation through coupled ET and STS is secondary to upregulation of PTEN and to reduced AKT activity21.
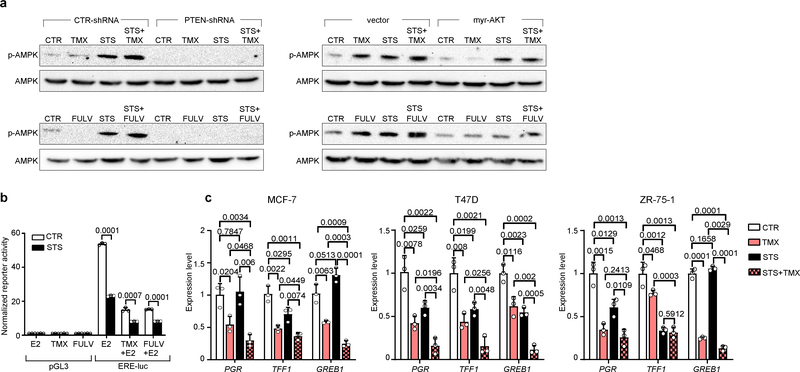
Oestrogen receptor activity is essential for the survival and proliferation of HR+ BC cells and is enhanced by insulin, IGF1 and leptin signalling at multiple levels1,7,11,14. STS reduced oestrogen-receptor-dependent transcription and enhanced fulvestrant- and tamoxifen-mediated oestrogen receptor inhibition in HR+ BC cell lines, as indicated by luciferase reporter assays and by the reduced expression of the oestrogen receptor target genes TFF1, PGR and GREB1 (Extended Data Fig. 6b, c). Thus, STS and ET also cooperate to inhibit oestrogen receptor activity.
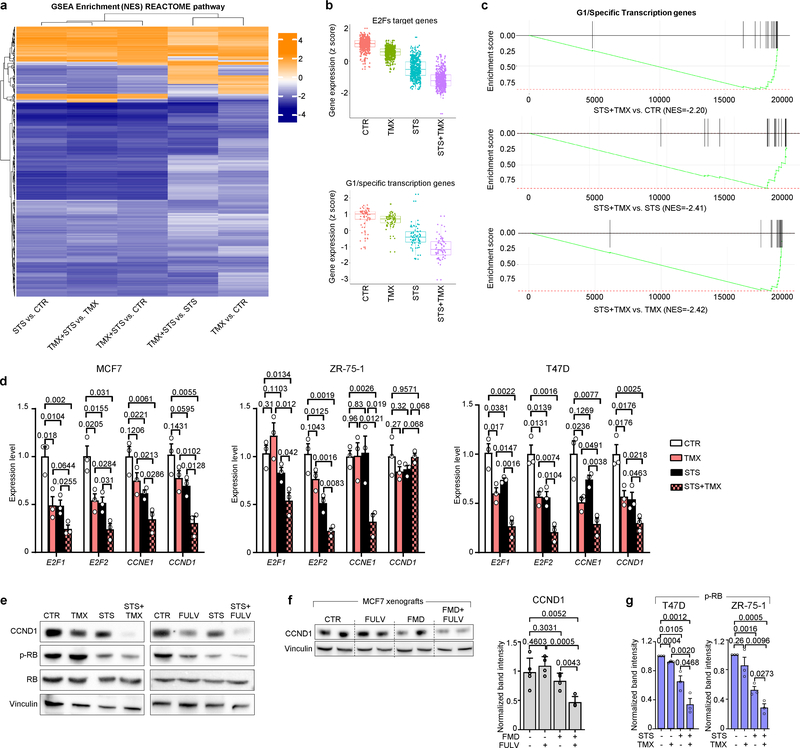
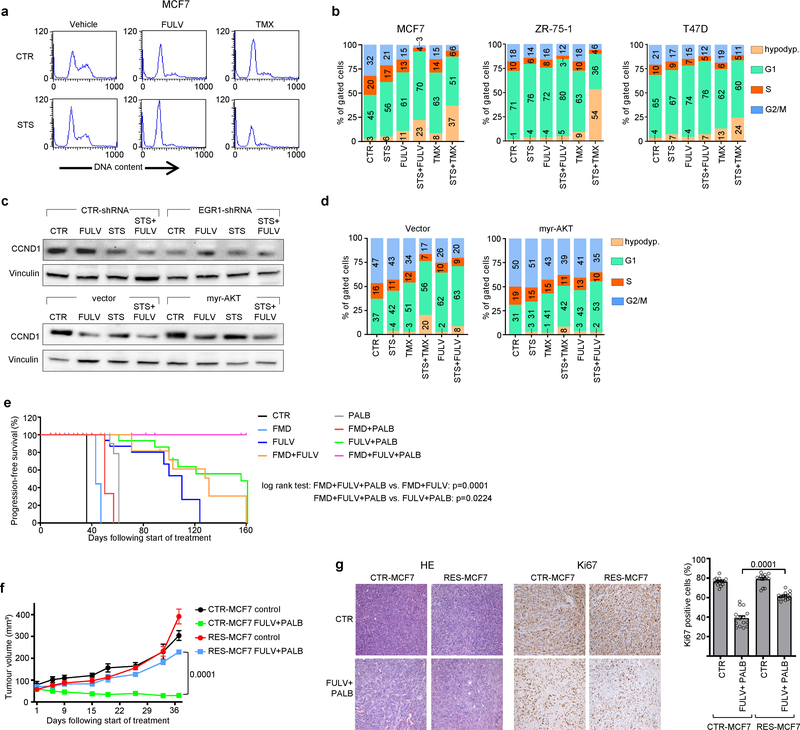
Using gene expression microarrays and gene set enrichment analysis (GSEA), we observed a downregulation of cell-cycle-related categories of genes after combined TMX and STS treatment in MCF7 cells (Extended Data Fig. 7a–c). We verified the downregulation of four of these genes—E2F1, E2F2, CCNE1 and CCND1—at the mRNA level (Extended Data Fig. 7d) and the protein level (cyclin D1 (CCND1); Extended Data Fig. 7e, f) after combined treatment. Consistent with their effects on cell cycle regulators, coupled STS and ET reduced levels of phosphorylated retinoblastoma protein (RB) in HR+ BC cells and induced cell cycle arrest in the G0–G1 phase (Extended Data Figs. 7e, g, 8a, b). Silencing of EGR1 and expression of myr-AKT both attenuated the downregulation of CCND1 in response to coupled ET and STS, and myr-AKT protected MCF7 from the cell cycle arrest caused by ET, STS or their combination (Extended Data Fig. 8c, d). Therefore, EGR1 upregulation and AKT inhibition mediate the downregulation of CCND1 by combined ET and STS and the consequent cell cycle arrest.
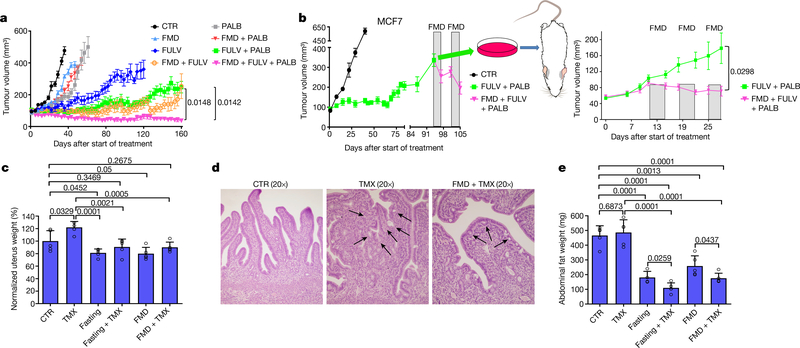
We reasoned that the downregulation of CCND1 by combined ET and FMD could be exploited to provide an additional therapeutic effect, by adding a cyclin-dependent kinase 4/6 (CDK4/6) inhibitor such as palbociclib, which is widely used together with ET in patients with HR+ BC1. In mice bearing orthotopic MCF7 xenografts, FMD cycles or palbociclib postponed the occurrence of fulvestrant resistance to a similar extent (Fig. 2a, Extended Data Fig. 8e). However, even the combination of fulvestrant and FMD or fulvestrant and palbociclib could not prevent resistance from arising. Combining fulvestrant, FMD and palbociclib not only prevented tumour growth for more than 160 days, but also led to slow—but steady—tumour shrinkage. Furthermore, administering FMD cycles to mice with tumours that had become resistant to fulvestrant plus palbociclib induced tumour shrinkage even at this advanced stage (Fig. 2b, left). MCF7 cells with acquired resistance to fulvestrant plus palbociclib (Extended Data Fig. 8f, g) were expanded and used to establish new xenografts, and, again, adding the FMD to fulvestrant and palbociclib resulted in significant anti-tumour activity (Fig. 2b, right).
Fig. 2 |. FMD prevents resistance to combined fulvestrant and palbociclib and reduces tamoxifen-induced endometrial hyperplasia.
a, Growth of orthotopic MCF7 xenografts in 6–8-week-old female NOD/SCIDγ mice treated with ad libitum diet (n = 15), cyclic FMD (n = 15), fulvestrant (n = 16), palbociclib (n = 15), FULV + PALB (n = 18), FULV + FMD (n = 16), PALB + FMD (n = 10) or FULV + PALB + FMD (n = 18). b, Left, MCF7-xenograft-bearing 6–8-week-old female NOD/SCIDγ mice were treated with ad libitum diet (n = 3) or combined FULV + PALB (n = 6). At tumour progression, mice that were treated with FULV + PALB received weekly FMD cycles. Right, MCF7 cells with acquired resistance to FULV + PALB were expanded ex vivo and re-transplanted; xenograft-bearing mice were treated with FULV + PALB (n = 7) or FULV + PALB + FMD (n = 10). c–e, Six-to-eight-week-old female BALB/c mice were treated for 5 weeks with ad libitum diet (n = 5), TMX (n = 5), weekly 48-h fasting (n = 5), FMD (n = 5), fasting + TMX (n = 5) or TMX + FMD (n = 5). Mice from all groups were killed at the end of the last FMD or fasting cycle. Uteri were collected, weighed (c; uterus weight was normalized to the mean uterus weight of mice from the control arm) and fixed for histology (d), and intra-abdominal fat (gonadal, retroperitoneal and mesenteric depots) was collected and weighed (e). In d, black arrows indicate the tufts or blebs budding from the epithelium. Data are mean ± s.e.m. (a, b) or s.d. (c, e). a, b, P values determined by two-way ANOVA with Bonferroni post-hoc test and two-tailed Student’s t-test (last day); c, e, data points are biological replicates; P values, two-tailed Student’s t-test.
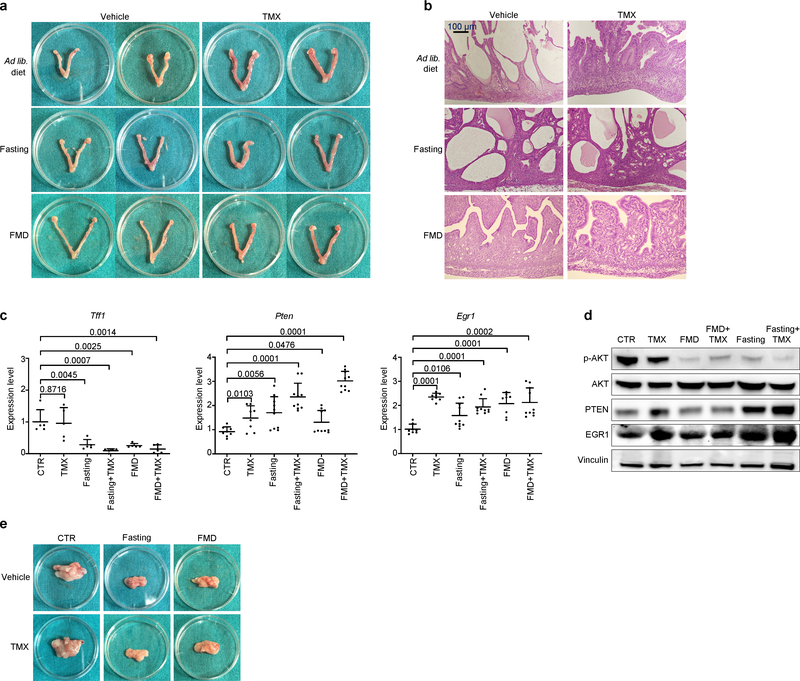
Necropsies of mice treated with combined tamoxifen and fasting or FMD revealed uteri of smaller size than the enlarged uteri from mice treated with tamoxifen alone. Fasting or FMD prevented the increase in uterus size and weight caused by tamoxifen and attenuated the histological signs of tamoxifen-induced endometrial hyperplasia, such as wide, thick endometrial villi and tufts or blebs budding from the epithelium (Fig. 2c, d, Extended Data Fig. 9a, b). Fasting or FMD with or without tamoxifen reduced the expression of Tff1 and the levels of phosphorylated AKT in mouse uteri, while increasing Egr1 and Pten mRNA (Extended Data Fig. 9c, d). PTEN and EGR1 proteins were also upregulated in the uterus in response to water fasting, whereas FMD resulted in only a trend towards an increase in these proteins (Extended Data Fig. 9d). Therefore, fasting or FMD reduces tamoxifen-induced endometrial hyperplasia, oestrogen receptor activity and AKT activation in the mouse uterus. Finally, fasting or FMD cooperated with tamoxifen to reduce intra-abdominal fat in mice (Fig. 2e, Extended Data Fig. 9e). Because intra-abdominal fat is a major source of adipokines, this reduction could explain the leptin-lowering effect of combined ET and fasting or FMD.
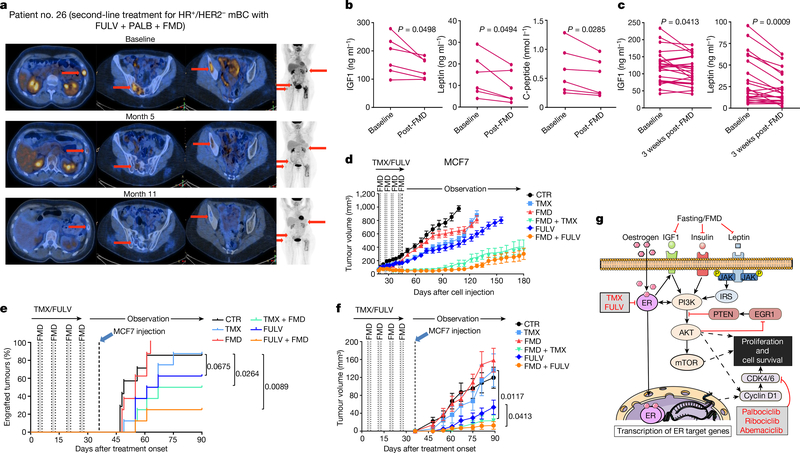
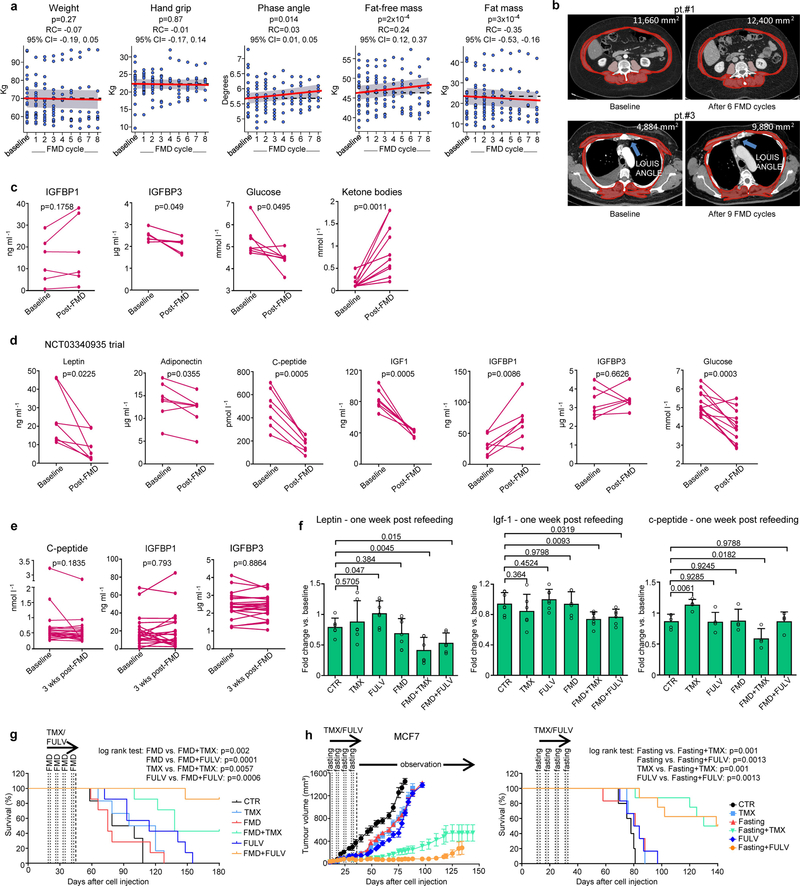
We tested the combination of periodic FMD and ET in 36 patients with HR+ BC enrolled in one of two clinical trials, NCT03595540 (patients 1–24) and NCT03340935 (patients 25–36), designed to assess the safety and feasibility of periodic FMD in patients receiving active cancer treatment (Supplementary Table 1). In the NCT03595540 trial, patients received a five-day FMD (Xentigen)3,5 every four weeks. They completed an average of 6.8 FMD cycles, with some undergoing up to 14 cycles. Also in this clinical study, the FMD proved to be safe, leading to only grade 1–2 adverse events, most commonly headache (41%) and fatigue (21%) (Supplementary Tables 1, 2). Patients from the NCT03340935 study received a similar, albeit more calorie-restricted, five-day FMD regimen every three to four weeks and completed an average of 5.5 cycles with no severe adverse events. Patients from the NCT03595540 trial, who also received dietary recommendations22 and instructions for daily muscle training for the intervals between FMD cycles, maintained a stable body weight and hand grip (Extended Data Fig. 10a). Their bioimpedance phase angle23 and fat-free mass increased over time, whereas their fat mass decreased. These findings were confirmed by abdominal or thoracic computed tomography (CT) scan analyses in those patients for whom CT scans were available at baseline and during treatment (Extended Data Fig. 10b). Clinical outcomes in patients with metastatic HR+/HER2− BC, including those treated with combined ET, palbociclib and FMD (n = 4), are promising (Fig. 3a, Supplementary Table 1). Patients 1, 26 and 27 have been treated in the second-line treatment setting for 32, 20 and 11 months, respectively, receiving a total of 10 (patient 1) and 8 (patients 26 and 27) FMD cycles. Patients 1 and 26 still have clinically controlled disease, whereas patient 27 progressed after 11 months (median progression-free survival (PFS) in this clinical setting is 9 months)16,24. Patient 29 received fourth-line treatment with fulvestrant and palbociclib plus five FMD cycles, ultimately progressing after 11 months. Considering all of the patients with HR+/HER2− BC who were enrolled in these trials, the FMD lowered blood glucose, serum IGF1, leptin and C-peptide, while increasing circulating ketone bodies (Fig. 3b, Extended Data Fig. 10c, d). Levels of leptin and IGF1—but not insulin—were still lower than the baseline values three weeks after the end of the FMD (Fig. 3c, Extended Data Fig. 10e).
Fig. 3 |. Effects of periodic FMD on disease control and circulating FRFs in patients with HR+ BC and in mice.
a, Representative positron-emission tomography (PET) scans from a patient with HR+/HER2− metastatic BC (mBC; patient 26) exhibiting complete metabolic response upon treatment with fulvestrant, palbociclib and FMD. b, c, Serum IGF1, leptin and (in b) C-peptide in patients with HR+ BC treated with ET and cyclic FMD (NCT03595540) before and immediately (b; n = 6) or three weeks (c; n = 23) after an FMD cycle. d, MCF7 cells were grafted into 6–8-week-old female BALB/c nude mice. Tumour-bearing mice were treated for one month with ad libitum diet (n = 16), TMX (n = 16), FULV (n = 18), FMD (n = 16), TMX + FMD (n = 16) or FULV + FMD (n = 17) and observed thereafter. n, number of tumours per treatment group. e, f, MCF7 engraftment and growth in 6–8-week-old female BALB/c nude mice that were pre-treated for one month with ad libitum diet (n = 7), TMX (n = 8), FULV (n = 8), FMD (n = 8), TMX + FMD (n = 8) or FULV + FMD (n = 8). Mice were inoculated with MCF7 cells one week after the end of pre-treatment. g, Putative model for the cooperation between fasting or FMD and ET at the level of PI3K–AKT–mTOR and CCND1 signalling. ER, oestrogen receptor; IRS, insulin receptor substrate. b, c, P value determined by two-tailed Student’s paired t-test; d, f, mean ± s.e.m.; P values, two-way ANOVA and Student’s t-test (f, day 90); e, P values, log-rank test.
Similar findings were obtained in mice (Extended Data Fig. 10f): in response to combined ET and FMD (but not to ET or FMD alone), leptin and IGF1 remained lower than in ad-libitum-fed mice, even with refeeding one week after the end of the FMD. Given that both leptin and IGF1 stimulate BC cell proliferation11,14,25,26, we evaluated whether these long-term changes in circulating FRFs, which persisted beyond the FMD period, were associated with anti-cancer effects. A one-month treatment of MCF7-xenograft-bearing mice with ET plus FMD (or fasting), but not with each treatment separately, slowed tumour growth for up to 90 days after treatment withdrawal, and resulted in enhanced mouse survival (Fig. 3d, Extended Data Fig. 10g, h). Pre-treating the mice with coupled ET and FMD for one month, followed by MCF7 cell inoculation, reduced tumour engraftment and slowed the growth of those tumours that did engraft (Fig. 3e, f). Pre-treatment with fulvestrant also slowed MCF7 xenograft growth, probably due to the use of a long-acting formulation. However, pre-treatment with combined FMD and fulvestrant was more effective than treatment with fulvestrant alone.
In conclusion, periodic fasting or FMD increases the anti-cancer activity of tamoxifen and fulvestrant, delays resistance to these agents and, in combination with fulvestrant and palbociclib, causes tumour regression and reverses acquired resistance to these two drugs. A pivotal cause for the enhancement of ET anti-tumour activity by fasting or FMD appears to be the reduction in blood insulin, IGF1 and leptin, with the consequent inhibition of the PI3K–AKT–mTOR pathway, at least in part through the upregulation of EGR1 and PTEN (Fig. 3g). Notably, fasting or FMD inhibits the AKT–mTOR axis without causing the rebound hyperglycaemia and hyperinsulinaemia that are associated with the use of PI3K or mTORC1inhibitors and have been implicated in tumour resistance to these treatments12,19,27,28. The leptin- and IGF1-lowering effects of ET plus FMD persist beyond the FMD period and are associated with carry-over anti-cancer activity. Therefore, the observed regression of HR+ BC in mice could reflect both an acute and stronger, together with a chronic and milder, reduction of these FRFs. These results also support a potential cancer-preventive effect of FMD cycles. The ability of fasting or FMD to prevent tamoxifen-induced endometrial hyperplasia is another interesting finding, given the prevalence of this side effect of tamoxifen and the limited options for preventing it1,29.
Overall, our results provide the rationale for larger clinical studies of FMDs as a means to improve clinical outcomes in patients with HR+ BC receiving ET, but also for the treatment of other cancers that are sensitive to insulin, IGF1 or leptin deprivation.
Online content
Any methods, additional references, Nature Research reporting summaries, source data, extended data, supplementary information, acknowledgements, peer review information; details of author contributions and competing interests; and statements of data and code availability are available at https://doi.org/10.1038/s41586-020-2502-7.
Methods
Cell lines and reagents
MCF7, ZR-75–1 and T47D cell lines were purchased from the ATCC (LGC Standards S.r.l., Milan, Italy). Cells were authenticated by DNA fingerprinting and isozyme detection. Cells were passaged for less than 6 months before their resuscitation for this study. All of our cell lines were routinely tested for mycoplasma contamination by Mycoalert Kit (Promega). Recombinant human IGF1 and recombinant human leptin were purchased from Peprotech. Insulin (Humulin R) was obtained from the Pharmacy of the IRCCS Ospedale Policlinico San Martino. Puromycin, protease/phosphatase inhibitor cocktail, β-oestradiol, sulforhodamine B, tamoxifen and fulvestrant (for in vitro use) were purchased from Sigma Aldrich S.r.l. Fulvestrant for in vivo use was purchased from AstraZeneca (Faslodex). Palbociclib for in vitro experiments was purchased from Selleck Chemicals, while that for in vivo experiments was purchased from Medchem Express. 17β-oestradiol-releasing pellets were purchased from Innovative Research of America.
Cell viability assays
2.8 × 10³ MCF7, 5 × 10³ T47D or 5 × 10³ ZR-75–1 cells were plated in 96-well plates in CTR medium. After 24 h, medium was removed and cells were washed with PBS and incubated in either CTR (10% FCS and 1g/L glucose) or STS (1% FBS, 0.5 g/L glucose) medium. After a further 24 h, cells were stimulated with or without with tamoxifen or fulvestrant at the indicated concentrations. Where indicated, GDC0068, AZD5363 and LY294002 (from SelleckChem) were used at 1 μM, 400 nM and 2 μM concentration, respectively. Viability was determined 72 h later by CellTiter 96 Aqueous One assay (Promega) according to the manufacturer’s instructions.
Organoid culture and viability assays
33T, 209M and 213M BC organoid lines were previously published8 and were cultured and passaged as previously described8. For viability assays, organoids were collected, washed, filtered with a 70-μm nylon filter (Falcon) and brought to a 7.5 × 10³ organoids/mL density in regular medium or STS medium (0.5 g/L for STS and concentration of B27 brought to 0.1× instead of 1×) containing 5% BME. Thereafter, 40 μL organoid suspension was dispensed in each well of a 384-well plate (Corning) using a Multi-drop Combi Reagent Dispenser (Thermo Scientific). Organoids were subsequently treated with 2.5 μM (209M) or 13 μM (33T and 213M) tamoxifen with four replicates. tamoxifen was dispensed using the Tecan d300e digital dispenser. DMSO concentrations never exceeded 1%. Five days later, viability was assessed using CellTiterGlow 3D reagent (Promega) according to the manufacturer’s instructions. Cell viability was normalized based on the signal obtained in organoids treated with 1 μM staurosporine (Sigma Aldrich; positive control, corresponding to 0% cell viability) and DMSO (negative control, corresponding to 100% viability).
Retroviral and lentiviral transduction
pBABE-puro (PBP), PBP-myr-AKT, pMKO-GFP-shRNA (short hairpin RNA), pMKO-PTEN-shRNA and the lentiviral packaging plasmid (pCMV-dR8.2 dvpr and pCMV-VSV-G) were purchased from Addgene (Cambridge, MA, USA). pLKO and pLKO-EGR1-shRNA1–3 were purchased from Sigma Aldrich S.r.l. Retro- and lentiviral transduction were performed as described elsewhere30. The sequence of the PTEN-targeting shRNA was CTTGAAGGCGTATACAGGACTCGAGTCCTGTATACGCCTTCAAGTCTTTTT, that of the EGR1 shRNA#1 was CCGGGCCAAGCAAACCAATGGTGATCTCGAGATCACCATTGGTTTGCTTGGCTTTTT (Sigma Aldrich, TRCN0000013833) and that of the EGR1 shRNA#2 was CCGGC GACATCTGTGGAAGAAAGTTCTCGAGAACTTTCTTCCACAGATGTCGTTTTT (Sigma Aldrich, TRCN0000013834).
Immunoblotting
For protein lysate generation from cultured cells, 5 × 10⁴ MCF7, T47D or ZR-75–1 cells were plated in 6-well plates in CTR medium. After 24 h, medium was removed, and cells were washed with PBS and incubated in either CTR or STS medium. After a further 24 h, cells were stimulated with or without with tamoxifen (5 μM) or fulvestrant (10 μM). Where indicated, cells were supplemented with insulin (400 pM), IGF1 (5 ng/ml), leptin (50 mg/ml) or 17β-oestradiol (100 nM). 24 h later, cells were washed and protein lysates were generated as described elsewhere30,31. Protein lysates from primary tumours or mouse uteri were obtained using TissueRuptor (Qiagen). Proteins (35μg) were separated by SDS–PAGE, transferred to a PVDF membrane (Immobilon-P, Millipore S.p.A.) and detected with the following antibodies: anti-phospho-AKT (Ser473; #4058), anti-AKT (#9272), anti-PTEN (#9552), anti-phospho-p70S6kinase (Thr389; #9206), anti-p70S6kinase (#9202), anti-4E-BP1 (#4923), anti-phospho-eIF4E (Ser209; #9741), anti-phospho-RB (Ser807/811; #9308), anti-RB (#9309), anti-CCND1 (#2978), all from Cell Signaling Technology; anti-phospho-AMPK (Thr172; PA5–17831), anti-AMPK (PA5–29679), anti-EGR1 (MA5–15008), from Thermo Fisher; and anti-β-actin from Santa Cruz Biotechnology. Band intensities were quantified with Quantity One SW software (Bio-Rad Laboratories, Inc.) using standard enhanced chemiluminescence.
Colony formation assays
8 × 10² MCF7 or 2 × 10³ ZR-75–1 cells were plated in 6-well plates in regular medium. 24 h later, cell medium was removed. Cells were washed twice with PBS and were incubated in either CTR or STS medium. The next day, cells were treated with either DMSO (vehicle), 5 μM tamoxifen or 10 μM fulvestrant for 24 h. Then cell medium was removed and cells were cultured for 2 weeks. Cell colonies were finally enumerated as described in ref. 30.
Cell cycle analysis by flow cytometry
Cell cycle analysis of cultured BC cells was performed by propidium iodide staining of isolated cell nuclei and flow cytometry as described elsewhere31, acquiring 10,000 events.
Protein synthesis assay
7.5 × 10³ MCF7 or 1 × 10⁴ T47D or ZR-75–1 cells were plated in 96-well plates in CTR medium. After 24 h, the cell medium was removed, cells were washed with PBS and then incubated in either CTR or STS medium. 24 h later, cells were stimulated with or without tamoxifen (5 μM) or fulvestrant (10 μM). Protein synthesis was determined with Click-iT Plus OPP Alexa Fluor 488 Protein Synthesis Assay Kit (Life Technologies) with PerkinElmer Operetta High Content Imaging System.
Luciferase reporter assay
For oestrogen receptor luciferase reporter assays, 4 × 10⁴ MCF7 cells were seeded in a 24-well plate 48 h before transfection. Cells were grown in phenol red free regular medium, supplemented with 10% charcoal stripped FBS (Gibco). Cell medium was then replaced and substituted with either regular or STS phenol red free medium, containing 10% or 1% charcoal treated FBS respectively, and 70% confluent cells were transfected with TransIT-LT1 Transfection Reagent (Mirus). 350 ng of pGL3 promoter plasmid (Promega) or of the pS2/TFF1 reporter vector containing 1.3 kb of the proximal promoter of the oestrogen-responsive gene TFF1 cloned in the pGL3-basic backbone32 were used together with 150 ng of the pRLSV40 plasmid (Promega), which harbours the luciferase gene from Renilla reniformis under a constitutive promoter. The next day, transfected cells were treated with or without tamoxifen (5 μM), fulvestrant (10 μM) and/or 17β-oestradiol (1 nM) and harvested after an additional 24 h. Luciferase signals were measured using the Dual-Luciferase Reporter Assay System (Promega) as described previously32.
Gene expression profiles and functional analyses
For gene expression microarray studies of cultured MCF7 cells, 5 × 10⁴ cells were plated in 6-well plates in CTR medium. After 24 h, medium was removed, and cells were washed with PBS and incubated either in CTR or STS medium. After a further 24 h, cells were stimulated with or without 5 μM tamoxifen. 24 h later, total RNA isolation was performed with the RNeasy Mini Kit (Quiagen, GmbH Hilden, Germany). RNAs were hybridized in quadruplicate on Agilent Human GE 4×44K V2 Microarray (G2519F-026652) following the manufacturer’s protocol. Hybridized microarray slides were scanned with the Agilent DNA Microarray Scanner G2505C at a 5-μm resolution with the manufacturer’s software (Agilent ScanControl 8.1.3). The scanned TIFF images were analysed numerically and background-corrected using the Agilent Feature Extraction Software (version 10.7.7.1), according to the Agilent GE1_107_Sep09 standard protocol. The output of Feature Extraction was analysed with the R software environment for statistical computing (http://www.r-project.org/) and the Bioconductor packages (http://www.bioconductor.org/). The arrayQuality Metrics package was used to check the quality of the arrays. Low-signal Agilent probes, identified by a repeated “not detected” flag across the majority of the arrays in every condition, were filtered out from the analysis. Signal intensities across arrays were background corrected (Edwards method) and normalized with the quantile normalization method. DEGs were determined adopting a double threshold based on (i) the magnitude of the change (fold change greater than ± 2) and (ii) the statistical significance of the change, measured with multiple-test-correction-adjusted P value (q-value) 0.05, using the Limma package. Gene-set enrichment analysis was performed using the version implemented in fgsea package, performing 10,000 permutations and using as database the REACTOME Pathways data set (reactome.db package). Box plots were generated using the ggplot2 package, and to evaluate the differences between the groups, a non-parametric two-sided Wilcoxon test was used. All results were corrected according to the Benjamini–Hochberg procedure.
Quantitative PCR
Quantitative PCR (qPCR) was performed as described elsewhere31. Gene-specific primers were purchased from Sigma-Aldrich or Thermo Fisher and are listed in Supplementary Table 3. Comparisons in gene expression were performed using the 2−ΔΔCt method.
ELISAs
Mouse whole blood was collected in Eppendorf tubes. It was allowed to coagulate for 2 h at room temperature, centrifuged 20 min at 4,000 rpm and then stored in aliquots in PCR tubes at −80 °C until subsequent use. Whole blood from patients was collected in Vacuette Serum Clot Tubes, centrifuged 20 min at 2,100 rpm and then aliquoted into small tubes and stored at −80 °C until use. All the ELISA assays to detect mouse and human serum level of IGF1, IGFBP1, IGFBP3, C-peptide, leptin and adiponectin were purchased from R&D System except that for mouse C-peptide, which was purchased from Alpco.
Animal models
All mouse experiments were performed in accordance with the relevant laws and institutional guidelines for animal care and use established in the Principles of Laboratory Animal Care (directive 86 /609 /EEC). Animal work was only started upon approval by the Italian Istituto Superiore di Sanità (ISS). NOD/SCIDγ mice were used in the experiments shown in Fig. 2a, b and Extended Data Fig. 8e–g at the animal facility of IFOM-IEO (Milan, Italy). They were derived from in-house colonies and were kept for a maximum of three generations. Breeders (Charles River Laboratories) and experimental animals were maintained under pathogen-free conditions. 6–8-week-old female athymic Nude-FoxN1 mice (purchased from Envigo) were used in the experiments shown in Figs. 1 and 3 d–f and Extended Data Figs. 1, 2, 3, 4c, 7f and 10f–h at the Animal Facility of the IRCCS Ospedale Policlinico San Martino. These animals were maintained in air-filtered laminar flow cabinets with a 12-h light cycle and food and water ad libitum. Mice were acclimatized for 1 week. To allow MCF7, T47D and ZR-75–1 xenograft growth, the day before cell injection a 17β-oestradiol-releasing pellet (Innovative Research of America) was inserted in the intra-scapular subcutaneous region under anaesthesia conditions. 5 × 10⁶ MCF7, 8 × 10⁶ ZR-75–1 or 5 × 10⁶ T47D cells were injected subcutaneously (s.c.) into either one or both flanks of the mouse (see Source Data files). Alternatively, 3 × 10⁶ MCF7 were injected orthotopically into the fourth abdominal fat pad (experiments shown in Fig. 2a, b and Extended Data Fig. 8e). Treatment was initiated when the tumours appeared as established palpable masses (~2 weeks after cell injection). In each experiment, mice were randomly assigned to one of the following arms: control (ad libitum diet); tamoxifen (45 mg/kg/d in peanut oil, oral gavage33–35); fulvestrant (150 mg/kg/once a week, s.c.35–37); palbociclib (65 mg/kg, in H2O, oral gavage, three times a week on Mondays, Tuesdays and Fridays38–40); IGF1 (200 μg/kg body weight41, s.c., twice a day on the days of FMD); insulin (20 mU/kg body weight12, s.c., on the days of FMD); leptin (1 mg/kg body weight42, s.c., once a day Monday through Friday, including on the days of FMD); fasting (water only, for 48 h every week4,43); FMD (previously described in refs. 3,4; for 48–96 h every week); or combinations of these treatments as indicated. Mice were housed in a clean, new cage to reduce coprophagy and residual chow. Body weight was measured immediately before, during and after fasting/FMD. FMD cycles were repeated every 5 or 7 d in order obtain complete recover of body weight before a new cycle. Tumour volume was calculated using the formula: tumour volume = (w2 × W) × π/6, where “w” and “W” are “minor side” and “major side” (in mm), respectively. The maximal tumour volume that was permitted by our Institutional Animal Care and Use Committee (IACUC) was 1,500 mm3, and in none of the experiments were these limits exceeded. Tumour masses were always isolated at the end of the last FMD/fasting cycle, weighed, divided in two parts and stored in liquid nitrogen for subsequent RNA extraction, or fixed in formalin for histology. For the resistance acquisition experiments mice were treated with weekly FMD cycles, with a 1-week break every fifth week, until the masses quadrupled their initial volume (or quadrupled the smallest volume ever reached, in Fig. 2b), as this was chosen as the criterion for defining resistance acquisition and disease progression,. In Extended Data 8e (representing mouse progression-free survival), mouse deaths that were unrelated to disease progression are presented as outreach symbol on the survival curves. In the experiments with tamoxifen-induced endometrial hyperplasia, 6–8-week old female BALB/c mice (Envigo) were used. At the end of the experiment, uteri were divided into two parts and stored in liquid nitrogen for subsequent RNA extraction and in formalin for histological examination.
Sample size estimation was performed using PS (Power and Sample size calculation) software (Vanderbilt University). By this approach we estimated that the number of mice that was assigned to each treatment group would reach a power of 0.85. The Type I error probability associated with our tests of the null hypothesis was 0.05. Mice were assigned to the different experimental groups in a random fashion. Operators were unblinded, with the exception of the pathologists who analysed the tumour samples isolated from animals in Fig. 2 and in Extended Data Figs. 8 and 9 (these pathologists were blinded). Blinding during animal experiments was not possible because mice were subject to a specific diet supply and daily treatment.
Tissue preparation, histology and immunohistochemistry
Tissue samples of uterus were formalin fixed for 24 h, routinely processed and paraffin embedded. From each paraffin block, 4-μm-thick sections were cut in one session and mounted on Superfrost Plus (Thermo Scientific) microscope slides. Polyclonal antibody for Ki67 (Cell Signaling, D2H10) diluted 1:50 plus Dako EnVision and Dual Link System HRP coupled with DAB detection kit were used for Ki67 staining. After immunostaining slides were counterstained with haematoxylin and coverslipped. All stains and immunostains were evaluated by one expert pathologist (LM) blinded as to the different treatments.
Clinical studies of FMDs in patients undergoing ET for HR+ BC
The NCT03595540 was conducted at the IRCCS Ospedale Policlinico San Martino and was approved by the Comitato Etico Regione Liguria. This trial consists of a single-arm phase II clinical study of a FMD (Xentigen, by L-Nutra, Los Angeles, CA) in 60 patients with solid or hematologic tumours undergoing active cancer treatment. Primary study endpoints were the feasibility and safety of monthly cycles of the FMD in patients with solid or hematologic tumours who undergo active treatment. Secondary pre-specified endpoints were: patient nutritional status; quality of life; clinical responses; long-term efficacy (progression-free survival, overall survival); effect of FMD on metabolic parameters (for example, HOMA index, circulating levels of IGF1); and effect of FMD on circulating immune cell subsets. An amendment to the protocol (which included the possibility of using imaging studies that are otherwise routinely prescribed for disease monitoring, for example, CT scans, for body composition evaluation) was approved by the Ethics Committee of the Regione Liguria on 8 April 2019 (#27). The FMD tested was described elsewhere3,5. Throughout the clinical study, patients received dietary counselling for the intervals between FMD cycles, aiming at providing an appropriate intake of proteins (primarily from seafood and legumes), essential fatty acids, vitamins and minerals as per international guidelines22,44, and were also invited to perform light/moderate daily muscle training (for example, 500–600 kJ/d; as allowed by their medical condition; https://docs.google.com/presentation/d/1szaRW4t-pZQI17o2Pe0747FsUEOVW-WiA6BHja0p8H_0/edit#slide=id.g34ad797184_0_0) to enhance muscle anabolism45. Between FMD cycles, patients were prescribed amino acid supplements (Aminotrofic; 30 g essential amino acids two times a day) in the presence of a difficulty in maintaining phase angle values of 5 degrees or greater. Additional information on this trial is available at https://clinicaltrials.gov/ct2/show/NCT03595540. Patient serum for subsequent ELISA assays of circulating growth factors and adipokines was routinely collected before commencement of the first and of the second FMD cycle. In addition, in those patients who lived close to the enrolment site, blood draws were also performed on day 6 of the FMD cycle. Blood glucose and ketone bodies were self-measured by the patients using Glucomen Areo 2k (Menarini). Bioimpedance measurements were done by BIA 101 (Akern, Florence, Italy) according to the instructions of the manufacturer.
The NCT03340935 clinical trial was conducted at the Fondazione IRCCS Istituto Nazionale dei Tumori, Milan, Italy. It was approved by the Comitato Etico of this Institution. This study aimed to assess the safety of a FMD in patients with cancer treated with different standard anti-tumour therapies (primary study endpoint). Secondary pre-specified endpoints included feasibility of the FMD in patients with cancer; metabolic effects of the FMD; effects of the FMD on blood growth factors; weight changes during the FMD; changes in blood cell counts; changes in kidney function parameters; and changes in liver parameters. Patients with any malignancy, with the exception of small-cell neuroendocrine tumours, were considered for enrolment in this study. The FMD was administered up to a maximum of 8 consecutive cycles in combination with standard adjuvant treatments or therapies for advanced disease. The FMD used in this study consisted of a 5-d plant-based, low-calorie (600 kcal on day 1, followed by 300 kcal/d on days 2–5), low-protein, low-carbohydrate diet (patent pending). The FMD was repeated every 3 or 4 weeks up to a maximum of 8 consecutive cycles. Additional information on this trial can be obtained at https://clinicaltrials.gov/ct2/show/NCT03340935.
Both of these studies complied with all relevant ethical regulations. Informed consent was obtained from all patients in both clinical trials.
CT-scan-based body composition analysis
CT scans of patients 1 and 3 were acquired with different CT scanners. Both 1.25-mm and 5-mm slice thickness with standard body kernel were available. The whole body was scanned from the lung apex to the pubic symphysis (patient 1). Reconstructed axial images with both a 1.25-mm and a 5-mm slice thickness were analysed using the software installed on the workstations of the IRCCS Ospedale Policlinico San Martino Radiology Department (Suite-Estensa 1.9-Ebit-Esaote Group Company, 2015). The third lumbar vertebra (L3), at the level in which both transverse processes are clearly visible, was the bony landmark for the estimation of total muscle area. If abdominal CT scans were not available and only thoracic CT was done (patient 3), estimation of total muscle area at the level of the Louis angle (manubriosternal joint that lies at the level of the second costal cartilage) at baseline and after repeated FMD cycles were done as described previously46.
Statistical analysis
Statistical analyses were performed with GraphPad Prism software version 5 (GraphPad Software). All parameters were tested by two-way Student’s t-test, paired t-test or two-way ANOVA. P values < 0.05 were considered to be significant. To evaluate changes in fat-free body mass, fat body mass and phase angle over time, we fitted a linear mixed-effects model taking into account absolute (values expressed in kg) fat-free body mass, absolute fat body mass (values expressed in kg) and phase angle (values expressed in degrees) as a function of time assessment, with a random covariate represented by subject ID (package lme4 in the R Environment for Statistical Computation).
Reporting summary
Further information on research design is available in the Nature Research Reporting Summary linked to this paper.
Data availability
All data generated or analysed during this study are included in this published Article (and its Supplementary Information files). All microarray data are available through the Gene Expression Omnibus database (http://www.ncbi.nlm.nih.gov/geo/) using the accession number GSE121378. Source data are provided with this paper.
Extended Data
Extended Data Fig. 1 |. Fasting and FMD enhance ET anti-tumour activity in HR+ BC cells.
a, b, MCF7 cells were plated in 96-well plates and treated with STS conditions, tamoxifen or fulvestrant at the indicated concentrations, or their combinations. After 96 h, cells were imaged by light microscopy (b) and their viability was detected (a). c, MCF7 cells were seeded in 6-well plates and cultured with or without STS, tamoxifen (TMX) or fulvestrant (FULV), or their combinations for 24 h. Thereafter, cells were cultured in regular medium for an additional 14 d. Finally, cells were fixed and stained with sulforhodamine B and cell colonies were counted. d, T47D and ZR-75–1 cells were plated in 96-well plates and exposed to STS, TMX at the indicated concentrations or their combination. Cell viability was detected after 96 h. e, ZR-75–1 cells were seeded in 6-well plates and cultured with or without STS, FULV, or their combinations for 24 h before being cultured in regular medium for an additional 14 d. Finally, cells were fixed and stained with sulforhodamine B and cell colonies were counted. f, g, MCF7 xenografts were established in 6–8-week-old female BALB/c nude mice. Once tumours became palpable, mice were randomized to be treated with ad libitum diet (control; n = 5), TMX (n = 5), FULV (n = 5), weekly 48-h water-only fasting (n = 5), or combined TMX + fasting (n = 5) or FULV + fasting (n = 5). Tumour volume and mouse weight were monitored over time (f). At the end of the experiment, mice were killed and tumour masses were imaged and weighed (g). In a–e, one representative experiment out of three is presented. In a, c, e, data are from four, three, and four biological replicates (four wells), respectively. In d - left graph, data are from six (left) or four (right) biological replicates (wells).Data are presented as mean ± s.d. (a, c–e, g) or s.e.m. (f). Data were analysed by two-tailed Student’s t-test (a, c–f; tumour volume at day 32, g) or two-way ANOVA (f).
Extended Data Fig. 2 |. Enhancement of ET activity via fasting/FMD in mouse xenografts of HR+ BC cell lines and in human HR+ BC organoids.
a, ZR-75–1 xenograft-bearing, 6–8-week-old female BALB/c nude mice were treated with ad libitum diet (control; n = 5), TMX (n = 5), weekly 48-h FMD (n = 6) or combined TMX and FMD (n = 6). Tumour volume (left) and mouse weight (right) were monitored over time. Mice from all treatment groups were killed at day 65, and tumours were isolated and weighed (middle). b, Growth of T47D xenografts in 6–8-week-old female BALB/c nude mice treated with ad libitum diet (n = 10), TMX (n = 7), fulvestrant (FULV; n = 9), or combined TMX + FMD (n = 5) or FULV + FMD (n = 5). c, Tumour organoids from patients with HR+ BC were cultured with or without TMX, STS conditions or their combination for 120 h, and then were imaged (left; one representative experiment out of three is presented) and their viability quantified (right). Viability of 209M, 213M and 33T BC organoids (graphs at right) was calculated from four biological replicates (wells) in each type of organoid for each treatment condition. d, MCF7 cells were grafted into 6–8-week-old female BALB/c nude mice, and once tumours became palpable, mice were treated with ad libitum diet (n = 14), TMX (n = 14), weekly FMD (n = 18) or their combination (n = 20). Tumour volume (left) and progression-free survival (right) were monitored for each group. n indicates the number of mice (with one tumour per animal; a) or the number of tumours per treatment group (b, d). Data are mean ± s.e.m. (a–d) or s.d. (c). Data were analysed by two-way ANOVA (a, left; b; d, left), by two-tailed Student’s t-test (a, right; b, tumour volume at day 105; c) or by log-rank test (d, right).
Extended Data Fig. 3 |. FMD-mediated increase in ET anti-cancer activity is mediated by the reduction in circulating insulin, IGF1 and leptin.
a, MCF7 cells were seeded in 96-well plates and cultured for 96 h with or without STS conditions (1% FBS, 0.5 g/l glucose), low-serum conditions (1% FBS, 1 g/l glucose), TMX or FULV at the indicated concentrations, or combinations of these treatments. Thereafter, cell viability was determined. One representative experiment out of three is presented. Cell viability in each treatment condition was calculated from three (MCF7 cells) or four (T47D, ZR-75–1 cells) biological replicates (wells). b, c, Serum β-hydroxybutyrate, IGFBP1, IGFBP3, adiponectin, TNF and IL-1β concentrations in female 6–8-week-old BALB/c nude mice treated with fasting/FMD (or ad libitum diet) with or without TMX or FULV. In all mouse groups, serum was collected at the end of the fasting/FMD. Data are from biological replicates. d, MCF7 cells were injected into 6–8-week-old female BALB/c nude mice; once tumours became palpable, mice were randomized to be treated with ad libitum diet (n = 6), FULV (n = 6), FULV + weekly FMD (n = 6), FULV + FMD + i.p. insulin (n = 5), FULV + FMD + IGF1 (n = 5), FULV + FMD + leptin (n = 5), or FULV + FMD + combined insulin, IGF1 and leptin (FRFs; n = 7). FRF administration was withdrawn at day 35 (crossover), while it was started in mice that had only been treated with FULV + FMD. Right, tumour volume in each treatment group at day 57; n, number of tumours per treatment group. e, MCF7 cells were seeded in 96-well plates and cultured for 96 h with or without STS, 10 μM FULV, insulin, IGF1, leptin (at the indicated concentrations), combined insulin, IGF1 and leptin, or combinations of these treatments. Cells were then imaged by light microscopy (left) and cell viability was determined (right). One representative experiment out of three is presented. f, At the end of the experiment shown in d, tumour masses were isolated for protein lysate generation. Total and phosphorylated AKT (Ser473) and p70S6K (Thr389) and vinculin (on the same gel) were assessed by immunoblotting. One representative experiment out of three (n = 5 or 6 tumour masses/treatment group were evaluated) is presented. For gel source data, see Supplementary Fig. 1. Data are from biological replicates and represent mean ± s.d. (a–c, e, right) or s.e.m. (d). Data were analysed by two-tailed Student’s t-test.
Extended Data Fig. 4 |. Fasting or FMD and oestrogen therapy cooperate to inhibit PI3K–AKT–mTOR and oestrogen receptor signalling in HR+ BC cells.
a, b, MCF7, T47D and ZR-75–1 cells were seeded in 6-well plates and cultured for 48 h with or without STS conditions in the presence or absence of tamoxifen (5 μM) or fulvestrant (10 μM). Thereafter, cells were subjected to protein lysate generation, and PI3K–AKT–mTOR signalling and EGR1, PTEN and β-actin (on the same gel) levels were detected by immunoblotting. For gel source data, see Supplementary Fig. 1. In b, protein bands were quantified and normalized to vinculin levels; data are from biological replicates and were obtained by three different experiments. c, MCF7 cells were injected into 6–8-week-old female BALB/c nude mice. Once tumours became palpable, mice were randomized to be treated with ad libitum diet (n = 3), FULV (n = 3), TMX (n = 3), weekly 48-h FMD (n = 4), FULV + FMD (n = 4) or TMX + FMD (n = 4). Mice were killed at the end of the fourth FMD cycle. Tumour masses were isolated and EGR1 and PTEN expression were detected by qPCR. Data are from biological replicates. n, number of tumours isolated and used for this experiment. d, Metastasis-derived HR+ BC organoids were cultured with or without TMX, STS or their combination for 48 h. Thereafter, organoids were isolated and subjected to RNA isolation, and EGR1 and PTEN expression was quantified by qPCR. Data are from biological replicates. One representative experiment out of three is presented. e, MCF7, T47D and ZR-75–1 cells were seeded in 96-well plates and cultured for 48 h with or without 1 μg/ml cycloheximide (CYCLO), STS conditions, TMX (5 μM), FULV (10 μM) or their combinations. Thereafter, protein synthesis was detected by OPP assay. Left, cells were imaged by fluorescence microscopy (one representative image out of three biological replicates (wells) is shown). Right, single-cell analysis was performed by acquiring the fluorescence signal from >1,000 cells per treatment condition (range 11548290). In b–e, data represent mean ± s.d. P values were calculated by two-tailed Student’s t-test. b, ns: non-significant; *P < 0.05; **P < 0.01; ***P < 0.001 (for P values, see Source Data file).
Extended Data Fig. 5 |. EGR1, PTEN and reduced AKT activation mediate the cooperation between ET and fasting/FMD in BC cells.
a–d, MCF7 cells were transduced with either one of two independent EGR1-targeting shRNAs (#1 or #2). In a, d, cells were seeded in 96-well plates and cultured with or without STS conditions, TMX or FULV at the indicated concentrations (5 μM TMX or 10 μM FULV in a) or their combinations for 96 h and then cell viability was detected (a, d). In a (upper panel), b, c, cells were plated in 6-well plates and cultured with or without STS, 5 μM TMX, 10 μM FULV or their combinations for 48 h. Afterwards, cells were subjected to protein lysate generation, and EGR1, PTEN and phosphorylated (Ser473) and total AKT, as well as GAPDH, were detected by immunoblotting. e, MCF7 cells transduced with a control vector (n = 12), an EGR1- (n = 10) or a PTEN-targeting (n = 10) shRNA, or myr-AKT (n = 11) were injected into 6–8-week-old female BALB/c nude mice. Once tumours became palpable, mice were treated with FULV and weekly cycles of FMD, and tumour volume was monitored. n, number of tumours per treatment group. f, MCF7 cells engineered to express either a control scrambled shRNA or an EGR1-targeting shRNA (shRNA#1) were seeded in 96-well plates. Twenty-four hours later, cells were cultured with or without TMX (5 μM), STS, GDC0068 (1 μM), AZD5363 (500 nM), LY294002 (2 μM) or their combinations. Cell viability was detected after 96 h. g, h, MCF7 cells were transduced with either a PTEN-targeting shRNA or myr-AKT. Cells were plated in 6-well plates and subjected to protein lysate generation. PTEN (g), AKT (h) and vinculin (g, h) were detected by immunoblotting. Thereafter, cells were seeded in 96-well plates and cultured with or without STS, TMX (5 μM), FULV (10 μM) or their combinations for 96 h and then cell viability was detected. i, MCF7 cells were seeded in 6-well plates and 24 h later were cultured with or without STS + TMX (5 μM), STS + TMX + combined insulin (400 pM), IGF1 (5 ng/ml) and leptin (50 mg/ml) or STS + TMX + 17β-oestradiol (100 nM). Forty-eight hours later, cells were subjected to protein lysate generation and EGR1, PTEN, 4E-BP1 and vinculin were detected by immunoblotting. j, k, MCF7 cells that were engineered with either a control vector or myr-AKT were cultured for 48 h with or without TMX (5 μM), FULV (10 μM), STS or their combinations. Thereafter, cells were subjected to protein lysate generation and monitoring of EGR1 and GAPDH levels by immunoblotting (j) or for RNA extraction and EGR1 and PTEN mRNA quantification (k). In a (lower panel), d, f, g (lower panel), h (lower panel), k, data are from biological replicates (in d, data are from four biological replicates (wells) per treatment condition). In a (upper inset), b, c, g (upper inset), h (upper inset), i, j, one representative experiment out of three is presented. Loading controls (GAPDH, vinculin) were always run on the same gels that were used to detect other proteins. For gel source data, see Supplementary Fig. 1. Data are presented as mean ± s.d. (a, d, f–h, k) or s.e.m. (e). In a, d, f–h, k, P values were determined by two-tailed Student’s t-test. In e, data were analysed by two-way ANOVA with Bonferroni post-hoc test and by two-tailed Student’s t-test (tumour volumes at day 40).
Extended Data Fig. 6 |. STS conditions cooperate with ET to activate AMPK and to dampen oestrogen receptor transcriptional activity in BC cells.
a, MCF7 cells transduced with a control vector, a PTEN-targeting shRNA or myr-AKT were plated into 6-well plates and cultured with or without STS conditions, TMX (5 μM), FULV (10 μM) or their combinations for 48 h. Afterwards, cells were subjected to protein lysate generation, and total and phosphorylated AMPK (Thr172) were detected by immunoblotting. The loading control for the immunoblots with PTEN-silenced MCF7 cells (vinculin) is shown in Supplementary Fig. 1. The loading control for the immunoblots with myr-AKT-expressing MCF7 (GAPDH) is shown in Extended Data Fig. 5j. Both loading controls were run on the same gels that were used to detect total and phosphorylated AMPK. For gel source data, see Supplementary Fig. 1. b, MCF7 cells were plated into 24-well plates and transfected with a pGL3 promoter plasmid or with a pS2/TFF1 reporter vector containing 1.3 kb of the proximal promoter of the oestrogen-responsive gene TFF1 cloned in the pGL3-basic backbone. Afterwards, cells were cultured with or without STS, TMX (5 μM), FULV (10 μM) or their combinations for 48 h. Finally, luciferase reporter activity was measured. c, MCF7, T47D and ZR-75–1 cells were plated in 6-well plates and cultured with or without STS, TMX (5 μM) or their combinations for 48 h. Thereafter, cells were subjected to RNA extraction, and PGR, TFF1 and GREB1 expression was detected by qPCR. In a–c, one representative experiment out of three is presented. In b, c, data are from biological replicates and are presented as mean ± s.d. P values were determined by two-tailed Student’s t-test.
Extended Data Fig. 7 |. FMD cooperates with ETs to induce cell cycle arrest in HR+ BC.
a–c, MCF7 cells were plated in 6-well plates and cultured with or without STS conditions, 5 μM tamoxifen (TMX) or their combination. After 24 h, RNA was isolated and used for gene expression microarray experiments (three biological replicates for each treatment condition were used). GSEA, represented by a heat map (a), was done by performing 10,000 permutations and using the REACTOME Pathways data set. Box plots (b) were generated using the ggplot2 package; to evaluate the differences between the groups, a non-parametric two-sided Wilcoxon test was used. The box-plot centre lines indicate the median value. c, Enrichment scores for G1-specific transcription genes of STS + TMX versus CTR, STS, or TMX groups. NES: normalized enrichment score. d, MCF7, T47D and ZR-75–1 cells were treated with TMX (5 μM), STS or their combinations. After 48 h, cells were subjected to RNA extraction or protein lysate generation. E2F1, E2F2, CCND1 and CCNE1 mRNA expression was detected by qPCR. e, CCND1, phosphorylated (Ser807/811) and total RB protein and vinculin (on the same gel) were detected by immunoblotting in the MCF7 cells. f, Tumour masses from mice that were treated for 4 weeks with ad libitum diet (n = 5), FULV (n = 4), weekly 48 h FMD (n = 4) or their combination (n = 4) were isolated at the end of the last FMD cycle. CCND1 and vinculin (run on the same gel) were detected by immunoblotting (left). CCND1 levels were quantified and normalized to vinculin (right). n signifies the number of tumours isolated per treatment group. g, T47D and ZR-75–1 cells were cultured in vitro for 48 h with or without TMX (5 μM), STS conditions or their combination, and then used to generate protein lysates. Phosphorylated (Ser807/811) RB protein bands were quantified and normalized to total RB. In d, f (right), g, data are from biological replicates. In g (right), data were obtained through three independent experiments. In d–f (left), one representative experiment out of three (d, e) or out of two (f, left) is presented. In d, f, (right), g, data are presented as mean ± s.d. P values were determined by two-tailed Student’s t-test. For gel source data, see Supplementary Fig. 1.
Extended Data Fig. 8 |. Combined FMD and ET downregulate CCND1 via EGR1 upregulation and AKT inhibition and revert acquired resistance to fulvestrant plus palbociclib.
a, b, MCF7, T47D and ZR-75–1 cells were plated into 96-well plates and cultured with or without TMX (5 μM) or FULV (10 μM), STS conditions or their combinations for 48 h. They were then subjected to cell cycle analysis by propidium iodide staining of isolated cell nuclei and flow cytometry. c, Upper panel, MCF7 cells were transduced with either a control scrambled shRNA or an EGR1-targeting shRNA (EGR1-shRNA#1); lower panel, MCF7 cells were transduced with a control vector or myr-AKT. Cells were cultured with or without TMX (5 μM) or FULV (10 μM), STS or their combinations for 48 h. Afterwards, cells were subjected to protein lysate generation, and CCND1 and vinculin (on the same gel) levels were detected by immunoblotting. For gel source data, see Supplementary Fig. 1. d, MCF7 cells transduced with a control vector or myr-AKT were cultured with or without TMX (5 μM) or FULV (10 μM), STS or their combinations for 48 h and then subjected to cell cycle analysis. e, MCF7 cells were injected orthotopically into 6–8-week-old female NOD/SCIDγ mice. Once tumours became palpable, mice were treated with ad libitum diet (n = 15), FULV (n = 16), cyclic FMD (n = 15), palbociclib (n = 15), FULV + PALB (n = 18), FULV + FMD (n = 16), PALB + FMD (n = 10) or FULV + PALB + FMD (n = 18), and their progression-free survival was monitored over time. f, g, MCF7 cells with acquired resistance to combined FULV + PALB (from Fig. 2b) were isolated and expanded ex vivo. Resistant MCF7 as well as parental MCF7 cells (control) were injected into 6–8-week-old female NOD/SCIDγ mice. Once tumours became palpable, mice were randomly assigned to be treated with or without FULV + PALB (mice with control MCF7 treated with vehicle: n = 5, with FULV + PALB: n = 4; mice with resistant MCF7 treated with vehicle: n = 4, with FULV + PALB: n = 5). Tumour volumes were monitored, and at the end of the experiment (day 38) tumour masses were isolated and subjected to histology (haematoxylin and eosin, HE) and immunohistochemical detection of Ki67+ cells (g). In g, right, 3–5 slices were prepared from each tumour (technical replicates) and subjected to Ki67+ cell enumeration. In e, f, n indicates the number of mice per treatment group (one tumour per mouse). In a–d, one representative experiment out of three is presented. Data are mean ± s.e.m. (f) or mean ± s.d. (g, right). In e, progression-free survival was analysed by log-rank test. In f, data were analysed by two-way ANOVA with Bonferroni post-hoc test and by two-tailed Student’s t-test (day 38). In g, P values were determined by two-tailed Student’s t-test.
Extended Data Fig. 9 |. Fasting or FMD prevents tamoxifen-induced endometrial hyperplasia and reduces intra-abdominal fat.
a–d, Six–eight-week-old female BALB/c mice were treated for 5 weeks with ad libitum diet (n = 11), tamoxifen (TMX; n = 11), weekly 48-h water-only fasting (n = 11) or FMD (n = 8), TMX + fasting (n = 11) or TMX + FMD (n = 8). Mice from all treatment groups were killed at the end of the last fasting/FMD cycle. Uteri were collected, imaged (a), fixed for histology (b) and subjected to protein lysate generation and RNA extraction. In addition, intra-abdominal fat depots were also isolated. Tff1, Pten and Egr1 mRNA levels in mice uteri were determined by qPCR (c), and total and phosphorylated AKT (Ser473), EGR1, PTEN and vinculin in mouse uteri were detected by immunoblotting (d; vinculin was detected on the same gel as EGR1 and PTEN). For gel source data, see Supplementary Fig. 1. e, Intra-abdominal fat depots isolated from the mice were imaged. In c, d, data are from biological replicates. P values were determined by two-tailed Student’s t-test.
Extended Data Fig. 10 |. Effects of periodic FMD on circulating FRFs and on disease in patients with HR+ BC and in HR+ BC mouse xenografts.
a, Body weight, hand grip, phase angle, fat-free and fat mass in patients (n = 23) with HR+ BC treated with ET and cyclic FMD in the NCT03595540 clinical trial. To evaluate changes in these parameters, we fitted a linear mixed-effects model taking into account absolute values as a function of time with a random covariate represented by subject ID. b, Quantification of total muscle area (highlighted in red) at L3 level (patient 1) and at the Louis angle level (patient 3) in patients with HR+ BC treated with ET and cyclic FMD (NCT03595540). c, Serum IGFBP1 and IFGBP3 (n = 6), blood glucose (n = 7) and ketone bodies (n = 11) before and after an FMD cycle in patients with BC treated with ET and FMD in the NCT03595540 trial. d, Serum leptin, adiponectin, C-peptide, IGF1, IGFBP1 and IFGBP3 (n = 7) and blood glucose (n = 12) before and after an FMD cycle in patients with BC treated with ET and FMD in the NCT03340935 clinical trial. e, Serum C-peptide, IGFBP1 and IGFBP3 in patients with HR+ BC treated with ET and cyclic FMD before and 3 weeks after an FMD cycle (n = 23; NCT03595540 trial). f, 6–8-week-old BALB/c nude mice were treated with ad libitum diet (n = 7), fulvestrant (n = 7), tamoxifen (n = 6), weekly FMD (n = 7), FULV + FMD (n = 6) or TMX + FMD (n = 7) for 2 weeks; 1 week after the end of the last FMD cycle, mice were killed, serum was isolated and serum C-peptide, IGF1 and leptin were measured by ELISA. g, h, MCF7 cells were injected into 6–8-week-old female BALB/c nude mice. Once tumours became palpable, mice were randomly assigned to be treated for 1 month with ad libitum diet (g, n = 9; h, n = 8), TMX (g, n = 9; h, n = 7), FULV (g, h, n = 9), FMD (g, n = 7), TMX + FMD (g, n = 9), FULV + FMD (g, n = 9), 48 h water-only fasting (h, n = 8), TMX + fasting (h, n = 14) or FULV + fasting (h, n = 10), followed by observation. Tumour volume (h) and mouse survival (g, h) were monitored. n, number of mice per treatment group (f, g) or of tumours per treatment group (h). In c–f, data are from biological replicates. In f, data are mean ± s.d. In h (left), data are mean ± s.e.m. In c–e, data were analysed by two-tailed Student’s paired t-test. In f, P values were determined by two-tailed Student’s t-test. In g, h (right), data were analysed by log-rank test. In h (left), results were analysed by two-way ANOVA with Bonferroni post-hoc test.
Supplementary Material
Acknowledgements
This work was supported in part by the Associazione Italiana per la Ricerca sul Cancro (AIRC; IG#17736 and #22098 to A.N.; IG#17605 and IG#21820 to V.D.L.; AIRC Fellowship #22457 to G.S. and V.D.L.; IG#21548 to A.P.; and MFAG#22977 to C.V.), the Fondazione Umberto Veronesi (to A.N., I.C., F.P. and V.D.L.), the Italian Ministry of Health (GR-2011–02347192 to A.N.), the 5 × 1000 2014 Funds to the IRCCS Ospedale Policlinico San Martino (to A.N.), the BC161452 and BC161452P1 grants of the Breast Cancer Research Program (US Department of Defense; to V.D.L. and to A.N., respectively), the US National Institute on Aging–National Institutes of Health (NIA–NIH) grants AG034906 and AG20642 (to V.D.L.), and the Associazione Italiana contro le Leucemie-linfomi e Mieloma (AIL), Sezione Liguria. We thank the High Throughput Screening Facility of the University of Trento (Italy) and T. Bonfiglio (Department of Internal Medicine and Medical Specialties, University of Genoa) for their technical support.
Footnotes
Competing interests A.N. and I.C. hold intellectual property rights on clinical uses of fasting-mimicking diets. V.D.L. holds intellectual property rights on clinical uses of fasting-mimicking diets and equity interest in L-Nutra, a company that develops and markets medical food. The remaining authors declare no competing interests.
Additional information
Supplementary information is available for this paper at https://doi.org/10.1038/s41586-020-2502-7.
References
- 1.DeVita VJ, Laurence TS & Rosenberg SA DeVita, Hellmann and Rosenberg’s Cancer: Principles & Practice of Oncology 11th edn (Wolters Kluwer, 2019). [Google Scholar]
- 2.Araki K & Miyoshi Y Mechanism of resistance to endocrine therapy in breast cancer: the important role of PI3K/Akt/mTOR in estrogen receptor-positive, HER2-negative breast cancer. Breast Cancer 25, 392–401 (2018). [DOI] [PubMed] [Google Scholar]
- 3.Brandhorst S et al. A periodic diet that mimics fasting promotes multi-system regeneration, enhanced cognitive performance, and healthspan. Cell Metab. 22, 86–99 (2015). [DOI] [PMC free article] [PubMed] [Google Scholar]
- 4.Di Biase S et al. Fasting-mimicking diet reduces HO-1 to promote T cell-mediated tumor cytotoxicity. Cancer Cell 30, 136–146 (2016). [DOI] [PMC free article] [PubMed] [Google Scholar]
- 5.Wei M et al. Fasting-mimicking diet and markers/risk factors for aging, diabetes, cancer, and cardiovascular disease. Sci. Transl. Med 9, eaai8700 (2017). [DOI] [PMC free article] [PubMed] [Google Scholar]
- 6.AlFakeeh A & Brezden-Masley C Overcoming endocrine resistance in hormone receptor-positive breast cancer. Curr. Oncol 25, S18–S27 (2018). [DOI] [PMC free article] [PubMed] [Google Scholar]
- 7.Lee AV, Cui X & Oesterreich S Cross-talk among estrogen receptor, epidermal growth factor, and insulin-like growth factor signaling in breast cancer. Clin. Cancer Res 7, 4429s–4435s (2001). [PubMed] [Google Scholar]
- 8.Sachs N et al. A living biobank of breast cancer organoids captures disease heterogeneity. Cell 172, 373–386 (2018). [DOI] [PubMed] [Google Scholar]
- 9.Jones JI & Clemmons DR Insulin-like growth factors and their binding proteins: biological actions. Endocr. Rev 16, 3–34 (1995). [DOI] [PubMed] [Google Scholar]
- 10.Garofalo C, Sisci D & Surmacz E Leptin interferes with the effects of the antiestrogen ICI 182,780 in MCF-7 breast cancer cells. Clin. Cancer Res 10, 6466–6475 (2004). [DOI] [PubMed] [Google Scholar]
- 11.Sánchez-Jiménez F, Pérez-Pérez A, de la Cruz-Merino L & Sánchez-Margalet V Obesity and breast cancer: role of leptin. Front. Oncol 9, 596 (2019). [DOI] [PMC free article] [PubMed] [Google Scholar]
- 12.Hopkins BD et al. Suppression of insulin feedback enhances the efficacy of PI3K inhibitors. Nature 560, 499–503 (2018). [DOI] [PMC free article] [PubMed] [Google Scholar]
- 13.Pollak M The insulin and insulin-like growth factor receptor family in neoplasia: an update. Nat. Rev. Cancer 12, 159–169 (2012). [DOI] [PubMed] [Google Scholar]
- 14.Jardé T, Perrier S, Vasson MP & Caldefie-Chézet F Molecular mechanisms of leptin and adiponectin in breast cancer. Eur. J. Cancer 47, 33–43 (2011). [DOI] [PubMed] [Google Scholar]
- 15.Saxena NK et al. Concomitant activation of the JAK/STAT, PI3K/AKT, and ERK signaling is involved in leptin-mediated promotion of invasion and migration of hepatocellular carcinoma cells. Cancer Res. 67, 2497–2507 (2007). [DOI] [PMC free article] [PubMed] [Google Scholar]
- 16.Cristofanilli M et al. Fulvestrant plus palbociclib versus fulvestrant plus placebo for treatment of hormone-receptor-positive, HER2-negative metastatic breast cancer that progressed on previous endocrine therapy (PALOMA-3): final analysis of the multicentre, double-blind, phase 3 randomised controlled trial. Lancet Oncol. 17, 425–439 (2016). [DOI] [PubMed] [Google Scholar]
- 17.Lasham A et al. A novel EGR-1 dependent mechanism for YB-1 modulation of paclitaxel response in a triple negative breast cancer cell line. Int. J. Cancer 139, 1157–1170 (2016). [DOI] [PubMed] [Google Scholar]
- 18.Shajahan-Haq AN et al. EGR1 regulates cellular metabolism and survival in endocrine resistant breast cancer. Oncotarget 8, 96865–96884 (2017). [DOI] [PMC free article] [PubMed] [Google Scholar]
- 19.Di Biase S et al. Fasting regulates EGR1 and protects from glucose- and dexamethasone-dependent sensitization to chemotherapy. PLoS Biol. 15, e2001951 (2017). [DOI] [PMC free article] [PubMed] [Google Scholar]
- 20.Di Leva G et al. Estrogen mediated-activation of miR-19¼25 cluster modulates tumorigenicity of breast cancer cells depending on estrogen receptor status. PLoS Genet. 9, e1003311 (2013). [DOI] [PMC free article] [PubMed] [Google Scholar]
- 21.Hawley SA et al. Phosphorylation by Akt within the ST loop of AMPK-α1 down-regulates its activation in tumour cells. Biochem. J 459, 275–287 (2014). [DOI] [PMC free article] [PubMed] [Google Scholar]
- 22.Arends J et al. ESPEN guidelines on nutrition in cancer patients. Clin. Nutr 36, 11–48 (2017). [DOI] [PubMed] [Google Scholar]
- 23.Grundmann O, Yoon SL & Williams JJ The value of bioelectrical impedance analysis and phase angle in the evaluation of malnutrition and quality of life in cancer patients—a comprehensive review. Eur. J. Clin. Nutr 69, 1290–1297 (2015). [DOI] [PubMed] [Google Scholar]
- 24.Turner NC et al. Palbociclib in hormone-receptor-positive advanced breast cancer. N. Engl. J. Med 373, 209–219 (2015). [DOI] [PubMed] [Google Scholar]
- 25.Creighton CJ et al. Insulin-like growth factor-I activates gene transcription programs strongly associated with poor breast cancer prognosis. J. Clin. Oncol 26, 4078–4085 (2008). [DOI] [PMC free article] [PubMed] [Google Scholar]
- 26.Karey KP & Sirbasku DA Differential responsiveness of human breast cancer cell lines MCF-7 and T47D to growth factors and 17 beta-estradiol. Cancer Res. 48, 4083–4092 (1988). [PubMed] [Google Scholar]
- 27.Baselga J et al. Everolimus in postmenopausal hormone-receptor-positive advanced breast cancer. N. Engl. J. Med 366, 520–529 (2012). [DOI] [PMC free article] [PubMed] [Google Scholar]
- 28.André F et al. Alpelisib for PIK3CA-Mutated, hormone receptor-positive advanced breast cancer. N. Engl. J. Med 380, 1929–1940 (2019). [DOI] [PubMed] [Google Scholar]
- 29.Hu R, Hilakivi-Clarke L & Clarke R Molecular mechanisms of tamoxifen-associated endometrial cancer (Review). Oncol. Lett 9, 1495–1501 (2015). [DOI] [PMC free article] [PubMed] [Google Scholar]
- 30.Piacente F et al. Nicotinic acid phosphoribosyltransferase regulates cancer cell metabolism, susceptibility to NAMPT inhibitors, and DNA repair. Cancer Res. 77, 3857–3869 (2017). [DOI] [PubMed] [Google Scholar]
- 31.Caffa I et al. Fasting potentiates the anticancer activity of tyrosine kinase inhibitors by strengthening MAPK signaling inhibition. Oncotarget 6, 11820–11832 (2015). [DOI] [PMC free article] [PubMed] [Google Scholar]
- 32.Ciribilli Y et al. The coordinated p53 and estrogen receptor cis-regulation at an FLT1 promoter SNP is specific to genotoxic stress and estrogenic compound. PLoS One 5, e10236 (2010). [DOI] [PMC free article] [PubMed] [Google Scholar]
- 33.Liu CY et al. Tamoxifen induces apoptosis through cancerous inhibitor of protein phosphatase 2A-dependent phospho-Akt inactivation in estrogen receptor-negative human breast cancer cells. Breast Cancer Res. 16, 431 (2014). [DOI] [PMC free article] [PubMed] [Google Scholar]
- 34.Massarweh S et al. Tamoxifen resistance in breast tumors is driven by growth factor receptor signaling with repression of classic estrogen receptor genomic function. Cancer Res. 68, 826–833 (2008). [DOI] [PubMed] [Google Scholar]
- 35.Mishra AK, Abrahamsson A & Dabrosin C Fulvestrant inhibits growth of triple negative breast cancer and synergizes with tamoxifen in ERα positive breast cancer by up-regulation of ERβ. Oncotarget 7, 56876–56888 (2016). [DOI] [PMC free article] [PubMed] [Google Scholar]
- 36.Ikeda H et al. Combination treatment with fulvestrant and various cytotoxic agents (doxorubicin, paclitaxel, docetaxel, vinorelbine, and 5-fluorouracil) has a synergistic effect in estrogen receptor-positive breast cancer. Cancer Sci. 102, 2038–2042 (2011). [DOI] [PubMed] [Google Scholar]
- 37.Massarweh S et al. Mechanisms of tumor regression and resistance to estrogen deprivation and fulvestrant in a model of estrogen receptor-positive, HER-2/neu-positive breast cancer. Cancer Res. 66, 8266–8273 (2006). [DOI] [PubMed] [Google Scholar]
- 38.Vijayaraghavan S et al. CDK4/6 and autophagy inhibitors synergistically induce senescence in Rb positive cytoplasmic cyclin E negative cancers. Nat. Commun 8, 15916 (2017). [DOI] [PMC free article] [PubMed] [Google Scholar]
- 39.Cook Sangar ML et al. Inhibition of CDK4/6 by palbociclib significantly extends survival in medulloblastoma patient-derived xenograft mouse models. Clin. Cancer Res 23, 5802–5813 (2017). [DOI] [PMC free article] [PubMed] [Google Scholar]
- 40.Michaloglou C et al. Combined inhibition of mTOR and CDK4/6 is required for optimal blockade of E2F function and long-term growth inhibition in estrogen receptor-positive breast cancer. Mol. Cancer Ther 17, 908–920 (2018). [DOI] [PMC free article] [PubMed] [Google Scholar]
- 41.Lee C et al. Reduced levels of IGF-I mediate differential protection of normal and cancer cells in response to fasting and improve chemotherapeutic index. Cancer Res. 70, 1564–1572 (2010). [DOI] [PMC free article] [PubMed] [Google Scholar]
- 42.Ahima RS et al. Role of leptin in the neuroendocrine response to fasting. Nature 382, 250–252 (1996). [DOI] [PubMed] [Google Scholar]
- 43.Lee C et al. Fasting cycles retard growth of tumors and sensitize a range of cancer cell types to chemotherapy. Sci. Transl. Med 4, 124ra27 (2012). [DOI] [PMC free article] [PubMed] [Google Scholar]
- 44.Arends J et al. ESPEN expert group recommendations for action against cancer-related malnutrition. Clin. Nutr 36, 1187–1196 (2017). [DOI] [PubMed] [Google Scholar]
- 45.Reidy PT et al. Protein blend ingestion following resistance exercise promotes human muscle protein synthesis. J. Nutr 143, 410–416 (2013). [DOI] [PMC free article] [PubMed] [Google Scholar]
- 46.Rossi F, Valdora F, Barabino E, Calabrese M & Tagliafico AS Muscle mass estimation on breast magnetic resonance imaging in breast cancer patients: comparison between psoas muscle area on computer tomography and pectoralis muscle area on MRI. Eur. Radiol 29, 494–500 (2019). [DOI] [PubMed] [Google Scholar]
Associated Data
This section collects any data citations, data availability statements, or supplementary materials included in this article.
Supplementary Materials
Data Availability Statement
All data generated or analysed during this study are included in this published Article (and its Supplementary Information files). All microarray data are available through the Gene Expression Omnibus database (http://www.ncbi.nlm.nih.gov/geo/) using the accession number GSE121378. Source data are provided with this paper.


