

Abstract
N6‐methyladenosine (m6A) regulates a variety of physiological processes through modulation of RNA metabolism. This modification is particularly enriched in the nervous system of several species, and its dysregulation has been associated with neurodevelopmental defects and neural dysfunctions. In Drosophila, loss of m6A alters fly behavior, albeit the underlying molecular mechanism and the role of m6A during nervous system development have remained elusive. Here we find that impairment of the m6A pathway leads to axonal overgrowth and misguidance at larval neuromuscular junctions as well as in the adult mushroom bodies. We identify Ythdf as the main m6A reader in the nervous system, being required to limit axonal growth. Mechanistically, we show that the m6A reader Ythdf directly interacts with Fmr1, the fly homolog of Fragile X mental retardation RNA binding protein (FMRP), to inhibit the translation of key transcripts involved in axonal growth regulation. Altogether, this study demonstrates that the m6A pathway controls development of the nervous system and modulates Fmr1 target transcript selection.
Keywords: Fmr1, m6A, nervous system, RNA modification, Ythdf
Subject Categories: Neuroscience, RNA Biology, Protein Biosynthesis & Quality Control
Proper neuromuscular junction formation in flies depends on a key mRNA modification guiding translational repression by the Fragile X mental retardation (FMRP) RNA‐binding protein.

Introduction
Chemical modifications on DNA and histones impact gene expression during cell differentiation, organismal development, and in several other biological programs (Jaenisch & Bird, 2003). Similarly, RNA modifications are an important, recently characterized layer of gene regulation but their functional characterization during development and in other biological/pathological processes is still in its infancy (Hsu et al, 2017).
N6‐methyladenosine (m6A) is the most prevalent modification found in mRNAs and long non‐coding RNAs. The mark is widely conserved, enriched in mRNAs at the beginning of the last exons, in the sequence context RRACH (where R = A or G and H = A, C, or U) (Dominissini et al, 2012; Meyer et al, 2012; Ke et al, 2015; Garcia‐Campos et al, 2019). m6A plays a central role in modulating RNA function, since it can influence many aspects of RNA life such as splicing, export, translation, and decay (Roignant & Soller, 2017; Zhao et al, 2017). m6A deposition is operated by a multisubunit methyltransferase complex, composed of METTL3 and METTL14, as well as several associated components (reviewed in ref. Lence et al, 2019). The m6A signature is subsequently recognized by “reader” proteins, among which the best described is the YTH domain family of proteins that decode the signal and mediate m6A biological effects (Liao et al, 2018; Patil et al, 2018).
Increasing evidence suggests a central role of m6A during nervous system development and functions (Angelova et al, 2018; Jung & Goldman, 2018; Widagdo & Anggono, 2018; Du et al, 2019; Li et al, 2019; Livneh et al, 2020). m6A is present at particularly high levels in the nervous system of different model animals (Meyer et al, 2012; Lence et al, 2016), and these levels can vary following behavioral stimuli or sensory experience (Widagdo et al, 2016; Engel et al, 2018; Koranda et al, 2018; Yoon et al, 2018). In mouse, m6A controls brain development (Li et al, 2017; Li et al, 2018; Ma et al, 2018; Wang et al, 2018; Chen et al, 2019; Zhuang et al, 2019) and is also required for axon regeneration (Weng et al, 2018) and synaptic functions (Engel et al, 2018; Koranda et al, 2018; Merkurjev et al, 2018; Shi et al, 2018; Yu et al, 2018). Similarly, in Drosophila, m6A promotes flight and locomotion via a neuronal function (Haussmann et al, 2016; Lence et al, 2016; Kan et al, 2017; Lence et al, 2017). A proper level of m6A appears critical for regulating axonal growth as Mettl3 knock out (KO) in Drosophila has been associated with axonal overgrowth at neuromuscular junctions (NMJs) (Lence et al, 2016), and conversely, higher m6A (or m6Am) produced by the loss of FTO, leads to shorter axonal length in mouse dorsal root ganglia neurons (Yu et al, 2018). To date, the underlying mechanism of m6A in axonal growth has remained elusive.
Fragile X mental retardation protein (FMRP) is a polyribosome‐associated RNA binding protein (RBP) that negatively regulates the translation of a subset of dendritic mRNAs (Laggerbauer et al, 2001; Li et al, 2001; Darnell et al, 2011; Jacquemont et al, 2018). Additional functions in splicing, export, and mRNA stability have also been reported for this RBP (Davis & Broadie, 2017). The loss of FMRP is the genetic cause of Fragile X syndrome (FXS), the most common inherited form of intellectual disability and autism, with an estimated prevalence of 1 in 4,000 males and 1 in 8,000 females (Garber et al, 2006; Rousseau et al, 2011; Bagni & Zukin, 2019). Previous high‐throughput studies identified only short consensus sites for FMRP binding (ACUK, WGGA, GAC sequences; K = G or U, W = A or U), suggesting that additional elements provide the binding specificity (Suhl et al, 2014). Intriguingly, FMRP was recently identified as a putative m6A reader in mammalian cells via unbiased proteomics studies (Arguello et al, 2017; Edupuganti et al, 2017). Furthermore, FMRP target mRNAs were shown to largely overlap with methylated transcripts (Chang et al, 2017), and FMRP was found to modulate their export to the cytoplasm (Edens et al, 2019; Hsu et al, 2019), as well as their stability (Zhang et al, 2018). These studies indicate roles for FMRP in modulating m6A function in the nervous system. However, the physiological relevance of this crosstalk in the context of the FXS has yet to be evaluated. Moreover, it remains to be determined how FMRP interplays with other m6A readers.
In the present study, we seek to obtain mechanistic insights into the role of m6A in Drosophila neurodevelopment. We found that, in addition to controlling axonal growth at neuromuscular junctions (NMJs), m6A prevents axonal crossing and β‐lobe fusion of the neurons in the mushroom bodies (MBs), a higher hierarchy circuit of the central brain implicated in a wide range of fly behaviors, including learning and memory. By using an unbiased approach to identify m6A readers in the Drosophila nervous system, we demonstrate that Ythdf, the unique cytoplasmic YTH protein in Drosophila, recognizes methylated transcripts and mediates m6A function in restricting axonal growth. We further show that Ythdf directly interacts with Fmr1, the Drosophila FMRP homolog, and modulates its binding activity. Ythdf and Fmr1 share common targets related to nervous system development and act in concert to inhibit the translation of positive regulators of axonal growth. Thus, this study demonstrates that Fmr1 function in axonal growth is modulated by its interaction with the m6A reader Ythdf, providing mechanistic insight on this interplay and possibly novel avenues for therapeutic approaches of the FXS.
Results
m6A restricts axonal growth at the peripheral and central nervous system
Previous studies demonstrated that m6A controls several aspects of neuronal development and behavior in Drosophila melanogaster (Haussmann et al, 2016; Lence et al, 2016; Kan et al, 2017). In particular, flies lacking Mettl3 are flightless and have reduced speed and orientation defects (Lence et al, 2016). Furthermore, an increased number of synaptic boutons was detected at mutant NMJs. To confirm and extend this initial analysis, we dissected additional alleles of Mettl3, as well as of Mettl14, and scored the number of synapses, branches, and the overall size of the axons. Consistent with our previous report, we observed an augmentation of synaptic bouton number of about 40% to 50%, depending on Mettl3 allelic combinations (Fig EV1A and Appendix Fig S1). Furthermore, Mettl3 mutants displayed significant axonal overgrowth and over‐elaboration of synaptic terminals (Figs 1C and D, and EV1B and C). Importantly, all these defects were completely rescued upon ubiquitous expression of Mettl3 cDNA. Consistent with Mettl3 loss‐of‐function phenotypes, the Mettl14 KO gave identical defects (Fig 1A–D). Thus, these results indicate that m6A is required for normal NMJ synaptic architecture in Drosophila.
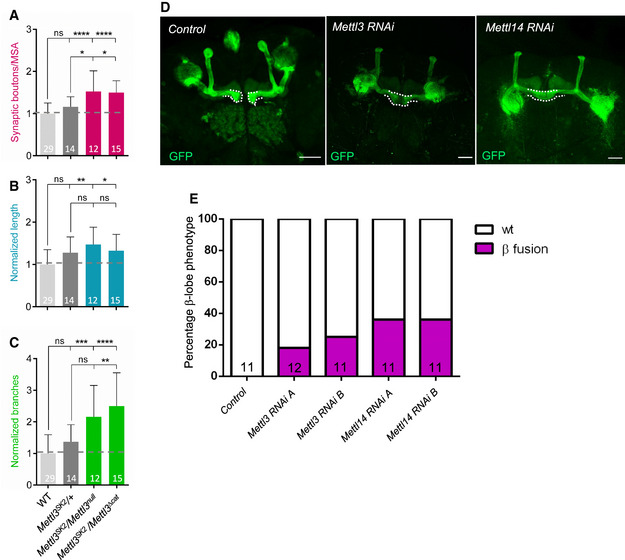
Figure EV1. m6A writer components control axonal growth at NMJ and MB.
-
A–CQuantification of normalized bouton number (A, total number of boutons/muscle surface area (μm2 × 1,000)), normalized axon length (B), and normalized branching (C) of muscle‐6/7 NMJ in hemisegments A2‐A3 of the indicated genotypes. Bars show mean ± s.e.m. Multiple comparisons were performed using one‐way ANOVA with a post hoc Sidak–Bonferroni correction (n.s. = not significant; *P < 0.05; **P < 0.01; ***P < 0.001; ****P < 0.0001).
-
DAnalysis of adult control c772Gal:UAS‐CD8,GFP, c772Gal:UAS‐CD8,GFP:Mettl3 RNAi (v20969) and c772Gal:UAS‐CD8,GFP:Mettl14 RNAi (v48560) MB in the brains by visualization of the membrane GFP autofluorescence. White dashed lines highlight the normal and fused β‐lobes. Scale bar 50 μm.
-
EQuantification of the penetrance of β‐lobe fusion phenotype in the following genotypes: control (c772Gal:UAS‐CD8,GFP/+), c772Gal:UAS‐CD8,GFP:Mettl3 RNAi (v20968) indicated as RNAi A, c772Gal:UAS‐CD8,GFP:Mettl3 RNAi (v20969) indicated as RNAi B, c772Gal:UAS‐CD8,GFP:Mettl14 RNAi (v13542) indicated as RNAi A and c772Gal:UAS‐CD8,GFP:Mettl14 RNAi (v48560) indicated as RNAi B.
Data information: In (A–C, E), bars are labeled with the number of replicates.
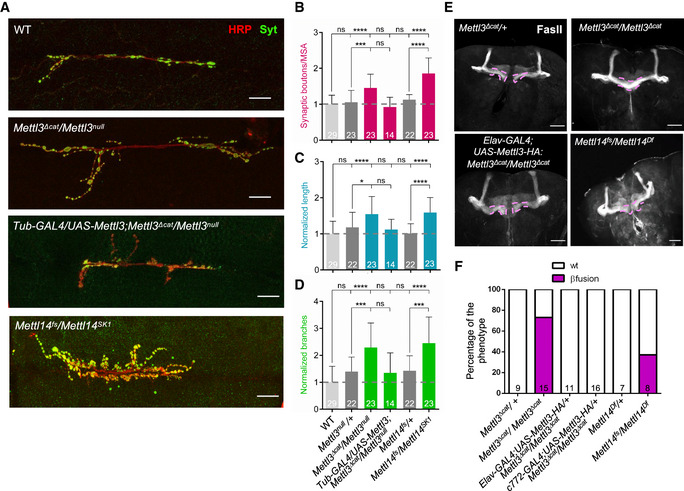
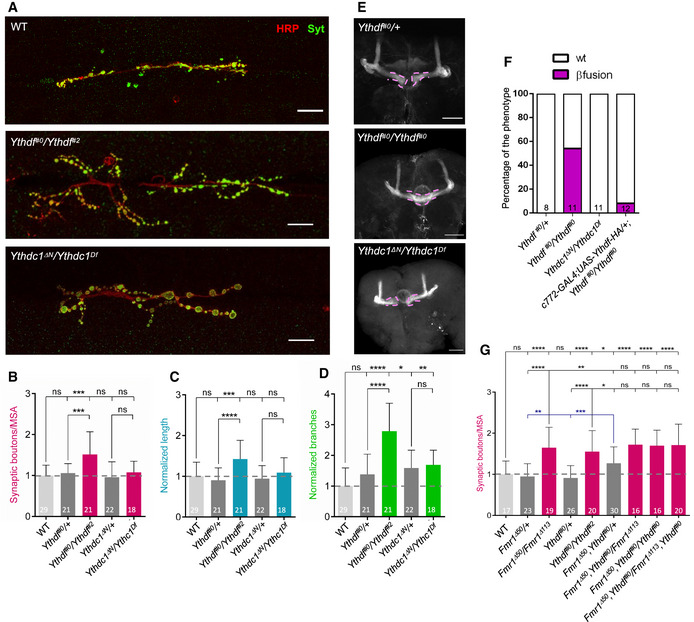
Figure 1. m6A regulates axonal growth and guidance in the Drosophila nervous system.
-
ARepresentative confocal images of muscle‐6/7 NMJ synapses of abdominal hemisegments A2–A3 for the indicated genotypes labeled with anti‐synaptotagmin (green) and HRP (red) to reveal the synaptic vesicles and the neuronal membrane. Scale bar: 20 μm.
-
B–DQuantification of normalized bouton number ((B), total number of boutons/muscle surface area (μm2 × 1,000)), normalized axon length (C), and normalized branching (D) of NMJ 6/7 in A2–A3 of the indicated genotypes. Bars show mean ± s.e.m. Multiple comparisons were performed using one‐way ANOVA with a post hoc Sidak–Bonferroni correction. (n.s. = not significant; *P < 0.05; ***P < 0.001; ****P < 0.0001).
-
EImmunofluorescence analysis of adult brains for the indicated genotypes using anti‐Fascilin II (FasII) antibody to visualize lobes of the MB. Pink dashed lines highlight the normal and fused β‐lobes. Scale bar 50 μm.
-
FQuantification of the penetrance of fusion phenotype in the indicated genotypes.
Data information: In (B–D, F), bars are labeled with the number of replicates.
Source data are available online for this figure.
We next asked whether m6A was also required for the integrity of the central nervous system (CNS). We dissected adult brains of control and fly mutants for the m6A pathway and examined the structure of MBs. Compared to wild‐type flies, the MBs of Mettl3 and Mettl14 KOs exhibited midline crossing and fusion of the β lobes (Fig 1E). The penetrance varied from 37% to 73%, depending on the alleles (Fig 1F). A similar defect was observed upon inactivation of Mettl3 or Mettl14 specifically in the MB using RNAi (Fig EV1D and E), suggesting a cell‐autonomous requirement of m6A. Furthermore, expression of Mettl3 cDNA either ubiquitously, pan‐neuronally, or in the MBs only, was sufficient to rescue the β lobe overgrowth, confirming the specificity and the cell‐autonomous nature of the phenotype (Fig 1E and F). We conclude that m6A limits axonal growth in the peripheral and central nervous system.
Fmr1 and Ythdf bind to methylated sites with different specificity
To decipher the mechanisms underlying the role of the m6A pathway in the nervous system, we aimed to identify the proteins that mediate m6A function in this tissue. We carried out RNA pulldowns in Drosophila neuronal cell lysates followed by quantitative mass spectrometry‐based proteomics, as described before (Edupuganti et al, 2017). Briefly, a methylated RNA probe containing four repeats of the m6A consensus sequence GGACU was mixed with lysates from BG3 cells, which were derived from the larval CNS (Ui et al, 1994). As control, we used the same probe lacking the methylation. After pulldown, bound proteins were subjected to trypsin digestion and analyzed by liquid chromatography–tandem mass spectrometry (LC‐MS/MS). Using this approach, we identified eight proteins that were significantly enriched with the methylated probe (Fig 2A and Dataset EV1). As anticipated, the two YTH domain‐containing proteins were among the most strongly enriched. Furthermore, we also found Fmr1, whose mammalian homolog was similarly shown to preferentially bind a methylated probe (Arguello et al, 2017; Edupuganti et al, 2017).
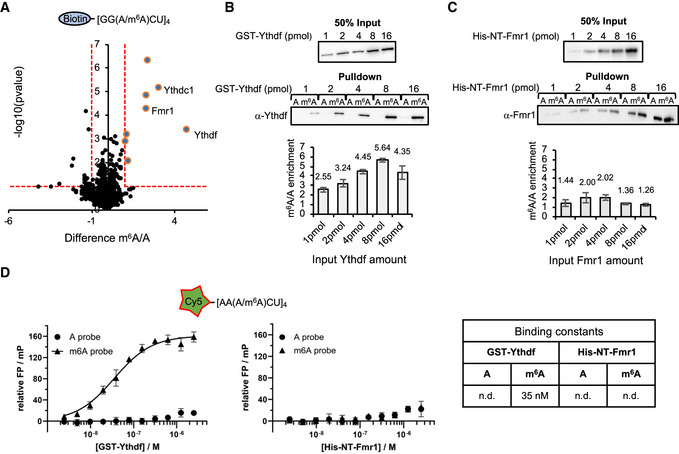
Figure 2. Ythdf and Fmr1 binding behavior to methylated RNA probes.
-
AResults of m6A RNA pulldown in BG3 protein cell extracts. Pulldown were performed using biotinylated probes containing four m6A consensus sites (GGACU), with or without the methylation. The P‐value is calculated from a two‐sided t‐test with unequal variants (Welch t‐test). Dashed lines represent −log10 P‐value = 1 as well as log2 enrichment = 1. m6A‐enriched proteins (−log10 P‐value > 1 and log2 enrichment > 1) are depicted by bigger dots.
-
B, CWestern blot showing the protein enrichments upon pulldown of the same probes as in (A) incubated with increasing concentrations of purified recombinant GST‐Ythdf (B) and His‐NT‐Fmr1 proteins (C). Quantification of the m6A/A signal intensity is shown below the blot as median ± SEM of the triplicates. Both proteins bind more efficiently upon methylation.
-
DResults of fluorescence polarization (FP) assay using Cy5 labeled RNA probes containing four AAACU m6A consensus sites, with or without the methylation, incubated with GST‐Ythdf and His‐NT‐Fmr1. The relative FP values from three independent experiments including standard deviation were plotted using GraphPad Prism 8. Binding constants (kd values) were determined by fitting a Michaelis–Menten non‐linear regression onto the relative FP values in GraphPad Prism 8, if applicable. The respective binding constants are given in the table next to the graphs.
Source data are available online for this figure.
Given that binding of Ythdc1 to a methylated probe was already confirmed in vitro (Kan et al, 2017), we further aimed to address whether Ythdf and Fmr1 bear the same specificity. Therefore, we purified recombinant GST‐tagged Ythdf as well as His‐tagged Fmr1 lacking the first 219 N‐terminal amino acids (as the full‐length version is very unstable, also described in (Chen et al, 2014)) and tested their ability to bind the different probes. Consistent with our pulldown assay from cell lysates, we found that both purified GST‐Ythdf and His‐Fmr1 bound preferentially to the methylated probe (Fig 2B and C). By incubating RNA probes with different concentrations of purified proteins, we found that the binding of Ythdf was highly specific at all used concentrations. In contrast, binding of Fmr1 was only slightly enriched in the m6A probe pulldown, as compared to the pulled down in the absence of methylation. Interestingly, the specificity for the m6A modified probe decreased with high level (16pmol) of either protein.
We also tested the binding behavior on RNA probes containing repeats of the alternative m6A consensus AAACU. In this case, Fmr1 displayed no specific binding to neither the methylated probe nor the non‐methylated probe. Ythdf still bound with higher specificity the methylated probe, though a milder background binding to the unmethylated probe was also observed (Fig EV2). We confirmed this result by performing fluorescence polarization assays using Cy5 labeled RNA probes and calculated the binding constants of the Ythdf/Fmr1 RNA interaction (Fig 2D). While a strong binding of Ythdf to the m6A probe (K d = 35 nM) could be determined, no binding to the unmethylated probe was observed. In line with the previous findings, Fmr1 did not bind any of the probes. We conclude that the binding of Fmr1 to m6A consensus sequences is largely sequence‐dependent, which is in line with previous pulldown experiments in human cells (Edupuganti et al, 2017) and with a recent study showing that only a fraction of methylated sites is recognized by human FMRP (Hsu et al, 2019).
Figure EV2. Binding behavior of Ythdf and Fmr1 on RNA probe in the AAACU sequence context.
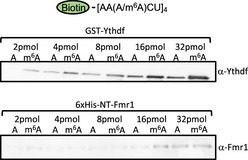
Results of m6A RNA pulldown using RNA probes. Pulldown were performed using biotinylated probes containing four AAACU m6A consensus sites, with or without the methylation and recombinant purified GST‐Ythdf and His‐NT‐Fmr1 proteins. Ythdf binds more efficiently upon methylation, while Fmr1 does not show specificity for any of the probes.
Fmr1 and Ythdf limit axonal growth
The Fmr1 loss of function was previously shown to give overgrowth at NMJs, as well as fusion of MB β lobes (Appendix Fig S2 and Zhang et al, 2001; Michel et al, 2004), suggesting that it could mediate the m6A axonal growth function. To address whether Ythdc1 and/or Ythdf also control NMJ morphology, we dissected third instar larvae carrying mutations in the Yth genes. Using our previously described Ythdc1 allele combined over a deficiency line spanning the locus, we did not detect any gross morphological defect (Fig 3A–D). To address the contribution of Ythdf, we generated mutant alleles using the CRISPR/Cas9 approach (Appendix Fig S1). Examination of the NMJs in the trans‐heterozygote flies revealed significant overgrowth compared to control flies (Fig 3A–D). Thus, these results indicate that in addition to Fmr1, Ythdf may also contribute to the m6A‐dependent regulation of NMJ morphology.
Figure 3. Ythdf and Fmr1 interact genetically to control axonal growth.
-
ARepresentative confocal images of muscle‐6/7 NMJ synapses of abdominal hemisegments A2‐A3 for the indicated genotypes labeled with anti‐synaptotagmin (green) and HRP (red) to reveal the synaptic vesicles and the neuronal membrane. Scale bar: 20 μm.
-
B–DQuantification of normalized bouton number ((B), total number of boutons/muscle surface area (μm2 × 1,000)), normalized axon length (C), and normalized branching (D) of NMJ 6/7 in A2‐A3 of the indicated genotypes. Bars show mean ± s.e.m. Multiple comparisons were performed using one‐way ANOVA with a post hoc Sidak–Bonferroni correction (n.s. = not significant; *P < 0.05; **P < 0.01; ***P < 0.001; ****P < 0.0001).
-
EImmunofluorescence analysis of adult brains for the indicated genotypes using anti‐Fascilin II (FasII) antibody to visualize lobes of the MB. Pink dashed lines highlight the normal and fused β‐lobes. Scale bar 50 μm.
-
FQuantification of the penetrance of fusion phenotype in the indicated genotypes.
-
GQuantification of normalized bouton number (total number of boutons/muscle surface area (μm2 × 1,000)), of NMJ 6/7 in A2‐A3 of the indicated genotypes. Bars show mean ± s.e.m. Multiple comparisons were performed using one‐way ANOVA with a post hoc Sidak–Bonferroni correction (n.s. = not significant; *P < 0.05; **P < 0.01; ***P < 0.001; ****P < 0.0001).
Data information: In (B–D, F, G), bars are labeled with the number of replicates.
Source data are available online for this figure.
To address the role of YTH proteins in the CNS, we dissected adult brains of control and fly mutants for the respective Yth genes and examined the MB structure. Compared to control flies, Ythdf KO brains show a substantial fusion of the β lobes (55%), mimicking the loss of Mettl3 and Mettl14 (Fig 3E and F). This defect was rescued upon Ythdf re‐expression. In contrast, the lack of Ythdc1 displayed no visible defect. Altogether, these results indicate that the m6A pathway controls axonal growth, both at NMJs and MBs, possibly via Fmr1 and Ythdf.
Ythdf interacts physically and genetically with Fmr1
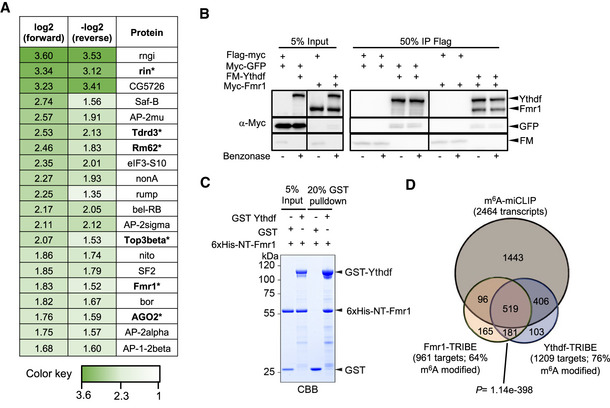
To address how Ythdf prevents overgrowth at NMJs and MBs, we searched for co‐factors using stable isotope dimethyl labeling‐based quantitative proteomics upon immunoprecipitation of Flag‐tagged Ythdf from S2R+ cells, which is an embryonic derived cell line. We identified 51 factors that showed more than two‐fold enrichment in the Flag‐Ythdf pulldown fraction in comparison to a control pulldown (Appendix Fig S3A and Dataset EV2). The co‐purified proteins were especially enriched for RNA binding proteins and translation regulators (Appendix Fig S3B). Interestingly, Fmr1 was among the 20 most enriched proteins (Fig 4A). In fact, several proteins previously shown to interact with Fmr1 were also pulled down with Flag‐Ythdf (Fig 4A, highlighted in bold; Ishizuka et al, 2002; Sahoo et al, 2018; Xu et al, 2013), suggesting that Ythdf may be part of a whole Fmr1 complex.
Figure 4. Fmr1 and Ythdf physically interact and share common targets.
-
AHeatmap indicating the normalized forward versus inverted reverse experiment enrichments on a log2 scale of quantitative proteomics upon pulldown of Flag‐tagged Ythdf in S2R+ cells. The threshold was set to a 1‐fold enrichment. Fmr1 is co‐purified with Ythdf. Known Fmr1 interacting proteins are highlighted in bold with asterisk.
-
BCo‐immunoprecipitation experiment in S2R+ cells co‐expressing Flag‐Myc‐tagged Ythdf and Myc‐tagged Fmr1. Ythdf was used as a bait via its Flag tag. The lysate was treated with Benzonase as indicated to remove interactions enabled by RNA.
-
CGST pulldown of recombinant GST‐Ythdf or GST alone mixed with recombinant 6xHis‐NT‐Fmr1. 2 µM of recombinant proteins were using during the pulldown. The pulldown of the proteins was analyzed by CBB staining.
-
DOverlap of miCLIP dataset generated in S2R+ cells defining m6A modified transcripts with Fmr1 and Ythdf mRNA targets determined by TRIBE in S2R+ cells. The indicated P‐value was determined by hypergeometric test.
Source data are available online for this figure.
To validate the co‐existence of Ythdf and Fmr1 in the same complex, we performed co‐immunoprecipitation assays in S2R+ cells ectopically expressing Flag‐Myc‐tagged Ythdf and Myc‐tagged Fmr1 in the presence of Benzonase. Notably, these experiments confirmed that Fmr1 and Ythdf co‐precipitate, independently of RNA (Fig 4B). To next address whether these two proteins interact directly, we tested whether purified recombinant GST‐tagged Ythdf and Fmr1 proteins could pull down each other. As shown in Fig 4C, Fmr1 could be co‐purified by pulling down GST‐Ythdf but not GST alone, indicating that Ythdf and Fmr1 directly interact.
To address whether Ythdf and Fmr1 interact to regulate axonal growth at the NMJ, we performed epistasis experiments. While single heterozygote larvae displayed normal NMJ architecture, we found that double heterozygotes had a significant increase in the number of synaptic boutons (Fig 3G, compare lanes 2 and 4 with lane 6). Furthermore, the severity of the axonal growth defect observed in each homozygote mutants was not increased by removing one or two copies of the other genes (Fig 3G, compare lanes 2 and 5 with lanes 7, 8 and 9). These epistasis experiments thus suggest that both genes act in the same pathway to regulate the NMJ phenotype.
Ythdf and Fmr1 regulate translation of similar targets
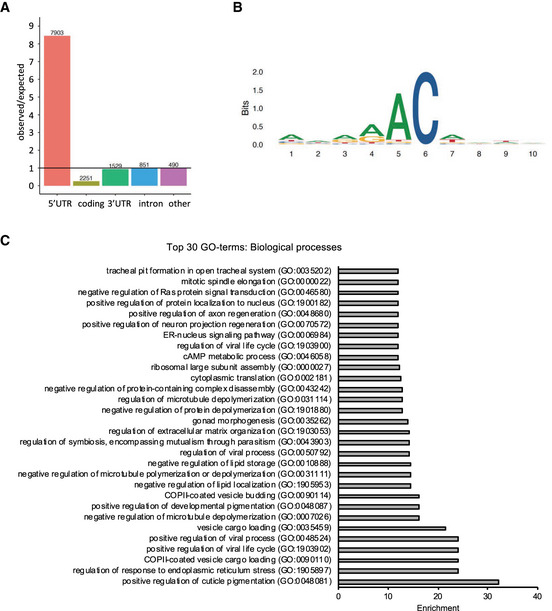
In order to identify Ythdf and Fmr1 mRNA targets, we used the TRIBE approach, as previously described (Worpenberg et al, 2019). Briefly, metal‐inducible fusion constructs expressing Ythdf‐cdAdar, Fmr1‐cdAdar, or cdAdar alone were transfected in S2R+ cells and RNA was isolated for sequencing 2 days after the induction of the constructs. Bound mRNA targets were identified by scoring A‐I editing events obtained after comparison with unspecific events generated by cdAdar alone. Using a stringent cutoff, we identified 1209 Ythdf and 961 Fmr1 targets, with a significant degree of overlap (n = 700, P = 1.14e‐398; Fig 4D, Dataset EV3). To address whether these targets were methylated, we performed miCLIP‐seq using S2R+ cell extracts. We identified 2,464 methylated transcripts (about 34% of expressed genes), with strong enrichment of m6A sites within 5’ UTR, in the sequence context AAACA (Fig EV3A and B; Dataset EV4). This profile is distinct from vertebrate and is consistent with an earlier report (Kan et al, 2017). Among methylated transcripts, 925 were common with Ythdf (76% of Ythdf targets) and 615 with Fmr1 (64% of Fmr1 targets; Fig 4D). Even though S2R+ cells do not have a neural origin, common methylated targets were enriched for axon regeneration (Fig EV3C). Moreover, consistent with the in vivo phenotypes, genes enriched for regulation of microtubule depolymerization were overrepresented. Altogether, these experiments identify common methylated targets for Ythdf and Fmr1, confirming they could act together to regulate gene expression.
Figure EV3. miCLIP analysis from S2R+ cells.
-
ARelative enrichment of m6A peaks across transcript segments identified by miCLIP. The numbers above the bars correspond to the number of m6A sites determined as described in the materials and methods section. In total, a set of 13024 C‐to‐T conversions CIMS and AC truncation CITS across 2464 genes was identified.
-
BSequence logo of deduced consensus motif for m6A peaks centered on the modified adenosine.
-
CTop 30 enriched Gene ontology (GO)‐terms of biological processes for the gene set of m6A modified and Fmr1‐ and Ythdf‐bound transcripts.
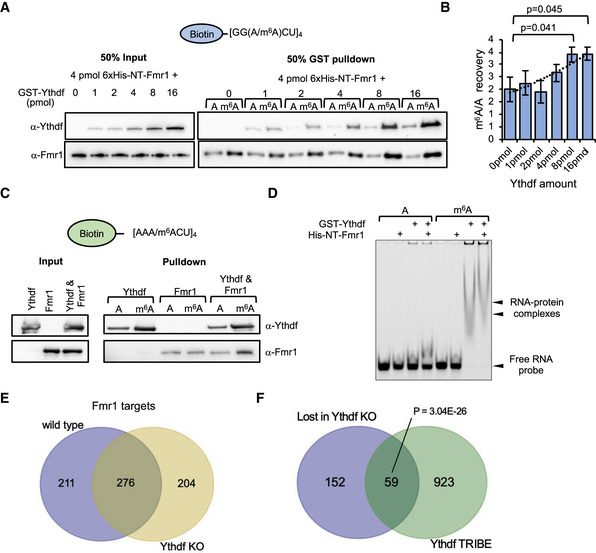
To further understand the interplay between Ythdf and Fmr1 on RNA, we repeated pulldown experiments using the aforementioned biotinylated RNA probes. By combining a constant concentration of His‐Fmr1 with an increasing amount of GST‐Ythdf, we found a substantial increase of the Fmr1 binding to the methylated RNA probe with higher Ythdf protein concentrations in the GGACU sequence context (Fig 5A and B). Notably, the binding of Ythdf at the respective concentration was not changed by the presence of Fmr1 (Appendix Fig S4). The same trend could be observed for the alternative AAACU sequence context. Adding purified GST‐Ythdf protein to His‐Fmr1 protein enabled a specific enrichment of Fmr1 in the m6A probe pulldown fraction (Fig 5C). In addition, electrophoretic mobility shift assay (EMSA) using the Cy5 labeled AAACU RNA probes revealed a strong preference of Ythdf for the methylated RNA probe, while Fmr1 did interact with neither the methylated nor unmethylated probe (Fig 5D). Though, the incubation of the RNA probe with a mixture of Fmr1 and Ythdf caused a shift of the RNA–protein complex signal in comparison with Ythdf alone, suggesting that Ythdf and Fmr1 bind together the methylated probe. Hence, these results indicate that Ythdf can facilitate binding of Fmr1 to methylated sites.
Figure 5. Ythdf modulates Fmr1 target selection.
-
A–DPulldown of biotinylated RNA probes of (A) repetitive GGACU sequences incubated with 4 pmol His‐NT‐Fmr1 and increasing concentrations of GST‐Ythdf and (B) the respective quantification plotted as the median of the m6A/A signal intensity ± SEM of three replicates. The indicated P‐values were determined by unpaired, two‐tailed Student’s t‐test. (C) AAACU sequences RNA probes incubated with either 32 pmol recombinant GST‐Ythdf or/and 6xHis‐NT‐Fmr1. Pulled down proteins were analyzed by immunoblotting using α‐Ythdf and α‐Fmr1 antibodies. (D) EMSA assay using purified GST‐Ythdf and His‐NT‐Fmr1 proteins and RNA probes in the AAACU sequence context.
-
EIntersection of Fmr1 RNA immunoprecipitation target genes for wild‐type and Ythdf KO brains, displaying a considerable number of genes gained and lost with Ythdf loss.
-
FIntersection of genes lost (i.e., bound in wild‐type but not in Ythdf KO) with Ythdf target genes determined by a TRIBE assay. P‐value calculated with hypergeometric test.
Source data are available online for this figure.
This result led us to investigate whether Fmr1 binding to mRNA is altered upon KO of Ythdf in vivo. To address this point, we performed a RNA immunoprecipitation assay (RIP) of endogenous Fmr1 from brain extracts of wt or Ythdf KO animals followed by sequencing. The RIP assay identified 584 significant target transcripts for the wild‐type samples, corresponding to 487 genes (Fig 5E and Dataset EV5). These genes recapitulated the known functions associated with Fmr1, including nervous system development and regulation of RNA metabolism (Appendix Fig S5). The RIP assay in the Ythdf KO brains identified a similar number of target transcripts, 585, corresponding to 480 genes. The overlap between the two sets of targets is 57% (276 genes), with 211 and 204 genes, respectively, unique to wt and Ythdf KO samples (Fig 5E). This finding indicates that the binding specificity of Fmr1 is partially reprogrammed in the Ythdf mutant. Since our data suggest that Ythdf promotes Fmr1 binding to methylated transcripts, we expected in the Ythdf KO a loss of Fmr1 binding to the targets shared with Ythdf. We then analyzed the overlap between the genes lost in the Ythdf KO sample, with the previously identified Ythdf targets (Fig 4D), and we observed a significant overlap (P = 3.04E‐26) (Fig 5F). Interestingly, the 211 lost genes are enriched in functions associated to neuronal development, including MB development, synapse assembly, and axon guidance (Appendix Fig S5).
Collectively, these experiments led to the identification of common methylated targets of Ythdf and Fmr1 and strongly suggest that these two factors directly interact to regulate gene expression.
Ythdf and Fmr1 control axonal growth at the MB and inhibit chic mRNA translation
Among the common targets of Fmr1 and Ythdf that are also methylated were chickadee (chic) transcripts (Fig EV4A). chic codes for Profilin, an actin‐binding protein that modulates many processes depending on actin dynamics, among these neuronal growth and remodeling (Verheyen & Cooley, 1994). Importantly, previous work by Reeve and colleague demonstrated that Fmr1 controls axonal growth in the CNS via inhibition of chic translation (Reeve et al, 2005). We first performed an RNA immunoprecipitation assay (RIP) to confirm the binding of Fmr1 and Ythdf to chic mRNA in the adult fly brain using HA‐tagged Ythdf and GFP‐tagged Fmr1 driven by the neuronal driver elav‐GAL4. As shown in Fig EV4B, both proteins were able to pulldown chic mRNA. To test whether the m6A pathway regulates chic expression in a similar manner as Fmr1, we examined Profilin protein levels using brain extracts from wild‐type and Ythdf mutant. We found that the lack of Ythdf led to increased Profilin levels (Fig 6A and B). In contrast, chic mRNA levels remained unaffected (Fig 6C). These results prompted us to investigate whether the increased Profilin level was involved in the MB β‐lobe fusion phenotype. We then crossed Ythdf mutant to chic mutant flies and scored for MB developmental defects. As shown in Fig 6D and E, loss of one copy of chic was sufficient to rescue the β‐lobe fusion phenotype of Ythdf mutant flies. On the other hand, chic heterozygote mutant flies already showed β‐lobe fusion per se, suggesting that the level of Profilin has to be tightly regulated to ensure proper brain wiring. Hence, our results suggest that Ythdf interacts with Fmr1 to limit the axonal growth at the MB and inhibit the translation of chic mRNA.
Figure EV4. Fmr1 and Ythdf bind chic and futsch transcripts.
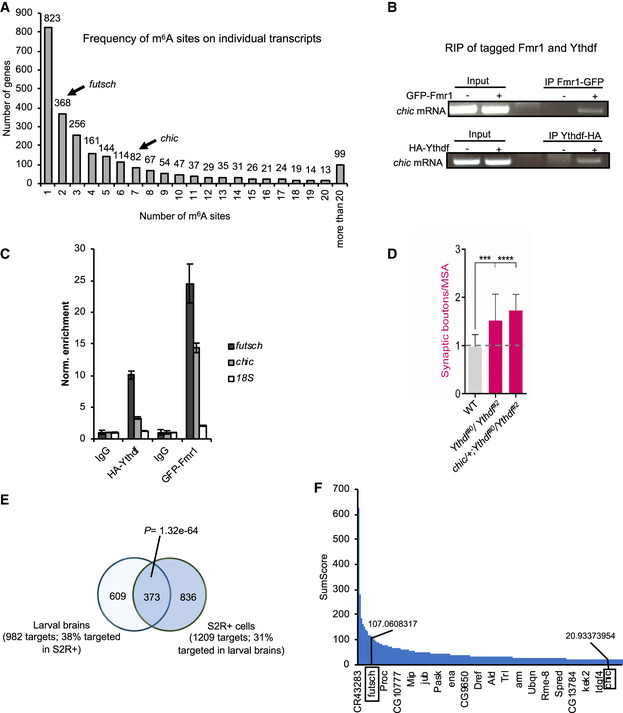
-
AGraph showing the frequency of m6A sites on individual transcripts identified by miCLIP‐seq.
-
BRNA Immunoprecipitation of GFP‐tagged Fmr1 (Elav‐Gal4: UAS‐Fmr1‐GFP) or HA‐tagged Ythdf (Elav‐Gal4:UAS‐Ythdf‐HA) from 50 adult heads. The RNA was then reverse‐transcribed and analyzed via PCR with primers designed on chic transcript.
-
CRNA immunoprecipitation assay. Quantification of futsch and chic RNA levels upon immunoprecipitation of pan‐neuronally expressed GFP‐tagged Fmr1 or HA‐tagged Ythdf in 3rd instar larvae. Bars show average ± SD of technical triplicates. 18S mRNA serves as a negative control for unspecific enrichment.
-
DQuantification of normalized bouton number (total number of boutons/muscle surface area (μm2 × 1,000)) of muscle‐6/7 NMJ in hemisegments A2–A3 of the indicated genotypes (n = 20). Bars show mean ± s.e.m. Multiple comparisons were performed using one‐way ANOVA with a post hoc Sidak–Bonferroni correction (***P < 0.001; ****P < 0.0001).
-
EVein diagram showing the overlap of Ythdf‐TRIBE datasets produced in S2R + cells and in larval brain. The P‐value is calculated by hypergeometric test.
-
FGraph showing the distribution of SumScores of all identified Ythdf mRNA targets by TRIBE in the larval nervous system. The position and SumScores of futsch and chic are marked in the graph.
Figure 6. Fmr1 and Ythdf regulate CNS axonal growth and Profilin levels.
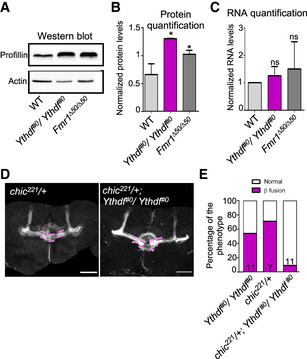
-
ARepresentative Western blot analysis of protein extracts of late pupae heads (85–95 h) from control, Ythdf#0/ Ythdf#0 and Fmr1∆50/Fmr1∆50 flies. The membranes were probed with anti‐Profilin or anti‐Actin antibodies.
-
BQuantification of Profilin protein levels (mean ± SD) obtained from three independent protein extraction and Western blot analysis as in (A). Quantification was performed using Fiji. **P < 0.005; *P < 0.05, measured with unpaired t‐test.
-
CQuantification of chic mRNA levels (mean ± SD) obtained from six independent RNA extractions from control, Ythdf#0/Ythdf#0 and Fmr1∆50 late pupae heads, via real‐time PCR analysis. Statistical analysis using unpaired t‐test show no significant difference between the samples.
-
DImmunofluorescence analysis of adult chic/+ and chic/+; Ythdf#0/Ythdf#0 using anti‐FasII antibody. Scale bar: 50 μm. Pink dashed lines highlight the normal and fused β‐lobes.
-
EQuantification of the penetrance of β‐lobe fusion phenotype for the indicated genotypes. Bars are labeled with the number of replicates.
Source data are available online for this figure.
Ythdf and Fmr1 control axonal growth at the NMJ and inhibit futsch mRNA translation
We next investigated whether chic could also be common effector of Fmr1 and Ythdf at the NMJ. As in the adult brain, we found that both proteins interact with chic mRNA in the larval nervous system (Fig EV4C). However, in contrast to what we observed at the MB, removing one copy of chic had no effect on the NMJ phenotype produced by the loss of Ythdf (Fig EV4D). These results indicate that chic is not involved in the m6A‐dependent phenotype at the NMJ and that other targets must be involved. To reveal their identity, we generated transgenic flies expressing Ythdf‐cdAdar under the control of an UAS promoter. The construct was specifically expressed in the nervous system of third instar larvae using the elav‐GAL4 driver and, after dissection, RNA was isolated and submitted for high‐throughput sequencing. Using this strategy, we identified 982 Ythdf target mRNAs in larval brains (Dataset EV6). We found a significant overlap with the Ythdf‐TRIBE dataset produced in S2R+ cells (n = 373, P = 1.32e‐64, Fig EV4E), which includes the chic mRNA. Interestingly, we found that the futsch mRNA was scoring in the first 5% of the targets identified in the larval brain (53th highest TRIBE SumScore out of 982 mRNAs, Fig EV4F). futsch encodes a microtubule‐associated protein that is a key target of Fmr1 in the regulation of axonal growth at the NMJ (Zhang et al, 2001). We confirmed the binding of Ythdf and Fmr1 to futsch mRNA in larval brains by immunoprecipitating HA‐tagged Ythdf and GFP‐tagged Fmr1 driven by the neuronal driver elav‐GAL4 (Fig EV4C). Remarkably, in Mettl3 and Ythdf mutants Futsch protein level was significantly upregulated at the larval NMJ and in larval brain extracts, which is reminiscent of the previously described upregulation observed in the Fmr1 mutant (Fig 7A–C). In contrast, futsch mRNA level was downregulated by two‐fold (Fig 7D). To discriminate between a defect in translation inhibition and a defect in protein decay, we performed Translating Ribosome Affinity Purification (TRAP). By immunoprecipitation of a GFP‐ribosomal fusion protein, TRAP enables the isolation of mRNAs associated with at least one ribosome, providing an estimation of the translation status of single transcripts. We expressed RPL10‐GFP in neurons using the elav‐GAL4 driver and pulled down associated RNA using an anti‐GFP antibody. Using this approach, we found that futsch mRNA was strongly enriched in the Ythdf mutant, demonstrating that its translation was likely increased (Fig 7E). Altogether, these experiments indicate that, like Fmr1, the m6A pathway restricts futsch mRNA translation in the larval nervous system.
Figure 7. Fmr1 and Ythdf regulate CNS axonal growth and inhibit Futsch translation.
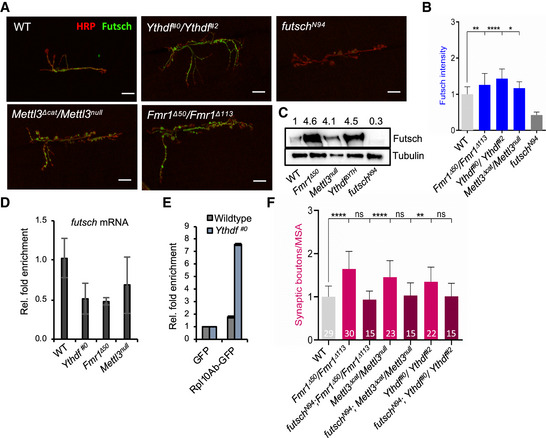
-
ARepresentative confocal images of muscle‐6/7 NMJ synapses of abdominal hemisegment A2 for the indicated genotypes labeled with HRP (red) and α‐futsch (green) to reveal the neuronal membrane and Futsch protein level. Scale bar: 20 μm.
-
BQuantification of normalized Futsch protein level at NMJ 6/7 in A3 of the indicated genotypes (n = 20). Bars show mean ± s.e.m. P values were determined with a Student’s t‐test. (*P < 0.05; **P < 0.01; ****P < 0.0001).
-
CWestern blot analysis of Futsch protein level in isolated third instar larval brains of different mutants compared to control. Numbers indicate normalized Futsch protein level in comparison to Tubulin levels.
-
DQuantification of futsch mRNA levels obtained from isolated 3rd instar larvae brains of the indicated genotypes via real‐time PCR analysis. Bars show average ± SD of biological triplicates.
-
ETranslating Ribosome affinity purification assay. Quantification of futsch mRNA levels upon immunoprecipitation of GFP‐tagged Rpl10Ab or GFP in wild‐type and Ythdf#0 3rd instar larvae with Real‐time qPCR. Bars show average ± SD of technical triplicates.
-
FQuantification of normalized bouton number (total number of boutons/muscle surface area (μm2 × 1,000)) of NMJ 6/7 in hemisegment A3 of the indicated genotypes. Bars show mean ± s.e.m. Multiple comparisons were performed using one‐way ANOVA with a post hoc Sidak–Bonferroni correction (n.s. = not significant; **P < 0.01; ****P < 0.0001).
Source data are available online for this figure.
To functionally address the relationship between the m6A pathway and futsch mRNA at the NMJ, we performed genetic experiments. As shown earlier, the number of synapses in the Fmr1 mutant was restored to a normal level by removing futsch function (Fig 7F lanes 1–3, Zhang et al, 2001). Similar rescues were obtained in the Mettl3 and Ythdf mutants (Fig 7F, lanes 1, 4–7). This indicates that the m6A pathway represses futsch mRNA translation, which contributes to the control of axonal growth at the NMJ.
Ythdf binding to futsch mRNA 5´ UTR promotes translation inhibition
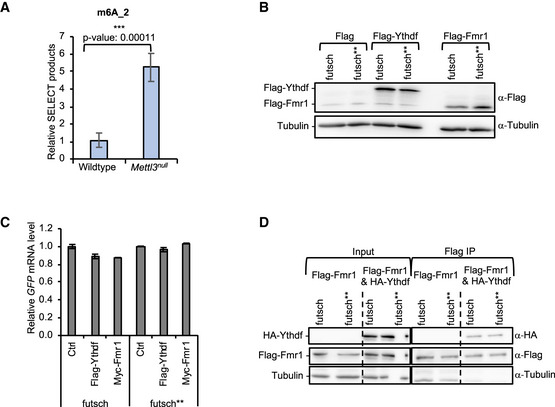
To functionally investigate the mechanism underpinning the influence of m6A and of the Ythdf/Fmr1 complex on futsch translation, we determined the location of the m6A sites on the futsch transcript. By analyzing our miCLIP‐seq data, we found that futsch harbors two m6A sites in its 5´ UTR, close to the start codon (Fig 8A). We verified the methylation of one of these sites in vivo by performing single‐base elongation and ligation‐based qPCR amplification (SELECT) (Xiao et al, 2018) using larval brain extract (Fig EV5A). To next define the influence of the methylation on futsch expression, we designed reporters containing the GFP coding sequence downstream of the WT futsch 5´ UTR or a version containing A‐T point mutations at the m6A sites (Fig 8B). We tested whether the binding of Ythdf and Fmr1 to the mutated reporter transcript was altered by immunoprecipitating Flag‐tagged Ythdf and Fmr1 from S2R+ cell lysate co‐transfected with the wt or mutated reporter constructs. While the wt GFP reporter was strongly enriched in the Ythdf and Fmr1 pulldown fractions, a significantly lower amount of the mutated GFP reporter transcript was recovered (Fig 8C), though the input protein and GFP transcript levels were similar (Fig EV5B and C). In addition, we found that the enrichment of the wt futsch 5´ UTR reporter, but not the mutated version, was significantly increased in the Fmr1 pulldown fraction when Ythdf was co‐expressed (Figs 8D and Fig EV5D), indicating that Ythdf increases the binding of Fmr1 to this reporter. We next analyzed whether mutations of the two m6A sites led to a change in the translation efficiency, similar to the observed increased translation of endogenous futsch in Ythdf mutants. As shown in Fig 8E and F, the GFP translation efficiency from the mutated reporter was significantly increased in comparison with the WT reporter. A similar increase of the translation efficiency could be observed for the wild‐type reporter upon depletion of Mettl3 (Fig 8E and F) or Ythdf (Fig 8G), while no significant difference was observed for the mutated reporter in the same conditions. Hence, we conclude that the futsch 5´ UTR harbors at least two m6A sites, which are required for Ythdf and Fmr1 binding and for the translational repression of futsch (Fig 8H).
Figure 8. Ythdf recruits Fmr1 and repress Futsch translation via m6A.
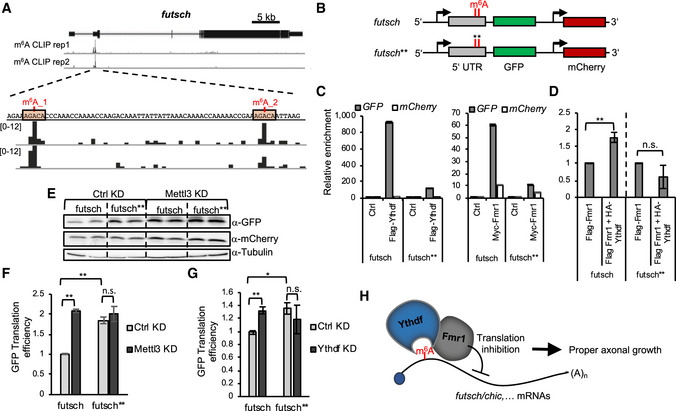
-
Afutsch genomic region (X1,408,435–1,454,00) and corresponding browser tracks from miCLIP‐seq experiments in S2R+ cells. futsch transcripts contain two m6A peaks in its 5´ UTR, as indicated.
-
BSchematic of GFP reporter constructs containing an actin promoter and either wild‐type 5´ UTR region of futsch or a mutated version (futsch**) containing two‐point mutations (A – T) at the identified m6A sites. mCherry is under the control of a same actin promoter.
-
C, DRNA immunoprecipitation assay. Quantification of GFP RNA levels upon immunoprecipitation of Myc‐tagged Fmr1 or Flag‐tagged Ythdf. Bars show average ± SD of technical triplicates (C) or Flag‐tagged Fmr1 in the presence of overexpressed HA‐tagged Ythdf. Bars show median ± s.e.m. of biological triplicates. P‐values were determined with an unpaired, two‐tailed Student’s t‐test. (n.s. = not significant; **P < 0.01) (D). Rpl15 levels were used as a normalization control and the enrichment of mCherry is shown as a negative control for background binding.
-
C, D
-
E–GRepresentative Western blot analysis of the protein level (E) and quantification of the translation efficiency of S2R+ cells transfected with the wild‐type or mutated futsch reporter constructs upon control or Mettl3 KD (F) or Ythdf KD (G). LacZ dsRNA was used for the control KD. The translation efficiency was calculated as the ratio of the relative GFP protein level and GFP mRNA level. mCherry served as a normalization control for both the protein and mRNA level. Bars show mean ± s.e.m of biological triplicates. P values were determined with a Student’s t‐test. (n.s. = not significant; *P < 0.05; **P < 0.01).
-
HModel of the interplay between Ythdf and Fmr1 in translation control.
Source data are available online for this figure.
Figure EV5. Controls for assay with the futsch 5’UTR reporter.
-
ARelative amount of SELECT qPCR products targeting the m6A_2 site on futsch using total RNA of Wild‐type or Mettl3null larval brains. Bars show average ± SD of biological triplicates. P values were determined with a Student’s t‐test. (***P < 0.001).
-
BRepresentative Western blot analysis showing the protein input level for RNA immunoprecipitation experiment of futsch 5’UTR GFP reporter.
-
CRelative GFP mRNA input level for RNA immunoprecipitation experiment of futsch 5’UTR GFP reporter. Rpl15 served as a normalization control. Experiments were performed in triplicates. Bars show average ± SD.
-
DRepresentative Western blot analysis showing the protein input level and IP efficiencies for RNA immunoprecipitation experiment of futsch 5’UTR GFP reporter in the presence of HA‐Ythdf and Flag‐Fmr1.
Discussion
m6A on mRNA is emerging as a key modulator of nervous system biology (for recent review see (Livneh et al, 2020)). Despite the increasing amount of data associating m6A function to brain development, neuronal differentiation, regeneration, and synaptic function, the molecular mechanisms underlying these functions remain largely incomplete. Here we show that m6A is required for proper neuronal development in both CNS and PNS, where it prevents MB β‐lobes fusion and NMJ overgrowth, respectively. We further demonstrate a critical interplay between Ythdf and Fmr1 in the control of axonal growth. We show that Ythdf can interact with Fmr1 and inhibit the translation of critical targets that ensures proper axonal growth and homeostasis. Hence, our study reports that m6A can modulate Fmr1 target selectivity to influence the development of the nervous system in Drosophila.
m6A in axon growth and guidance
Previous work showed that flies lacking m6A are flightless and have reduced locomotion, due to impaired neuronal functions (Haussmann et al, 2016; Lence et al, 2016; Kan et al, 2017). In this study, we found that m6A controls axonal growth and guidance in the PNS and CNS, in part by regulating protein levels of two key components of the cytoskeleton, Futsch, and Profilin, respectively. Roles for m6A in axonal growth and guidance have been previously observed in mammals. For instance, depletion of FTO in axons of dorsal root ganglia neurons represses axon elongation in mouse (Yu et al, 2018). In this model, FTO depletion inhibits axon growth due to increased m6A levels on growth‐associated protein‐43 (GAP‐43) mRNA, resulting in reduced GAP‐43 protein abundance. Accordingly, the growth defect can be rescued by expressing a deficient‐m6A construct encoding GAP‐43. However, how m6A inhibits GAP‐43 translation is not understood. Perhaps a similar mechanism as described in our work, involving the recruitment of FMRP, is operating (see also below). This would be consistent with the upregulation of GAP‐43 observed at synapses of Fmr1 KO mice (Klemmer et al, 2011). Upon injury of the same dorsal root ganglion neurons, it was shown that m6A levels increase dramatically, resulting in enhanced protein synthesis and eventually axon regeneration (Weng et al, 2018). A similar activity was also observed in the adult CNS. Thus, m6A plays a positive role in axonal growth upon injury, which seems in contradiction to its role in normal growth during development. Nevertheless in mouse embryonic dorsal spinal cord (DSC), m6A is required for axon growth and guidance by promoting Robo3.1 translation via YTHDF1 (Zhuang et al, 2019). Thus, m6A has the ability to either promote or repress axon growth and guidance, which depends on the developmental and physiological contexts.
Ythdf controls axon growth and guidance and interacts with Fmr1
In mammals, there are three YTHDF proteins that were shown to control translation and mRNA decay. The current view is that YTHDF1 stimulates translation and YTHDF2 decreases mRNA stability, while YTHDF3 regulates both processes (Patil et al, 2018; Zhao et al, 2019), even though this model has been challenged recently (Lasman et al, 2020; Zaccara & Jaffrey, 2020). Thus, more work is required to appreciate how the three YTH proteins interplay in the cytoplasm and how much of their functions overlap. In Drosophila, there is only one Ythdf protein but its function was not characterized prior to our work. In fact, the role of cytoplasmic m6A in this organism has remained enigmatic. Our attempt to demonstrate a role on mRNA stability in S2R+ cells was not conclusive, so it is unclear whether m6A regulates this process in flies (data not shown). The fact that most m6A sites resides in the 5´ UTR, near the start codon, suggests instead that the main role of cytoplasmic m6A in Drosophila is to regulate translation. Consistent with this assumption, we found that m6A controls futsch and chic translation through Ythdf activity. However, in contrast to mammalian YTHDFs, Drosophila Ythdf does not activate their translation. It represses translation of these mRNAs likely via the recruitment of the translation inhibitor Fmr1. For future studies, it would be interesting to address whether translation inhibition is the major function of Ythdf in Drosophila or whether it has a broader role depending for instance on the nature of its interacting partners. Furthermore, whether such inhibitory role of YTHDFs in translation also exists in mammals awaits future investigations.
FMRP was recently shown to bind methylated mRNAs and to facilitate their export (Edens et al, 2019; Hsu et al, 2019), as well as to protect them from degradation by preventing YTHDF2 binding (Zhang et al, 2018). It was proposed to be an m6A reader, acting in a sequence‐dependent context. Indeed, in vitro pull down as well as FMR1 CLIP demonstrated association to GGACA/C/U sequence, with clear enrichment upon methylation (Arguello et al, 2017; Edupuganti et al, 2017; Hsu et al, 2019). Whether this enrichment is due to direct recognition of the methyl group by FMR1 or to a change in RNA accessibility is still unclear. Replacing the first or the second G by A strongly decreased FMR1 association, while no effect was observed on YTH binding. Here we show that similar rules apply in Drosophila. In addition, our data further demonstrate that Ythdf interacts directly with Fmr1 and stabilizes its interaction to RNA. This direct interaction appears essential for both protein activities in the context of axonal growth. Of note, human YTHDF2 was recently shown to be in a same complex with FMR1, suggesting that this mode of interaction is conserved (Zhang et al, 2018).
Relevance of this interplay in FXS
The absence of FMRP leads to the FXS, which is a severe inherited neuronal disorder that currently lacks efficient therapeutic treatment. The phenotype of the patients suffering from FXS is often complex, accompanied by an increase in autism spectrum disorder specific traits and other features like delayed motor development, hyperactivity, aggression, and epileptic seizures (reviewed in refs. Hagerman et al, 2002; Garber et al, 2008; Utari et al, 2010; Santoro et al, 2012; Hagerman et al, 2014; Kidd et al, 2014; Maurin et al, 2014; Schaefer et al, 2015; Dahlhaus, 2018). These abnormalities result from defects in neuronal development and maturation. Interestingly, the phenotypes of Fmr1 mutants are reminiscent of the pathological symptoms of FXS patients and, consequently, Drosophila has been widely used to learn the basic mechanisms underlying FMRP functions and to test the efficacy of drug treatment (Drozd et al, 2018). In particular, the increased synapse arborization and bouton number at the NMJ recall the dendritic spine overgrowth observed in FXS patients. Moreover, expressing human FMR1 in Drosophila Fmr1 null mutants rescues the overgrowth at the NMJ and the defect in the brain, highlighting the functional conservation of the two orthologues (Coffee et al, 2010). Since FMR1 is involved in different functions such as splicing, nuclear export, and translation, it remained unclear which activity was more relevant in the FXS etiology. A clue came when treatment with the translation inhibitor puromycin could rescue several aspects of FXS, including the locomotion phenotype and the overgrowth at the NMJ, suggesting that it was an excess of translation that yields these defects (Stefani et al, 2004; Bolduc et al, 2008; Kashima et al, 2017). Accordingly, the first target identified for Fmr1 was Futsch, a microtubule‐associated protein orthologue of mammalian MAP1B (Zhang et al, 2001). Fmr1 negatively regulates futsch translation, and this is necessary to prevent NMJ overgrowth. Importantly, this function was also found in mice (Lu et al, 2004). Our data showing that Fmr1 may repress translation via m6A activity links m6A to some aspects of the FXS studied in the fly model. It would be of critical importance to test whether a similar mechanism also applies to mammals. The FMR1‐mediated nuclear export and stability of methylated RNA as recently uncovered may contribute as well to the disease (Zhang et al, 2018; Edens et al, 2019; Hsu et al, 2019). It is worth mentioning that while our study mainly focuses on two key Fmr1 targets involved in the gross morphology of the nervous system, it is likely that m6A and Fmr1 regulate additional targets involved in more subtle processes such as synapse functionality and complex trait behaviors.
In conclusion, our study indicates that m6A modulates both CNS and PNS development by restricting axonal growth and promoting correct assembly of the neural circuits. These functions are reminiscent to the functions of Fmr1 in the nervous system, and our work shows that both m6A and Fmr1 tightly cooperate to regulate these processes. We foresee that this new knowledge will open new avenues for the design of complementary treatments of FXS.
Materials and Methods
Drosophila stocks
The stocks used are the following: Fmr1Delta50M, Fmr1Delta113M, chic221, futschN94, Mettl14Df, Ythdc1Df, Tub‐GAL4, Elav‐Gal4, c772Gal4:UAS‐CD8‐GFP, Elav‐Gal4;;UAS‐FMR1‐GFP/TM3 (Bloomington Stock Collection), Mettl3null, Mettl3Deltacat, UAS‐Mettl3, Mettl14fs, Ythdc1DeltaN (Lence et al, 2016), Mettl3SK2, Mettl14SK1 (kind gift from Eric Lai), P(GD9882)v20969/TM3 (VDRC), P(GD9882)v20968/TM3 (VDRC), w1118;P(GD11887)v27577 (VDRC), w1118;P(GD16300)v48560 (VDRC), and w1118 (kind gift from Paola Bellosta).
Drosophila melanogaster Canton‐S with mutant alleles for Ythdf were generated using the CRISPR/Cas9 system, as described previously (Lence et al, 2016). Guide RNA sequences used were CTTCGGATAAATTCTTTCCGAATA and AAACTATTCGGAAAGAATTTATCC as well as CTTCGGGCGAGTGGGGCAGGCGCG and AAACCGCGCCTGCCCCACTCGCCC. The first allele (Ythdf#0) produces a deletion of 1,221 nucleotides in the coding sequence, deleting residues 172–557, that includes the whole YTH domain. The second allele (Ythdf#2) is a deletion of 1319 nucleotides and removes residues 162–558.
Drosophila cell lines
Drosophila S2R+ are embryonically derived cells obtained from the Drosophila Genomics Resource Center (DGRC; Flybase accession FBtc0000150), while Drosophila BG3 cells are derived from central nervous system of third instar larvae (DGRC; Flybase accession FBtc0000068). Mycoplasma contamination was not detected (verified by analyzing RNA sequencing data).
Immunohistochemistry
For the immunohistochemistry in adult and pupal brains, the following protocol was used: Brains were collected in cold PBS and subsequently fixed for 10 min in 4% formaldehyde (in PBS 0.3% Triton X‐100). Upon three washes in PBS 0.3% Triton X‐100, the brains were blocked in 10% BSA (in PBS 0.3% Triton X‐100) for 1 h rocking at RT. After this step, the brains were incubated overnight at 4°C with the primary antibody appropriately diluted in blocking solution. The second day, the samples were washed 3 times in PBS 0.3% Triton X‐100 and then incubated with the appropriate secondary antibody diluted in blocking solution for 1h at RT. Upon three washes in PBS 0.3% Triton X‐100, the brains were mounted and kept at 4°C for imaging. Primary antibody used were as follows: anti‐FasII 1/50 (ID4 Hybridoma Bank) and anti‐GFP 1/500 (Invitrogen A11122). Secondary antibody used were Alexa Fluor 555 Donkey anti‐Mouse and Alexa Fluor 488 Goat Anti‐Rabbit at a dilution of 1/500. Images were acquired on a Leica TCS SP8 laser scanning confocal microscope or on a Leica DM6000CS confocal microscope and processed using Fiji™ software.
NMJ analysis
For NMJ staining, third instar larvae were dissected in cold PBS and fixed with 4% paraformaldehyde in PBS for 45 min. Larvae were then washed in PBS‐T (PBS + 0.5% Triton X‐100) six times for 30 min and incubated overnight at 4°C with the following primary antibodies: mouse anti‐synaptotagmin, 1:200 (3H2 2D7, Developmental Studies Hybridoma Bank, DSHB) and TRITC‐conjugated anti‐HRP, 1:1,000. After six 30‐min washes with PBS‐T, secondary antibody anti‐mouse conjugated to Alexa‐488 was used at a concentration of 1:1,000 and incubated at room temperature for 2 h. Larvae were washed again six times with PBS‐T and finally mounted in Vectashield.
Images from muscles 6–7 (segment A2–A3) were acquired with a Leica Confocal Microscope SP5. Serial optical sections at 1,024 × 1,024 pixels with 0.4 µm thickness were obtained with the ×40 objective. Bouton number was quantified using Imaris 9 software. ImageJ software was used to measure the muscles area and the NMJ axon length and branching. Statistical tests were performed in GraphPad (PRISM 8).
RNA probe pulldown
For RNA probe pulldown in BG3 cells, cells were washed with DPBS, harvested, and pelleted for 10 min at 400 g. The cell pellet was resuspended in lysis buffer (10 mM Tris–HCl at pH 7.4, 150 mM NaCl, 2 mM EDTA, 0.5% NP‐40, 0.5 mM DTT, protease inhibitor) and rotated head over tail for 15 min at 4°C. Nuclei were collected by 10‐min centrifugation at 1,000 g at 4°C, resuspended in 300 μl of lysis buffer, and sonicated with 5 cycles of 30 s ON, 30 s OFF low power setting. Cytoplasmic and nuclear fractions were joined and centrifuged at 18000 g for 10 min at 4°C to remove the remaining cell debris. Protein concentration was determined by Bradford, and 1 mg lysate was used for the following pulldown procedure.
For RNA probe pulldown using purified recombinant proteins, the indicated amounts of purified proteins were resuspended in binding buffer (2% Triton X, 20 mM Tris–HCl, 10 mM EDTA, 120 mM NaCl, 50 mM KCl, 1 mM DTT, protease inhibitor) and used for the following pulldown procedure. Purified proteins were incubated with 1 µg of biotinylated RNA probe coupled to 20 µl Dynabeads MyOne Streptavidin C1 (Thermo Fisher) in 600 µl lysis buffer at 4°C for 1 h rotating head over tail. The beads were washed three times with lysis buffer and bound proteins eluted by incubation in 1x NuPage LDS supplemented with 100 mM DTT for 10 min at 70°C. Eluted proteins were analyzed by PAGE followed by Coomassie staining, immunoblotting using the corresponding antibodies or proceeded to quantitative proteomic analysis.
Expression and purification of recombinant proteins
N‐His6‐tagged NT‐Fmr1 (220‐684) and N‐GST‐tagged Ythdf (full length) were expressed from pQIq‐His6 and pGEX‐6P‐1, respectively, in E. coli BL21(DE3) Rosetta™ 2pLysS (Novagen). Cells were grown in LB‐Luria at 37 °C and 160 rpm to an OD600 of 0.6–0.8 and chilled on ice, and expression was induced by addition of IPTG (1 mM). Cells were further incubated at 18 °C and 160 rpm for 20 h, harvested by centrifugation for 15 min at 4,000 g at 4°C, and directly processed for purification: Cells were resuspended in lysis buffer (50 mM Tris–HCl pH 8.0, 500 mM NaCl, 15 mM imidazole, 5% glycerol, 1 mM DTT, 1 mM MgCl2, Benzonase 1:2,500, protease inhibitors) and lysed by sonification. Lysates were cleared by centrifugation (45,000 g, 30 min, 4 °C). For GST‐Ythdf purification, additional 500 mM of NaCl and subsequently 0.2% of polyethyleneimine (40 kDa) was added to the cleared lysate, incubated for 10 min at 4°C, and centrifuged at 4000 g for 10 min in order to precipitate nucleic acids. Proteins were captured from cleared lysates using a HisTrap FF 5 ml (His‐NT‐Fmr) or GstTrap FF 5 ml column (GST‐Ythdf; both GE Healthcare) according to the manufacturer’s instructions and using a Biorad NGC Quest FPLC system. Fractions containing the respective recombinant proteins were pooled and concentrated using Amicon® Ultra‐15 spin concentrators with 10 kDa cutoff (Merck Millipore). Concentrated protein pools were injected onto a Superdex 200 16/60 pg in gel filtration buffer (25 mM Tris‐Cl pH 7.5, 500 mM NaCl, 1 mM DTT, 10% glycerol). Peak fractions containing the recombinant proteins were pooled, aliquoted, and snap‐frozen in liquid nitrogen. Frozen aliquots were stored at −80°C.
TRIBE
TRIBE was performed as previously described (McMahon et al, 2016; Xu et al, 2018; Worpenberg et al, 2019). Briefly, for the identification of mRNA targets in S2R+ cells, Flag‐tagged Ythdf and Fmr1 versions fused to the catalytic domain of Adar (cdAdar) were ectopically expressed using a metal‐inducible expression system. Forty‐eight hours after protein expression induction, the cells were washed with DPBS and harvested.
For the identification of in vivo targets, 3rd instar larvae expressing a Flag‐tagged version of Ythdf fused to cdAdar driven by Elav‐Gal4 were collected and the brains dissected and collected in PBS.
For protein expression analysis, 50% of the cells/brains were resuspended in lysis buffer (50 mM Tris–HCl at pH 7.4, 150 mM NaCl, 0.5% NP‐40, protease inhibitor) and incubated for 30 min on ice. Cell debris was removed by centrifugation for 5 min at 12,000 g at 4°C and the expression analyzed by immunoblotting using anti‐Flag antibody.
For the identification of editing events, the remaining 50% of cells were used for total RNA isolation using TRIzol reagent, mRNA was purified by two rounds of Oligo(dT) selection using Dynabeads, and the purified mRNA was used for Illumina Next‐generation sequencing library preparation using NEBNext® Ultra™ II RNA Library Prep Kit for Illumina according to manufacture protocol.
From the TRIBE data analysis, the score is defined as a log‐likelihood ratio of two conditions and, therefore, describes how different conditions are (the higher the Score, the more different the A‐I editing). The arbitrary SumScore cutoff used in this manuscript is 20 to exclude low confidence targets and background from our analysis.
Co‐immunoprecipitation
S2R+ cells were transfected using Effectene transfection reagent with plasmids expressing the indicated constructs. After 72 h, the cells were washed with DPBS, harvested, and pelleted by centrifugation for 3 min at 1,000 g. The cell pellet was resuspended in 1 ml lysis buffer (50 mM Tris–HCl at pH 7.4, 150 mM NaCl, 0.5% NP‐40) supplemented with protease inhibitors and incubated for 30 min on ice. The cell debris was removed by centrifugation at 12,000 g for 5 min at 4°C, and the protein concentration of the cleared lysate was measured by Bradford. Two mg protein lysate was combined with 2 μl antibody coupled to 20 μl Protein G Dynabeads in lysis buffer and incubated rotating head over end at 4°C for 2 h. The beads were washed three times for 10 min with lysis buffer and the proteins eluted in 1× NuPage LDS buffer supplemented with 100 mM DTT by incubation for 10 min at 70°C. The eluted proteins were either analyzed by Western blot or conducted to quantitative proteomics analysis.
RNA immunoprecipitations (RIP)
For RIP from cell lysate, S2R+ cells were transfected with the plasmids expressing the indicated constructs. After 72 h, the cells were washed with DPBS, harvested, and pelleted by centrifugation for 3 min at 1,000 g. The cell pellet was resuspended in 1 ml lysis buffer (50 mM Tris–HCl at pH 7.4, 150 mM NaCl, 0.5% NP‐40) supplemented with protease inhibitors and RNase inhibitor.
For RIP from Drosophila larvae, 30 larvae with the indicated genotype were collected in DPBS on ice, carefully washed by exchanging the DPBS two times, and lysed by squishing with a pestle in 1 ml lysis buffer. The resuspended cell pellet or larvae lysate was incubated for 30 min on ice. The cell debris was removed by centrifugation at 12,000 g for 5 min at 4°C, and the protein concentration of the cleared lysate was measured by Bradford. Two mg protein lysate was combined with 2 μl antibody coupled to 20 μl Protein G Dynabeads in lysis buffer and incubated rotating head over end at 4°C for 2 h. The beads were washed three times for 10 min with lysis buffer. 20% of the beads were used for the elution of protein–RNA complexes by incubation in 1× NuPage LDS buffer supplemented with 100 mM DTT for 10 min at 70°C. The eluted proteins were analyzed by Western blot. 80% of the beads were used to extract RNA using TRIzol reagent. The enrichment of the transcripts was analyzed by qPCR and the fold change calculated by normalizing the transcript levels in the pulldown fractions to the corresponding input and a control pulldown.
For RIP from pupal heads for endogenous Fmr1: 200 heads per each genotype were collected in PBS on ice and subsequently resuspended in 100 μl of lysis buffer (10 mM Tris–HCl pH 7.4, 140 mM NaCl, 0.5% Triton X‐100, 1 mM DTT, 2 mM EDTA) supplemented with protease, phosphatase, and RNase inhibitors. The heads were lysed with a motor pestle and left on ice for 20’. The cell debris was removed by centrifugation at 12,000 g for 10 min at 4°C, and 1/10 of the volume was taken as an input and kept at −80, while the rest of the supernatant was divided in two and combined with either 20 μl of anti‐Fmr1 5B6 and 20 μl of anti‐Fmr1 5A11 or to 1.5 μl of mouse IgG together with 50 μl of Protein G Dynabeads in lysis buffer.. The lysate was incubated with the beads antibody rotating head over end at 4°C overnight. The day after, the beads were washed three times for 10 min and subsequently resuspended in 100 μl of lysis buffer that were further treated with 40 µg of proteinase K for 30’ at 55°C. Upon treatment, the supernatant was separated from the beads and RNA was extracted using TRIzol reagent. The enrichment of transcripts was analyzed by qPCR and the fold change calculated by normalizing the transcript levels in the pulldown fractions to the corresponding input and a control pulldown. For the RIP with overexpressed Ythdf‐HA, 3 µg of anti‐HA (Santa Cruz sc‐805 rabbit polyclonal) was conjugated to 50 µl of Protein G Dynabeads and used to immunoprecipitate tagged Ythdf from 50 adult heads. For the RIP with overexpressed Fmr1‐GFP, 25 µl of GFP Trap_MA beads (Chromtek) was used to immunoprecipitate tagged Fmr1 from 50 adult heads.
Sequencing and bioinformatics analysis of RNA immunoprecipitation from Drosophila heads
Strand‐specific, rRNA‐depleted libraries were generated with the Ovation® SoLo RNA‐Seq System plus Drosophila AnyDeplete Probe Mix (Tecan Genomics). Each individual library was quantified and quality controlled using Qubit Fluorometer (Thermo Scientific), LabChip GX (Perkin Elmer). After libraries equimolar pooling, the final pool was quality checked again with Qubit, LabChip GX, and also qPCR (KAPA and BIORAD). The adaptor‐tagged pool of libraries was sequenced in the Illumina Novaseq6000 in CIBIO NGS Core facility, using the Ovation SoLo Custom R1 primer and producing 960 million of reads. Reads were preprocessed (quality < Q30, adapters stripped) with TrimGalore (https://www.bioinformatics.babraham.ac.uk/projects/trim_galore/) and then aligned to the Drosophila melanogaster genome r6.28 with STAR (Dobin et al, 2013). Gene read counts were normalized by library size. RIP fold enrichment and P‐value were computed for each condition with DESeq2 (Love et al, 2014) as (RIP / INPUT) or (IGG / INPUT). Genes and transcripts significantly enriched (adjusted P‐value <= 0.05) in the RIP/INPUT and not in the corresponding IGG/INPUT were considered to be Fmr1 targets. Functional enrichment of Fmr1 targets was computed with Panther (Mi et al, 2019) and plotted with ReviGO (Supek et al, 2011). Overlap P‐value was computed using hypergeometric test.
In vitro RNA interaction studies (Electro Mobility Shift Assay—EMSA and Fluorescence Polarization—FP)
Cy5‐labeled RNA probes (Horizon Discovery, 10 nM in EMSA and 5 nM in the FP) were incubated with varying concentrations of His‐NT‐Fmr1 and/or GST‐Ythdf (300 nM in EMSA and 2.5 nM to 2.5 µM in FP) at a total volume of 10 µl in interaction buffer (20 mM Tris‐Cl pH 7.5, 150 mM NaCl, 10% glycerol, 1 mM EDTA, 1 mM DTT). The probes and proteins were incubated for 10 min at room temperature. For EMSA, the samples were mixed with 2 µl of 6 × loading buffer (60% Glycerol, 20 mM Tris‐Cl pH 8.0, 60 mM EDTA) and loaded onto a 12% TBE‐PA‐Gel. The gel was run for 45 min at 200 V in TBE buffer and scanned using a Typhoon FLA 9000 @ 635 nm to visualize the fluorescence of the Cy5‐labeled RNA probes. For FP measurements, samples were transferred to a 384‐well plate (Corning™, Low‐Volume, Polystyrene, black) and fluorescence polarization of the Cy5‐labeled oligos was analyzed on a Tecan Spark 20M plate reader at 20°C (excitation wavelength: 625 nm, emission wavelength: 665 nm, gain: 125, flashes: 15, integration time: 40 µs). Relative fluorescence polarization was calculated by subtracting the FP value of the oligo‐only conditions from all conditions that contained variable amounts of His‐NT‐Fmr1 and/or GST‐Ythdf. The relative FP values from three independent experiments including standard deviation were plotted using GraphPad Prism 8. Binding constants (kd values) were determined by fitting a Michaelis–Menten non‐linear regression onto the relative FP values in GraphPad Prism 8, if applicable.
Cell culture
Drosophila melanogaster S2R+ and BG3 cells were cultured in Schneider's Drosophila media (PAN BIOTECH) supplemented with 10% FBS and 1% penicillin–streptomycin. The culture medium for BG3 cells was additionally supplemented with 10 µg/ml insulin. Plasmid transfections were achieved using Effectene transfection reagent (Qiagen) according to the manufacture’s protocol. The knockdown was achieved using dsRNA. The PCR templates for the dsRNA were prepared using T7 megascript Kit (NEB). 2 Mio S2R+ cells were seeded in 6‐well plates and treated 6h in serum‐free medium with 15 μg of dsRNA. Afterward, medium containing 10% FBS and 1% penicillin–streptomycin was added to the cells. dsRNA treatment was repeated after 48 and 96 h.
Reporter assay
2 Mio cells were seeded 24 h before the transfection of the indicated reporter plasmids. Twenty‐four h after transfection, the cells were harvested. One half was used for RNA extraction followed by RT–qPCR to determine the relative GFP level normalized to the mCherry level. The second half was used for Western blot analysis as described. The relative GFP protein level was determined by normalization to the mCherry protein level. The translation efficiency was determined by normalizing the relative GFP protein level to the relative GFP mRNA level.
RNA isolation and quantitative real‐time PCR analysis
Total RNA from S2R+ cells or larval brains was isolated using TRIzol reagent according to the manufacturer protocol, DNA contamination removed by DNase‐I (NEB) treatment and reverse‐transcribed using M‐MLV reverse transcriptase (Promega). The transcript levels were quantified by real‐time PCR using Power SYBR green Master Mix. Rpl15 mRNA and 18S rRNA were used as housekeeping control genes.
Total RNA from head lysates was isolated using TRIzol reagent according to the manufacturer protocol and reverse‐transcribed using RevertAid First Strand cDNA Synthesis Kit. The transcript levels were quantified by real‐time PCR using Power SYBR green Master Mix. RP49 and Tubulin RNA were used as housekeeping control genes.
Western blot analysis
Proteins were extracted for 30 min on ice, the lysates were centrifuged at 12,000 g for 5 min at 4°C, and protein concentration in the supernatant was determined by Bradford. For Futsch protein detection, lysates were additionally dephosphorylated using Lambda protein phosphatase (NEB) following manufacturer’s instructions. Protein samples were separated on SDS–PAGE gels. Wet transfer to nitrocellulose membrane (Whatman) was performed for 90 min at 100 V. Membranes were blocked for 30 min in 5% non‐fat dry milk and PBS–0.5% Tween 20 (PBS‐T) and incubated with primary antibodies overnight at 4°C: anti‐Profilin chi1J 1/500 (Hybridoma Bank), anti‐Actin I‐19 (Santa Cruz sc‐1616), and anti‐Futsch 22C10 (Hybridoma Bank). Signal was detected with corresponding HRP‐conjugated secondary antibodies and ECL™ Prime Western Blotting Detection Reagent or ECL™ Select Western Blotting Detection Reagent (Amersham).
GST pulldown
Recombinant GST‐tagged Ythdf or GST (2 µM final) were mixed with recombinant His6‐tagged NT‐Fmr1 (2 µM final) in 100 µl binding buffer (20 mM Tris‐Cl pH 7.5, 150 mM NaCl, 10% glycerol, 0.1% Triton X‐100, 1 mM DTT) and incubated for 1 h rotating head over end at 4°C with 20 µl Glutathione Sepharose beads. The beads were washed once with binding buffer +1% Triton X‐100 and two subsequent times with binding buffer. Bound proteins were eluted by incubation in 50 µl 1× NuPage LDS supplemented with 100 mM DTT for 5 min at 95°C. Input and pulldown samples were analyzed by SDS–PAGE and subsequent coomassie brilliant blue staining.
TRAP
TRAP was performed as previously described (Thomas et al, 2012). Briefly, Drosophila melanogaster 3rd instar larvae expressing Elav‐Gal4 driven GFP‐tagged Rpl10Ab or cytoplasmic GFP in a wild‐type and Ythdf mutant background were collected and lysed in extraction buffer (20 mM HEPES, pH 7.5, 150 mM KCl, 5 mM MgCl2, 1% Triton X‐100, 0.5 mM DTT, 100 µg/ml Cycloheximide, 100 U/ml Rnase inhibitor, Protease Inhibitor). Cell debris was removed by centrifugation at 12,000 g for 5 min at 4°C and the protein amount determined by Bradford. Two mg lysate was combined with 20 μl Protein G Dynabeads conjugated to anti‐GFP antibody and incubated at 4°C for 2 h followed by three washing steps in Wash Buffer (150 mM NaCl, 0.05% Triton X‐100, 50 mM Tris, 5 mM MgCl2, and 40 U/ml RNase inhibitor) at 4°C. RNA was extracted using TRIzol reagent following manufacture’s protocol and the enrichment of the transcripts analyzed by qPCR.
m6A‐miCLIP
miCLIP was performed following previously described method (Linder et al, 2015) using 10 μg of purified mRNA from Drosophila S2R+ cells and 5 μg of anti‐m6A antibody (Synaptic Systems, Lot# 202003/2‐82). Immunoprecipitations were performed in quadruplicates, and as a control, one immunoprecipitation was performed where UV‐crosslinking was omitted. Of note, this sample produced a library of limited complexity, reflecting a low amount of background mRNA binding. Briefly, total RNA was isolated using Trizol reagent (Invitrogen) and DNA was removed with DNase‐I treatment (NEB). Polyadenylated RNA was purified by two rounds of binding to Oligo (dT)25 magnetic beads (NEB), and mRNA was fragmented with RNA fragmentation solution (Ambion) using 1 μl of solution per 2 μg of mRNA and with 7‐min incubation at 70°C. Immunoprecipitation was performed at 4°C in 500 μl of binding buffer (BB) (50 mM Tris–HCl pH 7.4, 150 mM NaCl, 0,5 % NP‐40). First, isolated mRNA and antibody were incubated for 2 h. Samples were then transferred to individual well of a 12‐well cell culture plate and crosslinked on ice (two times at 150 mJ/cm2). Next, 60 μl of magnetic ProteinG beads (Invitrogen) was resuspended in 500 μl of BB and added to the IP sample. Samples were then incubated for additional 2 h at 4°C, before washing with ice‐cold solutions was performed: 1x with BB, 2x with high salt buffer (50 mM Tris–HCl pH 7.4, 1 M NaCl, 1% NP‐40, 0,1% SDS), 1x BB , 2x with PNK buffer (20 mM Tris–HCl pH 7.4, 10 mM MgCl2, 0,2% Tween). All washes were performed by gentle pipetting and with 1‐min incubation on ice. Washes with HSB were additionally rotated for 2 min at 4°C. Finally, beads were resuspended in 900 μl of PNK buffer. Forty μl was used for WB analysis to evaluate immunoprecipitation efficiency. Remaining 860 μl was used for library preparation. All steps of library preparation were performed as previously described in (Sutandy et al, 2016). Libraries were sequenced on an Illumina NextSeq500.
For the miCLIP fragmented input control library, fragmented mRNA, that was also used for miCLIP IP, was first purified using the 1.8× volume of RNAClean XP beads (Beckman Coulter). Following the 20‐min incubation at RT, captured RNA was washed 3x with 80% EtOH and eluted in 20 μl of RNase‐free water. The library was prepared using ~ 50 ng of cleaned, fragmented mRNA using the NEBNext Ultra Directional RNA Library Prep Kit for Illumina (NEB), by omitting the RNA fragmentation step and following the manufacturer`s protocol. For library amplification, 11 PCR cycles were used and indicated primer and adaptor sequences: NEBNext Index 27 Primer for Illumina: 5´‐CAAGCAGAAGACGGCATACGAGATAAAGGAATGTGACTGGAGTTCAGACGTGTGCTCTTCCGATC‐s‐T‐3´ (Expected index read: ATTCCT), NEBNext Adaptor for Illumina: 5´‐/5Phos/GAT CGG AAG AGC ACA CGT CTG AAC TCC AGT CUA CAC TCT TTC CCT ACA CGA CGC TCT TCC GAT C‐s‐T‐3´. Libraries were sequenced on an Illumina NextSeq500.
m6A‐miCLIP analysis
Sequencing qualities were checked for all reads using FastQC (version 0.11.5; https://www.bioinformatics.babraham.ac.uk/projects/fastqc/). Afterward, reads were filtered based on sequencing qualities (Phred score) of the barcode region. Reads with more than one position with a Phred score < 20 in the experimental barcode (positions 4 to 7 in the reads) or any position with a Phred score < 10 in the random barcode (positions 1 to 3 and 8 to 9) were excluded from the subsequent analysis. Remaining reads were de‐multiplexed based on the experimental barcode (positions 4–7) using Flexbar (v3.0.0) (Dodt et al, 2012) without allowing any mismatch.
Individual samples were processed using the CLIP Tool Kit (CTK) v1.0.9. (Shah et al, 2017). We largely followed recommended user guide lines specific to CTK iCLIP data analysis as described here (https://www.zhanglab.c2b2.columbia.edu/index.php/ICLIP_data_analysis_using_CTK). Briefly, 3’adapter sequences [AGATCGGAAGAGCGGTTCAG] were trimmed using cutadapt v1.8. [overlap = 5; ‐m 29] (Martin, 2011). PCR duplicates were removed using a custom perl script, followed by the extraction of the 9 nucleotide miCLIP barcode and its addition to the read name. All cDNA libraries were filtered for common Drosophila virus sequences (Webster et al, 2016) using bowtie v1.1.2 [‐p 4 ‐q (‐X 1000) ‐‐fr best]. Next, to avoid sequencing read alignment software biases, we decided to map sequencing reads to the Drosophila melanogaster dm6 genome assembly (ensemble v81) using novoalign (http://www.novocraft.com/), bwa (Li & Durbin, 2009), and STAR v2.4.2a (Dobin et al, 2013). For STAR alignments, we used a custom python script to transform sam files into the expected format for downstream CITS identification. For STAR alignments, we did not consider spliced reads, soft‐clipped reads, mismatches and indels near read start and read end, and reads with more than one indel or mismatch. Then, unique tags were identified using parseAlignment.pl [‐v ‐‐map‐qual 1 ‐‐min‐len 18 ‐‐indel‐to‐end 2] to extract unique tags, followed by read collapsing using tag2collapse.pl. [‐v ‐big ‐‐random‐barcode ‐EM 30 ‐‐seq‐error‐model alignment ‐weight ‐‐weight‐in‐name ‐‐keep‐max‐score ‐‐keep‐tag‐name]. Crosslinking induced mutation sites (CIMS) indicative for the antibody‐m6A interaction were identified running CIMS.pl [‐big ‐n 10], and CIMS with FDR < 0.001 were retained. Crosslinking induced truncations sites were identified using CITS.pl [‐big ‐p 0.001 ‐‐gap 25]. Sites spanning more than 1 nucleotide were removed.
We further filtered identified CIMS and CITS to be reproducible in at least 2 out of 4 replicate m6A immunoprecipitation samples and not present in identified CITS from the input control sample for each aligner separately. Moreover, CIMS were filtered to have a minimum of 6 unique tags [k > 5], at least three unique substitutions [m > 2], and be prevalent in less than 20% of the coverage [m/k < 0.2] to avoid calling homozygous and heterozygous single nucleotide variants. CIMS sites were found to be almost exclusive C‐to‐T conversions (n = 6,225, 88% ± 5.8%) independent of the alignment software used (3 aligners n = 2677, 2 n = 2411, 1 n = 1137). For a stringent CITS set, we filtered CITS sites (n = 22,917) that mostly truncated at A residues (n = 11,897, 52%) and were followed by C residues (CITS‐AC; n = 6,799, 57%). Two thousand three hundred and two (37%) of C‐to‐T CIMS overlapped within a 1nt window to CITS‐AC sites, suggesting that in many cases the same nucleotide was identified. Together, we considered a set of 13,024 C‐to‐T conversions CIMS and AC truncation CITS across 2,464 genes for our final S2 cell miCLIP data set. CITS site were annotated as described before (Wessels et al, 2019). For representation purposes, we simplified the annotation categories. All CITS not annotated to 5’UTR, CDS, 3’UTR, or intron were summarized in the category “other”. Enrichments were calculated relative to median feature proportions (5'UTR = 0.08 (131nt), CDS = 0.78 (1309.5nt), 3'UTR = 0.14 (234nt)) determined previously for S2 cells (Wessels et al, 2019). Enrichments for sites annotated as intronic were set to 1.
SELECT
SELECT was performed as described previously (Mao et al, 2019). Briefly, 1 μg total RNA of isolated 3rd instar larval brains of the indicated genotypes was diluted in 5 μM dNTPs, 40 nM up and 40 nM down primers (m6A_1 up: TAGCCAGTACCGTAGTGCGTGTTGGTTTTGGTTTGGGTG; m6A_1 down: CTTTCTTTGGTTTTGGTTAATAACTCAGAGGCTGAGTCGCTGCAT; m6A_2 up: TAGCCAGTACCGTAGTGCGTGGTTTTTTTTCGACTTTGCTTAATTG; m6A_2 down: CTTTCGGTTTTTGGTTTTGTTCAGAGGCTGAGTCGCTGCAT; Control up: TAGCCAGTACCGTAGTGCGTGGTTTTTTTTCGACTTTGCTTAATTGT; Control down: TTTCGGTTTTTGGTTTTGTTTCAGAGGCTGAGTCGCTGCAT), targeting the m6A or a control site one nucleotide upstream of the m6A_2 site on futsch, and 1 × CutSmart buffer (NEB) to 17 μl. Annealing of primers was performed for 1 min at each 90°C, 80°C, 70°C, 60°C, 50°C, and 6 min at 40°C. Afterward, 0.01U Bst 2.0 DNA polymerase, 0.5U SplintR ligase and 10 nmol ATP was added in a total volume of 3 μl and incubated for 20 min at 40°C and 80°C. qPCR for quantification was carried out using 4 μl of SELECT reaction in a 20 μl reaction volume using SYBR green. Relative SELECT products were calculated by normalization to the RNA abundance determined by the control site and the wild‐type control.
Statistics
Multiple comparisons of the NMJ phenotypes were performed using one‐way ANOVA with a post hoc Sidak–Bonferroni correction (n.s. = not significant; *P < 0.05; **P < 0.01; ***P < 0.001; ****P < 0.0001). P values of Western blot quantification, RIP experiments, and SELECT were determined with an unpaired, two‐tailed Student’s t‐test. (n.s. = not significant; *p < 0.05; **p < 0.01; ***p < 0.001; ****p < 0.0001). The significance of the overlap of the TRIBE and miCLIP datasets was determined by a hypergeometric test.
Author contributions
AS, LW, AQ, and J‐YR conceived the study. AS, LW, CP, SL, MMMu, TL, H‐HW, MN, GA, FXRS, MS, RRE, AB, MMMö, MV, FB, JK, UO, CD, ED, AQ, and J‐YR performed the methodology. AS and LW wrote the draft of the manuscript. All authors reviewed and edited the manuscript. AS, AQ, and J‐YR supervised the study and overall contributed equally.
Conflict of interest
The authors declare that they have no conflict of interest.
Supporting information
Appendix
Expanded View Figures PDF
Dataset EV1
Dataset EV2
Dataset EV3
Dataset EV4
Dataset EV5
Dataset EV6
Source Data for Expanded View and Appendix
Review Process File
Source Data for Figure 1
Source Data for Figure 2
Source Data for Figure 3
Source Data for Figure 4
Source Data for Figure 5
Source Data for Figure 6
Source Data for Figure 7
Source Data for Figure 8
Acknowledgements
We thank the Bloomington Drosophila Stock Center, the Vienna Drosophila Resource Center and the Drosophila Genomics Resource Center at Indiana University for stocks, plasmids and cell lines; members of the Quattrone and Roignant labs for helpful discussion. We thank the IMB Genomics core facility for their helpful support and the use of its NextSeq500 (INST 247/870‐1 FUGG), the advanced Imaging Facility and the Next Generation Sequencing at CIBIO Department for great support. Support by IMB Proteomics Core Facility is gratefully acknowledged (instrument is funded by DFG INST 247/766‐1 FUGG). In particular, we wish to thank Anja Freiwald from IMB Proteomics core facility for sample preparation and Dr. Mario Dejung from Proteomics core facility for data processing. We thank Prof. Bassem Hassan and Prof. Paola Bellosta for kindly sharing Drosophila stocks and Dr. Fabian Feiguin for sharing stocks and the anti‐Futsch antibody. We thank Tobias Jakobi for help with loading TRIBE datasets. Research in the laboratory of J.‐Y.R. is supported by the University of Lausanne, the Deutsch‐Israelische Projektkooperation (DIP) RO 4681/6‐1, the Deutsche Forschungsgemeinschaft RO 4681/9‐1, RO 4681/12‐1, RO 4681/13‐1 and the Epitran COST action (CA16120). Research in the laboratory of A. Q. is supported by the AIRC Foundation, The CARITRO Foundation, a private donation by the Zobele family and the Epitran COST action (CA16120). The Vermeulen lab is part of the Oncode Institute, which is partly funded by the Dutch Cancer Society (KWF). This project (Alessia Soldano in the A.Q. lab) has received funding from the European Union's Horizon 2020 research and innovation programme under the Marie Skłodowska Curie grant agreement No 752621. Chiara Paolantoni in the lab of J.Y.R. is supported by a Boehringer Ingelheim Fonds fellowship.
The EMBO Journal (2021) 40: e104975.
These authors contributed equally to this work as senior authors.
Contributor Information
Alessandro Quattrone, Email: alessandro.quattrone@unitn.it.
Alessia Soldano, Email: alessia.soldano@unitn.it.
Jean‐Yves Roignant, Email: jean-yves.roignant@unil.ch.
Data availability
TRIBE‐seq: https://www.ncbi.nlm.nih.gov/bioproject/?term=PRJNA605328.
miCLIP‐seq: https://www.ncbi.nlm.nih.gov/geo/query/acc.cgi?acc=GSE145342
RIP‐seq: https://www.ncbi.nlm.nih.gov/geo/query/acc.cgi?acc=GSE161655
References
- Angelova MT, Dimitrova DG, Dinges N, Lence T, Worpenberg L, Carre C, Roignant JY (2018) The emerging field of epitranscriptomics in neurodevelopmental and neuronal disorders. Front Bioeng Biotechnol 6: 46 [DOI] [PMC free article] [PubMed] [Google Scholar]
- Arguello AE, DeLiberto AN, Kleiner RE (2017) RNA chemical proteomics reveals the N(6)‐methyladenosine (m(6)A)‐regulated protein‐RNA interactome. J Am Chem Soc 139: 17249–17252 [DOI] [PubMed] [Google Scholar]
- Bagni C, Zukin RS (2019) A synaptic perspective of fragile X syndrome and autism spectrum disorders. Neuron 101: 1070–1088 [DOI] [PMC free article] [PubMed] [Google Scholar]
- Bolduc FV, Bell K, Cox H, Broadie KS, Tully T (2008) Excess protein synthesis in Drosophila fragile X mutants impairs long‐term memory. Nat Neurosci 11: 1143–1145 [DOI] [PMC free article] [PubMed] [Google Scholar]
- Chang M, Lv H, Zhang W, Ma C, He X, Zhao S, Zhang ZW, Zeng YX, Song S, Niu Y et al (2017) Region‐specific RNA m(6)A methylation represents a new layer of control in the gene regulatory network in the mouse brain. Open Biol 7: 170166 [DOI] [PMC free article] [PubMed] [Google Scholar]
- Chen E, Sharma MR, Shi X, Agrawal RK, Joseph S (2014) Fragile X mental retardation protein regulates translation by binding directly to the ribosome. Mol Cell 54: 407–417 [DOI] [PMC free article] [PubMed] [Google Scholar]
- Chen J, Zhang YC, Huang C, Shen H, Sun B, Cheng X, Zhang YJ, Yang YG, Shu Q, Yang Y et al (2019) m(6)A regulates neurogenesis and neuronal development by modulating histone methyltransferase Ezh2. Genomics Proteomics Bioinformatics 17: 154–168 [DOI] [PMC free article] [PubMed] [Google Scholar]
- Coffee RL Jr, Tessier CR, Woodruff EA III, Broadie K (2010) Fragile X mental retardation protein has a unique, evolutionarily conserved neuronal function not shared with FXR1P or FXR2P. Dis Model Mech 3: 471–485 [DOI] [PMC free article] [PubMed] [Google Scholar]
- Dahlhaus R (2018) Of Men and Mice: Modeling the Fragile X Syndrome. Front Mol Neurosci 11: 41 [DOI] [PMC free article] [PubMed] [Google Scholar]
- Darnell JC, Van Driesche SJ, Zhang C, Hung KY, Mele A, Fraser CE, Stone EF, Chen C, Fak JJ, Chi SW et al (2011) FMRP stalls ribosomal translocation on mRNAs linked to synaptic function and autism. Cell 146: 247–261 [DOI] [PMC free article] [PubMed] [Google Scholar]
- Davis JK, Broadie K (2017) Multifarious functions of the fragile X mental retardation protein. Trends Genet 33: 703–714 [DOI] [PMC free article] [PubMed] [Google Scholar]
- Dobin A, Davis CA, Schlesinger F, Drenkow J, Zaleski C, Jha S, Batut P, Chaisson M, Gingeras TR (2013) STAR: ultrafast universal RNA‐seq aligner. Bioinformatics 29: 15–21 [DOI] [PMC free article] [PubMed] [Google Scholar]
- Dodt M, Roehr JT, Ahmed R, Dieterich C (2012) FLEXBAR‐flexible barcode and adapter processing for next‐generation sequencing platforms. Biology 1: 895–905 [DOI] [PMC free article] [PubMed] [Google Scholar]
- Dominissini D, Moshitch‐Moshkovitz S, Schwartz S, Salmon‐Divon M, Ungar L, Osenberg S, Cesarkas K, Jacob‐Hirsch J, Amariglio N, Kupiec M et al (2012) Topology of the human and mouse m6A RNA methylomes revealed by m6A‐seq. Nature 485: 201–206 [DOI] [PubMed] [Google Scholar]
- Drozd M, Bardoni B, Capovilla M (2018) Modeling fragile X syndrome in Drosophila . Front Mol Neurosci 11: 124 [DOI] [PMC free article] [PubMed] [Google Scholar]
- Du K, Zhang L, Lee T, Sun T (2019) m(6)A RNA methylation controls neural development and is involved in human diseases. Mol Neurobiol 56: 1596–1606 [DOI] [PubMed] [Google Scholar]
- Edens BM, Vissers C, Su J, Arumugam S, Xu Z, Shi H, Miller N, Rojas Ringeling F, Ming GL, He C et al (2019) FMRP modulates neural differentiation through m(6)A‐dependent mRNA nuclear export. Cell Rep 28: 845–854 [DOI] [PMC free article] [PubMed] [Google Scholar]
- Edupuganti RR, Geiger S, Lindeboom RGH, Shi H, Hsu PJ, Lu Z, Wang SY, Baltissen MPA, Jansen P, Rossa M et al (2017) N(6)‐methyladenosine (m(6)A) recruits and repels proteins to regulate mRNA homeostasis. Nat Struct Mol Biol 24: 870–878 [DOI] [PMC free article] [PubMed] [Google Scholar]
- Engel M, Eggert C, Kaplick PM, Eder M, Roh S, Tietze L, Namendorf C, Arloth J, Weber P, Rex‐Haffner M et al (2018) The Role of m(6)A/m‐RNA Methylation in Stress Response Regulation. Neuron 99: 389–403 [DOI] [PMC free article] [PubMed] [Google Scholar]
- Garber K, Smith KT, Reines D, Warren ST (2006) Transcription, translation and fragile X syndrome. Curr Opin Genet Dev 16: 270–275 [DOI] [PubMed] [Google Scholar]
- Garber KB, Visootsak J, Warren ST (2008) Fragile X syndrome. Eur J Hum Genet 16: 666–672 [DOI] [PMC free article] [PubMed] [Google Scholar]
- Garcia‐Campos MA, Edelheit S, Toth U, Safra M, Shachar R, Viukov S, Winkler R, Nir R, Lasman L, Brandis A et al (2019) Deciphering the "m(6)A Code" via Antibody‐Independent Quantitative Profiling. Cell 178(3): 731–747 [DOI] [PubMed] [Google Scholar]
- Hagerman RJ, Des‐Portes V, Gasparini F, Jacquemont S, Gomez‐Mancilla B (2014) Translating molecular advances in fragile X syndrome into therapy: a review. J Clin Psychiatry 75: e294–e307 [DOI] [PubMed] [Google Scholar]
- Hagerman RJ, Miller LJ, McGrath‐Clarke J, Riley K, Goldson E, Harris SW, Simon J, Church K, Bonnell J, Ognibene TC et al (2002) Influence of stimulants on electrodermal studies in Fragile X syndrome. Microsc Res Tech 57: 168–173 [DOI] [PubMed] [Google Scholar]
- Haussmann IU, Bodi Z, Sanchez‐Moran E, Mongan NP, Archer N, Fray RG, Soller M (2016) m(6)A potentiates Sxl alternative pre‐mRNA splicing for robust Drosophila sex determination. Nature 540: 301–304 [DOI] [PubMed] [Google Scholar]
- Hsu PJ, Shi H, He C (2017) Epitranscriptomic influences on development and disease. Genome Biol 18: 197 [DOI] [PMC free article] [PubMed] [Google Scholar]
- Hsu PJ, Shi H, Zhu AC, Lu Z, Miller N, Edens BM, Ma YC, He C (2019) The RNA‐binding protein FMRP facilitates the nuclear export of N (6)‐methyladenosine‐containing mRNAs. J Biol Chem 294: 19889–19895 [DOI] [PMC free article] [PubMed] [Google Scholar]
- Ishizuka A, Siomi MC, Siomi H (2002) A Drosophila fragile X protein interacts with components of RNAi and ribosomal proteins. Genes Dev 16: 2497–2508 [DOI] [PMC free article] [PubMed] [Google Scholar]
- Jacquemont S, Pacini L, Jonch AE, Cencelli G, Rozenberg I, He Y, D'Andrea L, Pedini G, Eldeeb M, Willemsen R et al (2018) Protein synthesis levels are increased in a subset of individuals with fragile X syndrome. Hum Mol Genet 27: 2039–2051 [DOI] [PMC free article] [PubMed] [Google Scholar]
- Jaenisch R, Bird A (2003) Epigenetic regulation of gene expression: how the genome integrates intrinsic and environmental signals. Nat Genet 33(Suppl): 245–254 [DOI] [PubMed] [Google Scholar]
- Jung Y, Goldman D (2018) Role of RNA modifications in brain and behavior. Genes Brain Behav 17: e12444 [DOI] [PMC free article] [PubMed] [Google Scholar]
- Kan L, Grozhik AV, Vedanayagam J, Patil DP, Pang N, Lim KS, Huang YC, Joseph B, Lin CJ, Despic V et al (2017) The m(6)A pathway facilitates sex determination in Drosophila . Nat Commun 8: 15737 [DOI] [PMC free article] [PubMed] [Google Scholar]
- Kashima R, Redmond PL, Ghatpande P, Roy S, Kornberg TB, Hanke T, Knapp S, Lagna G, Hata A (2017) Hyperactive locomotion in a Drosophila model is a functional readout for the synaptic abnormalities underlying fragile X syndrome. Sci Signal 10: eaai8133 [DOI] [PMC free article] [PubMed] [Google Scholar]
- Ke S, Alemu EA, Mertens C, Gantman EC, Fak JJ, Mele A, Haripal B, Zucker‐Scharff I, Moore MJ, Park CY et al (2015) A majority of m6A residues are in the last exons, allowing the potential for 3' UTR regulation. Genes Dev 29: 2037–2053 [DOI] [PMC free article] [PubMed] [Google Scholar]
- Kidd SA, Lachiewicz A, Barbouth D, Blitz RK, Delahunty C, McBrien D, Visootsak J, Berry‐Kravis E (2014) Fragile X syndrome: a review of associated medical problems. Pediatrics 134: 995–1005 [DOI] [PubMed] [Google Scholar]
- Klemmer P, Meredith RM, Holmgren CD, Klychnikov OI, Stahl‐Zeng J, Loos M, van der Schors RC, Wortel J, de Wit H, Spijker S et al (2011) Proteomics, ultrastructure, and physiology of hippocampal synapses in a fragile X syndrome mouse model reveal presynaptic phenotype. J Biol Chem 286: 25495–25504 [DOI] [PMC free article] [PubMed] [Google Scholar]
- Koranda JL, Dore L, Shi H, Patel MJ, Vaasjo LO, Rao MN, Chen K, Lu Z, Yi Y, Chi W et al (2018) Mettl14 Is Essential for Epitranscriptomic Regulation of Striatal Function and Learning. Neuron 99: 283–292 [DOI] [PMC free article] [PubMed] [Google Scholar]
- Laggerbauer B, Ostareck D, Keidel EM, Ostareck‐Lederer A, Fischer U (2001) Evidence that fragile X mental retardation protein is a negative regulator of translation. Hum Mol Genet 10: 329–338 [DOI] [PubMed] [Google Scholar]
- Lasman L, Krupalnik V, Viukov S, Mor N, Aguilera‐Castrejon A, Schneir D, Bayerl J, Mizrahi O, Peles S, Tawil S et al (2020) Context‐dependent functional compensation between Ythdf m(6)A reader proteins. Genes Dev 34: 1373–1391 [DOI] [PMC free article] [PubMed] [Google Scholar]
- Lence T, Akhtar J, Bayer M, Schmid K, Spindler L, Ho CH, Kreim N, Andrade‐Navarro MA, Poeck B, Helm M et al (2016) m(6)A modulates neuronal functions and sex determination in Drosophila . Nature 540: 242–247 [DOI] [PubMed] [Google Scholar]
- Lence T, Paolantoni C, Worpenberg L, Roignant JY (2019) Mechanistic insights into m(6)A RNA enzymes. Biochim Biophys Acta Gene Regul Mech 1862: 222–229 [DOI] [PubMed] [Google Scholar]
- Lence T, Soller M, Roignant JY (2017) A fly view on the roles and mechanisms of the m(6)A mRNA modification and its players. RNA Biol 14: 1232–1240 [DOI] [PMC free article] [PubMed] [Google Scholar]
- Li H, Durbin R (2009) Fast and accurate short read alignment with Burrows‐Wheeler transform. Bioinformatics 25: 1754–1760 [DOI] [PMC free article] [PubMed] [Google Scholar]
- Li J, Yang X, Qi Z, Sang Y, Liu Y, Xu B, Liu W, Xu Z, Deng Y (2019) The role of mRNA m(6)A methylation in the nervous system. Cell Biosci 9: 66 [DOI] [PMC free article] [PubMed] [Google Scholar]
- Li L, Zang L, Zhang F, Chen J, Shen H, Shu L, Liang F, Feng C, Chen D, Tao H et al (2017) Fat mass and obesity‐associated (FTO) protein regulates adult neurogenesis. Hum Mol Genet 26: 2398–2411 [DOI] [PMC free article] [PubMed] [Google Scholar]
- Li M, Zhao X, Wang W, Shi H, Pan Q, Lu Z, Perez SP, Suganthan R, He C, Bjoras M et al (2018) Ythdf2‐mediated m(6)A mRNA clearance modulates neural development in mice. Genome Biol 19: 69 [DOI] [PMC free article] [PubMed] [Google Scholar]
- Li Z, Zhang Y, Ku L, Wilkinson KD, Warren ST, Feng Y (2001) The fragile X mental retardation protein inhibits translation via interacting with mRNA. Nucleic Acids Res 29: 2276–2283 [DOI] [PMC free article] [PubMed] [Google Scholar]
- Liao S, Sun H, Xu C (2018) YTH domain: a family of N(6)‐methyladenosine (m(6)A) readers. Genomics Proteomics Bioinformatics 16: 99–107 [DOI] [PMC free article] [PubMed] [Google Scholar]
- Linder B, Grozhik AV, Olarerin‐George AO, Meydan C, Mason CE, Jaffrey SR (2015) Single‐nucleotide‐resolution mapping of m6A and m6Am throughout the transcriptome. Nat Methods 12: 767–772 [DOI] [PMC free article] [PubMed] [Google Scholar]
- Livneh I, Moshitch‐Moshkovitz S, Amariglio N, Rechavi G, Dominissini D (2020) The m(6)A epitranscriptome: transcriptome plasticity in brain development and function. Nat Rev Neurosci 21: 36–51 [DOI] [PubMed] [Google Scholar]
- Love MI, Huber W, Anders S (2014) Moderated estimation of fold change and dispersion for RNA‐seq data with DESeq2. Genome Biol 15: 550 [DOI] [PMC free article] [PubMed] [Google Scholar]
- Lu R, Wang H, Liang Z, Ku L, O’Donnell WT, Li W, Warren ST, Feng Y (2004) The fragile X protein controls microtubule‐associated protein 1B translation and microtubule stability in brain neuron development. Proc Natl Acad Sci USA 101: 15201–15206 [DOI] [PMC free article] [PubMed] [Google Scholar]
- Ma C, Chang M, Lv H, Zhang ZW, Zhang W, He X, Wu G, Zhao S, Zhang Y, Wang D et al (2018) RNA m(6)A methylation participates in regulation of postnatal development of the mouse cerebellum. Genome Biol 19: 68 [DOI] [PMC free article] [PubMed] [Google Scholar]
- Mao Y, Dong L, Liu XM, Guo J, Ma H, Shen B, Qian SB (2019) m(6)A in mRNA coding regions promotes translation via the RNA helicase‐containing YTHDC2. Nat Commun 10: 5332 [DOI] [PMC free article] [PubMed] [Google Scholar]
- Martin M (2011) Cutadapt removes adapter sequences from high‐throughput sequencing reads. EMBnet Journal 17: 10–12 [Google Scholar]
- Maurin T, Zongaro S, Bardoni B (2014) Fragile X Syndrome: from molecular pathology to therapy. Neurosci Biobehav Rev 46(Pt 2): 242–255 [DOI] [PubMed] [Google Scholar]
- McMahon AC, Rahman R, Jin H, Shen JL, Fieldsend A, Luo W, Rosbash M (2016) TRIBE: hijacking an RNA‐editing enzyme to identify cell‐specific targets of RNA‐binding proteins. Cell 165: 742–753 [DOI] [PMC free article] [PubMed] [Google Scholar]
- Merkurjev D, Hong WT, Iida K, Oomoto I, Goldie BJ, Yamaguti H, Ohara T, Kawaguchi SY, Hirano T, Martin KC et al (2018) Synaptic N(6)‐methyladenosine (m(6)A) epitranscriptome reveals functional partitioning of localized transcripts. Nat Neurosci 21: 1004–1014 [DOI] [PubMed] [Google Scholar]
- Meyer KD, Saletore Y, Zumbo P, Elemento O, Mason CE, Jaffrey SR (2012) Comprehensive analysis of mRNA methylation reveals enrichment in 3' UTRs and near stop codons. Cell 149: 1635–1646 [DOI] [PMC free article] [PubMed] [Google Scholar]
- Mi H, Muruganujan A, Huang X, Ebert D, Mills C, Guo X, Thomas PD (2019) Protocol update for large‐scale genome and gene function analysis with the PANTHER classification system (v.14.0). Nat Protoc 14: 703–721 [DOI] [PMC free article] [PubMed] [Google Scholar]
- Michel CI, Kraft R, Restifo LL (2004) Defective neuronal development in the mushroom bodies of Drosophila fragile X mental retardation 1 mutants. J Neurosci 24: 5798–5809 [DOI] [PMC free article] [PubMed] [Google Scholar]
- Patil DP, Pickering BF, Jaffrey SR (2018) Reading m(6)A in the transcriptome: m(6)A‐binding proteins. Trends Cell Biol 28: 113–127 [DOI] [PMC free article] [PubMed] [Google Scholar]
- Reeve SP, Bassetto L, Genova GK, Kleyner Y, Leyssen M, Jackson FR, Hassan BA (2005) The Drosophila fragile X mental retardation protein controls actin dynamics by directly regulating profilin in the brain. Curr Biol 15: 1156–1163 [DOI] [PubMed] [Google Scholar]
- Roignant JY, Soller M (2017) m(6)A in mRNA: an ancient mechanism for fine‐tuning gene expression. Trends Genet 33: 380–390 [DOI] [PubMed] [Google Scholar]
- Rousseau F, Labelle Y, Bussieres J, Lindsay C (2011) The fragile x mental retardation syndrome 20 years after the FMR1 gene discovery: an expanding universe of knowledge. Clin Biochem Rev 32: 135–162 [PMC free article] [PubMed] [Google Scholar]
- Sahoo PK, Lee SJ, Jaiswal PB, Alber S, Kar AN, Miller‐Randolph S, Taylor EE, Smith T, Singh B, Ho TS et al (2018) Axonal G3BP1 stress granule protein limits axonal mRNA translation and nerve regeneration. Nat Commun 9: 3358 [DOI] [PMC free article] [PubMed] [Google Scholar]
- Santoro MR, Bray SM, Warren ST (2012) Molecular mechanisms of fragile X syndrome: a twenty‐year perspective. Annu Rev Pathol 7: 219–245 [DOI] [PubMed] [Google Scholar]
- Schaefer TL, Davenport MH, Erickson CA (2015) Emerging pharmacologic treatment options for fragile X syndrome. Appl Clin Genet 8: 75–93 [DOI] [PMC free article] [PubMed] [Google Scholar]
- Shah A, Qian Y, Weyn‐Vanhentenryck SM, Zhang C (2017) CLIP Tool Kit (CTK): a flexible and robust pipeline to analyze CLIP sequencing data. Bioinformatics 33: 566–567 [DOI] [PMC free article] [PubMed] [Google Scholar]
- Shi H, Zhang X, Weng YL, Lu Z, Liu Y, Lu Z, Li J, Hao P, Zhang Y, Zhang F et al (2018) m(6)A facilitates hippocampus‐dependent learning and memory through YTHDF1. Nature 563: 249–253 [DOI] [PMC free article] [PubMed] [Google Scholar]
- Stefani G, Fraser CE, Darnell JC, Darnell RB (2004) Fragile X mental retardation protein is associated with translating polyribosomes in neuronal cells. J Neurosci 24: 7272–7276 [DOI] [PMC free article] [PubMed] [Google Scholar]
- Suhl JA, Chopra P, Anderson BR, Bassell GJ, Warren ST (2014) Analysis of FMRP mRNA target datasets reveals highly associated mRNAs mediated by G‐quadruplex structures formed via clustered WGGA sequences. Hum Mol Genet 23: 5479–5491 [DOI] [PMC free article] [PubMed] [Google Scholar]
- Supek F, Bošnjak M, Škunca N, Šmuc T (2011) REVIGO summarizes and visualizes long lists of gene ontology terms. PLoS One 6: e21800 [DOI] [PMC free article] [PubMed] [Google Scholar]
- Sutandy FX, Hildebrandt A, Konig J (2016) Profiling the binding Sites of RNA‐binding proteins with nucleotide resolution using iCLIP. Methods Mol Biol 1358: 175–195 [DOI] [PubMed] [Google Scholar]
- Thomas A, Lee PJ, Dalton JE, Nomie KJ, Stoica L, Costa‐Mattioli M, Chang P, Nuzhdin S, Arbeitman MN, Dierick HA (2012) A versatile method for cell‐specific profiling of translated mRNAs in Drosophila . PLoS One 7: e40276 [DOI] [PMC free article] [PubMed] [Google Scholar]
- Ui K, Nishihara S, Sakuma M, Togashi S, Ueda R, Miyata Y, Miyake T (1994) Newly established cell lines from Drosophila larval CNS express neural specific characteristics. Vitro Cell Dev Biol Anim 30A: 209–216 [DOI] [PubMed] [Google Scholar]
- Utari A, Adams E, Berry‐Kravis E, Chavez A, Scaggs F, Ngotran L, Boyd A, Hessl D, Gane LW, Tassone F et al (2010) Aging in fragile X syndrome. J Neurodev Disord 2: 70–76 [DOI] [PMC free article] [PubMed] [Google Scholar]
- Verheyen EM, Cooley L (1994) Profilin mutations disrupt multiple actin‐dependent processes during Drosophila development. Development 120: 717–728 [DOI] [PubMed] [Google Scholar]
- Wang CX, Cui GS, Liu X, Xu K, Wang M, Zhang XX, Jiang LY, Li A, Yang Y, Lai WY et al (2018) METTL3‐mediated m6A modification is required for cerebellar development. PLoS Biol 16: e2004880 [DOI] [PMC free article] [PubMed] [Google Scholar]
- Webster CL, Longdon B, Lewis SH, Obbard DJ (2016) Twenty‐five new viruses associated with the Drosophilidae (Diptera). Evol Bioinform Online 12: 13–25 [DOI] [PMC free article] [PubMed] [Google Scholar]
- Weng YL, Wang X, An R, Cassin J, Vissers C, Liu Y, Liu Y, Xu T, Wang X, Wong SZH et al (2018) Epitranscriptomic m(6)A regulation of axon regeneration in the adult mammalian nervous system. Neuron 97: 313–325 [DOI] [PMC free article] [PubMed] [Google Scholar]
- Wessels HH, Lebedeva S, Hirsekorn A, Wurmus R, Akalin A, Mukherjee N, Ohler U (2019) Global identification of functional microRNA‐mRNA interactions in Drosophila . Nat Commun 10: 1626 [DOI] [PMC free article] [PubMed] [Google Scholar]
- Widagdo J, Anggono V (2018) The m6A‐epitranscriptomic signature in neurobiology: from neurodevelopment to brain plasticity. J Neurochem 147: 137–152 [DOI] [PubMed] [Google Scholar]
- Widagdo J, Zhao QY, Kempen MJ, Tan MC, Ratnu VS, Wei W, Leighton L, Spadaro PA, Edson J, Anggono V et al (2016) Experience‐dependent accumulation of N6‐methyladenosine in the prefrontal cortex is associated with memory processes in mice. J Neurosci 36: 6771–6777 [DOI] [PMC free article] [PubMed] [Google Scholar]
- Worpenberg L, Jakobi T, Dieterich C, Roignant JY (2019) Identification of methylated transcripts using the TRIBE approach. Methods Mol Biol 1870: 89–106 [DOI] [PubMed] [Google Scholar]
- Xiao Y, Wang Y, Tang Q, Wei L, Zhang X, Jia G (2018) An elongation‐ and ligation‐based qPCR amplification method for the radiolabeling‐free detection of locus‐specific N(6) ‐methyladenosine modification. Angew Chem Int Ed Engl 57: 15995–16000 [DOI] [PubMed] [Google Scholar]
- Xu D, Shen W, Guo R, Xue Y, Peng W, Sima J, Yang J, Sharov A, Srikantan S, Yang J et al (2013) Top3beta is an RNA topoisomerase that works with fragile X syndrome protein to promote synapse formation. Nat Neurosci 16: 1238–1247 [DOI] [PMC free article] [PubMed] [Google Scholar]
- Xu W, Rahman R, Rosbash M (2018) Mechanistic implications of enhanced editing by a HyperTRIBE RNA‐binding protein. RNA 24: 173–182 [DOI] [PMC free article] [PubMed] [Google Scholar]
- Yoon KJ, Ming GL, Song H (2018) Epitranscriptomes in the adult mammalian brain: dynamic changes regulate behavior. Neuron 99: 243–245 [DOI] [PMC free article] [PubMed] [Google Scholar]
- Yu J, Chen M, Huang H, Zhu J, Song H, Zhu J, Park J, Ji SJ (2018) Dynamic m6A modification regulates local translation of mRNA in axons. Nucleic Acids Res 46: 1412–1423 [DOI] [PMC free article] [PubMed] [Google Scholar]
- Zaccara S, Jaffrey SR (2020) A Unified Model for the Function of YTHDF Proteins in Regulating m(6)A‐Modified mRNA. Cell 181: 1582–1595 [DOI] [PMC free article] [PubMed] [Google Scholar]
- Zhang F, Kang Y, Wang M, Li Y, Xu T, Yang W, Song H, Wu H, Shu Q, Jin P (2018) Fragile X mental retardation protein modulates the stability of its m6A‐marked messenger RNA targets. Hum Mol Genet 27: 3936–3950 [DOI] [PMC free article] [PubMed] [Google Scholar]
- Zhang YQ, Bailey AM, Matthies HJ, Renden RB, Smith MA, Speese SD, Rubin GM, Broadie K (2001) Drosophila fragile X‐related gene regulates the MAP1B homolog Futsch to control synaptic structure and function. Cell 107: 591–603 [DOI] [PubMed] [Google Scholar]
- Zhao BS, Roundtree IA, He C (2017) Post‐transcriptional gene regulation by mRNA modifications. Nat Rev Mol Cell Biol 18: 31–42 [DOI] [PMC free article] [PubMed] [Google Scholar]
- Zhao YL, Liu YH, Wu RF, Bi Z, Yao YX, Liu Q, Wang YZ, Wang XX (2019) Understanding m(6)A function through uncovering the diversity roles of YTH domain‐containing proteins. Mol Biotechnol 61: 355–364 [DOI] [PubMed] [Google Scholar]
- Zhuang M, Li X, Zhu J, Zhang J, Niu F, Liang F, Chen M, Li D, Han P, Ji SJ (2019) The m6A reader YTHDF1 regulates axon guidance through translational control of Robo3.1 expression. Nucleic Acids Res 47: 4765–4777 [DOI] [PMC free article] [PubMed] [Google Scholar]
Associated Data
This section collects any data citations, data availability statements, or supplementary materials included in this article.
Supplementary Materials
Appendix
Expanded View Figures PDF
Dataset EV1
Dataset EV2
Dataset EV3
Dataset EV4
Dataset EV5
Dataset EV6
Source Data for Expanded View and Appendix
Review Process File
Source Data for Figure 1
Source Data for Figure 2
Source Data for Figure 3
Source Data for Figure 4
Source Data for Figure 5
Source Data for Figure 6
Source Data for Figure 7
Source Data for Figure 8
Data Availability Statement
TRIBE‐seq: https://www.ncbi.nlm.nih.gov/bioproject/?term=PRJNA605328.
miCLIP‐seq: https://www.ncbi.nlm.nih.gov/geo/query/acc.cgi?acc=GSE145342
RIP‐seq: https://www.ncbi.nlm.nih.gov/geo/query/acc.cgi?acc=GSE161655