Abstract
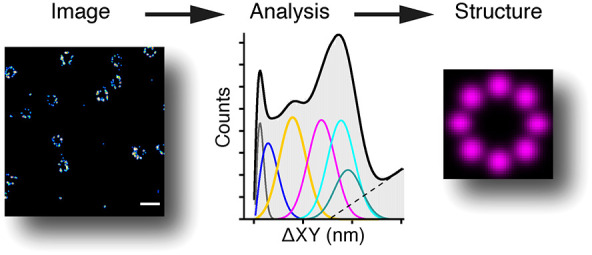
Inferring the organization of fluorescently labeled nanosized structures from single molecule localization microscopy (SMLM) data, typically obscured by stochastic noise and background, remains challenging. To overcome this, we developed a method to extract high-resolution ordered features from SMLM data that requires only a low fraction of targets to be localized with high precision. First, experimentally measured localizations are analyzed to produce relative position distributions (RPDs). Next, model RPDs are constructed using hypotheses of how the molecule is organized. Finally, a statistical comparison is used to select the most likely model. This approach allows pattern recognition at sub-1% detection efficiencies for target molecules, in large and heterogeneous samples and in 2D and 3D data sets. As a proof-of-concept, we infer ultrastructure of Nup107 within the nuclear pore, DNA origami structures, and α-actinin-2 within the cardiomyocyte Z-disc and assess the quality of images of centrioles to improve the averaged single-particle reconstruction.
Keywords: Super-resolution microscopy, Image analysis, Protein organization, Single molecule localization, Spatial pattern statistics, Nanoscale structures
Single molecule localization microscopy (SMLM) approaches, which can achieve localization precisions below 20 nm laterally and 50 nm axially, at or near the molecular scale1 can reveal the organization of nanostructures such as supramolecular complexes and DNA assemblies. However, interpreting image reconstructions (localization maps) generated by SMLM is not trivial as intrinsic noise arising from the stochastic switching of fluorophores can obscure underlying molecular order. This is most challenging when the fraction of target molecules localized with high precision is low, a common result of a low labeling density, low switching efficiency, or high background signal in 3D imaging.2
Single-particle averaging and reconstruction techniques can enhance the signal-to-noise ratio and reveal underlying patterns of organization from SMLM data.3−8 Similarly, 1D and 2D autocorrelation (e.g., Fourier-domain processing) of SMLM reconstructions can reveal periodicity in a biological structure.9,10 However, these methods require the target molecule to be efficiently labeled, detected with high signal-to-noise ratio, and the complex to be very highly ordered. To perform averaging, they also require either consistent orientation of the biological complex or classification and alignment of the segmented regions of interest (ROIs), which presents further challenges.2 This restricts the applicability of existing methods to a small subset of nanostructures. Data pixelation in these techniques is an extra processing step that loses precision on the molecular localization coordinates from SMLM.
To overcome these limitations, we developed a new approach for pattern analysis and recognition of order in SMLM data. It can assess any 2D or 3D SMLM data set for regular structures through the analysis of relative positions (RPs) of localizations. This technique (pattern extraction from relative positions of localizations, or PERPL) extends previous work using pair correlation11−13 by extending the analysis into 3D. Further, it compares experimental intermolecular distances against models of ordered and disordered macromolecular geometry and uses appropriate statistical methods to determine the most probable model. It can be applied to large, 3D data sets in their entirety, on a standard laptop, making it a valuable addition to the SMLM analysis toolkit.
Results and Discussion
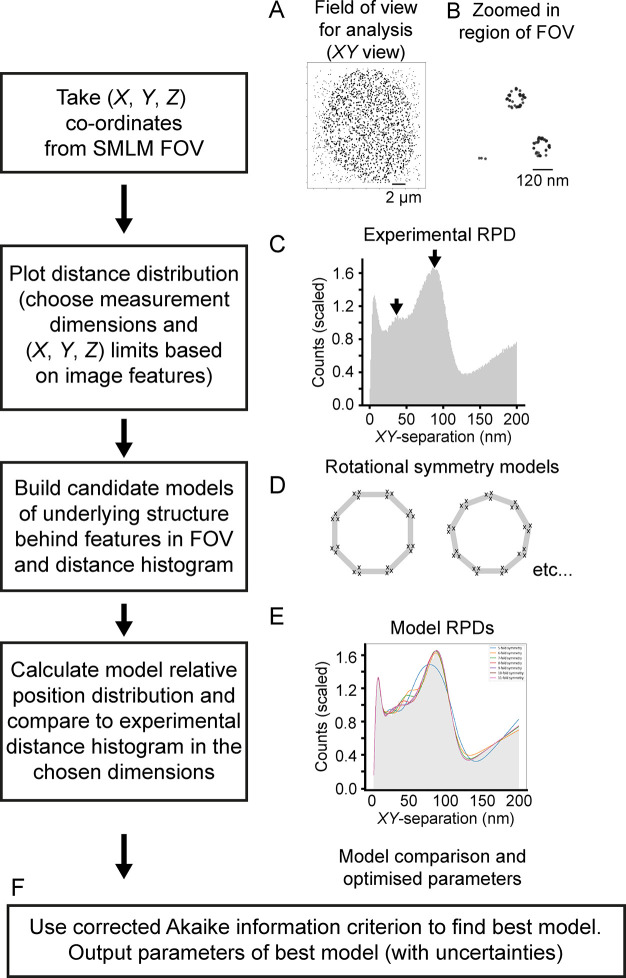
PERPL calculates the relative positions (RPs) between single molecule localization coordinates (XYZ) in 2D or 3D, calculates their distribution (RPD), and interprets this distribution using model distributions (Figure 1). The experimental RPD is generated from the 3D relative positions (ΔX, ΔY, ΔZ) between each localization and all nearby localizations, within a chosen distance, for the entire FOV. The localization data does not need to be prealigned. The experimental RPD can be calculated for all simple combinations of these dimensions (Figure S1, Supporting Information). Peaks in the experimental RPD indicate the presence of underlying molecular organization and characteristic length scales across 1D, 2D, or 3D space (Figure 1C). The SMLM image reconstruction (Figure 1B) or lower-resolution features of the sample can be used to choose suitable dimensions to use in generating the RPD and subsequent analysis.
Figure 1.
Workflow in PERPL analysis. The figure demonstrates the workflow for PERPL analysis, with the series of steps shown on the LHS and snapshot images on the RHS (for illustrative purposes only). A, B: Visualization of the localization data in XY for the full FOV (A) and a zoomed in region (B). C: Experimental relative position distribution (RPD), histogram of interlocalization distances. Arrows indicate peaks resulting from underlying molecular organization. D: Example in silico rotational symmetry models. E: Plots for different in silico model RPDs (colored lines), fitted to the experimental RPD. F: Use of the Akaike information criterion to compare models and output of model parameters.
To identify which patterns of molecular organization may be present, in silico models of candidate structures are constructed, and the RPD for these is calculated and then compared to the experimental RPD. Starting models can be generated using one or more of the following. The appearance of molecules in the reconstructed FOV can provide information about possible underlying symmetry (i.e., the rotational symmetry for Nup107 in nuclear pores). The shape of the experimental RPD and the positions of any peaks can indicate the presence of characteristic features, including possible repeated patterns and their length scale. Additional experimental or published information on structural features of a complex that contains the molecule of interest (e.g., electron microscopy data) can also suggest starting models. A parametric method of generating these candidate geometries in silico allows for model fitting in subsequent steps (Supporting Information).
The model RPD (a set of discrete 3D (or 2D) RPs) is generated from a list of localization coordinates in the model structure, in the same way as for experimental localizations. To reflect experimental noise and biological variability, discrete model distances are broadened using the theoretical distance distribution between two Gaussian sets of localizations.14 This includes broadening on a zero-distance term for RPs of repeated localizations of the same molecule or localizations of nearby unresolvable molecules. A background of disordered localizations may also be included in the model, and examples are provided (Supporting Information).
Akaike’s Information Criterion (AIC)15,16 is used to determine which hypothesis (in silico model) best describes the real structure, or disorder, underlying the data (experimental RPD). AIC is a quantitative measure of information loss when approximating real data with a model (Supporting Information). The difference in AIC values between models is related to the relative likelihood (Akaike weight) that each model captures the reality underlying the experimental data.16,17 We use the corrected AIC (AICc),18 which improves on the accuracy of AIC for more complex models evaluated from fewer data points. Using PERPL, we obtain fits of model against experimental RPDs, relative likelihoods for the selection of the most likely model, schematic plots of the structural models, and fitted model parameter data (Figure S2, Supporting Information).
Note, the AICc helps to determine which structural model best explains the data, but this model may still be inaccurate, if all of the candidate models are poor. However, it disfavors overfitting by more complex models, and where necessary, the structural models can also be compared by AICc against simple models of disordered molecular positions. This results in a level of confidence that the best structural model is more likely than a random arrangement, or vice versa (Supporting Information).
To demonstrate
the method, we used PERPL to reveal the underlying
nanostructure of Nup107 (labeled at the C-terminus21) in nuclear pores, from an experimental 3D SMLM data set
(Figure 2, Supporting Information). The reconstructed image
in XY shows multiple ring-like structures oriented
with their axis of symmetry nearly aligned with the Z-direction (Figure 2A), together with structures separated in Z (Figure 2H). Therefore, we
investigated the distance distributions across the XY plane (ΔXY =  ) (Figure 2B) and in Z (ΔZ) (Figure 2H). The
analysis used a maximum pairwise distance of 200 nm (in X, Y, and Z), a distance slightly
larger than the ring-like structures. The entire 16 × 17 ×
0.9 μm 3D FOV, containing 36k localizations, was analyzed in
a few minutes on a standard laptop. Both XY and Z distributions contain multiple peaks (Figure 2B,I) that imply underlying
sets of characteristic separations.
Figure 2.
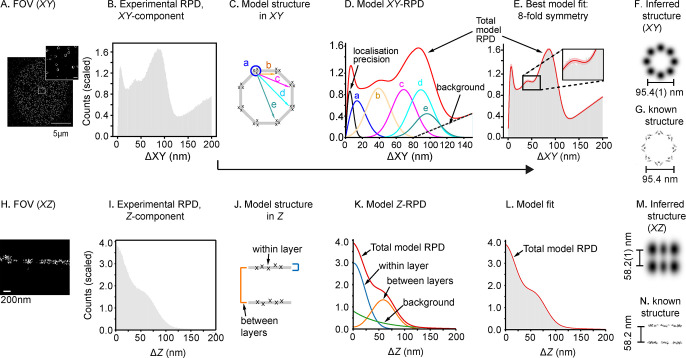
PERPL analysis of Nup107 localizations. A: 2D image reconstruction of a 3D dSTORM data set for Nup107. Scale bar (inset): 200 nm. B: Experimental RPD (XY, 1 nm bins) for all pairs of localizations within 200 nm in X, Y, and Z. Mean bin value scaled to 1.0. C: Diagram of in silico model of 8-fold symmetric macromolecular geometry. D: Resulting RPD (XY-component). The model contains intervertex distances (b–e), with vertices arranged symmetrically on a circle, components for repeated localizations of a single molecule (localization precision), unresolvable substructure in a cluster (a), and a background term. E: The in silico model RPD fitted to the experimental distance histogram (pink is 95% confidence interval). F, G: Inferred 8-fold structure in XZ (F), in agreement with EM data for Nup107 organization19 (G). H–L: Nup107 localizations rendered in XZ, experimental RPD in Z, two-layer model structure used to generate the model Z-RPD, fitted to the experimental RPD. M: Inferred XYZ structure, projected in XZ (Gaussian smoothed according to the fitted broadening parameters in the models). N: EM data in XZ.19 EM maps of the nuclear pore shown in (G) and (N) generated from PDB 5A9Q using UCSF Chimera.20
To determine the underlying organization, PERPL was used to construct candidate model structures with rotational symmetry in ΔXY (Figure 2C), based on the Nup107 image reconstruction (Figure 2A). Models were parametrized for diameter, degree of symmetry (5–11-fold, Figure S2), and localization precision. A substructure term (a, circled in Figure 2C, and related peak in Figure 2D) was included to correct for molecules too close to resolve or a spread of localizations resulting from overlapping images of molecules.22 A background term was included to account for localizations predominantly outside of a single ring-like structure.
A statistical comparison of model and experimental RPDs (Figure 2E, Table 1) showed the model with 8-fold symmetry was ∼4× more likely than the next most likely model (9-fold symmetry). The 8-fold symmetric model, with a diameter of 95.4(1) nm (1 s.d. on values of the fitted parameters given as variation in the last significant digit; Figure 2F, Table S1)) agrees well with particle average EM and SMLM data (Figure 2G).8,23
Table 1. Corrected Akaike Information Criterion (AICc) Values18 and Relative Likelihoods (Akaike Weight, Summing to 1)24 for Nup107 Analysis.
| ΔZ < 200 nma |
ΔZ < 20 nma |
|||
|---|---|---|---|---|
| XY model: rotational symmetry order | AICc | Akaike weight | AICc | Akaike weight |
| 5 | –911.79 | 1.3 × 10–137 | –862.91 | 9.6 × 10–99 |
| 6 | –1168.39 | 6.8 × 10–82 | –1074.15 | 7.1 × 10–53 |
| 7 | –1337.76 | 4.1 × 10–45 | –1219.24 | 2.3 × 10⁻²¹ |
| 8 | –1541.69 | 0.79b | –1314.29 | 1.0b |
| 9 | –1539.08 | 0.21 | –1250.73 | 1.6 × 10⁻¹⁴ |
| 10 | –1484.65 | 3.2 × 10⁻¹³ | –1206.15 | 3.3 × 10⁻²⁴ |
| 11 | –1469.28 | 1.5 × 10⁻¹⁶ | –1198.05 | 5.7 × 10⁻²⁶ |
Results for all pairs of localizations within 200 nm in XYZ or for ΔZ < 20 nm. AICc results are comparable between models (rows) but not between data filters (between the ΔZ < 200 nm and ΔZ < 20 nm columns).
Selected model.
The XZ reconstruction (Figure 2H) together with the two lobes in the ΔZ RPD (Figure 2I) suggested a two-layer structure, where each layer has a thickness in the Z-direction (Figure 2J). A model of this kind (Figure 2K), which included a Gaussian spread within each layer, fit the experimental RPD well (Figure 2L) and indicated that Nup107 (C-terminus) would be found in layers separated by 58.2(1) nm (Figure 2M, Table S2). Again, this model and the inferred structure agrees well with EM data (Figure 2N).
Returning to our analysis of ΔXY RPDs, we next restricted it to pairs of localizations within a single layer, by limiting ΔZ to less than 20 nm. Using these within-layer RPs, the relative likelihood of the 8-fold model increased to >1010× greater than the next most likely (9-fold, Tables 1 and S3). Thus, iterative model fitting and refinement can improve the interpretation of localization data sets. Restricting ΔZ to less than 20 nm likely removes uncertainty arising from the known angular offset between the two layers.19
We next tested the ability of PERPL to reveal the underlying DNA origami nanostructure from a 3D DNA-PAINT25 SMLM data set (Figure 3A–D, Supporting Information), for which we had no prior knowledge. The image reconstruction (Figure 3A) revealed geometric structures in different orientations on an approximately square lattice. Therefore, we constructed in silico models of simple geometric nanostructures and included features reflecting the presence of localizations at nearby grid points. Models included a triangular prism on a square lattice (all sides equal), a triangular prism on a square lattice (unequal sides), a cuboid on a square lattice, and a tetrahedron on a square lattice. Since the geometric structures were not all coaligned on any axis, we compared the Euclidean distances in 3D (ΔXYZ) between the experimental and in silico model localizations, using a maximum pairwise distance of 250 nm (in X, Y, and Z), just larger than the repeating feature size.
Figure 3.
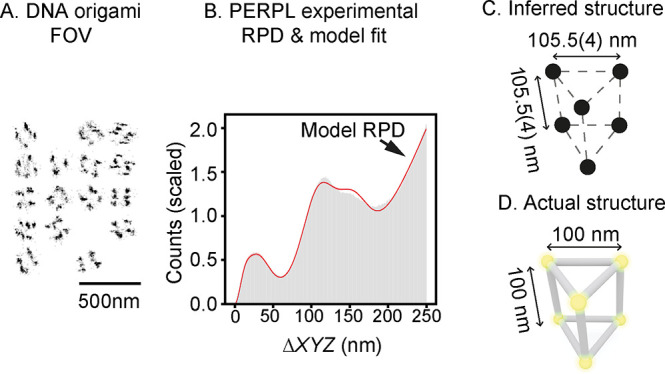
PERPL analysis of a DNA origami nanostructure. A: Image reconstruction for the DNA origami sample (projection in XY). B: Comparison of the experimental and model (red line) RPDs. C: Diagram of the best-supported model (triangular prism). D: Actual structure, as designed.
Comparing the model RPD with the experimental RPD (Figure 3B, Table S4, Figures S3 and S4) suggests that the most probable model to explain the data is a triangular prism structure with sides of equal length on a square grid (Figure 3B–D, Figure S4). The providers of the experimental data set confirmed that we had found the correct solution, constructed similarly to a previously published DNA origami design.26
The estimated side length of 105.5(4) nm (Figure 3C, Table S5) was slightly larger than the design length of 100 nm (Figure 2D). The discrepancy in side length could arise from several factors. First, we used an isotropic localization precision in the model, because it allowed us to conveniently average over all the orientations. However, localization precision is likely worse in Z than in XY. Second, we expect that the proximity of adjacent DNA origami structures is likely to result in an extra distribution of characteristic distances within the 250 nm cutoff for XYZ pairwise distances. Accounting for both of these would require a more complex model and would be possible with further development of our approach.
We then used PERPL on a more challenging 3D nanostructure within a biological sample, the Z-disc of cardiomyocytes. This contains a tetragonal lattice arrangement of actin filaments and ACTN2 (α-actinin-2) with characteristic distances under 20 nm.27,28 ACTN2 in the Z-disc was labeled with an Affimer,29,30 which binds to its second calponin homology (CH) domain as demonstrated by X-ray crystallography (Figure S5, Table S6). The resulting 3D dSTORM data set contained 1.1 × 10⁵ localizations, equivalent to detection of ∼1.5% of ACTN2 molecules in the Z-discs or ∼2.9% of Z-disc lattice points (Supporting Information). The low fraction of localizations per target molecule results from both the limited labeling density and high background in such a thick, dense structure, and as a result the 3D reconstruction did not show an obvious underlying pattern (Figure 4A).
Figure 4.
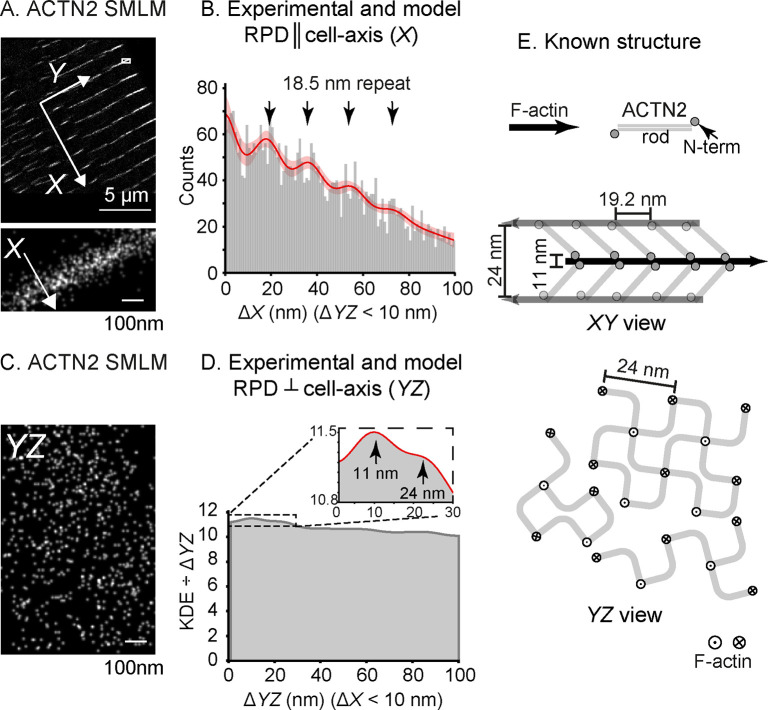
PERPL analysis of 3D ACTN2 dSTORM data for adult rat cardiomyocyte, sparsely labeled. A: FOV for the 3D dSTORM data set, using an Affimer to ACTN2. X: cell-axial direction (perpendicular to the plane of the Z-disc). Y: in the plane of the Z-disc. Inset: magnified region of the image. B: Experimental RPD in X for pairs of localizations with ΔYZ < 10 nm. Model RPD shown by the red line with 95% confidence interval (pink). Arrows indicate peaks with a repeat distance of 18.5(1.0) nm. C: Equivalent YZ view for the inset of (A). D: Result for the YZ analysis, using the standardized kernel density estimate (KDE) (Figure S7). Inset shows the detailed view of the fit (red line) out to 30 nm and the positions of two peaks for characteristic distances (see text). E: Diagram of the known structure from EM27 showing XY and YZ views, with the known disorder in the square lattice in YZ.
Using the cell axis as a reference direction (X) (Figure 4A), distributions in ΔX (cell-axial, Figure 4B) and ΔYZ (cell-transverse, Figure 4C) were analyzed (Figure 4B,D). For ΔX, we used only RPs with ΔYZ < 10 nm, and conversely for analysis of ΔYZ, based on known dimensions of the Z-disc lattice. The low signal-to-noise ratio of the experimental ΔX RPD made it challenging to find characteristic distances. We investigated a kernel density estimate of the ΔX values (Figure S6), using the broadening function for distances in an in silico model RPD.14 This smoothened RPD showed regular variations approximately 20 nm apart and suggested that the structure may contain a repeating distance.
To test this, we constructed models for localizations found at multiples of a unit distance along the cell-axis (Figure S6), including a background term generated from a random uniform distribution of localizations across the Z-disc. As controls, we included a model containing only the background uniform distribution and one containing repeated localizations of the same molecule. In the best model, the ACTN2-CH2 domain occurs every 18.5(1.0) nm along the cell-axis, with 98% confidence that this repeating pattern is a better model than a random distribution for the true molecular arrangement (Figure 4B, Tables S7 and S8). This compares well with the 19.2 nm periodicity of ACTN2 binding sites obtained from EM (Figure 4E).28 Our analysis also demonstrated that the Z-disc is most likely to contain five or six layers of ACTN2, similar to previous EM results,27 although the differences between these models were not great enough to robustly select one model over the others (Table S7). This may be due to natural variability of the Z-disc but also the quality of the data; at greater distances across the finite (∼100 nm) Z-disc, the number of RPs obtainable, and therefore the signal-to-noise ratio, is reduced.
Data in the YZ plane (Figure 4C,D) was more challenging to analyze, because localization precision is worse in Z than in X and Y, and the lattice contains multiple local discontinuities (Figure 4E).27 However, using a standardized kernel density estimate of the RPD (Figure S7), the distributions expected for broadened characteristic YZ distances fit the first two peaks well (Figure 4D, Figure S7), and we inferred distances of 24.08(5) nm and 11.17(1) nm (Table S9). The expected distance in YZ between parallel actin filaments is 24 nm,31 and we interpret 11 nm as the distance between a pair of ACTN2-CH2-Affimer labels, either side of an actin filament (Figure 4E).
Finally, we tested the ability of our software to define the relative quality of particles to be selected for other analysis methods (Figure 5), using SMLM data for the centriolar protein Cep152. The particles (centrioles) had already been segmented from an SMLM image (Figure 5A,B; Supporting Information) and classified as “top view” according to their orientation.7 We calculated the ΔXY distribution per segmented particle, including all pairwise distances, and fitted the distribution of ΔXY in an in silico, 9-fold rotationally symmetric model to this. This model (Figure 5C,D) did not require a background term to fit RPs within the segmented ROIs, and the amplitudes of the contributions of the intervertex distances were allowed to vary independently, since some vertices were obscure or missing in the single particles.
Figure 5.
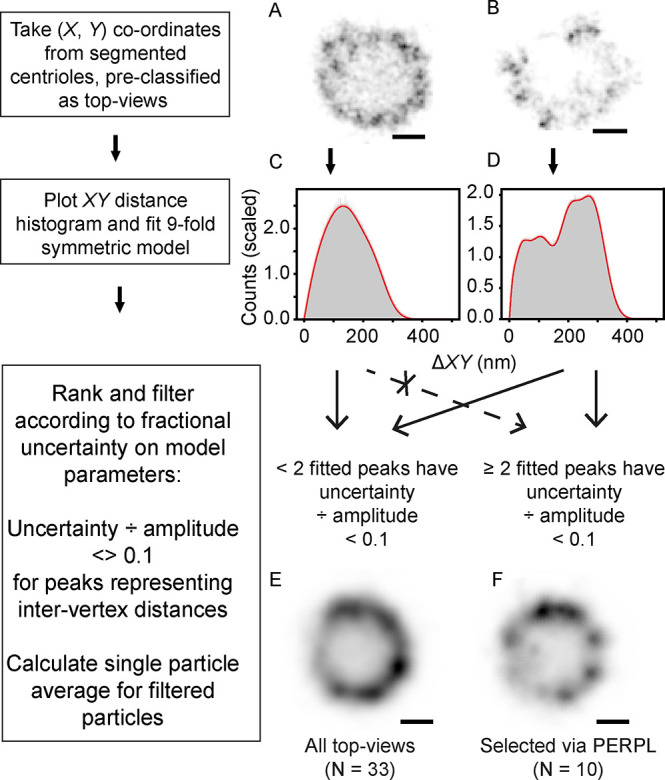
Use of PERPL analysis to assess single particle images and improve image averages. A, B: Example dSTORM reconstructions of Cep152, filtered as top views7 (fluorescence shown in inverted contrast). C, D: Distance histograms and fitted model RPDs (red, with narrow 95% confidence intervals in pink). E: Average of all top-view Cep152 images. F: Average of 10 top-view images selected after PERPL analysis. Scale bars: 100 nm.
Each experimental top-view particle was scored for uncertainty in fitted amplitudes of the contributions of intervertex distances. Where the uncertainty in two of the four intervertex distance contributions was greater than 0.1× their amplitude, the particle was discarded. Averaging the remaining particles showed distinct clusters at each vertex and a rounder structure for the complex (Figure 5E,F).
Conclusions
Here we have shown that PERPL is a useful tool for understanding the underlying organization of nanostructures in cells and in vitro, in multiple types of data sets, using 2D and 3D RPs. It does not require a high labeling density or a high detection rate, and data can be combined from multiple images to provide sufficient data to generate the RPD. Its ability to analyze the arrangement of sparsely localized molecules makes it distinct from and entirely complementary to particle averaging techniques. PERPL can be used to analyze organization of any data where localization coordinates are obtained after image acquisition and processing techniques and is not restricted to SMLM data. It may also be used to determine multiple characteristic distances between localizations of two or more targets and can be developed further to infer their spatial relationship within a macromolecular complex. We further anticipate its use in analyzing noise distributions in SMLM data sets, to aid quantitative analysis of experimental localizations.
Acknowledgments
Isolated cardiomyocytes were a kind gift from the Steele Group, University of Leeds. We thank Ulf Matti and Philipp Hoess for sample preparation and imaging of the Nup107 cells and Niccolò Banterle for the centriole sample preparation. We would also like to acknowledge Michael W. Davidson for his contributions to the development of the constructs used in early stages of this work.
Supporting Information Available
The Supporting Information is available free of charge at https://pubs.acs.org/doi/10.1021/acs.nanolett.0c03332.
Description of the material and methods used to generate the images and perform the PERPL analysis, Supplementary Figures S1–S7, Supplementary Tables S1–S9, and associated references (PDF)
Author Contributions
A.P.C. conceived and implemented the analysis approach and developed software. J.L. developed software. R.E.H., A.J.C., and B.R. acquired data for the development of the Z-disc analysis. C.H.T. and B.R. crystallized the Affimer-CH domain construct and solved its structure. M.A.B. and M.P. developed fluorescent protein constructs used in the early stages of the work to develop the technique. Y.T., H.S., A.P.C., and M.P. developed 3D imaging techniques. C.S. and S.M. provided the Cep152 localization data and conceived the particle quality assessment concept. T.S. and R.J. designed and prepared DNA-origami structures and acquired localization data. J.R. provided the 3D Nup107 localization data. M.P. conceived the Z-disc protein experiment and acquired the confocal data on the Z-disc protein labeling. M.P. supervised the study, and M.P. and A.P.C. wrote the manuscript. All authors reviewed and approved the manuscript.
The work was funded by the UK Medical Research and the UK Biotechnology and Biological Sciences Research Councils (MR/K015613/1 and BB/S015787/1 (to M.P. and A.P.C.) and BB/M011151/1 DTP studentship to B.R.); the Wellcome Trust (Institutional Strategic Support Fund at University of Leeds to R.E.H. and A.J.C. and travel award to M.P., 091108/Z/10/Z); the Intramural Research Program of the National Heart, Lung and Blood Institute; and the National Institute of Biomedical Imaging and Bioengineering, U.S. National Institutes of Health. The dSTORM system was funded by alumnus M. Beverley, in support of the University of Leeds “making a world of difference” campaign. R.J. acknowledges support by the Deutsche Forschungsgemeinschaft (DFG) through the Emmy Noether Program (DFG JU 2957/1-1), the European Research Council through an ERC Starting Grant (MolMap, Grant Agreement Number 680241), the Max Planck Society, the Max Planck Foundation, and the Center for Nanoscience (CeNS). T.S. acknowledges support from the DFG through the Graduate School of Quantitative Biosciences Munich (QBM), S.M. acknowledges support from the Swiss National Science Foundation National Centre for Competence in Research (NCCR) Chemical Biology.
The authors declare no competing financial interest.
Supplementary Material
References
- Schermelleh L.; Ferrand A.; Huser T.; Eggeling C.; Sauer M.; Biehlmaier O.; Drummen G. P. C. Super-resolution microscopy demystified. Nat. Cell Biol. 2019, 21 (1), 72–84. 10.1038/s41556-018-0251-8. [DOI] [PubMed] [Google Scholar]
- Baddeley D.; Bewersdorf J. Biological Insight from Super-Resolution Microscopy: What We Can Learn from Localization-Based Images. Annu. Rev. Biochem. 2018, 87, 965–989. 10.1146/annurev-biochem-060815-014801. [DOI] [PubMed] [Google Scholar]
- Heydarian H.; Schueder F.; Strauss M. T.; van Werkhoven B.; Fazel M.; Lidke K. A.; Jungmann R.; Stallinga S.; Rieger B. Template-free 2D particle fusion in localization microscopy. Nat. Methods 2018, 15 (10), 781–784. 10.1038/s41592-018-0136-6. [DOI] [PubMed] [Google Scholar]
- Löschberger A.; van de Linde S.; Dabauvalle M.-C.; Rieger B.; Heilemann M.; Krohne G.; Sauer M. Super-resolution imaging visualizes the eightfold symmetry of gp210 proteins around the nuclear pore complex and resolves the central channel with nanometer resolution. J. Cell Sci. 2012, 125 (3), 570–575. 10.1242/jcs.098822. [DOI] [PubMed] [Google Scholar]
- Salas D.; Le Gall A.; Fiche J.-B.; Valeri A.; Ke Y.; Bron P.; Bellot G.; Nollmann M. Angular reconstitution-based 3D reconstructions of nanomolecular structures from superresolution light-microscopy images. Proc. Natl. Acad. Sci. U. S. A. 2017, 114, 9273. 10.1073/pnas.1704908114. [DOI] [PMC free article] [PubMed] [Google Scholar]
- Shi X.; Garcia G. III; Wang Y.; Reiter J. F.; Huang B. Deformed alignment of super-resolution images for semi-flexible structures. PLoS One 2019, 14 (3), e0212735 10.1371/journal.pone.0212735. [DOI] [PMC free article] [PubMed] [Google Scholar]
- Sieben C.; Banterle N.; Douglass K. M.; Gönczy P.; Manley S. Multicolor single-particle reconstruction of protein complexes. Nat. Methods 2018, 15 (10), 777–780. 10.1038/s41592-018-0140-x. [DOI] [PMC free article] [PubMed] [Google Scholar]
- Szymborska A.; de Marco A.; Daigle N.; Cordes V. C.; Briggs J. A. G.; Ellenberg J. Nuclear Pore Scaffold Structure Analyzed by Super-Resolution Microscopy and Particle Averaging. Science 2013, 341 (6146), 655–658. 10.1126/science.1240672. [DOI] [PubMed] [Google Scholar]
- Han B.; Zhou R.; Xia C.; Zhuang X. Structural organization of the actin-spectrin–based membrane skeleton in dendrites and soma of neurons. Proc. Natl. Acad. Sci. U. S. A. 2017, 114 (32), E6678–E6685. 10.1073/pnas.1705043114. [DOI] [PMC free article] [PubMed] [Google Scholar]
- Xu K.; Zhong G.; Zhuang X. Actin, Spectrin, and Associated Proteins Form a Periodic Cytoskeletal Structure in Axons. Science 2013, 339 (6118), 452–456. 10.1126/science.1232251. [DOI] [PMC free article] [PubMed] [Google Scholar]
- Malkusch S.; Heilemann M. Extracting quantitative information from single-molecule super-resolution imaging data with LAMA – LocAlization Microscopy Analyzer. Sci. Rep. 2016, 6, 34486. 10.1038/srep34486. [DOI] [PMC free article] [PubMed] [Google Scholar]
- Schnitzbauer J.; Wang Y.; Zhao S.; Bakalar M.; Nuwal T.; Chen B.; Huang B. Correlation analysis framework for localization-based superresolution microscopy. Proc. Natl. Acad. Sci. U. S. A. 2018, 115 (13), 3219–3224. 10.1073/pnas.1711314115. [DOI] [PMC free article] [PubMed] [Google Scholar]
- Sengupta P.; Jovanovic-Talisman T.; Skoko D.; Renz M.; Veatch S. L.; Lippincott-Schwartz J. Probing protein heterogeneity in the plasma membrane using PALM and pair correlation analysis. Nat. Methods 2011, 8, 969. 10.1038/nmeth.1704. [DOI] [PMC free article] [PubMed] [Google Scholar]
- Stirling Churchman L.; Flyvbjerg H.; Spudich J. A. A Non-Gaussian Distribution Quantifies Distances Measured with Fluorescence Localization Techniques. Biophys. J. 2006, 90 (2), 668–671. 10.1529/biophysj.105.065599. [DOI] [PMC free article] [PubMed] [Google Scholar]
- Akaike H.Information theory as an extension of the maximum likelihood principle. In Second International Symposium on Information Theory, Csáki F., Petrov B. N., Eds.; Akadémiai Kiadó: Tsahkadsor, Armenia, USSR, 1973; pp 267–281. [Google Scholar]
- Portet S. A primer on model selection using the Akaike Information Criterion. Infect. Dis. Model. 2020, 5, 111–128. 10.1016/j.idm.2019.12.010. [DOI] [PMC free article] [PubMed] [Google Scholar]
- Bozdogan H. Model selection and Akaike’s Information Criterion (AIC): The general theory and its analytical extensions. Psychometrika 1987, 52 (3), 345–370. 10.1007/BF02294361. [DOI] [Google Scholar]
- Hurvich C. M.; Tsai C. L. Regression and Time-Series Model Selection in Small Samples. Biometrika 1989, 76 (2), 297–307. 10.1093/biomet/76.2.297. [DOI] [Google Scholar]
- von Appen A.; Kosinski J.; Sparks L.; Ori A.; DiGuilio A. L.; Vollmer B.; Mackmull M.-T.; Banterle N.; Parca L.; Kastritis P.; Buczak K.; Mosalaganti S.; Hagen W.; Andres-Pons A.; Lemke E. A.; Bork P.; Antonin W.; Glavy J. S.; Bui K. H.; Beck M. In situ structural analysis of the human nuclear pore complex. Nature 2015, 526, 140. 10.1038/nature15381. [DOI] [PMC free article] [PubMed] [Google Scholar]
- Pettersen E. F.; Goddard T. D.; Huang C. C.; Couch G. S.; Greenblatt D. M.; Meng E. C.; Ferrin T. E. UCSF Chimera—A visualization system for exploratory research and analysis. J. Comput. Chem. 2004, 25 (13), 1605–1612. 10.1002/jcc.20084. [DOI] [PubMed] [Google Scholar]
- Li Y.; Mund M.; Hoess P.; Deschamps J.; Matti U.; Nijmeijer B.; Sabinina V. J.; Ellenberg J.; Schoen I.; Ries J. Real-time 3D single-molecule localization using experimental point spread functions. Nat. Methods 2018, 15 (5), 367–369. 10.1038/nmeth.4661. [DOI] [PMC free article] [PubMed] [Google Scholar]
- Fox-Roberts P.; Marsh R.; Pfisterer K.; Jayo A.; Parsons M.; Cox S. Local dimensionality determines imaging speed in localization microscopy. Nat. Commun. 2017, 8, 13558. 10.1038/ncomms13558. [DOI] [PMC free article] [PubMed] [Google Scholar]
- Bui K. H.; von Appen A.; DiGuilio A. L.; Ori A.; Sparks L.; Mackmull M. T.; Bock T.; Hagen W.; Andres-Pons A.; Glavy J. S.; Beck M. Integrated structural analysis of the human nuclear pore complex scaffold. Cell 2013, 155 (6), 1233–43. 10.1016/j.cell.2013.10.055. [DOI] [PubMed] [Google Scholar]
- Burnham K. P.; Anderson D. R.. Model selection and inference: a practical information-theoretic approach; Springer-Verlag: New York, 1998. [Google Scholar]
- Schnitzbauer J.; Strauss M. T.; Schlichthaerle T.; Schueder F.; Jungmann R. Super-resolution microscopy with DNA-PAINT. Nat. Protoc. 2017, 12 (6), 1198–1228. 10.1038/nprot.2017.024. [DOI] [PubMed] [Google Scholar]
- Iinuma R.; Ke Y.; Jungmann R.; Schlichthaerle T.; Woehrstein J. B.; Yin P. Polyhedra Self-Assembled from DNA Tripods and Characterized with 3D DNA-PAINT. Science 2014, 344 (6179), 65–69. 10.1126/science.1250944. [DOI] [PMC free article] [PubMed] [Google Scholar]
- Burgoyne T.; Morris E. P.; Luther P. K. Three-Dimensional Structure of Vertebrate Muscle Z-Band: The Small-Square Lattice Z-Band in Rat Cardiac Muscle. J. Mol. Biol. 2015, 427 (22), 3527–3537. 10.1016/j.jmb.2015.08.018. [DOI] [PMC free article] [PubMed] [Google Scholar]
- Luther P. K. The vertebrate muscle Z-disc: sarcomere anchor for structure and signalling. J. Muscle Res. Cell Motil. 2009, 30 (5), 171–185. 10.1007/s10974-009-9189-6. [DOI] [PMC free article] [PubMed] [Google Scholar]
- Tiede C.; Bedford R.; Heseltine S. J.; Smith G.; Wijetunga I.; Ross R.; AlQallaf D.; Roberts A. P. E.; Balls A.; Curd A.; Hughes R. E.; Martin H.; Needham S. R.; Zanetti-Domingues L. C.; Sadigh Y.; Peacock T. P.; Tang A. A.; Gibson N.; Kyle H.; Platt G. W.; Ingram N.; Taylor T.; Coletta L. P.; Manfield I.; Knowles M.; Bell S.; Esteves F.; Maqbool A.; Prasad R. K.; Drinkhill M.; Bon R. S.; Patel V.; Goodchild S. A.; Martin-Fernandez M.; Owens R. J.; Nettleship J. E.; Webb M. E.; Harrison M.; Lippiat J. D.; Ponnambalam S.; Peckham M.; Smith A.; Ferrigno P. K.; Johnson M.; McPherson M. J.; Tomlinson D. C. Affimer proteins are versatile and renewable affinity reagents. eLife 2017, 6, e24903. 10.7554/eLife.24903. [DOI] [PMC free article] [PubMed] [Google Scholar]
- Carrington G.; Tomlinson D.; Peckham M. Exploiting nanobodies and Affimers for superresolution imaging in light microscopy. Mol. Biol. Cell 2019, 30 (22), 2737–2740. 10.1091/mbc.E18-11-0694. [DOI] [PMC free article] [PubMed] [Google Scholar]
- Perz-Edwards R. J.; Reedy M. K. Electron microscopy and x-ray diffraction evidence for two Z-band structural states. Biophys. J. 2011, 101 (3), 709–17. 10.1016/j.bpj.2011.06.024. [DOI] [PMC free article] [PubMed] [Google Scholar]
Associated Data
This section collects any data citations, data availability statements, or supplementary materials included in this article.


