Abstract
Coronavirus (COVID-19) is one of the most serious problems that has caused stopping the wheel of life all over the world. It is widely spread to the extent that hospital places are not available for all patients. Therefore, most hospitals accept patients whose recovery rate is high. Machine learning techniques and artificial intelligence have been deployed for computing infection risks, performing survival analysis and classification. Survival analysis (time-to-event analysis) is widely used in many areas such as engineering and medicine. This paper presents two systems, Cox_COVID_19 and Deep_ Cox_COVID_19 that are based on Cox regression to study the survival analysis for COVID-19 and help hospitals to choose patients with better chances of survival and predict the most important symptoms (features) affecting survival probability. Cox_COVID_19 is based on Cox regression and Deep_Cox_COVID_19 is a combination of autoencoder deep neural network and Cox regression to enhance prediction accuracy. A clinical dataset for COVID-19 patients is used. This dataset consists of 1085 patients. The results show that applying an autoencoder on the data to reconstruct features, before applying Cox regression algorithm, would improve the results by increasing concordance, accuracy and precision. For Deep_ Cox_COVID_19 system, it has a concordance of 0.983 for training and 0.999 for testing, but for Cox_COVID_19 system, it has a concordance of 0.923 for training and 0.896 for testing. The most important features affecting mortality are, age, muscle pain, pneumonia and throat pain. Both Cox_COVID_19 and Deep_ Cox_COVID_19 prediction systems can predict the survival probability and present significant symptoms (features) that differentiate severe cases and death cases. But the accuracy of Deep_Cox_Covid_19 outperforms that of Cox_Covid_19. Both systems can provide definite information for doctors about detection and intervention to be taken, which can reduce mortality.
Keywords: Coronavirus, COVID-19, Cox regression, Survival analysis, Deep learning, Symptoms, Mortality and autoencoder
Introduction
Coronaviruses problem is one of the most serious problems, that faces the world [1]. Coronaviruses were first discovered in the 1930s, but only animals were infected with it. Human coronaviruses were discovered in the 1960s. Coronaviruses have taken many phases of mutation; it started as the common cold in 1960s, till reaching the current form with respiratory effects. A novel coronavirus was reported as the cause of a cluster of cases of pneumonia in Wuhan, a city in China's Hubei Province, at the end of 2019. It spread exponentially, leading to an epidemic across China, followed by several cases across the world in other countries. The World Health Organization (WHO) identified the disease COVID-19 in February 2020, which stands for coronavirus disease 2019 [2]. Severe acute respiratory syndrome coronavirus 2 (SARS-CoV-2) is a virus that causes COVID-19; previously, and it was referred to as 2019-nCoV. Because of the increase in mortality due to COVID-19 and the increase in the speed of its spread, many methods have been developed to reliably predict patient survival based on symptom data and specific clinical parameters.
Artificial intelligence is now needed in order to help expert epidemiologists. AI provides a useful tool, that can help in computing risk factor, classification, even drug analysis, and finally responding to crisis according to health data specialists. Because of the increase in COVID-19 patients and the lack of equipment to receive all patients, a hard choice is taken. The necessary medical care is applied only to patients with more probability to survive. Calculating the probability to survive and the effect of each feature like symptoms in our case on survival probability is done using survival analysis.
Survival analysis is a model for time until a certain “event”. Time-to-event data encounters several research challenges such as censoring, symptoms (features) correlations, high-dimensionality, temporal dependencies, and difficulty in acquiring sufficient event data in a reasonable period of time [3]. There are many current literature techniques for conducting this sort of survival study. Among them, the Cox Proportional Hazards Model (Cox) [4] which is a Regression models that is commonly used in survival analysis [5].
Survival analysis methods can work with specific problems, with a data type that waits for the event to occur. Cox regression is the most appropriate method to deal with this kind of data. Occasionally, the basic assumptions of the model, for example, non-proportionality for the Cox model, are not true. The choice of an appropriate model varies depending on the complexity and features that affect the suitability of the model [6], in model building. Data-driven approaches are robust. A long-range regression analysis of COVID-19 using immunological, epidemiological, and seasonal effects on US data is going to be done out to 2025 [7].
The implementation of the designated dataset in its original form in this research led to the appearance of some trammels such as high collinearity and convergence, so autoencoder deep neural network is implemented to solve such problems. To predict the survivability analysis, Cox regression is implemented in two situations: the first is called Cox_Covid_19, and the second is called Deep_Cox_Covid_19. Cox_Covid_19 implements Cox regression on the original dataset, while Deep_Cox_Covid_19 implements autoencoder deep learning before Cox regression to solve the problems associated with the dataset.
Our main objective in this paper is to define the main features affecting the survival probability for COVID-19 with the aid of the most suitable machine learning algorithm. This information can help doctors in taking the right decision about each patient’s case according to the available treatment and medical instruments. The principal contributions of this research could be summarized as the following:
At first, finding the survival probability for each patient.
At second, finding the impact of each feature on survival probability by calculating p value for each feature. The p value is an indication of the impact of each feature on survival.
Enhancing Cox_COVID_19 system by applying deep neural network, for increasing accuracy, presenting a new system called Deep_ Cox_COVID_19.
Finally, a comparison between Cox_COVID_19 and Deep_ Cox_COVID_19 is provided in terms of concordance, accuracy, precision, and recall.
The paper is organized as follows: The related work is presented in Sect. 2. Then, the proposed system design and implementation are introduced in Sect. 3. Section 4 introduces the results and discussion. Finally, the conclusion is discussed in the last section.
Related work
Up to now, the 2019 novel coronavirus pneumonia (COVID-19) is one the greatest public health problems that faced the world throughout its history. Worldwide, as of 2:00 a.m. CEST, 14 Apr 2020, 1,980,704 confirmed cases of COVID-19 have been reported to the WHO, including 67,666 deaths [2]. One of the earliest applications of data mining techniques was in medical fields in which it can accurately predict and diagnose diseases and improve medical decision-making. Many researchers have focused on conducting work in COVID_19 application and experimental application of medical datasets for scientific purposes.
Khan et al. [8] for accelerated failure time models, developed variable selection approaches consisting of a group of algorithms based on a combination of the Dantzig selector and the Buckley-James method, two frequently used techniques in the field of variable selection for survival analysis. Additionally, Khan et al. [9] proposed new approaches to variable selection for censored results, based on optimized AFT models using regularized weighted least squares. A mixture of L1 and L2 standard penalties under two proposed elastic net type approaches is used by the regularized technique. The two proposed methods are also expanded by incorporating censoring observations into their model optimization structures as constraints.
XGBoost machine learning algorithm predictive modelling is presented by Yan et al. [10]. Their methodology is able to predict mortality risk for COVID-19 dataset. The proposed model defined that lactic dehydrogenase (LDH), lymphocyte and high-sensitivity C-reactive protein (hs-CRP) are the key features for differentiating between critical patients from the two classes. Xiang et al. [11] present an algorithm for determining COVID-19 biomarker for earlier diagnosis based on IBM SPSS statistics 22.0 (New York, USA) software for statistical analysis, the Wilcoxon signed-rank test for data comparison between two groups. They found that using serum urea, CREA, CysC, DBIL, CHE, and LDH can be used to differentiate severely COVID-19 cases from non-severe COVID-19 cases.
In addition of using many parametric models, but the best was chosen by Bayesian information criterion (BIC) as presented by Mollazehi et al. [12]. The authors apply their algorithm on COVID-19 dataset for patients in Singapore to predict the recovery time from COVID-19 in Singapore between 23 January and 13 March 2020. Nemati et al. [13] introduced an approach that was applied on 1,182 COVID-19 cases and was based on several statistical methods to evaluate survival characteristics. By using various ML and statistical analysis approaches, the discharge-time prediction of COVID-19 cases was assessed. The findings show that in this analysis the Gradient Boosting survival model outperforms other models of patient survival.
A semi-supervised learning method based on the Cox and AFT models is presented by Liang et al. [14] applied on DLBCL (2002), DLBCL (2003), lung cancer and AML to overcome small sample size and censored data that limit accuracy. The semi-supervised model of learning can substantially increase the predictive performance of Cox and AFT models in the survival study. Lee et al. [15] presented algorithms based on cause-specific version of the Cox Proportional Hazards Model (cs- Cox) and DeepHit applied in breast cancer dataset for handling competing risks. Moreover, Ranganath et al. [16] presented a heterogeneous data types that occur in the electronic health record based on baseline Framingham risk score deep survival analysis.
Material and methods
Survival analysis is a time till event analysis. Cox regression is one of the most commonly methods in survival analysis. Here, we used an autoencoder deep neural network to improve performance. In this section, all methods that we used in this paper and different types of survival analysis methods are presented.
Survival analysis models
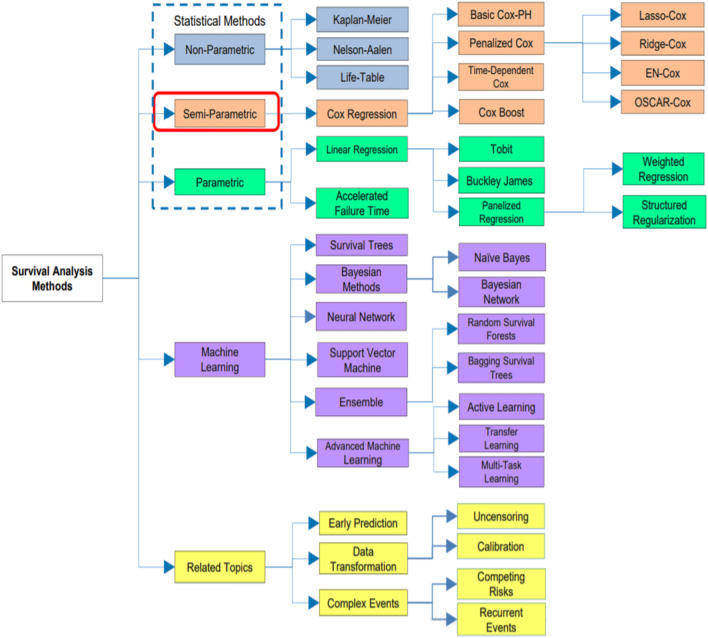
Survival analysis models [17, 18] are categorized to parametric, nonparametric and semi-parametric models, as shown in Fig. 1 [18]. For the parametric model, it isn’t suitable for normal distribution in which negative values can be found. The parametric model assumes that the survival time follows a known distribution. Methods of parametric model are such as Tobit, Buckley-James, Penalized regression and Accelerated Failure Time. For the semi-parametric model, even if the regression parameters are known, the distribution of the survival time is still unknown. It isn’t a fully parametric or a fully nonparametric. Methods of the semi-parametric model are such as Cox model, Regularized Cox, CoxBoost and Time-Dependent Cox. For the nonparametric model, it is difficult to understand and gives unreliable estimates but more efficient when the appropriate theoretical distributions aren’t known. Methods of nonparametric model are such as Kaplan–Meier, Nelson-Aalen and Life-Table.
Fig. 1.
[18]: Taxonomy of survival analysis methods
Cox regression method
Cox regression [19] method is a statistical method that is used often in medical research, for predicting the survival time for different patients. Cox Regression method is used for predicting the degree of effect of different features upon survival which is called hazard rate. Cox regression method is considered as an example of semi-parametric models.
The hazard function can be used to express the Cox model. Shortly, the probability of dying at time t is provided by the hazard function. It can be estimated as follows:
| 1 |
where the survival time is expressed by “t”. The hazard function is determined using “n covariates” . The impact of covariates is measured using the coefficients . “” is the baseline hazard.
Autoencoder deep neural network
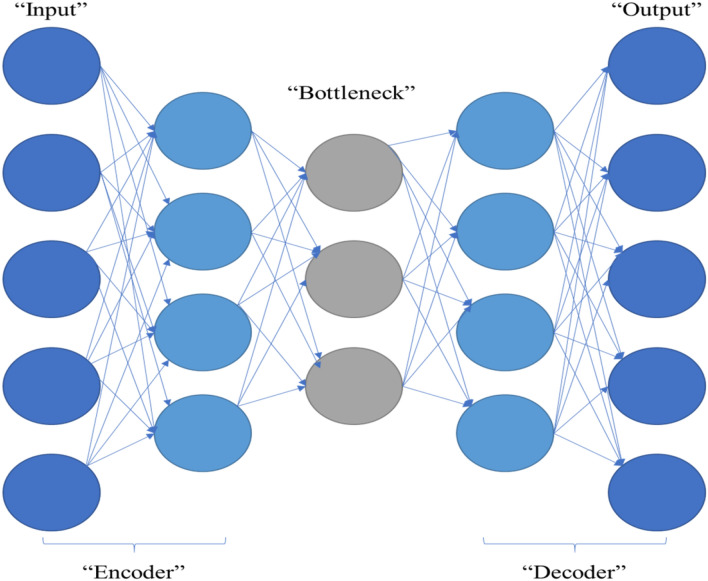
Autoencoder is an unsupervised artificial neural network. An autoencoder is a neural network that can efficiently encode data then reshaping and reconstructing the data back from the encoded representation, removing noise from the data that can affect the performance of the prediction model. Figure 2 shows the layers of the used autoencoder neural network.
Fig. 2.
Autoencoder components
Figure 2 shows the autoencoder components:
Encoder In this step, reducing the input dimensions and compressing the input data into an encoded representation is the main goal.
Bottleneck This layer contains the lowest possible dimensions of the input data; the compressed representation of the input is presented in this layer.
Decoder In this step, the data are reconstructed from the encoded version to extract a new representation of data, that is as close to the original input as possible and removing noise.
Reconstruction loss This is the method for measuring the performance of our decoder and how close the new representation to the original input.
Proposed survival analysis system
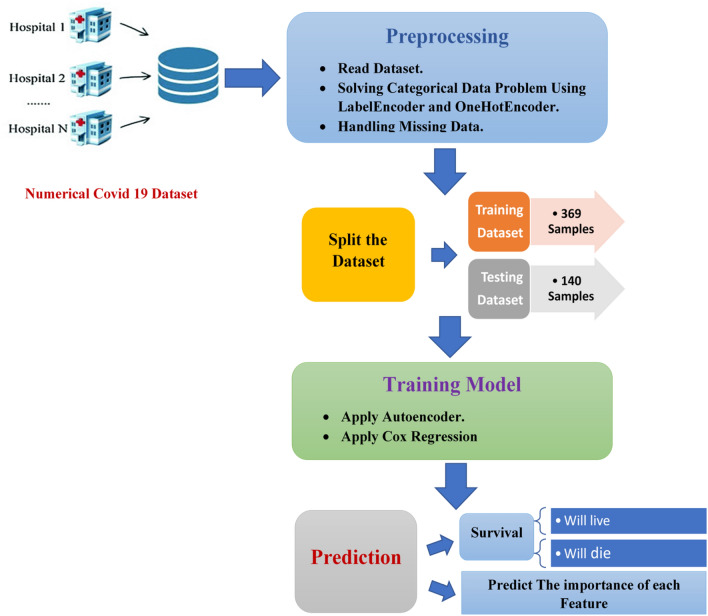
The two systems proposed in this paper are Deep_Cox_COVID_19 and Cox_COVID_19. Both systems are used to define significant symptoms (features) that differentiate between sever and death cases. Cox_COVID-19 is based on Cox regression to predict the survival probability. Deep_Cox_COVID_19 is a combination of deep neural network which is autoencoder and Cox regression method to predict the survival probability. The system is made up of three major stages as shown in Fig. 3:
Data preprocessing in this paper contributes reading COVID_19 dataset, then solving categorical data problems, and handling missing data. After reading the dataset, there were some categorical to be handled such as gender and country, Labelencoder is applied to solve the categorical problem of gender feature, and onehotencoder for handling the categorical problem of country feature. Finally, handling missing data are done by searching for non-numeric values and replacing them with the mean of the column where they belong.
The second stage is the training model. It starts with splitting the dataset to training and testing subsets. Then for Cox_COVID_19 model it is all about applying Cox regression for predicting survival probability. For Deep_Cox_COVID_19 model, it starts with applying autoencoder to reconstruct features and then applying Cox regression for survival analysis.
The last stage is to predict survival, whether alive or dead, and the importance of each feature.
The steps for Cox_COVID_19 are shown in the following pseudocode.
Fig. 3.
Proposed survival analysis system architecture
Input
Hospital’s dataset
Trigger
At the start of the proposed survival analysis system architecture
Output
Predict the importance of each feature
Steps
Import libraries
Read datasets
Set X as the set of features
Set Y as the set that contains duration till death
Set event as whether dead or alive.
Randomly split dataset into Training_Dataset and Testing_Dataset
Randomly split Training_Dataset into X_train and Y_train
Randomly split Testing_Dataset into X_test and Y_test
Apply Autoencoder
Apply COX Regression to predict the survival probability.
Compute concordance to rank model.
Predict the most important features affecting mortality.
Compute accuracy and precision.
The steps for Deep_Cox_COVID_19 are shown in the following pseudocode.
Input
Hospital’s dataset
Trigger
At the start of the proposed survival analysis system architecture
Output
Predict the importance of each feature
Steps
-
14
Import libraries
-
15
Read datasets
-
16
Set X as the set of features
-
17
Set Y as the set that contains duration till death
-
18
Set event as whether dead or alive.
-
19
Randomly split dataset into Training_Dataset and Testing_Dataset
-
20
Randomly split Training_Dataset into X_train and Y_train
-
21
Randomly split Testing_Dataset into X_test and Y_test
-
22
Input for the neural network: X_train as a training subset and X_test as a testing subset.
-
23
Set epochs = 100
-
24
Randomly initialize the weights and the parameters of the network.
-
25
For each i ∈ epochs Do
-
26
Compute the output according to the parameters.
-
27
Compute errors using the validation subset X_test.
-
28
Update weights and parameters.
-
29
End for
-
30
Set Train_features as the reduced representation of X_train using the neural network.
-
31
Set Test_features as the reduced representation of X_test prediction using the neural network.
-
32
Apply Autoencoder
-
33
Apply COX Regression to predict the survival probability.
-
34
Compute concordance to rank model.
-
35
Predict the most important features affecting mortality.
-
36
Compute accuracy and precision.
Results
In this section, a dataset description, validation, and the findings of adding an autoencoder deep neural network to a Cox regression model are presented.
Dataset set
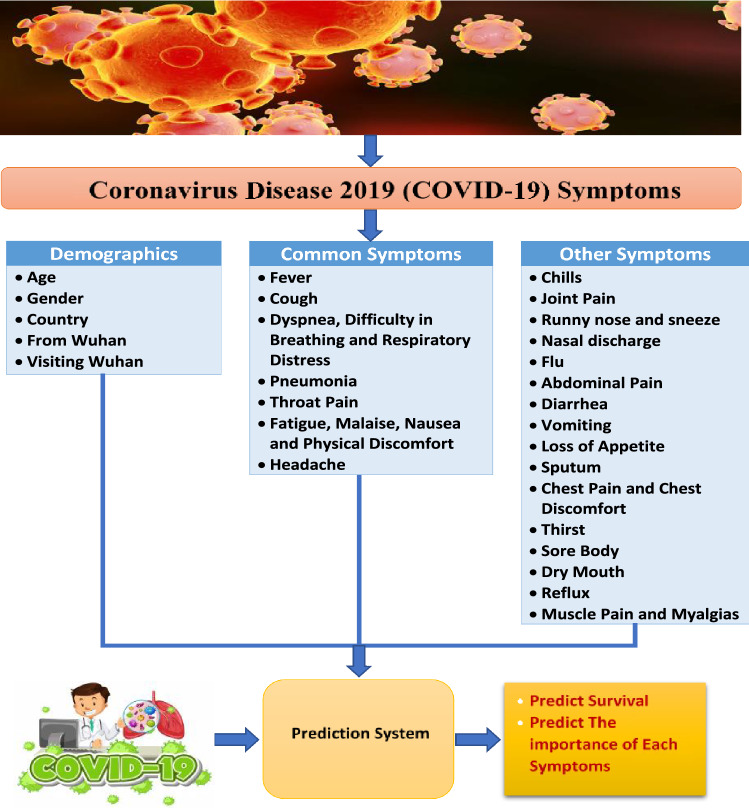
In this study, a clinical dataset for COVID-19 patients is used [20]. This dataset consists of 1085 patients, and as features, it has an id for each patient, reporting date, summary, location, country, gender, age, symptom, hospital visit, exposure_Start, exposure_end, visiting Wuhan, from Wuhan, death and recovered. The symptoms can be divided into demographics symptoms, common symptoms and other symptoms and all shown in Fig. 4. The demographics symptoms are age, gender, country, from Wuhan and visiting Wuhan. The common symptoms are like fever, cough, pneumonia, headache and throat pain. The other symptoms are like chills, joint pain, thirst, flu and reflux.
Fig. 4.
Characteristics of patients
For each patient, if died, the date of death is shown in the summary column and if alive it means till the date of the dataset downloaded. So, the duration till death or being alive is calculated. For patients with no symptom’s information, they were removed from the dataset and for patients with no gender information, they were removed from the dataset leaving the information for only 509 patients.
For the train subset, there are 36 samples that have died, and the other 333 sample that are still alive. For the test subset, there are 10 samples that have died and the other 130 are still alive.
The features that are used in this system, age, gender, and different symptoms. The information about the used dataset after removing patients that don’t have enough information is shown in Table 1.
Table 1.
COVID-19 clinical dataset description
| Dataset | Target variables | Symptoms (Features) |
Training samples | Testing samples | |||
|---|---|---|---|---|---|---|---|
| Classes | Duration | ||||||
| COVID-19 dataset [20] | Two classes: death or alive | Time to the event of death or life | 29 | 369 | 140 | ||
| Demographics | Common | Other | |||||
| 5 | 7 | 17 | |||||
Characteristics of the 509 patients
COVID-19 features can be categorized into demographics and symptoms. According to common protocols all over the world, symptoms can be categorized into common symptoms with most patients and other symptoms. Figure 4 shows different characteristics for patients with COVID-19.
Validation
To rank the model, concordance index [21, 22] is used. The concordance index is like measuring accuracy in classification problems but in survival analysis. Concordance is used as a rating of how well the model is. Concordance maximum value is one. The closer the concordance to one, the better the model is. Equation 2 [21] shows the mathematical expression for concordance index:
| 2 |
where “” is the number of edges in the order graph, and is the predicted survival time for an item “”.
Cox_COVID_19 model has a concordance of 0.923 out of 1 for training and 0.896 out of 1 for testing, so it is a very good Cox model. Deep_Cox_COVID_19 improved the performance as it has a concordance of 0.983 for training and 0.999 for testing.
For accuracy [23], it can be defined as the percentage of right predictions that could be done by machine learning model. Formally, accuracy can be defined using Eq. 3 [21]:
| 3 |
where
“TP”: True positives; “TN”: True negatives; “FP”: False positives, and “FN”: False negatives.
Precision Precision is the ratio of correctly predicted positive observations to the total predicted positive observations.
| 4 |
Experimental results
Cox_COVID_19 results
For each feature, the percentage of each occurrence in the dataset, p value, and coefficient are computed. The p value is used with each feature for testing the null hypothesis that the coefficient is equal to zero (no effect). For a predictor to have a lower p value (that can be less than 0.05), it means that it has a big impact on your model, and any changes in the predictor's value will lead to changes in the response variable. A positive coefficient indicates a worse prognosis, and a negative coefficient indicates a protective effect of the variable with which it is associated. The features are categorized into demographics and symptoms; the symptoms are categorized into common symptoms and other symptoms according to common protocols all over the world. Table 2 shows that age, muscle pain, pneumonia all have p value which is less than 0.05 and throat pain has a p value that is higher than 0.05 but still very small. So that age, pneumonia, muscle pain and throat pain are the most important factors affecting mortality.
Table 2.
Features’ percentage and P value
| Symptom (Feature) | Percentage in dataset | P value | Coefficient | ||
|---|---|---|---|---|---|
| Demographics | Age | – | 9.835E-15 | 0.1121 | |
| Gender | Male | 61.69% | 0.2095 | − 0.4998 | |
| Female | 38.31% | ||||
| Common symptoms | Cough | 29.86% | 0.937 | − 0.0807 | |
| Fever | 46.56% | 0.8287 | − 0.1853 | ||
| High fever | 0.4% | 0.9712 | − 8.5365 | ||
| Muscle pain | 2.4% | 0.0453 | 2.7147 | ||
| Joint pain | 1.8% | 0.9524 | − 8.4264 | ||
| Throat pain | 8.3% | 0.06003 | 2.5466 | ||
| Pneumonia | 36.7% | 0.0119 | 2.9523 | ||
| Respiratory distress | 0.2% | 0.9864 | − 6.4765 | ||
| Dyspnoea | 1.4% | 0.9909 | − 2.636 | ||
| Difficulty in breathing | 3.14% | 0.1446 | 1.7397 | ||
| Malaise | 5.5% | 0.9396 | − 6.7776 | ||
| Fatigue | 2.16% | 0.1021 | 2.3038 | ||
| Other symptoms | Running nose | 3.14% | 0.9355 | − 7.9937 | |
| Flu | 0.59% | 0.9781 | − 7.0568 | ||
| Chest pain | 0.59% | 0.9656 | − 8.5042 | ||
| Sputum | 2.16% | 0.9559 | − 7.3175 | ||
| Dry mouth | 0.2% | 0.9798 | − 8.5962 | ||
| Thirst | 0.2% | 0.9866 | − 6.4765 | ||
| Abdominal pain | 0.2% | 0.9975 | − 1.9189 | ||
| Vomiting | 1.18% | 0.9715 | − 6.2568 | ||
| Diarrhea | 1.96% | 0.9702 | − 5.7918 | ||
| Loss of appetite | 0.39% | 0.9682 | − 9.2821 | ||
| Chills | 2.95% | 0.9386 | − 8.4315 | ||
| Sore body | 0.2% | 0.9933 | − 3.9594 | ||
| Reflux | 0.2% | 0.9945 | − 3.4291 | ||
| Nausea | 0.79 | 0.9774 | − 6.3657 | ||
| Headache | 3.73% | 0.9505 | − 6.2049 | ||
Bold values indicated best results
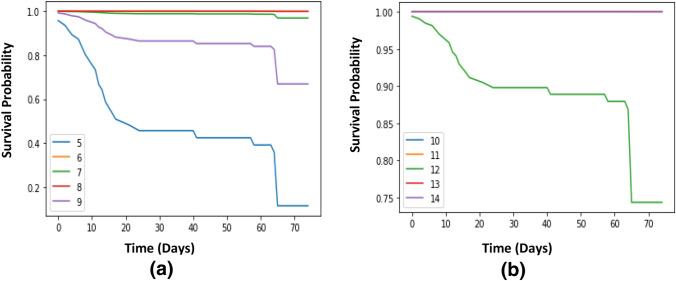
The main contribution for Cox_COVID_19 model is to predict the survival probability overtime. Figure 4 shows the survival probability for fifteen patients’ overtime that are chosen as examples for predicting survival probability.
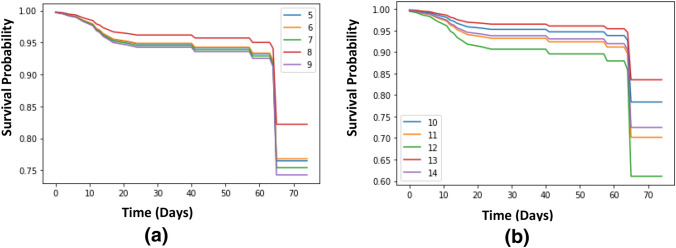
Survival probability for randomly ten patients using Cox_COVID_19 is shown in Fig. 5a. It is shown that patient 6 and patient 8 have a survival probability up to one over the whole time, patient 7 has a survival probability that is close to one, patient 9 has a probability of surviving, that is decreasing to be close to 0.7, and patient 5 has a probability that is decreasing overtime till reaching less than 0.1. Survival probability for another randomly five patients using Cox_COVID_19 is shown in Fig. 5b. For Fig. 6a, survival probability for the first randomly five patients using Deep_Cox_COVID_19 is presented. Figure 6b shows the survival probability for the second randomly five patients using Deep_Cox_COVID_19.
Fig. 5.
a, and b: Survival curve for randomly 10 patients using Cox_COVID_19
Fig. 6.
a, and b: Survival curve for randomly 10 patients using Deep_Cox_COVID_19
Improving Cox_COVID_19 system using deep learning
The implementation of the designated dataset in its original form in this research led to the appearance of some trammels such as high collinearity and convergence, so autoencoder deep neural network is implemented to solve such problems by reconstructing features presenting a new system called Deep_Cox_COVID_19. After comparing results, it is shown that Deep_Cox_COVID_19 system outperforms Cox_COVID_19 system in terms of concordance, accuracy and precision. Table 3 shows the internal construction of the autoencoder, we built in this paper. It consists of one layer with 31 nodes for the input layer, of one layer with 31 nodes as an encoder, one layer with 30 nodes as bottleneck and finally the decoder to reconstruct data, with one layer and 31 nodes.
Table 3.
Autoencoder construction
| Input layer | Encoder | Bottleneck | Decoder | Reconstruction loss | Activation function | |
|---|---|---|---|---|---|---|
| Number of layers | 1 | 1 | 1 | 1 | binary_crossentropy | Relu |
| Number of nodes | 31 | 31 | 30 | 31 | – | – |
Loss functions are used to determine the error between the prediction of our model and the actual target variable, the used reconstruction loss function in this paper is binary_crossentropy. An activation function is the function used to predict the output based on the input, and the used activation function in this paper is Rectified Linear Unit (ReLU). ReLU can be considered as a linear function in which the input will be directly outputted if it is positive; otherwise, it will output zero. For several forms of neural networks, it has become the default activation feature because it is easier to train a model that uses it and often achieves better performance.
Cox regression [17] is used to predict the probability of survival for each patient. For evaluating the accuracy of the model, a threshold is used. So that, the patients with a probability for survival higher than the threshold, they are the closest to survive, and patients with a probability for survival lower than the threshold, they are the furthest to survive. Table 4 shows a comparison between Cox_COVID_19 system and Deep_Cox_COVID_19 system. It is shown in Table 4 that, for Cox_COVID_19 system, the best accuracy of the test subset is up to 95.71%, with a threshold up to 0.1 and accuracy for the train subset up to 93.5%. The best accuracy with the train subset is 96.21%, with a threshold up to 0.3 and accuracy with the test subset up to 95.71%. As shown in the results below, Deep_Cox_COVID_19 system always gives better accuracy for both test and train subsets with all subsets.
Table 4.
Survival function accuracy for proposed system with different thresholds
| Threshold | Cox_COVID_19 | Deep_Cox_COVID_19 | ||
|---|---|---|---|---|
| Accuracy | ||||
| Train (%) | Test (%) | Train (%) | Test (%) | |
| 0.1 | 93.5 | 95.71 | 95.12 | 95.71 |
| 0.15 | 93.5 | 95 | 95.39 | 95.71 |
| 0.2 | 93.77 | 95 | 95.93 | 95.71 |
| 0.3 | 93.77 | 92.9 | 96.21 | 95.71 |
| 0.45 | 93.31 | 91.4 | 96.21 | 95 |
Bold values indicated best results
As shown in Table 5, Deep_Cox_COVID_19 system always gives better precision for both test and train subsets with all subsets.
Table 5.
Survival function precision for proposed system
| Threshold | Cox_COVID_19 | Deep_Cox_COVID_19 | ||
|---|---|---|---|---|
| Precision | ||||
| Train (%) | Test (%) | Train (%) | Test (%) | |
| 0.1 | 100 | 100 | 100 | 100 |
| 0.15 | 92.9 | 80 | 100 | 100 |
| 0.2 | 93.3 | 80 | 100 | 100 |
| 0.3 | 81 | 50 | 100 | 100 |
| 0.45 | 77.8 | 41.7 | 81.5 | 80 |
Bold values indicated best results
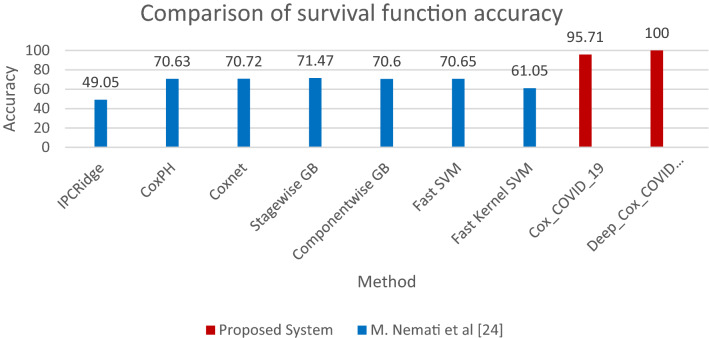
A comparison between our proposed system (Cox_COVID_19, and Deep_Cox_COVID_19) results and different algorithms (IPCRidge, CoxPH, Coxnet, Stagewise GB, Componentwise GB, Fast SVM, and Fast Kernel SVM) [24] applied on the clinical dataset for COVID-19 is presented in Table 6. The results show the proposed system achieves higher survival function accuracy as shown in Fig. 7.
Table 6.
Comparison of survival function accuracy for proposed systems and other algorithms
| Author(s) | Algorithm | Accuracy (%) | Dataset |
|---|---|---|---|
| Nemati et al. [24] | IPCRidge | 49.05 |
Open-access COVID- 19 epidemiological data [25] |
| CoxPH | 70.63 | ||
| Coxnet | 70.72 | ||
| Stagewise GB | 71.47 | ||
| Componentwise GB | 70.60 | ||
| Fast SVM | 70.65 | ||
| Fast Kernel SVM | 61.05 | ||
| Proposed system |
Cox_COVID_19 (Cox regression method) |
95.71 | Novel Corona Virus 2019 Dataset-Kaggle [20] |
| Deep_Cox_COVID_19 | 100 |
Bold values indicated best results
Fig. 7.
Survival function accuracy for proposed system and other algorithms
A comparison between our Cox_COVID_19 results and another algorithm applied on the same clinical dataset for COVID-19 is presented in Table 7.
Table 7.
Comparison of proposed system and previous studies for features affecting the mortality
| Author(s) | Algorithm | Key features | Results | |
|---|---|---|---|---|
| Feature | Percentage | |||
| Yan, Zhang et al. [10] | XGBoost machine learning algorithm | Male | 58.7% |
Male, fever, cough, fatigue, dyspnoea, lactic dehydrogenase (LDH), lymphocyte and high-sensitivity C-reactive protein (hs-CRP) are the key features for differentiating between critical patients from the two classes |
| Fever | 49.9% | |||
| Cough | 13.9% | |||
| Fatigue | 3.7% | |||
| Dyspnoea | 2.1% | |||
| Shuai Zhang et al. [26] | Univariable Cox regression Model | Age, years | – | Age, male, fever, cough, weakness, severely ill, any and hypertension are the most important factors affecting the mortality |
| Male | 60% | |||
| Fever | 66.67% | |||
| Cough | 70% | |||
| Weakness | 53.33% | |||
| Severely ill | 96.67% | |||
| Any | 70% | |||
| Hypertension | 53.33% | |||
| Cox_COVID_19 prediction system | Cox regression method | Age | – | Age, fever, cough, pneumonia, muscle pain and throat pain are the most important factors affecting the mortality |
| Male | 61.69% | |||
| Fever | 46.56% | |||
| Pneumonia | 36.7% | |||
| Cough | 29.86% | |||
| Throat Pain | 8.3% | |||
Conclusion
The results show that age, muscle pain, and pneumonia all have p value that is less than 0.05 and throat pain has a p value that is higher than 0.05 but still very small. So that, age, pneumonia, muscle pain and throat pain are the most important factors affecting the mortality. For evaluating the accuracy of the model, a threshold is used. So that the patients with a probability for survival higher than the threshold, they are the closest to survive, and patients with a probability for survival lower than the threshold, they are the furthest to survive. The best result for Cox_COVID_19 is when the threshold up to 0.1 with a training accuracy up to 93.5% and a testing accuracy up to 95.71%. Deep_Cox_COVID_19 shows better results with all threshold values, but the best result was when the threshold was up to 0.3 with a training accuracy up to 96.21% and a testing accuracy up to 95.71%. An autoencoder deep neural network is implemented to solve problems like high collinearity and convergence presenting Deep_Cox_COVID_19 system. Deep_Cox_COVID_19 system outperforms Cox_COVID_19 in terms of concordance, accuracy and precision.
Acknowledgements
We thank Dr. Noura Atef for useful discussions and providing us with the necessary medical information.
Footnotes
Publisher's Note
Springer Nature remains neutral with regard to jurisdictional claims in published maps and institutional affiliations.
References
- 1.Salata C, Calistri A, Parolin C, Palù G. Coronaviruses: a paradigm of new emerging zoonotic diseases. Pathog Dis. 2019 doi: 10.1093/femspd/ftaa006. [DOI] [PMC free article] [PubMed] [Google Scholar]
- 2.World Health Organization (2020) Director-General's remarks at the media briefing on 2019-nCoV on 11 February 2020, https://www.who.int/dg/speeches/detail/who-director-general-s-remarks-at-the-media-briefing-on-2019-ncov-on-11-february-2020 Accessed from 1 Apr 2020
- 3.Fadnavis RA. Application of machine learning for survival analysis- a review. IOSR J Eng (IOSRJEN) 2019;9(5):56–60. [Google Scholar]
- 4.Cox DR. Partial likelihood. Biometrika. 1975;62:269–762. doi: 10.1093/biomet/62.2.269. [DOI] [Google Scholar]
- 5.Grqnnesby JK, Borgan Q. A method for checking regression models in survival analysis based on the risk score. Lifetime Data Anal. 1996;2:315–328. doi: 10.1007/BF00127305. [DOI] [PubMed] [Google Scholar]
- 6.Biglarian A, Bakhshi E, Baghestani AR, Gohari MR, Rahgozar M, Karimloo M. Nonlinear Survival Regression Using Artificial Neural Network. J Probab Stat. 2013 doi: 10.1155/2013/753930. [DOI] [Google Scholar]
- 7.Kissler SM, Tedijanto CH, Goldstein EM, Grad YH, Lipsitch M. Projecting the transmission dynamics of SARS-CoV-2 through the post-pandemic period. MedRxiv Prepr. 2020 doi: 10.1101/2020.03.04.20031112. [DOI] [PMC free article] [PubMed] [Google Scholar]
- 8.Khan MHR, Shaw JEH. Variable selection for accelerated lifetime models with synthesized estimation techniques. Stat Methods Med Res. 2019;28(3):937–952. doi: 10.1177/0962280217739522. [DOI] [PubMed] [Google Scholar]
- 9.Khan MHR, Shaw JEH. Variable selection for survival data with a class of adaptive elastic net techniques. Stat Comput. 2016;26(3):725–741. doi: 10.1007/s11222-015-9555-8. [DOI] [Google Scholar]
- 10.Yan L, Zhang H-T, Xiao Y, Wang M, Sun C, Liang J, Li S, Zhang M, Guo Y, Xiao Y, Tang X, Cao H, Tan X, Huang N, Jiao B, Luo A, Cao Z, Xu H. Prediction of criticality in patients with severe Covid-19 infection using three clinical features: a machine learning-based prognostic model with clinical data in Wuhan. J MedRxiv Prepr. 2020 doi: 10.1101/2020.02.27.20028027. [DOI] [Google Scholar]
- 11.Xiang J, Wen J, Yuan X, Xiong S, Zhou X, Liu C, Min X. Potential biochemical markers to identify severe cases among COVID-19 patients. J MedRxiv Prepr. 2020 doi: 10.1101/2020.03.19.20034447. [DOI] [Google Scholar]
- 12.Mollazehi M, Mollazehi M, Abdel-Salam A. Modeling survival time to recovery from COVID-19: a case study on Singapore. J Res Sq. 2020 doi: 10.1101/2020.03.04.20031112. [DOI] [Google Scholar]
- 13.Nemati M, Ansary J, Nemati N. Machine-learning approaches in COVID-19 survival analysis and discharge-time likelihood prediction using clinical data. Pattern. 2020;1(5):10074. doi: 10.1016/j.patter.2020.100074. [DOI] [PMC free article] [PubMed] [Google Scholar]
- 14.Liang Y, Chai H, Liu X-Y, Xu Z-B, Zhang H, Leung K-S. Cancer survival analysis using semisupervised learning method based on Cox and AFT models with L12⁄regularization. J BMC Med Genom. 2017 doi: 10.1038/s41598-017-13133-5. [DOI] [PMC free article] [PubMed] [Google Scholar]
- 15.C. Lee, W. Zame, J. Yoon, M. Schaar (2018) DeepHit: a deep learning approach to survival analysis with competing risks. In: Thirty-Second AAAI Conference on Artificial Intelligence
- 16.Ranganath R, Perotte A, Elhadad N, Bleq D. Deep survival analysis. Proc Mach Learn Healthc. 2016;56:2016. [Google Scholar]
- 17.Cox DR. Regression models and life tables. J R Stat Soc. 1972;34:187–220. [Google Scholar]
- 18.Wang P, Li Y. Machine learning for survival analysis: a survey. J ACM Comput Surv. 2017;51(6):1–36. [Google Scholar]
- 19.Bradburn M, Clark T, Love S, Altman D. Survival analysis part II: multivariate data analysis – an introduction to concepts and methods. Br J Cancer. 2003;89:431–436. doi: 10.1038/sj.bjc.6601119. [DOI] [PMC free article] [PubMed] [Google Scholar]
- 20.https://www.kaggle.com/sudalairajkumar/novel-corona-virus-2019-dataset. Accessed from 25 Apr 2020
- 21.Steck H, Krishnapuram B, Dehing-Oberije C, Lambin P, Raykar VC (2008) On Ranking in Survival Analysis: Bounds on the Concordance Index. In: Advances in neural information processing systems, pp. 1209-1216. https://papers.nips.cc/paper/2007/file/33e8075e9970de0cfea955afd4644bb2-Paper.pdf
- 22.Heller G, Mo Q. Estimating the concordance probability in a survival analysis with a discrete number of risk groups. Lifetime Data Anal. 2016;22:263–279. doi: 10.1007/s10985-015-9330-3. [DOI] [PMC free article] [PubMed] [Google Scholar]
- 23.Salem H, Attiya G, El-Fishawy N (2016) Intelligent decision support system for breast cancer diagnosis by gene expression profiles. In: Proceedcing of NATIONAL RADIO SCIENCE CONFERENCE (NRSC) Arab Academy for Science, Technology & Maritime Transport, p. 421
- 24.Nemati M, Ansary J, Nemati N. Machine-learning approaches in COVID-19 survival analysis and discharge-time likelihood prediction using clinical data. Patterns. 2020;1(5):14. doi: 10.1016/j.patter.2020.100074. [DOI] [PMC free article] [PubMed] [Google Scholar]
- 25.https://www.thelancet.com/journals/laninf/article/PIIS1473-3099(20)30119-5/fulltext
- 26.Zhang S, Mengfei G, Limin D, Feng W, Guorong H, Zhihui W, Qi H, et al. Development and validation of a risk factor-based system to predict short-term survival in adult hospitalized patients with COVID-19 a multicenter retrospective cohort study. Crit Care. 2020;24(1):1–13. doi: 10.1186/s13054-019-2683-3. [DOI] [PMC free article] [PubMed] [Google Scholar]


