

Abstract
Background
Z-endoxifen is the most potent of the metabolites of tamoxifen, and has the potential to be more effective than tamoxifen because it bypasses potential drug resistance mechanisms attributable to patient variability in the expression of the hepatic microsomal enzyme CYP2D6. 18F-FES is a positron emission tomography (PET) imaging agent which selectively binds to estrogen receptor alpha (ER-α) and has been used for non-invasive in vivo assessment of ER activity in tumors. This study utilizes 18F-FES PET imaging as a pharmacodynamic biomarker in patients with ER+ tumors treated with Z-endoxifen.
Methods
Fifteen patients were recruited from a parent therapeutic trial of Z-endoxifen and underwent imaging with 18FFES PET at baseline. Eight had positive lesions on the baseline scan and underwent follow-up imaging with 18F-FES 1– 5 days post administration of Z-endoxifen.
Results
Statistically significant changes (p = 0.0078) in standard uptake value (SUV)-Max were observed between the baseline and follow-up scans as early as 1 day post drug administration.
Conclusion
F-FES PET imaging could serve as a pharmacodynamic biomarker for patients treated with ER-directed therapy.
Keywords: 18F-FES, Fluoroestradiol, Positron emission, tomography (PET), Z-endoxifen, Pharmacodynamic marker
Introduction
Advances in our understanding of the tumor biology of estrogen receptor-positive (ER+) malignancies have led to the development of a wide array of targeted therapies for patients with ER+ disease, and the ER is a target in malignancies like breast cancer, for which agents such as selective estrogen receptor degraders (SERDs) are under development. A major therapeutic option in ER+ tumors is hormone therapy directed at interrupting the estrogen signaling that stimulates growth [1]. Tamoxifen is among the most commonly used drugs for treating ER+ malignancies. However, it must first be converted into active metabolites, mediated by the enzyme CYP2D6, to exert its pharmacologic effect. Significant inter-patient variability has been observed in the efficacy of tamoxifen, with recurrence rates of 30–50 % in patients receiving tamoxifen in the adjuvant setting [2]. Responsiveness to tamoxifen depends in part on the genetic variability in patient drug-metabolizing enzyme levels, particularly CYP2D6. Administration of endoxifen, the most potent tamoxifen metabolite, would circumvent the need for metabolic activation, potentially reducing or eliminating the variability in response rates due to differences in CYP2D6 levels. Z-endoxifen, the hydrochloride salt and the Z(cis)stereoisomer of endoxifen, has significant potential for antineoplastic activity and is being investigated in several clinical trials (ClinicalTrials.gov identifiers: NCT02311933, NCT01273168). First-in-human studies of Z-endoxifen published in 2010 demonstrated that Zendoxifen administered orally was rapidly absorbed by the body, with a T-max of approximately 6 h [3].
The level of ER expression has been shown to provide important prognostic information and also to predict the likelihood of a response to conventional hormone therapy [4, 5]. 16 alpha-[18F]fluoro-17 beta-estradiol (18F-FES) has been proposed as a non-invasive in vivo marker of tumor ER activity. There are two naturally occurring subtypes of the ER, α and β, which are encoded by the ESR1 and ESR2 genes, respectively [6]. While the role of ER-β is not fully understood and has not yet been investigated in clinical trials of breast cancer treatment [7, 8], ER-α has been studied extensively as a binding target for both therapeutic and diagnostic agents [9, 10]. Furthermore, ER-α has been the subject of several studies examining the use of ER-targeting imaging agents to provide pharmacodynamic information on ER-targeted agents [11–13]. Similar approaches of using imaging studies as pharmacodynamic markers for therapy has also been reported in other agents and models, such as the use of 11C-choline in prostate cancer [14] and 89Zr-transferrin for transcription inhibitors [15].
18F-FES is an investigational radiolabeled positron emission tomography (PET) imaging agent that selectively binds to ER-α, with an affinity for ER-α which is 6.3 times as high as that for ER-β [16]. Several studies have shown the reliability of 18F-FES in detecting ER+ lesions in humans, with uptake corresponding to the degree of immunohistochemical (IHC) staining for ER on tumor biopsies [4, 11, 17, 18]. Studies conducted in patients with locally advanced, metastatic, and pretreated breast cancer have demonstrated a direct relationship between response to endocrine therapy, primarily tamoxifen and aromatase inhibitors, and 18F-FES uptake on PET imaging [19]. Furthermore, prior research reported that baseline 18F-FES uptake corresponded with subsequent tumor response 6 months after hormone treatment [20].
Currently, invasive procedures including tissue biopsy are required to determine the degree to which Z-endoxifen might suppress ER activity in vivo. 18F-FES PET imaging could be useful for non-invasive detection of the response of refractory ER+ solid tumors to Z-endoxifen, and has in fact been shown to have added value in tumors such as uterine sarcoma and leiomyoma [21]. The objective of this study was to determine whether a very early (1–5 days post therapy) pharmacodynamic effect could be detected with 18F-FES PET after Z-endoxifen therapy.
Material and methods
Patient population
The imaging study was an optional component of a prospective National Cancer Institute Institutional Review Board (IRB)-approved study (CTEP study no. 8826, ClinicalTrials.gov ID: NCT01273168) of the therapeutic drug Z-endoxifen. Written informed consent was obtained from all patients, and all data were acquired and stored in compliance with the Health Insurance Portability and Accountability Act (HIPAA). The results of the therapeutic trial will be reported separately.
The 18F-FES PET imaging protocol was conducted in patients participating in a phase I treatment trial with Z-endoxifen, whose inclusion criteria included patients with refractory ER+ breast cancer, desmoid tumors, gynecologic cancers, or other presumed ER+ solid tumors. Patients with breast cancer had to have had at least one prior chemotherapy regimen and one prior hormone regimen for metastatic disease, and all other patients had disease that had progressed following at least one line of standard therapy. No major surgery, radiation, hormone therapy, or chemotherapy was permitted within 4 weeks prior to study enrollment. From December 2011 to November 2014, 15 of 29 eligible patients enrolled in the phase I treatment trial were recruited to the 18F-FES PET imaging study. All 15 patients completed a baseline 18F-FES PET/CT scan, and eight of the 15 were brought back for follow-up 18F-FES PET/CTscans 1 to 5 days after Z-endoxifen administration because the initial scan was positive for 18F-FES uptake.
Radiotracer
The 18F-FES (16 alpha-[18F]-fluoro-17 beta-estradiol) used in this study was prepared by the Leidos Biomedical Research, Inc. radiopharmacy in the Frederick National Laboratory for Cancer Research located in Frederick, Maryland, and was supplied as a sterile IV-injectable solution in a volume of ≤ 30 mL containing 0.15 M phosphate-buffered saline [22, 23]. The specific activity was 3500 ± 1500 Ci/mM at the end of synthesis, with radiochemical purity of > 95 %. The radiotracer was administered to patients by intravenous injection of 0.07 mCi/kg (2.6 Mbq/kg) of 18F-FES, with a maximum prescribed dose of 6.0 mCi (222 Mbq).
Z-endoxifen and clinical follow-up
Z-endoxifen HCl (Z-4-hydroxy-N-desmethyl-tamoxifen hydrochloride) was administered orally to patients once daily for 28 days per cycle. Due to the phase I dose-escalation nature of the parent therapy trial, patients in the PET imaging study received varied doses of Z-endoxifen ranging from 40 to 300 mg.
Imaging protocol
Patients underwent imaging from the base of the skull to the mid-thigh approximately 60 min after 18F-FES IV injection over 1 min. In some patients, the injection time was drawn out over several minutes due to transient pain from the injected solution. PET/CT images were acquired using a Philips Gemini Time-of-Flight (TOF) scanner (Philips Medical Systems, Cleveland, OH, USA) in 3D acquisition mode, with 2-min acquisition time per bed position. Images were reconstructed using a TOF LOR-based fully 3D iterative reconstruction using a blob-biased function [24]. The iterative 3D reconstruction was performed using two iterations and 33 subsets, with no post filtering. The scans were reconstructed into 4 × 4 × 4 mm voxel images. All PET data were reconstructed with and without attenuation correction using low-dose, unenhanced computed tomography (CT), which was also used for anatomical co-registration. The CT scan parameters were 1.438 pitch, 0.75 s rotation, 120 keV xray tube voltage, and 60 mAs tube current. The images were reconstructed into a 70-cm-diameter field of view (FOV), 512 × 512 image. Blood samples were collected within 24 h of each 18F-FES-PET/CT scan session to check for levels of serum estradiol and sex hormone-binding globulin (SHBG) to rule out inhibition of the 18F-FES by competition or carrier binding.
Image analysis
Images were reviewed and analyzed by two board-certified nuclear medicine physicians using commercial software (MIM, version 6.3.9). Volumes of interest (VOIs) were manually drawn over lesions by an experienced nuclear medicine physician using the PET images with the corresponding non-contrast CT serving as a guide, and contours were checked for concurrence by a second experienced nuclear medicine physician. The non-contrast CT component of the PET/CT scan and other imaging modalities (magnetic resonance imaging [MRI], ultrasound, 18F-FDG PET), when available, were used to better identify and localize tumors. Each visualized lesions was assessed qualitatively, with positive lesions being defined as visually distinct compared to background, and semi-quantitatively, using the standard uptake value (SUV). Histopathological information, when available, was used as the reference standard for lesion positivity/negativity. However, as this information was not available for many of the visualized lesions, serial imaging of all available modalities was used as the “imaging consensus” reference standard in these cases. For each tumor, SUV-Max (defined as the mean of the hottest 20 % of pixels in the VOI), SUV-Mean, and tumor volume (TV) of the manually drawn VOIs were calculated. Baseline SUV parameters and TVs, as well as percentage change in the parameters from baseline to post treatment, were computed.
Statistical analysis
Clinical and tumor lesion data were collected from all patients. Pre- and post-treatment percentage change in SUV uptake and TV were calculated for SUV-Max, SUV-Mean, and TV. For patients with multiple lesions, the mean and maximum percentage change across multiple lesions was taken to represent each patient’s average and worst outcomes, respectively. A subanalysis of bony lesions was conducted. The significance of per-patient percentage change in SUV uptake was evaluated by one-sample Wilcoxon tests. The difference in percentage change in SUV between patients with and without bone lesions was compared by the two-sample Wilcoxon test. The correlation between dose level and per-patient percentage change in SUV uptake was measured by the Spearman rank correlation.
Results
A total of 15 patients (13 females and 2 males) underwent 18F-FES scans, with an average age of 59.2 ± 13.9 years (range 22–75). Cancers included breast (n = 4, with one male breast cancer), gynecological malignancies (two endometrial, four ovarian, one cervical, one fallopian tube), and desmoid tumors (n = 3). Eight of 15 patients completed baseline and posttreatment follow-up 18F-FES PET imaging. Patients who did not have at least one positive lesion on the baseline scan were not asked to return for the follow-up study. Table 1 presents the complete demographic information on the enrolled patients.
Table 1.
Patient demographics with scan and treatment dose information
| Patient no. | Age (years) | Sex | Tumor type | Baseline 18F-FES dose (mCi) | F/U scan time (days) | F/U 18F-FES dose (mCi) | Z-endoxifen dose (mg q.d.) |
|---|---|---|---|---|---|---|---|
| 1 | 56 | F | Endometrial adenocarcinoma | 3.70 | 3 | 5.90 | 40 |
| 2 | 63 | F | Invasive ductal carcinoma | 5.77 | 5 | 5.87 | 40 |
| 3 | 46 | F | Metastatic breast cancer | 5.90 | 5 | 6.30 | 60 |
| 4 | 73 | F | Serous papillary ovarian cancer | 6.60 | N/A | 60 | |
| 5 | 75 | F | Ovarian adenocarcinoma | 5.80 | N/A | 100 | |
| 6 | 56 | F | Cervical cancer | 6.00 | 2 | 5.80 | 140 |
| 7 | 42 | F | Desmoid tumor of shoulder | 6.00 | N/A | 140 | |
| 8 | 66 | F | Serous ovarian carcinoma | 6.00 | 2 | 6.00 | 140 |
| 9 | 61 | F | Serous carcinoma of the fallopian tube | 4.30 | 3 | 5.50 | 200 |
| 10 | 68 | F | Poorly differentiated granulosa tumor of the ovary | 3.90 | N/A | 200 | |
| 11 | 62 | M | Invasive ductal carcinoma of the male breast | 4.50 | N/A | 200 | |
| 12 | 67 | F | Endometrial carcinoma | 5.90 | N/A | 300 | |
| 13 | 59 | M | Desmoid tumor of abdominal mesentery | 5.90 | 2 | 5.90 | 300 |
| 14 | 72 | F | Infiltrating ductal carcinoma of breast | 6.00 | 2 | 6.00 | 280 |
| 15 | 22 | F | Desmoid tumor of shoulder axilla | 5.90 | N/A | 280 |
The mean injected dose of 18F-FES was 5.5 ± 0.9 mCi (203 ± 33 Mbq), with a range of 3.7 to 6.6 mCi (137– 244 Mbq), for the baseline study, and 5.9 ± 0.2 mCi (219 ± 8 Mbq), with a range of 5.5 to 6.3 mCi (204– 233 Mbq) for the follow-up scan.
Seven patients underwent scanning only at baseline, with a total of 21 distinct non-FES-avid lesions identified using other available imaging sources including diagnostic CT or MRI. Of these 21 lesions, six were located in the bone, five in the chest, one in the arm, one in the liver, and eight elsewhere within the abdomen and pelvis. The lesion in the liver had an SUV of 9.3, but since the background liver SUV was 10.1 due to physiologic tracer metabolism, the liver lesion was considered not to be evaluable. Not counting this liver lesion, the average SUVMax of all lesions in this group was 2.0 ± 0.7 (range 0.8 to 3.7), while the average SUV-Max of the bone lesions was 2.0 ± 0.4 (range 1.3–2.3). The average TV in mm3 was 44.6 ± 151.6 (range 0.7–700.1).
For the eight patients who completed both pre- and posttherapy 18F-FES PET scans, 41 distinct lesions were identified, among which 19 were located in the bone, six within the chest, one in the breast, three in the liver, and 12 elsewhere within the abdomen and pelvis. Liver lesions were considered not evaluable for this study due to the high 18F-FES uptake in the background liver parenchyma. The number of lesions found per patient ranged from 1 to 11. On the baseline scan, the average SUV-Max among all lesions was 4.8 ± 3.4 (range 0.7–14.1), while on the follow-up scan, the average SUV-Max was 2.5 ± 2.3 (range 0.7–9.9). The average percentage change from baseline among all lesions was −38.9 % ± 31.7 % (range −86.1 to +29.9 %), while the average absolute change in SUVMax was −2.3 ± 1.1 (range −10.9 to +2.0). The average TV in mm3 at baseline and follow-up and the average percentage change from baseline to follow-up were 27.5 ± 62.4 (range 0.8–293.0), 29.8 ± 70.7 (range 0.4–376.2), and 11.1 ± 63.5 % (range −77.4 to +236.2 %), respectively. For bone lesions, the average SUV-Max on the baseline and follow-up scans and the average percentage change were 5.3 ± 3.2 (range 1.0–12.6), 1.6 ± 0.4 (range 0.9–2.7), and −58.9 ± 22.2 % (range −4.0 to −86.1 %). For TV in bone lesions, the average SUV-Max on the baseline and follow-up scans and the average percentage change were 16.8 ± 14.7 (range 2.2–50.7), 17.5 ± 16.0 (range 2.3–58.9), and 11.2 ± 63.5 % (range −49.0 to +202.4 %), respectively. These results are summarized in Table 2.
Table 2.
Correlation of treatment dose with change in SUV and tumor volume
| Patient no. | Dose (mg) | Mean % change in SUV-Mean | Mean % change in SUV-Max | Mean % change in tumor volume |
|---|---|---|---|---|
| 1 | 40 | −17.00 % | −33.19 % | −20.30 % |
| 2 | 40 | −16.21 % | −15.23 % | 24.85 % |
| 3 | 60 | −75.81 % | −76.41 % | 43.30 % |
| 6 | 140 | −2.09 % | −13.19 % | 6.20 % |
| 8 | 140 | −19.49 % | −20.97 % | 8.62 % |
| 9 | 200 | −35.29 % | −32.01 % | 48.65 % |
| 13 | 300 | 40.24 % | −31.91 % | −6.91 % |
| 14 | 280 | −34.68 % | −46.19 % | −10.51 % |
On a per-patient level, the mean percentage change in SUV-Max, SUV-Mean, and TV from baseline to follow-up scan was −33.6, −20.0, and 11.7 %, respectively, with the change in SUV-Max reaching statistical significance (P = 0.0078). In patients with more than one lesion, the maximum percentage change (representing the worst disease in the patient) for SUV-Max, SUV-Mean, and TV was 8.7, −4.9, and 82.2 %, respectively. These results are summarized in Table 3.
Table 3.
Per-patient mean and maximum percentage change of SUV and tumor volume after treatment
| Mean % change (per-patient average outcome) |
Maximum % change (per-patient worst outcome) |
|||||
|---|---|---|---|---|---|---|
| Mean | SD | P value | Mean | SD | P value | |
| SUV-Mean | −20.04 | 0.33 | 0.1484 | 8.7 | 0.4 | 0.4609 |
| SUV-Max | −33.59 | 0.2 | 0.0078 | −4.88 | 0.3 | 0.8438 |
| Tumor volume | 11.69 | 0.25 | 0.3828 | 82.15 | 0.91 | 0.0391 |
The relationship of SUV-Max, SUV-Mean, and TV in patients with primarily bone lesions was also explored. Patients with bone lesions exhibited a trend toward higher mean percentage reduction in SUV-Max than patients who did not have bone disease (see Fig. 1), but the difference was not statistically significant (p = 0.0714). Because of the phase I dose-escalation nature of the parent therapeutic trial, patients in this imaging study received varied doses of the therapeutic drug Zendoxifen. Among the eight patients who had both baseline and post-therapy scans, the doses of Z-endoxifen administered were 40 mg (n = 2), 60 mg (n = 1), 140mg (n = 2), 200 mg (n = 1), 280mg (n = 1), and 300 mg (n = 1). The SUVresponse did not correlate with the dose level of Z-endoxifen (see Fig. 2). However, this may be related to the small sample size.
Fig. 1.

18F-Fluoroestradiol (18FFES) PET images before and 3 days after treatment with Zendoxifen administered orally in a breast cancer patient with bone metastasis. Focal tracer uptake in ER+ bone lesions is seen before treatment, but is blocked on the subsequent scan. Physiologic activity is seen in liver, GI tract, bladder, and vascular collateral vessels from the left arm injection
Fig. 2.

Dose–response analysis of changes seen on the FES PET scan vs. Z-endoxifen dose. Panels A–C show the percentage change in the SUVMax, SUV-Mean, and tumor volume, respectively, in all eight patients who received both a baseline and follow-up FES PET scan. Panels D–F show the same data but only for patients with breast cancer (three patients with 21 lesions), and panels G–I are patients with other gynecological cancers (four patients with 17 lesions). One patient with a desmoid tumor (with one lesion) is not plotted separately
The maximum serum estradiol was 74.0 pg/mL on the baseline scans and 20.9 pg/mL on the follow-up scans, which is within the normal physiologic range, and should not have adversely affected the 18F-FES PET scans. The highest SHBG levels at baseline and follow-up were 186 nmol/L (in a patient with a desmoid tumor) and 69 nmol/L, respectively, which is also not expected to have significantly affected the scans.
Of the four patients with breast cancers, all but one had focally positive 18F-FES tumors. One male patient with breast cancer had a negative 18F-FES scan of his bone metastasis. One breast cancer patient had bone metastases that were both ER+ and ER− (patient 14). Among the eight patients with gynecologic malignancies, four were 18F-FES-negative (three ovarian, one endometrial cancer), and two had both ER+ and ER− tumors (cervical and endometrial cancers). The three patients with desmoid tumors had very low 18F-FES uptake.
Discussion
18F-FES imaging was helpful in identifying ER+ tumors that could be targeted by anti-estrogen agents. As a metabolite of tamoxifen, endoxifen may improve response to treatment by circumventing possible genetic resistance mechanisms related to inherent differences in tamoxifen metabolism. This study revealed little association between 18F-FES uptake and Zendoxifen treatment. However, Z-endoxifen induced statistically significant changes in SUV that were demonstrated as early as 24 h post administration of Z-endoxifen (see Figs. 3 and 4). While this effect has been studied previously with tamoxifen [5, 13], fulvestrant [13, 25], and aromatase inhibitors [13], to the best of our knowledge, this is the first study to demonstrate this effect with Z-endoxifen. The ability to examine and quantitate ER expression of lesions at a whole-body level is important, as this can be used as an indicator of a drug’s ability to block tumor ER. In our study, we found that the average change in FES uptake after Z-endoxifen administration was a 33.6 % decline on a per-patient level, which is comparable to numbers reported in the literature. For instance, the Mortimer study published in 2001 showed a mean percentage decrease in SUV-Max of 54.8 % for responders vs. 19.4 % for non-responders on tamoxifen therapy [5], and the Linden study published in 2011 demonstrated a similar average decline of 54 % with tamoxifen and fulvestrant therapy [13].
Fig. 3.

Axial 18F-FES PET and PET/CT fusion images of a patient with cervical cancer at baseline and after three doses of Z-endoxifen, demonstrating heterogeneous ER status. Top images show a peri-rectal mass with focal uptake at baseline and significantly decreased activity at follow-up. Physiologic bowel activity is seen in the upper-right images at follow-up. The lower images show known lung metastases without significant uptake at baseline and follow-up suggesting ER expression
Fig. 4.

Axial 18F-FES PET and PET/CT fusion images of a patient with serous carcinoma of the fallopian tube at baseline and following three doses of Zendoxifen. Arrows point to the right iliopsoas mass with ER+ expression at baseline and blockade of receptors after initiating therapy
In the literature, 18F-FES activity has been shown to predict response to endocrine therapy with selective ER modulators in breast cancer [17, 26]. In examining specific tumors, bone disease appeared to respond earlier or faster than soft tissue lesions. This suggests underlying differences in biology or tumor environment that may need to be taken into account in evaluating treatment. In breast cancer patients, most lesions detected by 18F-FES are bone lesions, but heterogeneity of ER expression can also be a factor in the varied response to therapy [27]. For instance, we found three patients exhibiting apparent mixed ER expression among their known metastases as determined by the 18F-FES PET scan.
Only patients with distinctly positive focal 18F-FES uptake in tumors on baseline imaging had follow-up imaging after initial Z-endoxifen dosing. Patients without focal 18F-FES-positive tumors were considered not to have functional ER, and thus repeat imaging after treatment with an ER blocker would not be expected to change scan results. Furthermore, if 18F-FES PET imaging can be shown to reliably represent the functional state of ER expression in tumors, a completely negative 18F-FES PET scan may be sufficient justification to spare patients the potential toxicity and side effects of futile ER-targeted treatment.
There is limited experience with 18F-FES in gynecologic malignancies [21, 28, 29]. While an SUV-Max of greater than 1.5 is sometimes considered the threshold of positivity for ER expression in breast cancer, the average SUV of the negative lesions (by qualitative analysis) in our study was 1.95. One possible explanation for this slightly higher observed lesion SUV could be that many of the lesions seen in this study were close to areas of high physiologic 18F-FES activity, and that some of this surrounding activity was included in the lesion VOIs. Another explanation is that our study included many tumor types in addition to breast cancer, and that different malignancies may have different levels of ER expression. For instance, a recent study in epithelial ovarian cancer found an SUV-Max of > 1.8 to be the optimal threshold for discriminating between ER+ and ER− lesions [28]. In a recent study, 18F-FES PET demonstrated positive predictive value (PPV) of 60 % and negative predictive value (NPV) of 80 % for predicting response to estradiol therapy [30]. Although some trends were seen with regard to the predictive value of 18FFES for Z-endoxifen therapy, our study cohort was too small to draw statistically valid conclusions. Furthermore, some malignancies, such as desmoid tumors, may preferentially exhibit more ER-β expression, for which 18F-FES has a much lower binding affinity (see Fig. 5)[31–33].
Fig. 5.
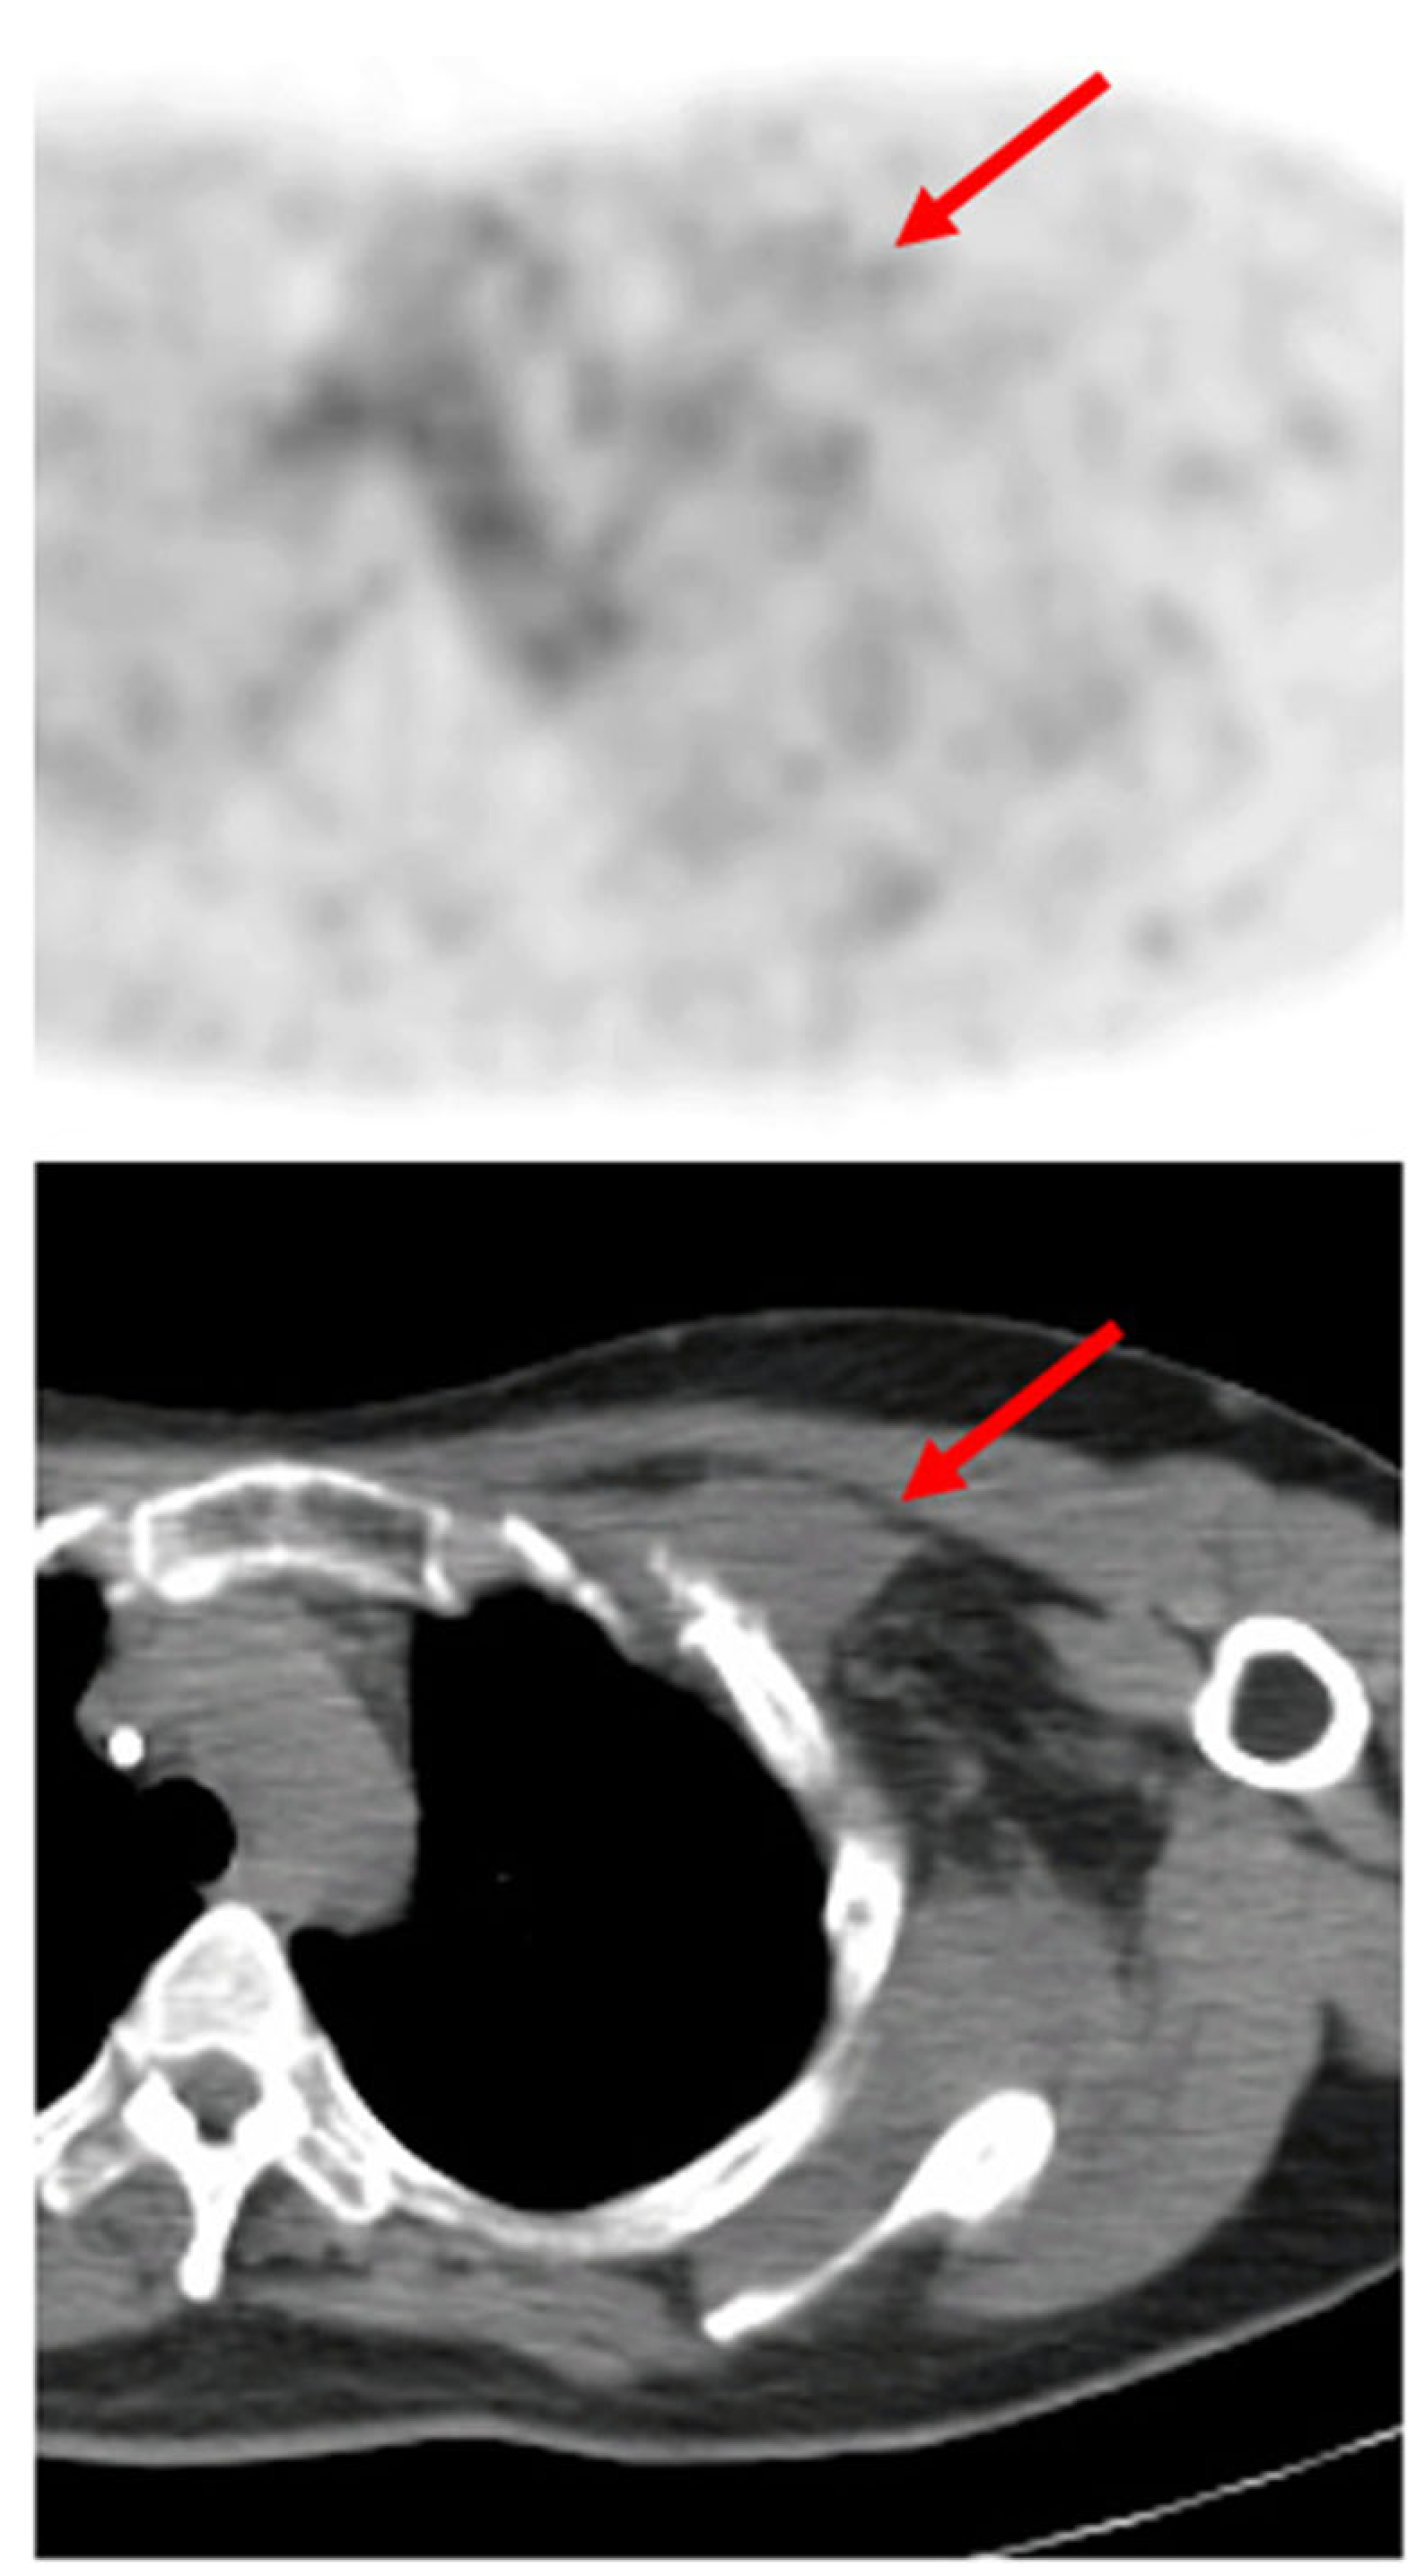
Axial 18F-FES PET and PET/CT fusion images of a desmoid tumor in the left subpectoral region without significant radiotracer uptake at baseline
Serum estradiol levels were within physiologic ranges and did not appear to affect 18F-FES uptake. Levels of SHBG were also measured, but even at the highest level, found in a patient with a desmoid tumor, the possible reduction in SUV still would likely not have changed the overall negative uptake status. Peterson et al. did not observe an effect with 18F-FES SUV and estradiol, but did note an inverse relationship with SHBG and SUV uptake, and suggested measuring levels in patients [34].
The TVs used in this study were obtained from VOIs that were manually drawn on the PET images in conjunction with the corresponding non-contrast CT. Due to the intrinsic resolution limitations of PET, it is likely that the TVs contain both inaccuracies and challenges in reproducibility that prevent us from drawing meaningful conclusions regarding the anatomic volumes of the lesions. However, just as some value has been found in the metabolic tumor volume (MTV) and total lesion glycolysis (TGL) measurements with 18F-FDG PET scans [35, 36], there may be some value in providing the total 18FFES uptake from this study in a volume format, and this should be investigated in future studies.
There are some limitations to this study. A larger number of patients would afford greater statistical power in determining the relationship between Z-endoxifen and 18F-FES. The decision to include all ER+ tumor types was made because the FES PET scan should, from a mechanistic point of view, be able to visualize all tumors that over-express ER. However, the wide variety in tumor histology also made it challenging to determine definitive histological associations with 18F-FES uptake, although ours is the first study to describe 18F-FES imaging in desmoid tumors.
Conclusion
In this study, we demonstrated the usefulness of 18F-FES as a pharmacodynamic marker for Z-endoxifen and perhaps for other novel ER-directed therapies. Future studies could evaluate the use of 18F-FES PET imaging both as a predictive marker for ER-based therapies and for treatment response.
Acknowledgments
Compliance with ethical standards
Funding This project was funded in whole or in part with federal funds from the National Cancer Institute, National Institutes of Health, under contract no. HHSN261200800001E. The content of this publication does not necessarily reflect the views or policies of the Department of Health and Human Services, nor does mention of trade names, commercial products, or organizations imply endorsement by the US government.
Footnotes
Conflict of interest All authors declare that they have no conflict of interest.
Ethical approval All procedures performed in studies involving human participants were in accordance with the ethical standards of the institutional and/or national research committee and with the 1964 Declaration of Helsinki and its later amendments or comparable ethical standards. This study was approved by the NIH/NCI IRB.
Informed consent Informed consent was obtained from all individual participants included in the study.
References
- 1.Heldring N, Pike A, Andersson S, Matthews J, Cheng G, Hartman J, et al. Estrogen receptors: how do they signal and what are their targets. Physiol Rev. 2007;87(3):905–31. doi: 10.1152/physrev.00026.2006. [DOI] [PubMed] [Google Scholar]
- 2.Davies C, Godwin J, Gray R, Clarke M, Cutter D, Darby S, et al. Relevance of breast cancer hormone receptors and other factors to the efficacy of adjuvant tamoxifen: patient-level meta-analysis of randomised trials. Lancet. 2011;378(9793):771–84. doi: 10.1016/S0140-6736(11)60993-8. [DOI] [PMC free article] [PubMed] [Google Scholar]
- 3.Ahmad A, Sheikh S, Kale P, Krishnappa M, Rane RC, Ahmad I. First-in-human study evaluating safety and pharmacokinetics of endoxifen, a potent estrogen-receptor antagonist for breast cancer. J Clin Oncol. 2010;28. doi: 10.1200/jco.2010.28.15_suppl.3087. [DOI] [Google Scholar]
- 4.Peterson LM, Mankoff DA, Lawton T, Yagle K, Schubert EK, Stekhova S, et al. Quantitative imaging of estrogen receptor expres-sion in breast cancer with PET and 18F-fluoroestradiol. J Nucl Med. 2008;49(3):367–74. doi: 10.2967/jnumed.107.047506. [DOI] [PubMed] [Google Scholar]
- 5.Mortimer JE, Dehdashti F, Siegel BA, Trinkaus K, Katzenellenbogen JA, Welch MJ. Metabolic flare: indicator of hormone responsiveness in advanced breast cancer. J Clin Oncol. 2001;19(11):2797–803. [DOI] [PubMed] [Google Scholar]
- 6.Mosselman S, Polman J, Dijkema R. ER beta: identification and characterization of a novel human estrogen receptor. FEBS Lett. 1996;392(1):49–53. [DOI] [PubMed] [Google Scholar]
- 7.Honrna N, Horii R, Iwase T, Saji S, Younes M, Takubo K, et al. Clinical importance of estrogen receptor-beta evaluation in breast cancer patients treated with adjuvant tamoxifen therapy. J Clin Oncol. 2008;26(22):3727–34. doi: 10.1200/jco.2007.14.2968. [DOI] [PubMed] [Google Scholar]
- 8.Younes M, Honma N. Estrogen receptor beta. Arch Pathol Lab Med. 2011;135(1):63–6. doi: 10.1043/2010-0448-rar.l. [DOI] [PubMed] [Google Scholar]
- 9.van Kruchten M, de Vries EG, Brown M, de Vries EF, Glaudemans AW, Dierckx RA, et al. PET imaging of oestrogen receptors in patients with breast cancer. Lancet Oncol. 2013;14(11):e465–75. doi: 10.1016/s1470-2045(13)70292-4. [DOI] [PubMed] [Google Scholar]
- 10.Fowler AM, Clark AS, Katzenellenbogen JA, Linden HM, Dehdashti F. Imaging diagnostic and therapeutic targets: steroid receptors in breast cancer. J Nucl Med. 2016;57 Suppl 1:75s–80. doi: 10.2967/jnumed.115.157933. [DOI] [PMC free article] [PubMed] [Google Scholar]
- 11.Heidari P, Deng F, Esfahani SA, Leece AK, Shoup TM, Vasdev N, et al. Pharmacodynamic imaging guides dosing of a selective estrogen receptor degrader. Clin Cancer Res. 2015;21(6j:l340–7. doi: 10.1158/1078-0432.ccr-14-1178. [DOI] [PMC free article] [PubMed] [Google Scholar]
- 12.van Kruchten M, Hospers GA, Glaudemans AW, Hollema H, Arts HJ, Reyners AK. Positron emission tomography imaging of oestrogen receptor-expression in endometrial stromal sarcoma supports oestrogen receptor-targeted therapy: case report and review of the literature. Eur J Cancer (Oxford, England: 1990). 2013;49(18): 3850–5. doi: 10.1016/j.ejca.2013.08.005. [DOI] [PubMed] [Google Scholar]
- 13.Linden HM, Kurland BF, Peterson LM, Schubert EK, Gralow JR, Specht JM, et al. Fluoroestradiol positron emission tomography reveals differences in pharmacodynamics of aromatase inhibitors, tamoxifen, and fulvestrant in patients with metastatic breast cancer. Clin Cancer Res. 2011;17(14):4799–805. doi: 10.1158/1078-0432.ccr-10-3321. [DOI] [PMC free article] [PubMed] [Google Scholar]
- 14.Krause BJ, Souvatzoglou M, Herrmann K, Weber AW, Schuster T, Buck AK, et al. [11C]Choline as pharmacodynamic marker for therapy response assessment in a prostate cancer xenograft model. Eur J Nucl Med Mol Imaging. 2010;37(10):1861–8. doi: 10.1007/s00259-010-1493-2. [DOI] [PubMed] [Google Scholar]
- 15.Doran MG, Carnazza KE, Steckler JM, Spratt DE, Truillet C, Wongvipat J, et al. Applying (8)(9)Zr-transferrin to study the pharmacology of inhibitors to BET bromodomain containing proteins. Mol Pharm. 2016;13(2):683–8. doi: 10.1021/acs.molpharmaceut.5b00882. [DOI] [PMC free article] [PubMed] [Google Scholar]
- 16.Yoo J, Dence CS, Sharp TL, Katzenellenbogen JA, Welch MJ. Synthesis of an estrogen receptor beta-selective radioligand: 5[18F]fluoro-(2R,3S)-2,3-bis(4-hydroxyphenyl)pentanenitrile and comparison of in vivo distribution with 16alpha-[18F]fluoro-17beta-estradiol. J Med Chem. 2005;48(20):6366–78. doi: 10.1021/jm050121f. [DOI] [PubMed] [Google Scholar]
- 17.McGuire AH, Dehdashti F, Siegel BA, Lyss AP, Brodack JW, Mathias CJ, et al. Positron tomographic assessment of 16 alpha-[18F] fluoro-17 beta-estradiol uptake in metastatic breast carcinoma. J Nucl Med. 1991;32(8):1526–31. [PubMed] [Google Scholar]
- 18.Gemignani ML, Patil S, Seshan VE, Sampson M, Humm JL, Lewis JS, et al. Feasibility and predictability of perioperative PET and estrogen receptor ligand in patients with invasive breast cancer. J Nucl Med. 2013;54(10):1697–702. doi: 10.2967/jnumed.112.113373. [DOI] [PMC free article] [PubMed] [Google Scholar]
- 19.Sundararajan L, Linden HM, Link JM, Krohn KA, Mankoff DA. 18F-Fluoroestradiol. Semin Nucl Med. 2007;37(6):470–6. doi: 10.1053/j.semnuclmed.2007.08.003. [DOI] [PubMed] [Google Scholar]
- 20.Linden HM, Stekhova SA, Link JM, Gralow JR, Livingston RB, Ellis GK, et al. Quantitative fluoroestradiol positron emission tomography imaging predicts response to endocrine treatment in breast cancer. J Clin Oncol. 2006;24(18):2793–9. doi: 10.1200/jco.2005.04.3810. [DOI] [PubMed] [Google Scholar]
- 21.Yoshida Y, Kiyono Y, Tsujikawa T, Kurokawa T, Okazawa H, Kotsuji F. Additional value of 16alpha-[18F]fluoro-17betaoestradiol PET for differential diagnosis between uterine sarcoma and leiomyoma in patients with positive or equivocal findings on [18F]fluorodeoxyglucose PET. Eur J Nucl Med Mol Imaging. 2011;38(10):1824–31. doi: 10.1007/s00259-011-1851-8. [DOI] [PubMed] [Google Scholar]
- 22.Dixit M, Shi J, Wei L, Afari G, Bhattacharyya S. Synthesis of clinical-grade [(18)F]-fluoroestradiol as a surrogate PET biomarker for the evaluation of estrogen receptor-targeting therapeutic drug. Int J Mol Imaging. 2013;2013:278607. doi: 10.1155/2013/278607. [DOI] [PMC free article] [PubMed] [Google Scholar]
- 23.Shi J, Afari G, Bhattacharyya S. Rapid synthesis of [18F]fluoroestradiol: remarkable advantage of microwaving over conventional heating. J label Compd Radiopharm. 2014;57(14): 730–6. doi: 10.1002/jlcr.3248. [DOI] [PMC free article] [PubMed] [Google Scholar]
- 24.Hu Z, Wang W, Gualtieri EE, Hsieh YL, Karp JS, Matej M, et al. An LOR-based fully-3D PET image reconstruction using a blob-basis function. 2007 I.E. Nuclear Science Symposium Conference Record. 2007;M26–228:4415–18. http://ieeexplore.ieee.org/document/4437091/. Accessed 19 May 2016. [Google Scholar]
- 25.van Kruchten M, de Vries EG, Glaudemans AW, van Lanschot MC, van Faassen M, Kema IP, et al. Measuring residual estrogen recep-tor availability during fulvestrant therapy in patients with metastatic breast cancer. Cancer Discov. 2015;5(1):72–81. doi: 10.1158/21598290.cd-14-0697. [DOI] [PubMed] [Google Scholar]
- 26.Peterson LM, Kurland BF, Schubert EK, Link JM, Gadi VK, Specht JM, et al. A phase 2 study of 16α-[(18)F]-fluoro-17β-estradiol positron emission tomography (FES-PET) as a marker of hormone sensitivity in metastatic breast cancer (MBC). Mol Imaging Biol: MIB. 2014;16(3):431–40. doi: 10.1007/s11307-013-0699-7. [DOI] [PMC free article] [PubMed] [Google Scholar]
- 27.Yang Z, Sun Y, Zhang Y, Xue J, Wang M, Shi W, et al. Can fluorine18 fluoroestradiol positron emission tomography-computed tomography demonstrate the heterogeneity of breast cancer in vivo? Clin Breast Cancer. 2013; 13(5):359–63. doi: 10.1016/j.clbc.2013.02.012. [DOI] [PubMed] [Google Scholar]
- 28.van Kruchten M, de Vries EF, Arts HJ, Jager NM, Bongaerts AH, Glaudemans AW, et al. Assessment of estrogen receptor expression in epithelial ovarian cancer patients using 16alpha-18F-fluoro17beta-estradiol PET/CT. J Nucl Med. 2015;56(l);50–5. doi: 10.2967/jnumed.114.147579. [DOI] [PubMed] [Google Scholar]
- 29.Zhao Z, Yoshida Y, Kurokawa T, Kiyono Y, Mori T, Okazawa H. 18F-FES and 18F-FDG PET for differential diagnosis and quantitative evaluation of mesenchymal uterine tumors: correlation with immunohistochemical analysis. J Nucl Med. 2013;54(4):499–506. doi: 10.2967/jnumed.112.113472. [DOI] [PubMed] [Google Scholar]
- 30.van Kruchten M, Glaudemans AW, de Vries EF, Schroder CP, de Vries EG, Hospers GA. Positron emission tomography of tumour [(18)F]fluoroestradiol uptake in patients with acquired hormoneresistant metastatic breast cancer prior to oestradiol therapy. Eur J Nucl Med Mol Imaging. 2015;42( 11): 1674–81. doi: 10.1007/s00259-015-3107-5. [DOI] [PMC free article] [PubMed] [Google Scholar]
- 31.Zhang HY, Ke Q, Zhang Z, Zhang R, Fu J, Chen HJ, et al. Expression of beta-catenin and estrogen receptor in desmoid-type fibromatosis. Sichuan da Xue Xue Bao Yi Xue Ban = J Sichuan UnivMedSci Ed. 2010;41(1): 101–5. [PubMed] [Google Scholar]
- 32.Ishizuka M, Hatori M, Dohi O, Suzuki T, Miki Y, Tazawa C, et al. Expression profiles of sex steroid receptors in desmoid tumors. Tohoku J Exp Med. 2006;210(3): 189–98. [DOI] [PubMed] [Google Scholar]
- 33.Escobar C, Munker R, Thomas JO, Li BD, Burton GV. Update on desmoid tumors. Ann Oncol. 2012;23(3):562–9. doi: 10.1093/annonc/mdr386. [DOI] [PubMed] [Google Scholar]
- 34.Peterson LM, Kurland BF, Link JM, Schubert EK, Stekhova S, Linden HM, et al. Factors influencing the uptake of 18Ffluoroestradiol in patients with estrogen receptor positive breast cancer. Nucl Med Biol. 2011;38(7):969–78. doi: 10.1016/j.nucmedbio.2011.03.002. [DOI] [PMC free article] [PubMed] [Google Scholar]
- 35.Kim BH, Kim SJ, Kim K, Kim H, Kim SJ, Kim WJ, et al. High metabolic tumor volume and total lesion glycolysis are associated with lateral lymph node metastasis in patients with incidentally detected thyroid carcinoma. Ann Nucl Med. 2015;29(8):721–9. doi: 10.1007/s12149-015-0994-2. [DOI] [PMC free article] [PubMed] [Google Scholar]
- 36.Pak K, Cheon GJ, Nam HY, Kim SJ, Kang KW, Chung JK, et al. Prognostic value of metabolic tumor volume and total lesion gly-colysis in head and neck cancer: a systematic review and metaanalysis. J Nucl Med. 2014;55(6):884–90. doi: 10.2967/jnumed.113.133801. [DOI] [PubMed] [Google Scholar]