

Summary
Recent studies suggest that a key mechanism whereby the gut microbiome influences energy balance and glucose homeostasis is through the recruitment of brown and beige adipocytes; primary mediators of the adaptive thermogenic response. To test this, we assessed energy expenditure and glucose metabolism in two complimentary mouse models of gut microbial deficiency, which were exposed to a broad range of thermal and dietary stresses. Neither ablation of the gut microbiome, nor the substantial microbial perturbations induced by cold ambient temperatures, influenced energy expenditure during cold exposure or high-fat feeding. Nevertheless, we demonstrated a critical role for gut microbial metabolism in maintaining euglycemia through the production of amino acid metabolites that optimized hepatic TCA cycle fluxes in support of gluconeogenesis. These results distinguish the dispensability of the gut microbiome for the regulation of energy expenditure from its critical contribution to the maintenance of glucose homeostasis.
Keywords: Gut microbiome, energy expenditure, adaptive thermogenesis, browning, brown adipose tissue, germ-free, commensal-depleted, gluconeogenesis, high fat diet, cold stress
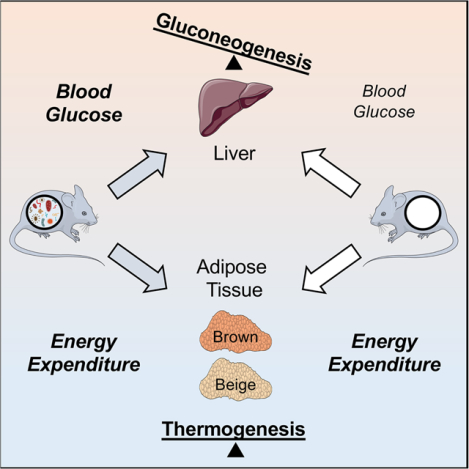
Graphical Abstract
eTOC blurb
The gut microbiome contributes to metabolic health and disease in the host. Krisko and colleagues demonstrate that the gut microbiome supports hepatic gluconeogenesis to maintain euglycemia, but that this is independent from the regulation of energy expenditure and the adaptive thermogenic response to cold or high-fat feeding.
Introduction
The abundance and activity of thermogenic adipose tissues are associated with reduced adiposity and improvements in whole-body glucose homeostasis in both mice and humans (Betz and Enerback, 2015, Kajimura et al., 2015, Chondronikola et al., 2014). Therefore, leveraging thermogenesis for the management of obesity-related disorders represents a therapeutic opportunity. In mice, non-shivering thermogenesis is a coordinated physiological process whereby brown adipose tissue (BAT) and beige adipocytes within white adipose tissues (WAT) generate heat through uncoupling protein-1 (Ucp-1)-mediated dissociation of oxidative phosphorylation from ATP synthesis (Kajimura et al., 2015), as well as other less well defined pathways (Kazak et al., 2015, Ukropec et al., 2006, Ikeda et al., 2017). Both cold ambient temperatures (Seale, 2015) and over-nutrition (von Essen et al., 2017, Kazak et al., 2017) can elicit a thermogenic response. Adaptive thermogenesis occurs under conditions of cold challenge, in which heat is generated in order to maintain core body temperature and obviate shivering, whereas diet-induced thermogenesis is triggered by feeding (U Din et al., 2018, Li et al., 2018, von Essen et al., 2017, Stock, 1999).
Alterations in the gut microbiota appear to contribute to obesity and insulin resistance (Ridaura et al., 2013, Vrieze et al., 2012, Maruvada et al., 2017). In mice, the composition of the gut microbiome is strongly influenced by both diet and ambient temperature (Chevalier et al., 2015, Zietak et al., 2016, Worthmann et al., 2017, Li et al., 2019, Ussar et al., 2016). Gut microbiota conditioned by cold ambient temperatures support increased nutrient uptake to match increased demand (Chevalier et al., 2015). Mice transplanted with cold-conditioned microbiomes exhibited reduced adiposity and improved glucose homeostasis when fed chow (Chevalier et al., 2015) or a high-fat diet (HFD) (Zietak et al., 2016). These metabolic improvements have been ascribed to increases in adaptive thermogenesis and energy expenditure, yet energy expenditure was not directly assessed. As a result, whether improved glucose homeostasis is attributable to activation of thermogenic tissue by changes in gut microbial compositions (Suarez-Zamorano et al., 2015, Worthmann et al., 2017, Li et al., 2017, Somm et al., 2017) remains unresolved. The current study was designed to quantify the role of the gut microbiome in the regulation of thermogenic adipose tissues and to define its relationship to glucose homeostasis.
Results
The gut microbiome is dispensable for both cold- and diet-induced thermogenesis
To assess the contribution of the gut microbiome to the regulation of energy homeostasis, we quantified whole-body energy expenditure in commensal depleted (CD) and germ-free (GF) mice as complementary models of gut microbial deficiency. In CD mice, minimal fecal bacteria (Figure S1A) or fungi (Figure S1B) indicated effective commensal depletion by antibiotics. In both models, the deficiency of a gut microbiome resulted in characteristic changes in intestinal anatomy (Al-Asmakh and Zadjali, 2015, Savage and Dubos, 1968), including markedly dilated ceca filled with watery stool (Figure S1C) and elongated small (Figure S1D) and large (Figure S1E) intestines. The intestinal contents of CD and GF mice were 4–8 fold higher than controls, with the most pronounced effects observed in mice housed at cold ambient temperatures. As a result, intestinal contents accounted for 15–27 % of the total body mass of chow-fed microbiome-deficient mice, compared to approximately 2–5 % in control mice (Figure S1F and Table S1). Because the enlarged cecum interfered with the measurement of body composition using NMR, we performed this assessment postmortem after removing the intestinal contents. Whereas reduced adiposity has been described in microbiome-deficient mice (Backhed et al., 2004, Suarez-Zamorano et al., 2015), our analysis revealed reductions in both lean and fat mass (Figure S1G and Table S1), possibly owing to reduced efficiency of nutrient absorption (Figure S1H). Furthermore, without accounting for the dilated cecum and intestinal contents, values of energy expenditure were underestimated in microbiome-deficient mice, as demonstrated in CD mice following cecectomy compared to sham surgery (Figure S1I). To account for this metabolically inactive mass, we adjusted energy expenditure measurements for total body mass after subtracting intestinal contents, henceforth referred to as “corrected body mass” (Figure S1J and STAR methods).
Using indirect calorimetry, we first determined the influence of the gut microbiome on energy expenditure in mice that were acclimated to a thermoneutral ambient temperature of 30 °C or cold ambient temperatures of 15 °C and 4 °C for 4 w (Lim et al., 2012). As was observed at 30 °C, commensal depletion had no effect on energy exp enditure with increasing cold stress (Figure 1A). We also observed this finding in GF animals acclimated to 4 °C (Figure 1A), despite decreases in the respiratory exchange ratio (RER) values during the dark (active) phase, possibly secondary to food intake (Figure S1K and S1L). Consistent with previous reports (Kluger et al., 1990, Chevalier et al., 2015), CD and GF mice defended lower core body temperatures (Figure S1M and Table S1). Whereas this has been attributed to suppression of thermogenesis in microbiome-deficient mice (Li et al., 2019), instead we found higher resting metabolic rates in CD mice at 4 °C, apparently comp ensating for accelerated rates of heat loss indicated by the slopes in the Scholander plot (kcal/h/°C; CD, −0.024; control, −0.019) (Figure 1B). Next, we assessed energy expenditure in mice during a 3 d adaptation to the cold. CD, GF and control mice each exhibited linear increases in energy expenditure in response to 3 d exposures to sequentially decreasing ambient temperatures (Figure 1C). We observed no differences in energy expenditure among these groups, and the slopes of the lines, which reflect thermogenic adaptation (Kang et al., 2013), were similar. Resting metabolic rates at thermoneutrality (RMRt) (Figure 1D) were similarly unaffected by the absence of the gut microbiome. Finally, we examined the thermogenic response to an acute cold exposure by assessing the increase in energy expenditure during a 4 h period after mice were relocated from metabolic cages at 30 °C to cages that were pre-equ ilibrated to 10 °C. Compared to their respective controls, CD and GF mice each displayed similar increases in energy expenditure (Figure 1E).
Figure 1: The gut microbiome is dispensable for both cold- and diet-induced thermogenesis.
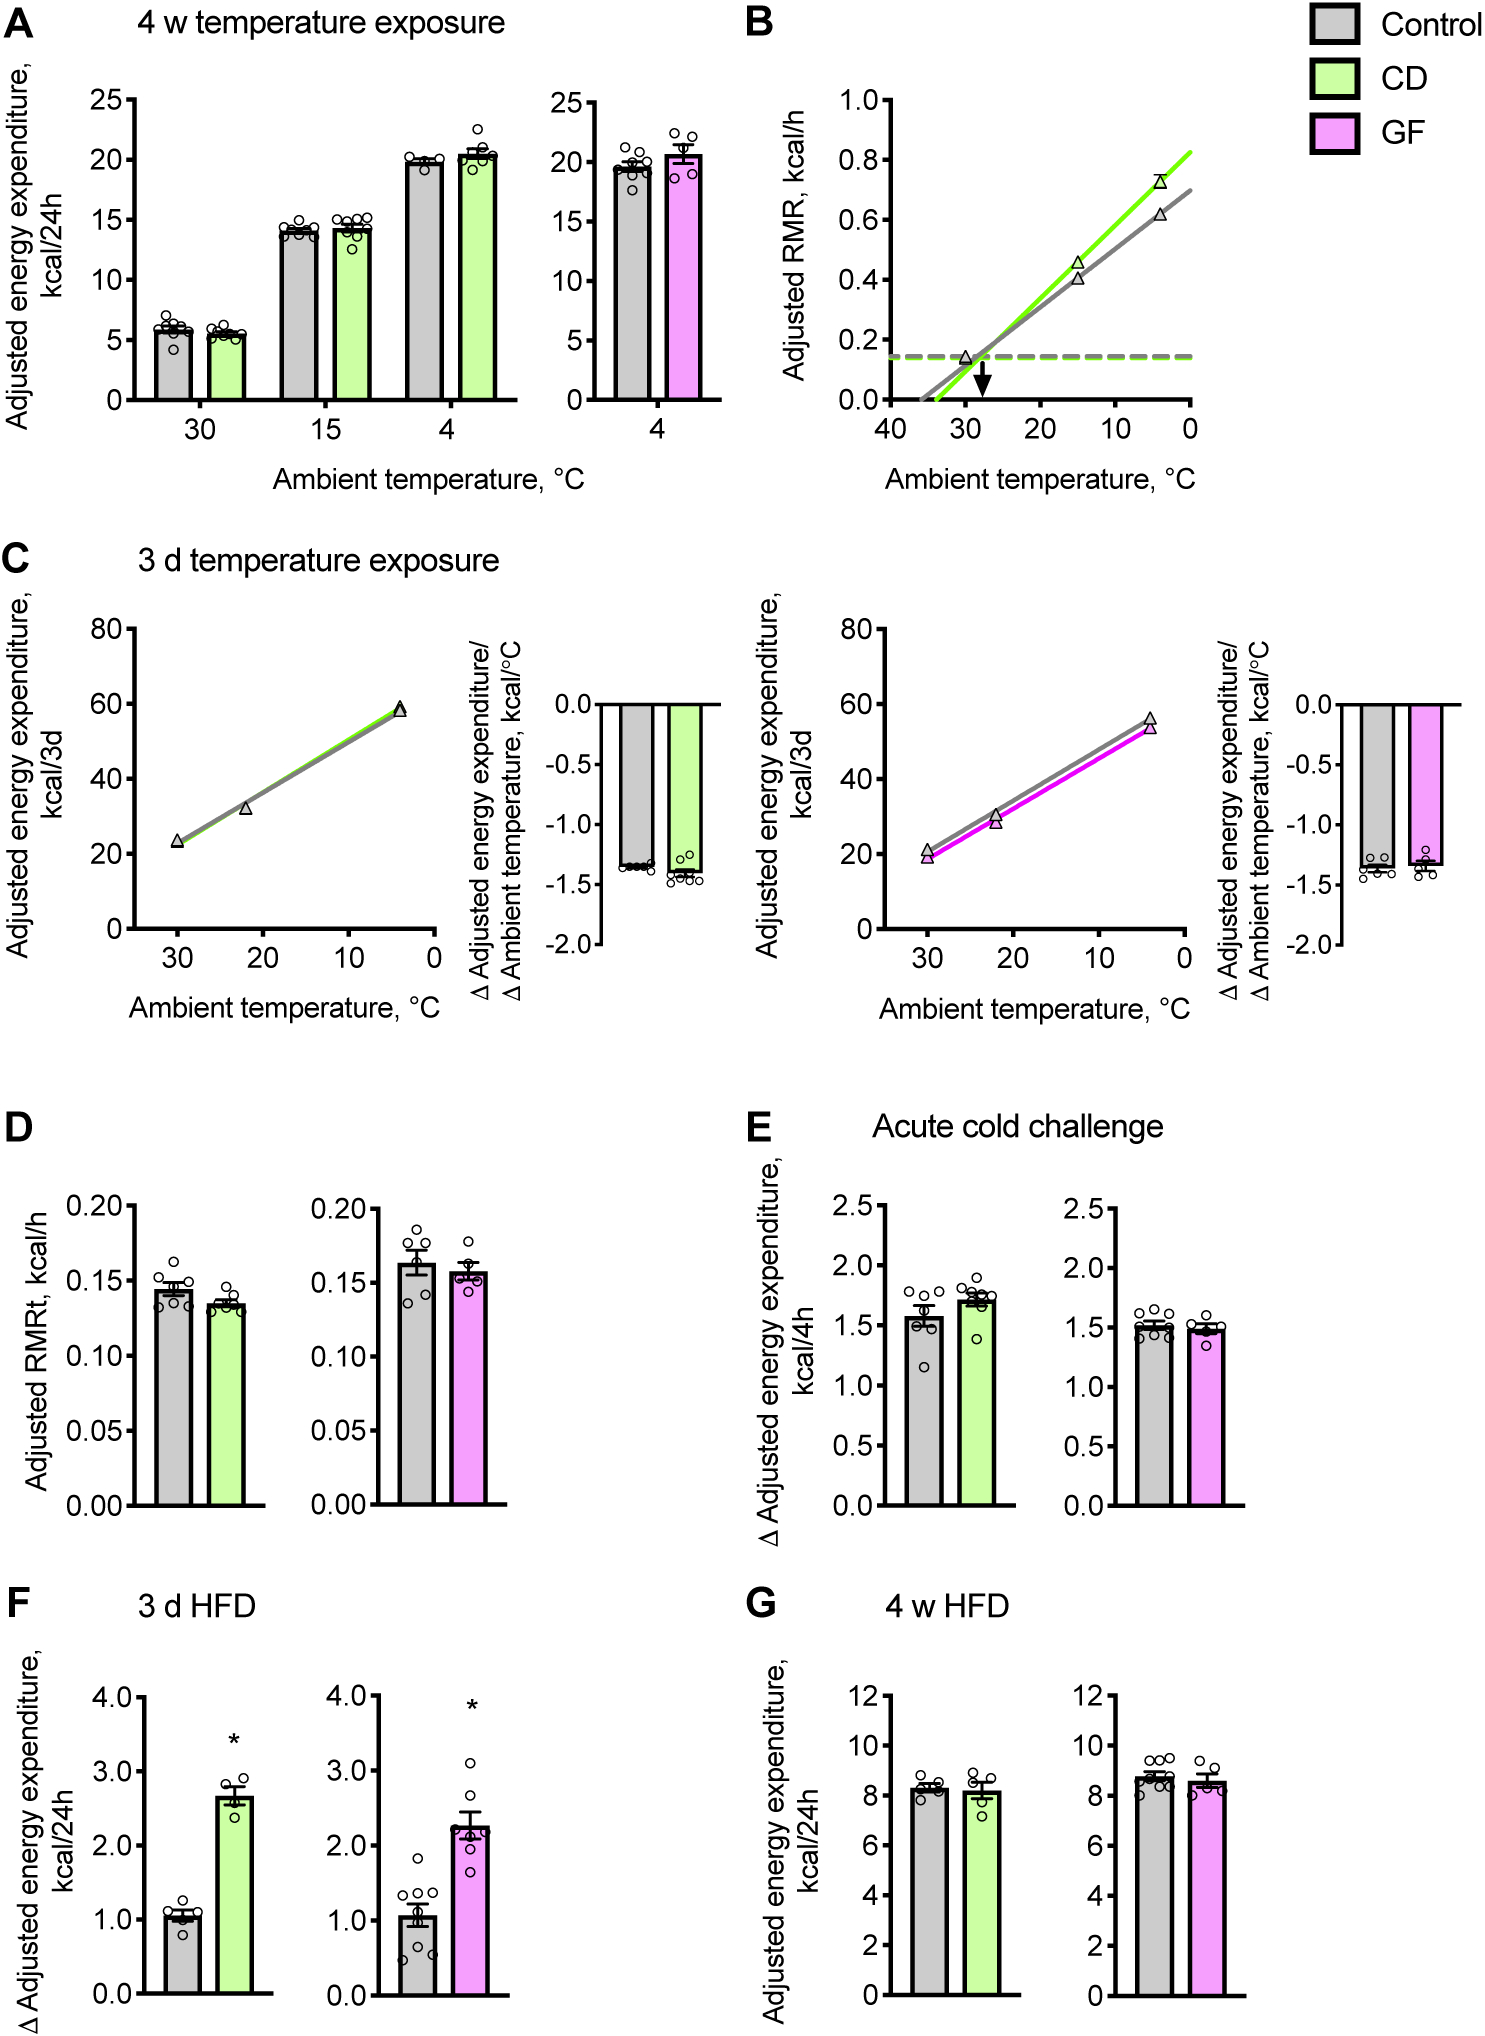
(A and B) Energy expenditure was determined in chow diet-fed mice acclimated to ambient temperatures for 4 w. (A) Cumulative values of energy expenditure over 24 h. (B) Scholander plot: Slopes represent rates of heat loss and extrapolate to the defended core body temperature (x-axis intercept). Horizontal dashed lines represent the RMRt, and the point at which the lines intersect, extrapolated to the x-axis (arrow), estimates the lower critical temperatures, below which mice rely on thermogenesis (n = 5–8).
(C) Cumulative values of energy expenditure determined in mice exposed to decreasing ambient temperatures of 30, 22 and 4 °C, every 3 d. Adjacent barplots display slopes of linear regression lines, which represent adaptive responses of energy expenditure to ambient temperature (n = 5–8).
(D) RMRt was determined in mice acclimated to 30 °C (n = 5–8).
(E) Change in (Δ) energy expenditure of mice in response to acute cold exposure (10 °C) (n = 5–8).
(F and G) Cumulative energy expenditure values measured over 24 h for mice housed at 30 °C and fed a palm oil-based HFD for (F) 3 d or (G) 4 w (n = 4–8).
Values of energy expenditure were adjusted by ANCOVA for corrected body mass. Circles represent individual mice; Barplots and triangles represent means ± s.e.m. Statistical analyses were conducted using Student’s t-test; *P < 0.05 control vs. CD or GF mice. See also Figure S1 and Table S1.
Food consumption also promotes energy expenditure. This is the result of both the energy required to digest food and Ucp-1-dependent thermogenesis (von Essen et al., 2017, Li et al., 2018, Rothwell and Stock, 1979). When mice housed at 30 °C were switched from chow to HFD, energy expenditure increased more in CD and GF mice than in controls (Figure 1F), and there was a strong positive correlation between excess calories consumed and increases in energy expenditure (Figure S1N). Higher energy expenditures in microbiome-deficient mice were therefore attributable to excess calories consumed (Figure S1O). Additionally, when mice were continuously fed a HFD for 4 w, we observed no microbiome-dependent differences in daily energy expenditure (Figure 1G), corrected body mass (Figure S1P) or daily food intake (Figure S1Q).
The gut microbiome is not required for recruitment and activation of thermogenic tissues
Although we did not observe evidence for regulation of energy expenditure by the gut microbiome, others have reported that gut microbiome depletion promotes (Suarez-Zamorano et al., 2015) or impairs (Li et al., 2019) the browning of WAT. We conducted a molecular and histologic analysis to examine the effects of microbiome-deficiency on inguinal WAT (IWAT), a peripheral fat depot that is susceptible to browning. Under the current experimental conditions, Ucp-1 protein abundance in IWAT was very low at 22 °C, and we did not detect differences among CD, GF and control mice (Figure 2A), even when Ucp-1 abundance was normalized to the whole adipose tissue (data not shown). Whereas we observed mRNA levels of the browning-related genes Ucp1 and Dio2 to be higher in the IWAT of GF mice compared to controls, this was not observed in CD mice, and there were no differences in other transcriptional regulators and differentiation markers of browning, including Cidea, Prdm16, Ppargc1a, Ppara, Pparg or Cd137, in the IWAT of CD or GF mice (Figure S2A).
Figure 2: The gut microbiome is not required for recruitment and activation of thermogenic tissues.
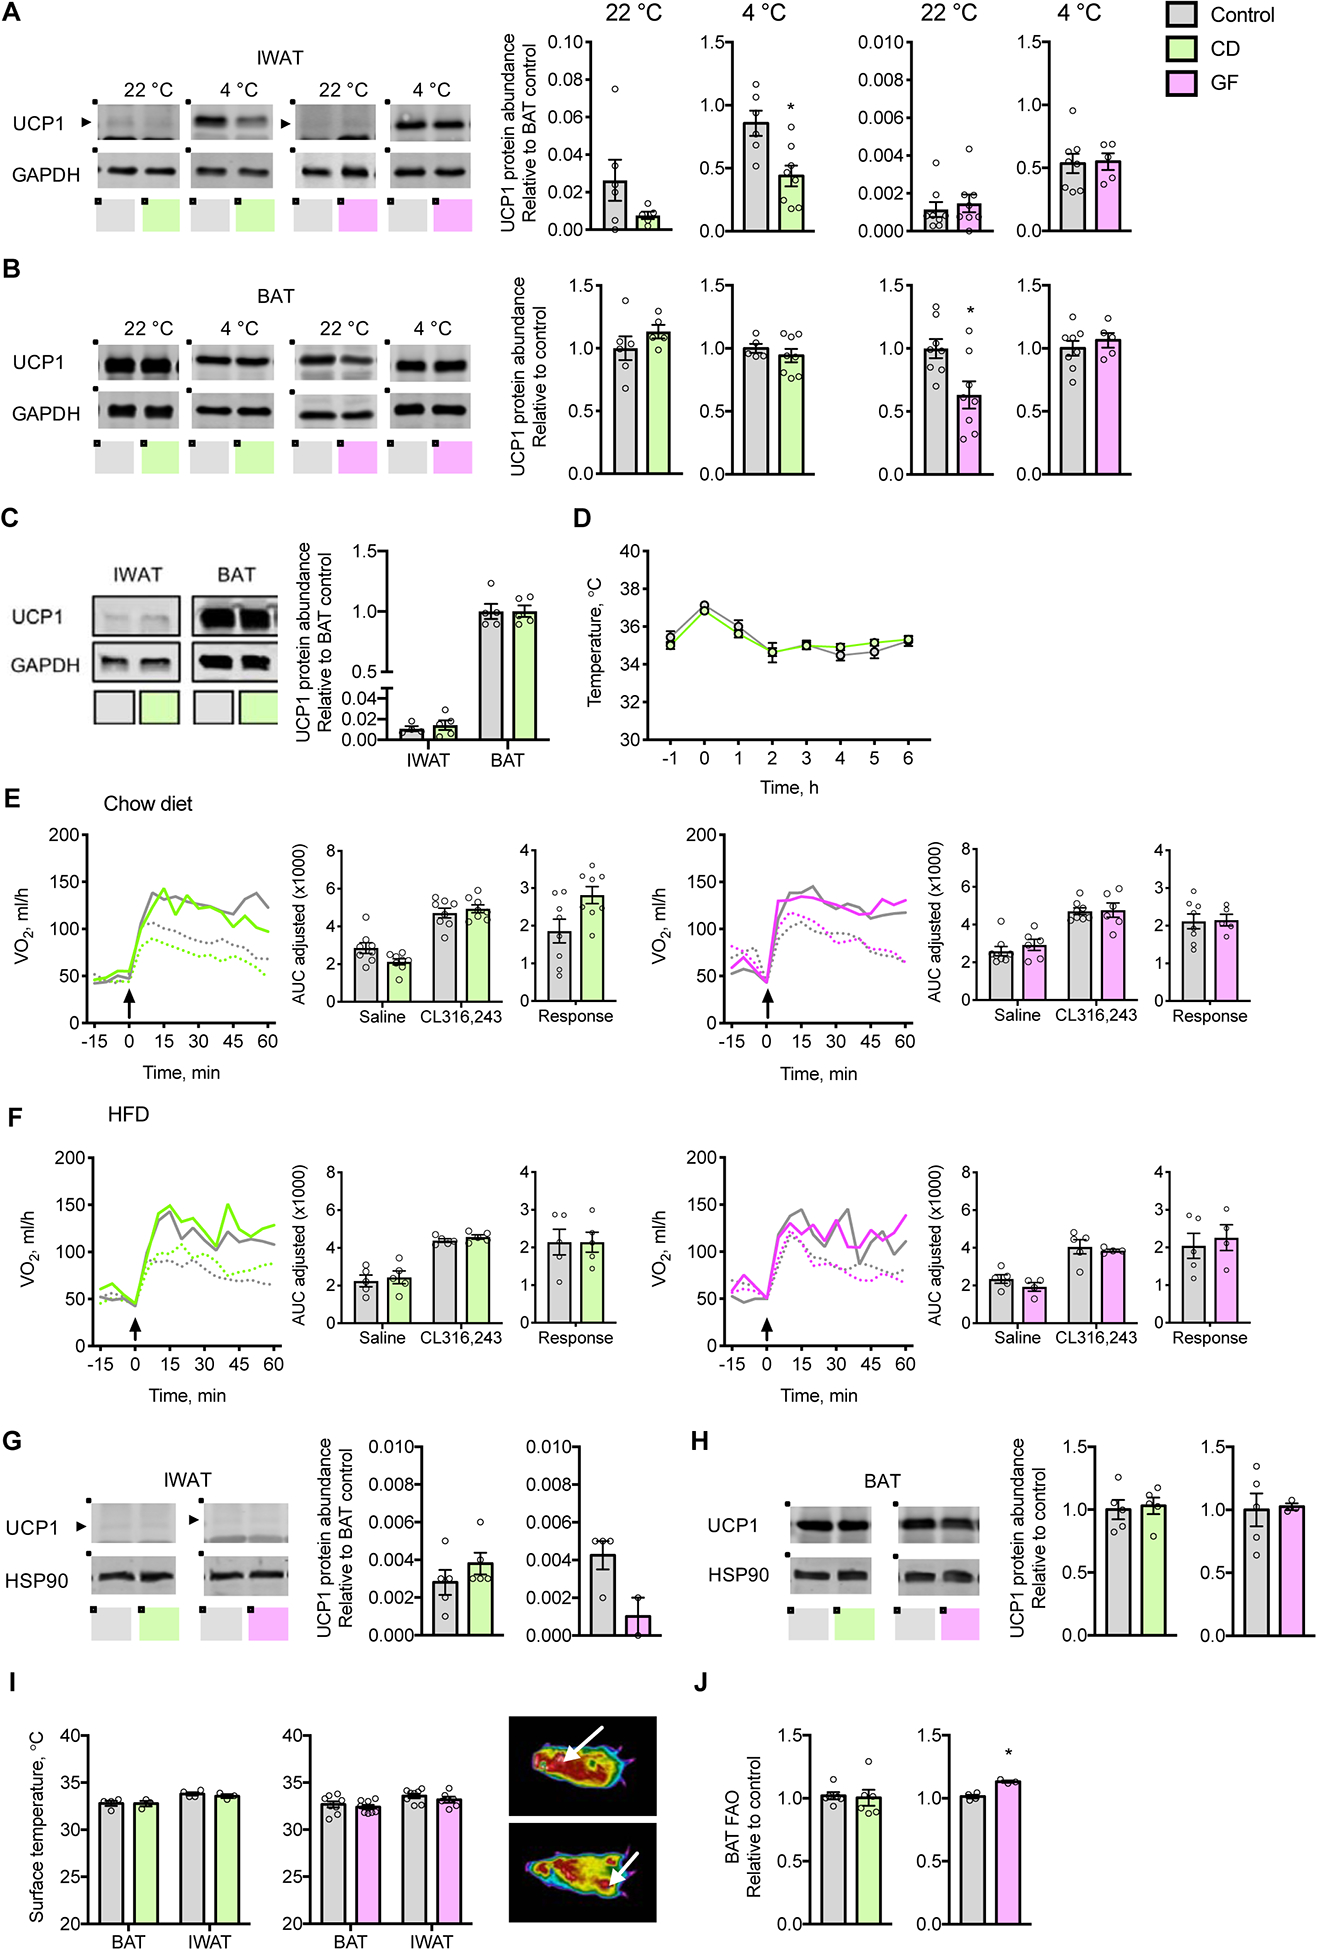
(A and B) Representative immunoblots and quantification of UCP1 protein expression in (A) IWAT and (B) BAT of chow fed CD mice treated for 40 d with antibiotics and GF mice, acclimated to 22 °C or 4 °C (n = 5–8).
(C) Representative immunoblots and quantification of UCP1 protein expression in IWAT and BAT of CD mice exposed to 4 °C for 48 h (n = 5).
(D) Core body temperatures prior to and during acute cold challenge at 4 °C (n = 5).
(E and F) VO2 values in response to subcutaneous injection (arrow) of CL316,243 (solid line) or saline (dotted line) in (E) mice fed chow and acclimated to 22 °C and (F) mice fed palm oil-based HFD for 4 w and acclimated to 30 °C; Inset barplots display the AUC for saline and CL316,243 as well as the response, AUC of saline subtracted from CL316,243 (n = 4–8).
(G and H) Representative immunoblots and quantification of UCP1 protein expression in (G) IWAT and (H) BAT of CD and GF mice acclimated to 30 °C and fed a palm oil-based HFD for 4 w (n = 3–6).
(I) Representative image and surface temperatures of BAT and IWAT in mice acclimated to 22 °C. Arrow indicates BAT (upper panel) and IWAT (lower panel) (n = 3–6).
(J) Rates of FAO in BAT (n = 4–6).
AUC values were adjusted by ANCOVA for corrected body mass. Circles represent individual mice; Barplots represent means ± s.e.m; Solid and dashed lines represent means. Statistical analyses were conducted using Student’s t-test or 2-way ANOVA with repeated measures where appropriate; *P < 0.05 control vs. CD or GF mice. See also Figure S2.
Following acclimation to 4 °C, which promotes brown ing (Bartelt and Heeren, 2014), Ucp-1 protein levels in IWAT became comparable to BAT. Whereas Ucp-1 protein abundance in IWAT was lower in CD mice compared to respective controls, levels were similar between GF mice and controls (Figure 2A). Ucp-1 gene expression was not altered in the IWAT of CD or GF mice housed at 4 °C (Figure S2B). The mRNA expression levels of Cidea, Dio2 and Pparg were higher in GF mice, but we observed no corresponding changes in CD mice. Because we considered only those effects observed in both CD and GF mice as microbiome-dependent alterations, we did not observe microbiome-dependent changes in IWAT in mice acclimated to either 22 or 4°C.
Cold-adapted microbiota have also been linked to thermogenesis in BAT (Zietak et al., 2016), and depletion of the gut microbiome has been reported to impair BAT recruitment (Li et al., 2019). However, similar to IWAT, we observed no consistent microbiome-dependent alterations in BAT recruitment. Although the abundance of Ucp-1 protein was reduced in the BAT of GF mice acclimated to 22 °C, levels were unchanged in CD mice compared to respective controls (Figure 2B). Whereas Ucp-1 gene expression was lower in the BAT of CD mice housed at 22 °C, we did not observe this at 4 °C, nor were corre sponding changes observed in GF mice at either temperature (Figure S2C and S2D). Overall, we found no consistent microbiome-dependent changes in the mRNA levels of BAT thermogenic genes at either 22 °C or 4 °C.
To investigate whether the gut microbiome might influence the early thermogenic adaptation to cold, we assessed IWAT and BAT in CD and control mice following exposure to 4 °C for 48 h (Li et al., 2019). We observed similar Ucp-1 protein levels among CD compared to control mice in both IWAT and BAT (Figure 2C). Whereas mRNA levels of Dio2 were higher in IWAT and BAT of CD mice, levels of Cidea, Prdm16 and Ppara were lower in BAT (Figure S2E and S2F). We observed no microbiome-dependent differences in IWAT and BAT tissue morphology in mice housed at 22 °C or following 48 h at 4 °C (Figure S2G and S2H).
The absence of molecular evidence for microbiome-dependent browning of WAT or recruitment of BAT was supported by functional assessments. During a 6 h cold challenge (4 °C), control and CD mice both similarly maintained their core body temperatures (Figure 2D). The response of VO2 to β3 pharmacologic stimulation using CL316,243 was unaffected by the gut microbiome (Figure 2E). The same was true for HFD-fed mice housed at 30 °C (Figure 2F), in which Ucp-1 protein and mRNA levels of thermogenic genes in IWAT and BAT, as well as tissue histology, similarly demonstrated no systematic microbiome-dependent variations (Figure 2G, 2H and S2I–K). Moreover, we did not detect differences in radiated heat in BAT and IWAT (Figure 2I). Finally, in excised BAT, rates of fatty acid oxidation (FAO) did not differ in CD mice and were minimally elevated in GF mice (Figure 2J), and we did not observe differences in BAT triglyceride concentrations (Figure S2L).
Temperature-conditioned gut microbiota do not influence cold- or diet-induced thermogenesis
Fecal microbial transplantation (FMT) of cold-conditioned gut microbiota has been reported to promote browning of WAT and improve insulin sensitivity (Chevalier et al., 2015) and to increase BAT thermogenesis, therefore protecting mice from diet-induced obesity and glucose intolerance (Worthmann et al., 2017, Zietak et al., 2016). We evaluated the influence of ambient temperature on the composition of the gut microbiome, as well as the capacity of temperature-conditioned gut microbiota to regulate energy expenditure following FMT. Consistent with prior reports (Chevalier et al., 2015, Zietak et al., 2016), we observed that fecal microbiomes of donor mice were altered in response to ambient temperature (Figure S3A and Table S2). In donor mice acclimated to 4 °C for 4 w, this was predominantly associated with a higher relative abundance of the Firmicute phylum and corresponding lower relative abundance of Bacteroidetes and Verrucomicrobia (Figure S3B). Metabolically-impactful taxa, including Erysipelotrichaceae, Lachnospiraceae, Akkermansia muciniphila and Lactobacillus were also altered in a pattern similar to previous reports (Table S2). Following microbial transplantation, gut microbiomes of recipient mice post-FMT were distinct from pre-FMT microbiomes, and closely approximated their temperature-conditioned donors (Figure 3A and S3C). Moreover, fecal microbiota of recipient mice post-FMT exhibited differential clustering by temperature (Figure 3B). Notwithstanding these marked temperature-dependent microbial shifts, we observed no differences in energy expenditure of recipient mice (Figure 3C) or in weight gain, adiposity or core body temperature (Figure 3D and Table S1). Moreover, in response to acute cold exposure, each group exhibited similar increases in energy expenditure (Figure 3E).
Figure 3: Temperature-conditioned gut microbiota do not influence cold- or diet-induced thermogenesis.
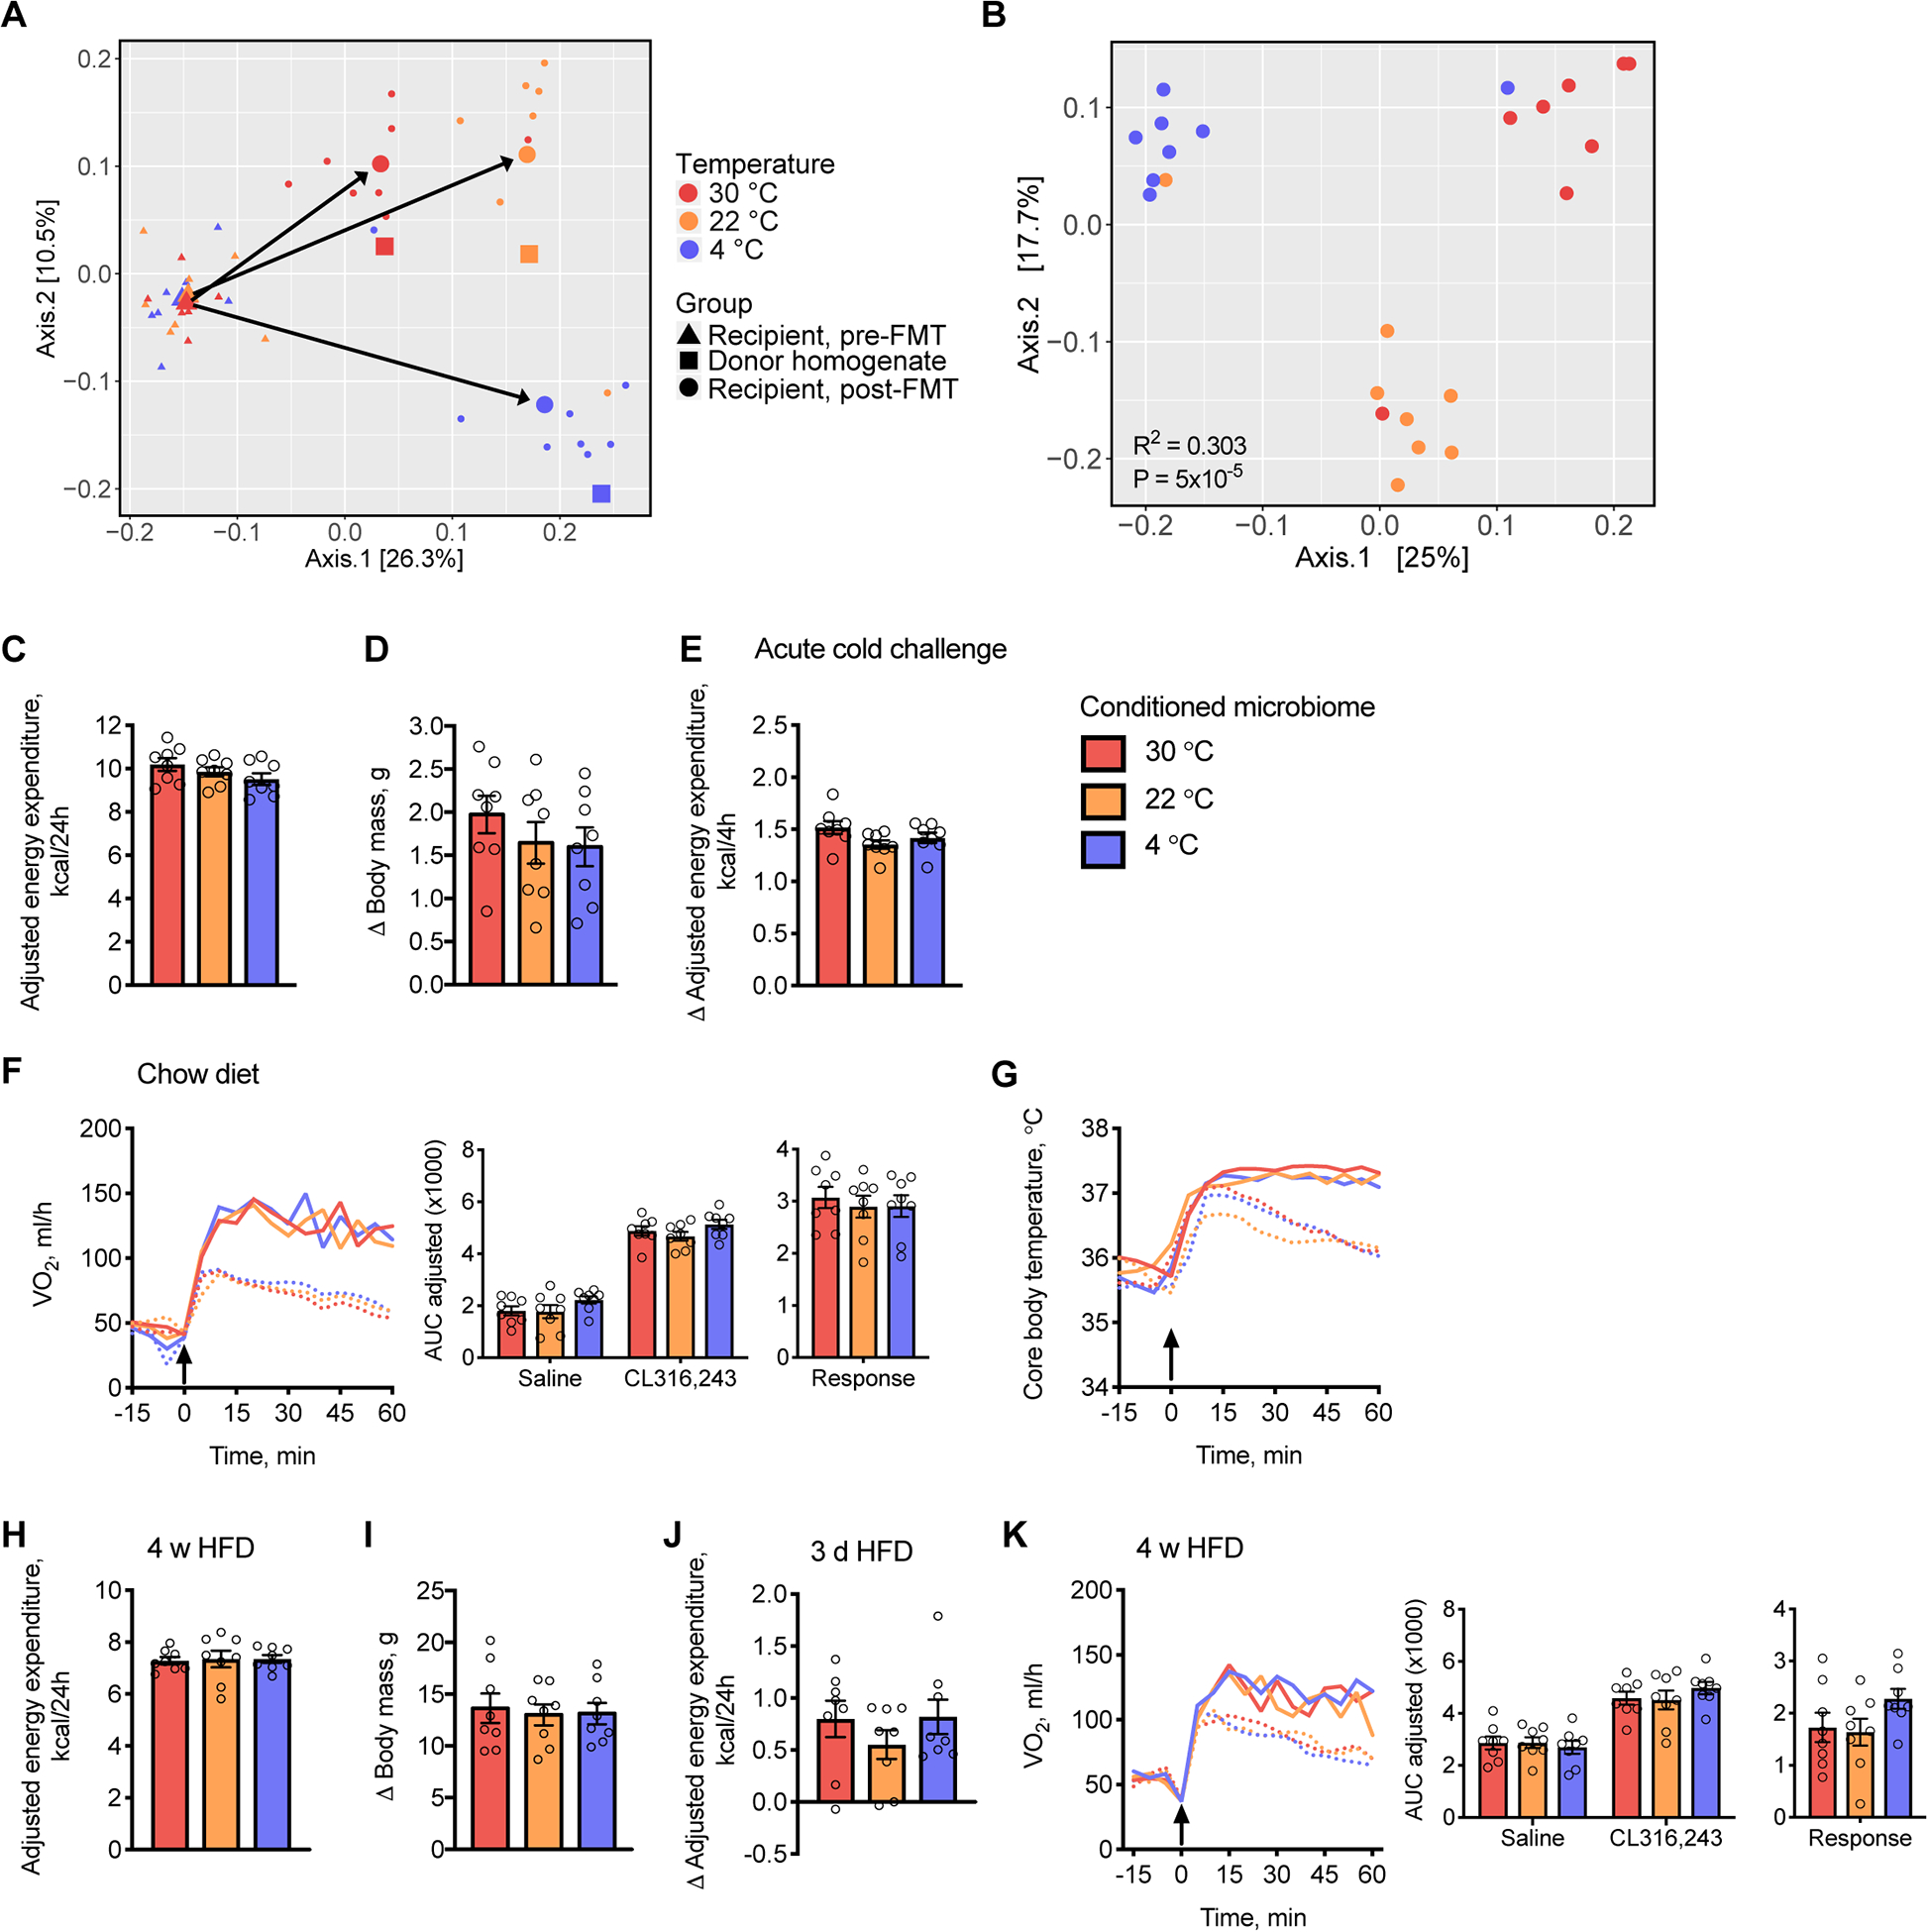
(A-G) Fecal and cecal contents from donor mice acclimated to 30, 22 or 4 °C for 4 w were transplanted into recipient mice housed at 22 °C and fed a chow diet (n = 7–8).
(A) Principal coordinates analysis (PCoA) plots based on UniFrac distance of the combined fecal and cecal temperature-conditioned donor homogenate microbiota used for transplantation (squares) as well as fecal microbiota from individual recipient mice pre- (triangles) and post- (circles) FMT. Large triangles and circles represent the centroid of each group with arrows depicting the directions of change.
(B) PCoA plots based on UniFrac distance of fecal microbiota from individual recipient mice post-FMT.
(C) Cumulative values of energy expenditure over 24 h determined in recipient mice 2 w post-FMT.
(D) Change in (Δ) body weight of mice 4 w post-FMT, compared to pre-FMT.
(E) Change in energy expenditure in response to acute cold exposure (10°C).
(F and G) VO2 values (F) and core body temperatures (G) in recipient mice in response to subcutaneous injections (arrow) of CL316,243 (solid line) or saline (dotted line); Inset barplots display the AUC for saline and CL316,243 as well as the response, as defined by AUC of saline subtracted from CL316,243.
(H-K) Fecal and cecal contents from acclimated donor mice were transplanted into recipient mice housed at 30 °C and fed a lard-based HFD (n = 7–8).
(H) Cumulative values of energy expenditure measured over 24 h.
(I) Change in body weight of mice 4 w post-FMT.
(J) Change in daily energy expenditure in response to 3 d HFD feeding compared to chow.
(K) VO2 values in post-FMT mice in response to subcutaneous injections (arrow) of CL316,243 (solid line) or saline (dotted line); Inset barplots display the AUC for saline and CL316,243 as well as the response, as defined by AUC of saline subtracted from CL316,243.
AUC values were adjusted by ANCOVA for body mass. Circles represent individual mice; Barplots represent means ± s.e.m; Dashed and solid lines indicate means. Statistical analyses were conducted using (B) PERMANOVA, (C-K) 1-way ANOVA or 2-way ANOVA with repeated measures as appropriate. See also Figure S3 and Tables S1 and S2.
We further interrogated functional thermogenic capacity by quantifying the response of VO2 (Figure 3F) and core body temperature (Figure 3G) to β3 pharmacologic stimulation, but observed that neither was affected by temperature-conditioned gut microbiota. In keeping with these findings, the protein abundance of Ucp-1 and mRNA expression of thermogenic genes were unchanged in IWAT and BAT (Figure S3D–G). When recipient mice were housed at 30 °C and fed a HFD for 4 w, we also observed no differences in energy expenditure (Figure 3H), body weight gain (Figure 3I), adiposity or core body temperature (Table S1). Elevations in energy expenditure in response to acute HFD feeding were similarly unaffected (Figure 3J). Finally, we detected no differences in thermogenic capacity in recipient mice housed at 30 °C (Figure 3K).
In laboratory animal husbandry, acidification is a common method of water decontamination. However, water acidification can influence the gut microbiota and host disease penetrance (Bidot et al., 2018, Wolf et al., 2014). Under the current experimental conditions, water acidification did not influence body composition or energy expenditure, nor did it result in statistically significant alterations in any molecular markers of thermogenesis in BAT and IWAT, when compared to mice drinking water at neutral pH (Figure S3H–S3L).
The gut microbiome promotes hepatic gluconeogenesis
In the absence of changes in energy expenditure, we nonetheless consistently observed lower blood glucose concentrations in CD and GF mice under both fed and fasting conditions (Figure 4A). Whereas previous studies attributed this lowering of blood glucose concentrations to enhanced insulin sensitivity (Backhed et al., 2004) as a consequence of browning of white adipose tissue (Suarez-Zamorano et al., 2015), our findings suggest instead a direct regulatory effect of the gut microbiome on glucose homeostasis. We found that CD mice exhibited no differences in tolerance to glucose (Figure 4B) or insulin sensitivity (Figure 4C). We also observed no changes in insulin-stimulated phosphorylation of Akt or glycogen synthase kinase 3 beta (GSK3β) in the liver, gonadal WAT (GWAT) or skeletal muscle (Figure S4A). However, in both CD and GF mice we noted blunted gluconeogenic responses to intraperitoneal (IP) pyruvate administration (Figure 4D), and we noted the same in CD mice following oral administration of pyruvate (Figure S4B). Transplantation of gut microbiota, irrespective of temperature conditioning, was sufficient to correct the gluconeogenic deficit (Figure S4B), confirming that the microbiome per se was responsible for regulating hepatic gluconeogenesis. Fasting blood glucose concentrations were also reduced in HFD-fed CD mice (Figure 4E), in which we detected no differences in tolerance to glucose (Figure 4F) or insulin (Figure 4G), but did detect blunted responses to pyruvate, which were also restored following transplantation with temperature-conditioned gut microbiota (Figure 4H). These reductions in pyruvate-stimulated hepatic gluconeogenesis in CD and GF mice occurred in the absence of downregulation of the key gluconeogenic enzymes phosphoenolpyruvate carboxykinase (PEPCK) and glucose 6-phosphatase (G6Pase) (Figures S4C and S4D).
Figure 4: The gut microbiome promotes hepatic gluconeogenesis.
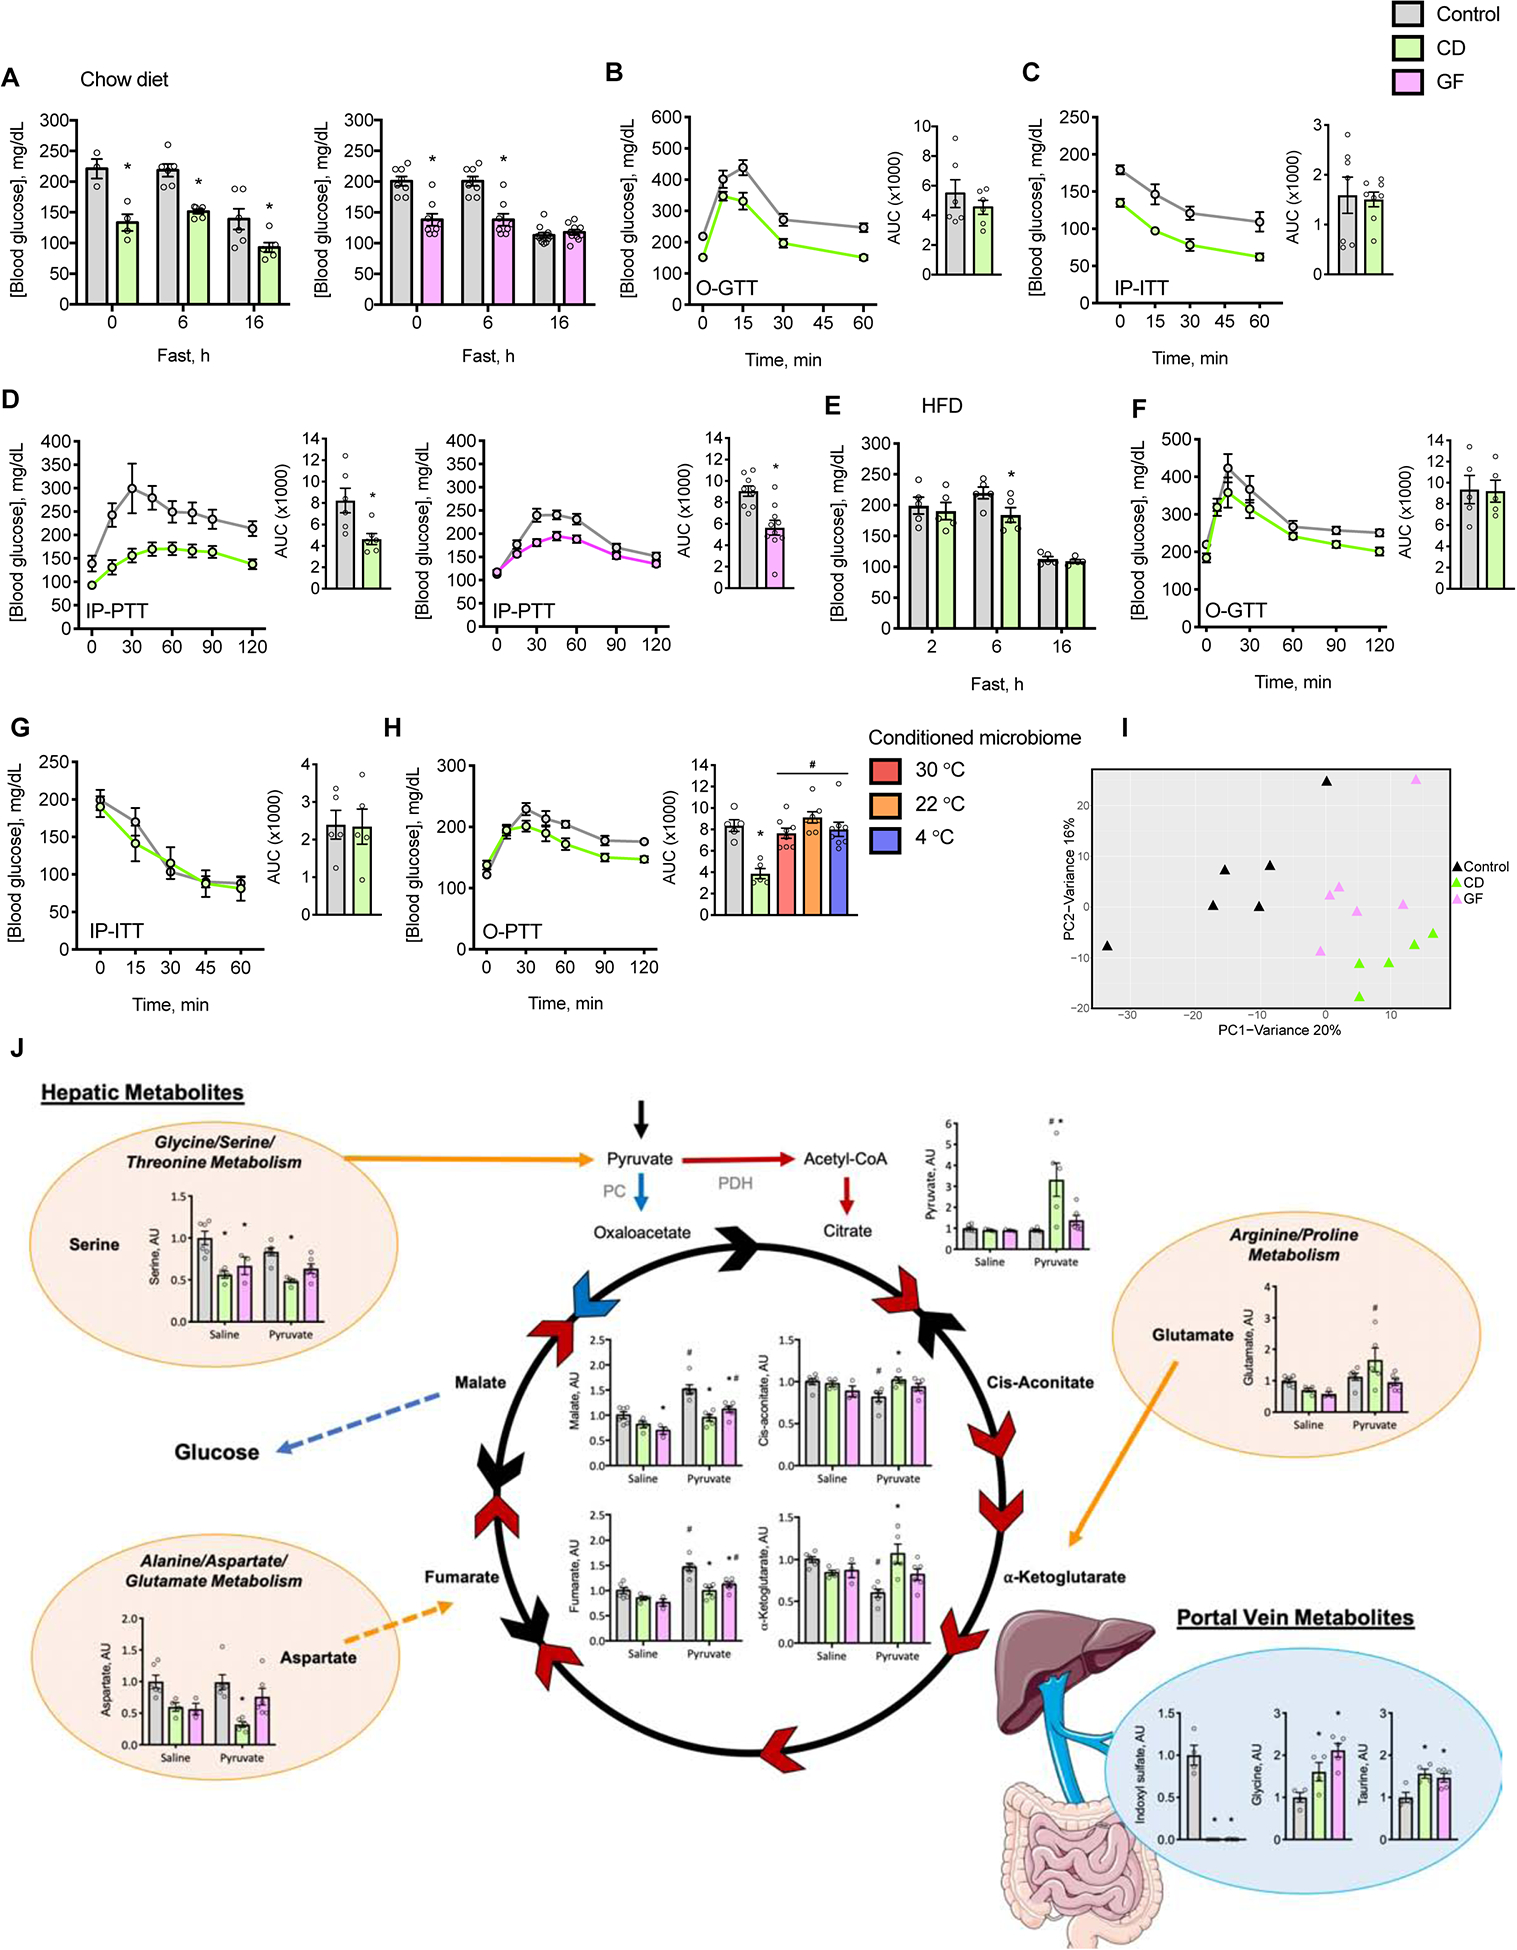
(A-D) Mice were fed chow diet and housed at 22 °C. (A) Measurements of fed and fasting blood glucose concentrations. Oral (O) or IP tolerance tests to (B) glucose (O-GTT), (C) insulin (IP-ITT) and (D) pyruvate (IP-PTT). Inset barplots provide AUC value (n = 4–8).
(E-H) Mice were fed palm oil-based HFD and housed at 30 °C. (E) Measurements of fasting blood glucose concentrations. O or IP tolerance tests to (F) glucose (O-GTT), (G) insulin (IP-ITT) and (H) pyruvate (O-PTT). Not displayed are curves for mice with temperature-conditioned gut microbiota. Inset barplots provide AUC value (n = 5–8).
(I) PCA of hepatic metabolites in the negative ionization mode in chow fed mice housed at 22 °C following IP administration of pyruvate (n = 3–6).
(J) Concentrations of selected metabolites. Blue arrows depict the gluconeogenic pathway, red arrows depict oxidation of pyruvate, and black arrows depict intermediate reactions. Orange bubbles represent microbiome-dependent metabolic pathways, orange arrows indicate anaplerotic reactions from gluconeogenic amino acids, and the blue bubble represents the portal vein serum metabolites. Multi-step enzymatic reactions are denoted by broken lines (n = 3–6).
Individual mice are represented by circles or triangles; Barplots and points joined by solid lines represent means ± s.e.m. Statistical analyses were conducted using Student’s t-test, 1-way ANOVA or 2-way ANOVA with repeated measures where appropriate; *P < 0.05 control vs. CD or GF mice, #P < 0.05 saline vs. pyruvate. See also Figure S4 and Tables S3 and S4.
The gut microbiome contributes gluconeogenic substrates in the form of short chain fatty acids (SCFAs) derived from the fermentation of dietary fibers (den Besten et al., 2013, Schonfeld and Wojtczak, 2016). In microbiome-deficient mice we observed that supplementation with a mixture of SCFAs reduced fasting blood glucose (Figure S4E) yet had no effect on the gluconeogenic response to pyruvate (Figure S4F), whereas gluconeogenesis was reduced in mice treated with acetate alone (Figure S4G).
Because FAO supports gluconeogenesis (Rui, 2014), we next tested whether rates of hepatic FAO and activation of AMP-activated protein kinase (AMPK) might be reduced in microbiome deficient mice. Rates of hepatic FAO were lower in CD, but not in GF mice (Figure S4H), and we detected no differences in the phosphorylation of AMPK at Thr172 or in the phosphorylation of the AMPK target acetyl-CoA carboxylase (ACC) (Figure S4I) (Garcia and Shaw, 2017).
The gut microbiome controls metabolic pathways of hepatic gluconeogenesis
Given that our data shows that gut microbiota regulate hepatic glucose production, independent of a change in thermogenesis, we next explored whether this regulation was due to a direct effect on the liver. To ascertain metabolic pathways that may regulate gluconeogenesis in microbiome-deficient mice, we conducted metabolomic analyses of livers from fasted mice (Table S3). Principal component analysis (PCA) demonstrated a clustering of GF and CD mice distinct from control mice, indicating microbiome-dependent alterations in hepatic metabolites (Figure 4I). We then performed a targeted pathway analysis and identified alterations in metabolic pathways that could influence hepatic gluconeogenesis, including the TCA cycle and amino acid metabolism (Figure 4J and Table S4). Untargeted analysis provided unbiased confirmation that the biosynthesis and metabolism of amino acids were among the most dysregulated hepatic pathways (Table S4). Furthermore, we determined that key metabolites in the TCA cycle responded to pyruvate administration in a microbiome-dependent manner (Figure 4J). We observed that pyruvate was metabolized through hepatic gluconeogenic pathways in control mice, as evidenced by increases in levels of malate and fumarate, whereas this was not apparent in microbiome-deficient mice. To overcome a potential deficiency in amino acids we supplemented drinking water with a cocktail of hydrolyzed amino acids. However, this failed to normalize glucose production from pyruvate in CD and GF mice (Figure S4J).
In order to identify microbiome-derived metabolites that influence hepatic gluconeogenesis, we conducted metabolomic analyses in serum collected from the portal vein (PVS) of CD, GF and control mice. Analysis of a targeted panel of portal vein metabolites by unsupervised Ward/Pearson clustering revealed that mice segregate distinctly as a function of the gut microbiome (Figure S4K), and further analysis delineated a subset of PVS metabolites which were differentially-regulated in a microbiome-dependent manner. As observed for liver metabolomics, we found that compared to control mice, the PVS of CD and GF mice exhibited alterations in amino acids, nucleic acid intermediates and TCA cycle-related metabolites (Table S3). We performed a complementary untargeted pathway analysis of PVS metabolites that provided confirmatory evidence of alterations in amino acid metabolism and the TCA cycle (Table S4).
Discussion
This study demonstrates that the gut microbiome plays a key role in the regulation of glucose homeostasis by supporting hepatic gluconeogenesis. This occurs independently of adaptive thermogenesis, which was unaffected by the gut microbiome despite broadly varied conditions of thermal and dietary stress that profoundly influenced microbial composition.
The gut microbiome is dispensable for both cold- and diet-induced thermogenesis
It has been reported that the gut microbiome influences energy balance and blood glucose concentrations through the recruitment of thermogenic tissues (Worthmann et al., 2017, Li et al., 2017, Somm et al., 2017, Chevalier et al., 2015, Zietak et al., 2016, Li et al., 2019). Suárez-Zamorano et al. described that microbiota depletion induces browning of WAT, based on elevations in WAT thermogenic gene expression and glucose uptake (Suarez-Zamorano et al., 2015). In contrast, Li et al. concluded that microbial depletion impairs thermogenesis in BAT and browning of WAT, on the basis of reduced VO2 values at cold ambient temperatures as well as following β3 pharmacologic stimulation, suppression of protein and gene expression, and lower core body temperatures during acute cold challenge (Li et al., 2019). Whereas these latter findings are consistent with reduced BAT and beige fat activity, the short durations of cold exposure (up to 48 h) left open the possibility that other factors may have contributed to these microbiome-dependent effects. These include impairments in shivering thermogenesis (Cannon and Nedergaard, 2004) and in nutrient absorption. In this connection, gut microbes contribute to the breakdown of complex carbohydrates (Sonnenburg and Sonnenburg, 2014), absorption of fat (Martinez-Guryn et al., 2018) and metabolism of proteins and micronutrients (Cummings and Macfarlane, 1997) that would be expected to assist the host in meeting energy requirements during cold challenge (Chevalier et al., 2015), and may have contributed to the observed reductions in both adipose and lean mass in microbiome-deficient mice. We speculate that lower core body temperatures, as shown here both at thermoneutrality and following acclimation to moderate cold temperatures, may reflect alterations in central control or accelerated rates of heat loss in microbiome-deficient mice. Considering CD and GF mice are able to increase their energy expenditure at least as well as their controls in response to thermogenic or dietary stress, this argues against suppression of thermogenesis (Li et al., 2019), and conversely, may explain why microbiome deficiency has been reported to promote thermogenesis (Suarez-Zamorano et al., 2015).
The current study reconciles apparent contradictions in the literature. Whereas previous studies have based connections between the microbiome and energy expenditure principally on molecular markers of browning (Suarez-Zamorano et al., 2015) or on short-term measurements of energy expenditure (Li et al., 2019), we have utilized comprehensive measurements of energy balance over a broad range of ambient temperature exposures: The lack of effect of the microbiome on energy expenditure is in keeping with the absence of consistent changes in browning markers. Although it is conceivable that other fat depots may have also contributed (Zhang et al., 2018), overall measures of energy expenditure nevertheless remained unchanged. Very importantly, our experimental design considered the effect of the markedly engorged ceca with metabolically inactive contents that accumulate in microbiome-deficient mice. This avoided substantial underestimation of energy expenditure when adjusting by ANCOVA for body mass (Tschop et al., 2012, Mina et al., 2018). The engorged cecum also creates a physical obstacle to the precise administration of experimental compounds by IP injection, potentially leading to erroneous results in microbiome-deficient mice. For this reason, IP injections were avoided, and when employed, experimental findings were corroborated using alternative routes of administration wherever possible.
A mechanistic link between alterations in the gut microbiome and energy expenditure has also been suggested based on the recruitment of thermogenic tissues in response to dietary manipulations in the mouse (Li et al., 2017, Thaiss et al., 2016, Fabbiano et al., 2018). Whether microbiome-deficient mice are protected against diet-induced obesity (Backhed et al., 2004) depends upon the specific dietary fat consumed (Kubeck et al., 2016). Our experiments showed that microbiome-deficient mice were not protected from obesity when fed a palm oil-based HFD, exhibiting similar per kcal rates of diet-induced energy expenditure as conventional controls. In keeping with observations that GF mice exhibit hyperphagia of sucrose and lipid (Duca et al., 2012, Swartz et al., 2012), we also showed that microbiome-deficient mice consumed more HFD during acute challenges, which proportionately increased energy expenditure.
Whereas cold-conditioned gut microbiota have been reported to protect from diet-induced obesity following FMT into GF recipient mice housed at 23 °C (Zietak et al., 2016), this was not the case when CD recipient mice were housed at 30 °C in the current study. This is most likely because protection from diet-induced obesity is dependent on the sustained cold stimulation that occurs at 23 °C in mice. In this connection, t he absence of protection from diet-induced obesity during thermoneutral housing argues against the utility of FMT with cold-conditioned gut microbiota as an anti-obesity strategy in humans, who largely reside at thermoneutral ambient temperatures.
Variability in gut microbiomes of mice between mouse facilities is an important consideration and may confound results from different laboratories. In this connection, we observed comparable experimental outcomes in two different animal facilities. We also observed quite similar cold-induced alterations in both the gut microbial phyla and specific microbial species as have been reported by others. Taken together, these data suggest broader applicability of the experimental findings.
Key role for the gut microbiome in hepatic gluconeogenesis
As in prior reports (Suarez-Zamorano et al., 2015, Molinaro et al., 2017), we observed reduced blood glucose concentrations in microbiome-deficient mice. Our data indicate that these were attributable to reduced hepatic gluconeogenesis. Although microbially-derived SCFAs can act as gluconeogenic substrates (den Besten et al., 2013, De Vadder et al., 2014), SCFA supplementation did not increase blood glucose concentrations or hepatic gluconeogenesis. Targeted metabolomics in the liver revealed microbiome-dependent alterations in biosynthetic pathways of glucogenic amino acids. Highlighting the importance of gut microbes in the breakdown of proteins and synthesis of amino acids (Neis et al., 2015), we and others (Mardinoglu et al., 2015) have demonstrated that the portal vein concentrations of many amino acids are regulated by gut microbiota. However, as oral supplementation with amino acids did not reverse the suppression of hepatic gluconeogenesis, this suggests that either specific amino acids or other microbial metabolites might regulate blood glucose concentrations. Notably, levels of indoxyl sulfate as well as glycine and taurine were altered in a manner that may have reduced blood glucose concentrations in microbiome-deficient mice. Exposure to indoxyl sulfate, a metabolite of tryptophan, has been shown to increase basal blood glucose levels in rats (Opdebeeck et al., 2019), and in the current study this metabolite was suppressed in the absence of the gut microbiome. Taurine and glycine levels, which vary inversely with blood glucose concentrations, were higher in microbiome-deficient mice: Studies in humans and rodents have linked lower blood glycine concentrations to higher blood glucose, risk of diabetes and NAFLD (Gaggini et al., 2018, Gall et al., 2010, Altmaier et al., 2008). Additionally, glycine supplementation reduces the percent hemoglobin A1c in patients with type 2 diabetes (Cruz et al., 2008) and taurine supplementation decreases blood glucose levels in diabetic rabbit and rat models (Kim et al., 2012, Winiarska et al., 2009). Whereas levels of indoxyl sulfate, glycine and taurine are all influenced by the gut microbiota (Peck et al., 2019, Yang and Tarng, 2018, Alves et al., 2019), the mechanisms by which they regulate glucose homeostasis are incompletely understood.
Our data highlight an important role for the gut microbiome in maintaining glucose homeostasis, but not in regulating energy expenditure. By controlling concentrations of key metabolites in the portal vein and liver, gut microbial metabolism promotes hepatic gluconeogenesis in the host. Alterations in the gut microbiome that were previously shown to protect against diet-induced obesity may have acted by controlling nutrient absorption and glucose metabolism rather than by enhancing thermogenesis.
Limitations of Study
The CD and GF mouse models used in this study each have inherent limitations. GF mice exhibit altered immune system development (Round and Mazmanian, 2009), whereas the antimicrobial agents that were administered to create CD mice did not completely eliminate all gut microbes and may themselves have influenced metabolic parameters that were studied. All experiments were conducted using C57BL/6J mice. Because genetic background influences browning capacity (Ferrannini et al., 2016) as well as the composition of the gut microbiome (Fujisaka et al., 2016), it is possible at least some of our findings may have been strain-specific. Whereas we demonstrated that the gut microbiome is dispensable for adaptive thermogenesis in the host over a broad range of thermal or dietary conditions, this does not exclude the possibility that other conditions of metabolic stress or uncharacterized microbial communities could influence adaptive thermogenic responses. Finally, we have yet to ascertain the precise molecular mechanism by which the gut microbiome promotes hepatic glucose production.
STAR methods
LEAD CONTACT AND MATERIALS AVAILABILITY
Further information and requests for resources and reagents should be directed to David E. Cohen (dcohen@med.cornell.edu). This study did not generate new unique reagents.
EXPERIMENTAL MODEL AND SUBJECT DETAILS
Animals
Adult (10–22 week old) male C57BL/6J mice were used in all experiments. GF gnotobiotic mice were obtained from Dr. David Artis, Jill Roberts Institute for Research in Inflammatory Bowel Disease, WCMC, or from Dr. Lynn Bry at the Gnotobiotics, Microbiology and Metagenomics core facility, Harvard Digestive Diseases Center, BWH. Conventional mice were obtained from The Jackson Laboratory (Bar Harbor, ME, USA), bred in house, and were cohoused 3–5 mice per cage, in a specific pathogen-free facility with a standard 12 h alternate light/dark cycle at an ambient temperature of 22 ± 2 °C, 30–70% humidity, in individually ventilated cages on pine chip bedding with cotton nesting squares, unless otherwise specified. Health status of mice was determined via daily observation by technicians supported by veterinary care. Housing and experimentation were conducted in facilities with a sentinel colony health monitoring program and strict biosecurity measures to prevent, detect, and eradicate adventitious infections in rodent colonies. All animal experiments were conducted in accordance with the protocols for animal use, treatment, and euthanasia approved by the Institutional Animal Care and Use Committees of WCMC and Harvard Medical School.
Diets
Mice were given free access to acidified drinking water and were fed ad libitum a standard rodent chow diet (PicoLab Rodent Diet 20–5053; LabDiet, St. Louis, MO, USA), and where specified, a HFD with 60% kcal fat from lard (D12492i; Research Diets, New Brunswick, NJ, USA). GF and respective control mice had free access to autoclaved acidified drinking water and were fed an autoclaved chow diet (WCMC: JL Rat and Mouse/Auto/Irr 6F 5KAI*; LabDiet, St. Louis, MO, USA; BWH: Autoclavable Mouse Breeder Diet 5021*, LabDiet, St. Louis, MO, USA). Where indicated, GF, CD and control mice were fed a HFD with 60% kcal fat from palm oil, which was supplemented with additional micronutrients to ensure adequate nutrition following double irradiation (D18062706–1.5V double irradiated; Research Diets, New Brunswick, NJ, USA (Kubeck et al., 2016)). We used a palm oil-based HFD because it was shown in GF mice to be more efficiently absorbed by the intestine compared to a lard-based HFD (Kubeck et al., 2016).
Commensal depletion
Commensal depletion was achieved by administering an antibiotic cocktail containing neomycin 1 g/L, metronidazole 0.25 g/L, vancomycin 0.5 g/L and ampicillin 1 g/L prepared in autoclaved water (pH 7.4) and filter sterilized (Xiao et al., 2007). The cocktail was substituted for drinking water using red-colored drinking bottles for protection from the light. Mice consumed the cocktail ad libitum and it was replaced weekly or as required. Preliminary studies demonstrated >99 % depletion of bacteria within 2 d which persisted for at least 40 d, as per Suarez-Zamorano et al. (Suarez-Zamorano et al., 2015).
Tissue collection
Mice were euthanized by isoflurane inhalation followed by exsanguination. In selected experiments, insulin (1 U/kg corrected body mass) was injected into the inferior vena cava during isoflurane anesthesia and mice were euthanized 4 min later. Blood was collected by cardiac puncture prior to excision of tissues. Liver, subcutaneous IWAT, GWAT, BAT and quadriceps muscle were snap frozen in liquid nitrogen and stored at −80 °C prior to analysis. Blood was collected from the portal vein in anaesthetized mice following a 16 h fast and allowed to clot at RT for 30 min prior to centrifugation and serum collection. Fecal pellets were collected fresh prior to euthanasia and stored at −80 °C prio r to analysis.
METHOD DETAILS
Acclimation to ambient temperatures
Mice previously maintained at 22 °C were acclimated to ambient temperatures for 4 w. CD and respective control mice were housed 2 mice/cage, whereas GF and respective control mice were housed 1 mouse/cage. For acclimation to 30 °C, mice were housed within an environmental enclosure (DB034 Laboratory Incubator, Darwin Chambers, St. Louis, MO, USA). For acclimation to 15 °C, mice were placed in a cold room designed for mice. Because in preliminary experiments CD and GF mice did not tolerate an abrupt change in ambient temperature from 22 °C to 4 °C, they were step-wise acclimated to 4 °C in a cold room designed for mice. Mice previously housed at 22 °C were housed 2 mice/cage at 10 °C for 5 d, then 4 °C for 2 w with a shepherd shack (Bio-Huts™ for Mice, Bioserv), then single caged at 4 °C for another 2 w. GF mice were single caged for the entire acclimation period.
Comprehensive mouse monitoring
Metabolic monitoring was conducted using a Promethion Metabolic Screening System (Promethion High-Definition Multiplexed Respirometry System for Mice; Sable Systems International, Las Vegas, NV, USA), with the exception of a single experiment (GF mice in Figure 1C), which was conducted using a Comprehensive Lab Animal Monitoring System (CLAMS; Columbus, OH, USA) as previously described (Kang et al., 2013). In the Promethion system, rates of oxygen consumption and carbon dioxide production were acquired by indirect calorimetry with a sampling frequency of 1 s. Respirometry values were determined every 5 min; the dwell time for each cage was 30 s, with baseline cage sampling frequency of 30 s occurring every four cages. Values of respiratory exchange ratio (RER) were calculated as ratios of VCO2 to VO2. Food intake and body mass were recorded continuously by gravimetric measurements within the cages. Physical activity was determined according to beam breaks within a grid of infrared sensors built into each cage. Energy expenditure was calculated using the Weir equation (Energy expenditure = 3.941 kcal/L × VO2 + 1.106 kcal/L × VCO2) (Weir, 1949). Energy expenditure is displayed as the total kcal per specified periods of time, with values adjusted by ANCOVA (Speakman, 2013) for body mass or corrected body mass using VassarStats. Values of RMRt were determined as the average of the lowest 3 postprandial energy expenditure recordings in mice housed at 30 °C for 3 d (Speakman, 2013).
Metabolic cages were contained within temperature-controlled environmental enclosures (DB034 Laboratory Incubator, Darwin Chambers, St. Louis, MO, USA). GF and respective control mice were monitored in fully enclosed metabolic cages with HEPA filters to maintain sterile air flow. In the Promethion system, IsoCage P Bioexclusion System cages (Tecniplast) were used and sterilized by autoclaving. In the CLAMS, custom designed cages were sterilized with ethylene oxide. Due to cage design, continuous monitoring of body mass and food intake were not possible in fully enclosed Promethion cages, whereas activity was not accurately measured in fully enclosed CLAMS cages. Daily food intake in GF mice was measured using autoclavable custom designed food hoppers (Ancare, Bellmore, NY, USA). During experiments, mice were individually caged with a consistent volume of pine chip bedding, without cotton nesting squares, and were allowed at least 48 h to adapt to the metabolic cages. Rectal temperatures were measurements were performed using an Oakton Acorn Temp J-K-T Thermocouple Thermometer (Oakton Instruments, IL, USA) with an RET-3 probe.
Wireless probes to measure core body temperatures (E-Mitter telemetry system implants, STARR Life Sciences Corp) were implanted into the peritoneal cavity 2 w prior to experimentation as previously described (Kang et al., 2013), except that the transponder was not sutured to the peritoneum and the skin was closed using wound clips.
Acute cold challenge
To determine the energy expenditure response to an acute cold exposure, mice were single caged at 30 °C for 24 h prior to being placed at 10 °C from 10:00 AM – 4:00 PM. Cumulative energy expenditure from 12:00 PM – 4:00 PM at 10 °C was compared to energy expended during the corresponding period of the previous day. To determine the core body temperature response to an acute cold challenge, a separate cohort of mice acclimated to 22 °C were single caged at 4 °C and core body temperature was assesse d via rectal probe. BAT and IWAT were collected following 48 h of exposure to 4 °C.
Body composition
Body compositions (lean and fat) were measured by NMR spectroscopy in an EchoMRI 3-in-1 Body Composition Analyzer (Houston, TX, USA). Due to signal interference from temperature probes, body composition in mice with temperature probes inserted was determined following euthanasia and temperature probe removal. Analysis of body composition in microbiome-deficient mice was obscured by the large volume of cecal contents, leading to an overestimation of fat mass in CD and GF mice (data not shown). Body composition analysis was therefore measured in CD, GF and respective control mice following euthanasia and removal of the intestinal (including cecal) contents. Corrected body mass was defined as body mass following subtraction of intestinal (including cecal) contents.
Cecectomy and sham surgery
Cecectomy and sham surgeries were performed (Brown et al., 2018) with minor modifications. Mice were provided antibiotic cocktail to deplete commensal microorganisms (as described above) 2 weeks prior to surgery and remained on the antibiotics throughout recovery and subsequent experiments. Operations were performed by aseptic technique, including removal of the fur using clippers, and procedure conducted whilst mice were anesthetized using continuous isoflurane inhalation. Briefly, a 1.5 cm incision was made along the lower abdomen, the enlarged cecum was exteriorized onto a sterile barrier drape and ligated at the ileocecal junction. The cecum was carefully excised and remaining tissue was irrigated with sterile PBS before being returned to the peritoneal cavity. The intestine was kept moist with sterile PBS throughout the procedure. For sham surgeries, the cecum was exteriorized for 3 min before being returned to the peritoneal cavity. The abdominal cavity was closed using absorbable suture and the skin was closed using wound clips. Lidocaine provided local anesthetic at the wound site and one dose of meloxicam and buprenorphine was given subcutaneously while mice were under anesthesia for pre-emptive analgesia. 7 doses of buprenorphine and 3 doses of meloxicam were also provided in the 3 days post-surgery. Wound clips were removed 12–14 days post-surgery. Mice were allowed 4 w recovery from surgery prior to metabolic assessment, by which time fur had regrown over the abdomen and the surgical site had fully healed.
Nutrient absorption
Nutrient absorption was quantified as described (Staffas et al., 2018). Fecal pellets were collected from cage bottoms and food intake was determined using custom-designed food hoppers over 24 h during which mice were single caged and housed at 22 °C. Fecal pellets were dehydrated for 48 h and then subjected to bomb calorimetry using a Parr 6725 Semimicro Calorimeter. Nutrient absorption was calculated as the difference between calorie intake and fecal loss, and efficiency of nutrient absorption was calculated as the calorie absorption divided by total calorie intake.
Immunoblot analysis
Immunoblot analyses were performed using standard techniques and imaged using the Odyssey CLx Imaging System (LI-COR Biosciences). 20–40 μg of tissues were homogenized in radioimmunoprecipitation assay (RIPA) buffer using the Bead Ruptor Elite. Proteins were solubilized in Laemelli buffer containing Orange G (Cat#O3756–25G, Sigma-Aldrich) and separated by SDS-PAGE, with Chameleon Duo pre-stained protein ladder (Cat#928–60000, LI-COR Biosciences). Proteins were transferred onto nitrocellulose membranes and total protein were assessed using REVERT Total Protein Stain (Cat#926–11013, LI-COR Biosciences). Membranes were blocked for 1 h using Odyssey blocking buffer (Cat#927–50000, LI-COR Biosciences), then incubated overnight at 4 °C with primary antibodies diluted 1:1000, except phospho-Akt (1:2000), phospho-GSK3a/b (1:3000), GSK3b (1:5000) and Akt (1:6000). Membranes were washed and incubated for 1 h at room temperature, protected from light, with IRDye 680RD Goat anti-Mouse or IRDye 800CW Goat anti-Rabbit diluted 1:15,000. To account for unequal loading, proteins of interest were normalized relative to total protein. Phosphoproteins were quantified relative to their respective total protein bands. All samples to be compared were prepared at the same time, processed and imaged in parallel.
CL316,243 administration
To determine thermogenic capacity, we assessed the response of VO2 to a subcutaneous injection of the β3-adrenergic receptor agonist CL316,243. Prior to injections, mice were housed at 30 °C overnight in metabolic cages to minimize t he activity of thermogenic tissues; mice remained in metabolic cages at 30 °C for the durati on of the experiment. The following day, 2–4 h after onset of the light cycle, mice were briefly removed from metabolic cages and injected subcutaneously with saline. At the same time the following day mice were briefly removed from metabolic cages and injected subcutaneously with 1 mg/kg corrected body mass of CL316,243 hydrate (C5975, Sigma-Aldrich). Values of VO2 were measured for 60 min prior and 60 min following each injection. The response to CL316,243 was determined by subtracting the AUC of the response to saline from the response to CL316,243. Total peak area from baseline was calculated using the trapezoid rule in GraphPad Prism. Baseline VO2 values were determined as the average of the 3 lowest recordings in the 60 min prior to injection. Values of AUC were adjusted by ANCOVA (Speakman, 2013) for body mass or corrected body mass using VassarStats.
Surface infrared thermography
Thermal radiation was assessed in mice using a FLIR Systems T430sc Thermal Imaging Camera (FLIR, Wilsonville, OR, USA) as described (Okada et al., 2016) with modifications. Briefly, the FLIR camera was mounted on a tripod and placed over a metal plate at a focal length of 30 cm. Mice were anaesthetized by isoflurane inhalation (1 min, 2 L/min) and placed on the metal plate in the prone position with isoflurane delivered via nose-cone. Thermal images were captured at an emissivity setting of 0.95 in JPG format. Separate images were taken of the back and ventral/inguinal. The images were imported into FLIR Tools software (www.flir.com/products/flir-tools/). A region of interest (ROI) corresponding to the BAT was placed around the dorsal/interscapular region aligned with the long axis of mouse beginning at the rearward base of the ears and centered on the scapulae. For the IWAT, a ROI was placed over the greatest heat intensities, reflecting inguinal adipose depots on each side. For all measurements the maximum spot temperature and average temperature were recorded.
Rates of fatty acid oxidation
Rates of fatty acid oxidation were determined as described (Alves-Bezerra et al., 2018) in freshly collected liver and BAT homogenates (100 mg) from mice fasted for 6 h. Ice-cold STE buffer (0.025 M sucrose, 0.010 M tris-HCl, 0.001 M EDTA) was added to tissues which were disrupted using a Dounce homogenizer. Crude mitochondria were isolated by collecting supernatant following centrifugation of homogenate at 400 g for 10 min at 4 °C. Samples (15–30 μL) were transferred to reaction tubes with the oxidation reaction mixture (370 μL of 0.4 μCi [14C]palmitate (American Radiolabeled Chemicals Inc; 55 μCi/μmol), 0.5 μM palmitate conjugated with FA-free BSA (7.5 %), 100 mM sucrose, 10 mM Tris (pH 8.0), 5 mM KH2PO4, 0.2 mM EDTA, 80 mM KCl, 1 mM MgCl2, 2 mM L-carnitine, 0.1 mM malate, 0.05 mM CoA, 2 mM ATP and 1 mM DTT) and incubated at 37 °C for 30 min. Samples were transferred to microtubes containing 200 μL 1 M perchloric acid and shaken for 1 h at room temperature. [14C]-labeled CO2 produced by complete oxidation of radiolabeled FA was trapped onto filter papers soaked with 20 μL of 1 M NaOH. Partially oxidized [14C]-labeled acid soluble metabolites were separated by centrifugation at 14,000 g for 10 min at 4 °C. Aliquots of the supernatants (400 μL) and paper filters were placed into separate vials and subjected to scintillation counting. Total oxidation rates were calculated as the sum of partial and complete degradation products of [14C]-palmitate.
Quantitative PCR analysis
DNA was extracted from fecal pellets (60–120 mg per sample) using the QIAamp PowerFecal DNA Kit (Cat# 12830–50, QIAGEN, USA) as per manufacturer’s instructions with the following modifications: Tubes were heated at 70 °C; samples were homogenized for 60 s using a Bead Ruptor Elite (Omni International, Kennesaw GA, USA) set at 5 m/s; incubations at 2–8 °C were 10 min. Quantitative PCR (qPCR) was conducted using Power SYBR™ Green PCR Master Mix (Cat# 4367660, Thermo Fisher Scientific), QuantStudio 6 Flex Real-Time PCR System (Thermo Fisher Scientific) and primers for bacteria (UniF340/UniR514) (Barman et al., 2008) and fungi (18S_F/18S_R) (Einsele et al., 1997). Sterility of GF mice was confirmed at the completion of each experiment. Results were consistent with qualitative culture analysis and dapi staining of fecal pellets (data not shown).
RNA was extracted from liver and adipose tissues using TRIzol Reagent (Cat# 15596–018; Thermo Fisher Scientific, USA), according to the manufacturer’s instructions. Samples were homogenized for 30 s using the Bead Ruptor Elite, set at 5 m/s. DNA was removed using DNase I, amplification grade (Cat# 18068015, Thermo Fisher Scientific, USA). cDNA was synthesized using High-Capacity cDNA Reverse Transcription Kit (Cat# 4368814, Thermo Fisher Scientific, USA). Relative mRNA expression was determined by quantitative PCR (qPCR) using Power SYBR™ Green PCR Master Mix (Cat# 4367660, Thermo Fisher Scientific), QuantStudio 6 Flex Real-Time PCR System (Thermo Fisher Scientific) and primers, as detailed in the key resources table. Genes were expressed relative to ribosomal protein L32 (RPL32) and/or cyclophilin A.
Histopathology
Freshly harvested tissues were fixed in 10% buffered formalin for 24–48 h at RT, washed 2x with PBS and stored in PBS at 4 °C before paraffin embed ding. Tissues were cut and stained with H&E using standard techniques by the Histology Core at the Beth Israel Deaconess Medical Center (Harvard Medical School, Boston, MA) or the Laboratory of Comparative Pathology (WCMC, Memorial Sloan Kettering Cancer Center, Rockefeller University, New York, NY). Images were taken using LSM 880 confocal microscope with Zen software (Zeiss).
Tissue triglyceride concentrations
Lipids were extracted from tissues using chloroform:methanol (2:1) and triglyceride concentrations were determined enzymatically as per the manufacturer’s instructions (Wako Diagnostics, Mountain View, CA, USA) (Alves-Bezerra et al., 2018).
Fecal microbiome transplantation
Donor mice were obtained from The Jackson Laboratory and housed at 22 °C for 1 w prior to temperature acclimation. To prepare 30 °C-conditioned gut microbiota for transplantation, mice (n = 8) were housed at 30 °C for 3 w. For 22 °C and 4 °C -conditioned gut microbiota, mice (n = 4–5) were similarly housed at 30 °C for 3 w then transferred to either 22 °C or 4 °C for 4 w. All mice were housed 1 mouse/cage and euthanized at 12 w of age. The cecum and colon were placed in anaerobic PBS on ice immediately following excision and transferred to a Coy Chamber (anaerobic environment). Fecal pellets (2) were extracted from the colons of individual mice, placed in sterile microfuge tubes, and stored at −80 °C prior to sequencing analysis. Remaining cecal and fecal contents from mice in each temperature conditioned group were combined in anaerobic PBS with 10% glycerol (3 mL per mouse). The cecal/fecal slurry was vortex mixed, centrifuged at 400xg for 3 min, and the pellet was discarded. The remaining homogenate was aliquoted and placed at −80 °C prior to FMT and sequencing analysis. Recipient mice were administered the same antibiotic cocktail used to prepare CD mice ad libitum for 48 h. 6 h following antibiotic withdrawal, recipient mice received 100 μL of respective donor homogenate via oral gavage, which was repeated daily for 4 sequential d. 2 w following initiation of transplantation, fecal pellets were collected into sterile microfuge tubes on ice and stored at −80 °C prior to sequencing analysis. To a ssess diet-induced thermogenesis, mice were housed at 30 °C for 1 w prior to FMT and remained a t 30 °C throughout the experiment. 2 w following FMT, recipient mice were switched from chow diet to a lard-based HFD and remained on HFD for 6 w.
Microbiome sequencing and analysis
16S rRNA gene sequencing methods were adapted from the methods developed for the Earth Microbiome Project (Walters et al., 2016) and NIH-Human Microbiome Project (Human Microbiome Project, 2012b, Human Microbiome Project, 2012a, Caporaso et al., 2012). Samples were shipped frozen to Baylor College of Medicine’s Alkek Center for Metagenomics and Microbiome Research (CMMR). Bacterial genomic DNA was extracted from 100 mg of the fecal material using the MoBIO PowerLyzer Tissue and Cells DNA isolation kit and sterile spatulas for tissue transfer. The 16S rDNA V4 region was amplified from the extracted DNA by PCR and sequenced in the MiSeq platform (Illumina) using the 2×250 bp paired-end protocol yielding pair-end reads that overlap almost completely. The primers used for amplification contained adapters for MiSeq sequencing and single-index barcodes so that the PCR products could be pooled and sequenced directly (Caporaso et al., 2012), targeting at least 10,000 reads per sample. The read pairs were demultiplexed based on unique molecular barcodes added via PCR during library generation, then merged using USEARCH v7.0.1090 (Edgar, 2010). 16Sv4 rDNA sequences were clustered into Operational Taxonomic Units (OTUs) at a similarity cutoff value of 97% using the UPARSE algorithm (Edgar, 2013). OTUs were subsequently mapped to an optimized version of the SILVA Database (Quast et al., 2013) containing only sequences from the v4 region of the 16S rRNA gene to determine taxonomies. Abundances were recovered by mapping the demultiplexed reads to the UPARSE OTUs. Linear discriminant analysis Effect Size (LEfSe) was performed to visualize differential abundance of key taxa by temperature group (Segata et al., 2011).
For comparison of our data with publicly accessible data from other groups, data for each respective study was downloaded via publicly available accession numbers. For Chevalier et al. (Chevalier et al., 2015), data were downloaded from https://www.ncbi.nlm.nih.gov/geo/ using the GEO number GSE74228. For Zietak et al. (Zietak et al., 2016), data were downloaded from NCBI’s Sequence Read Archive (SRA) in FASTQ format, under accession # PRJNA321010 (https://www.ncbi.nlm.nih.gov/biosample). OTU tables were generated from the FASTQ files using USEARCH version 10.0.240 (Edgar, 2010). Specifically, forward and reverse reads were merged using a minimum overlap length of 15, a minimum overlap region sequence identity of 90%, and a maximum of 4 mismatches in the overlap region. Merged reads were then quality filtered, keeping reads with expected error numbers of less than 1.0. OTU clustering and OTU table generation were performed using the default settings of USEARCH. Taxonomic classification of OTU representative sequences was performed using the USEARCH sintax command (Edgar, 2016) with a confidence threshold of 0.8, using the Ribosomal Database Project training set (version 16) (Cole et al., 2014). Unless accessioned data were already rarefied, raw OTU counts were resampled so that total counts were consistent across samples within the data set. Data were then binned at each taxonomic level. Because experimental designs varied across data sets, sample groups from Chevalier et al. (Chevalier et al., 2015) and Zietak et al. (Zietak et al., 2016) with experimental parameters most similar to the current study were selected for comparison analysis. For Chevalier et al. (Chevalier et al., 2015), selected chow fed mice (n=6–8) were housed at room temperature or 6 °C. Fecal samples were collected from these groups at day 31. For Zietak et al. (Zietak et al., 2016), selected groups (n=7–8) were housed for 4 w on a chow diet, at 29 °C, 17 °C, or 12 °C. Relative abundance was calculated for each phylum by averaging OTU counts of all samples within each group. This process was repeated at other taxonomic levels for metabolically notable populations. The change in abundance of a given taxa from one temperature to another (percent change in relative abundance) was calculated as the difference in relative abundance at two temperatures divided by the abundance in the first temperature.
Drinking water supplementation studies
1 w following commensal depletion, mice were additionally provided with a SCFA cocktail consisting of sodium acetate (67.5 mM), sodium propionate (28.9 mM) and sodium butyrate (17.4 mM), or sodium acetate alone (67.5 mM), pH 7.4, for 1 w. Control mice received pH-and osmolarity-matched drinking water. SCFA supplementation was as reported (Smith et al., 2013) with minor modifications to estimated physiological SCFA ratio’s (Ramos et al., 1997). The drinking water of CD, GF, and control mice was supplemented with a mixture of amino acids for 3–5 w (Hy-Case® SF, Casein acid hydrolysate, from bovine milk; 14g/L, equivalent to 4 g/kg/d) (Wang et al., 2014, Shertzer et al., 2011). Mice were provided autoclaved acidified (pH 2.5) or neutral (pH 7.5) water for 8 w, from 8 w of age. Mice consumed water ad libitum, and it was replaced weekly or as required.
Tolerance tests
Intraperitoneal insulin tolerance tests (IP-ITT) were conducted following a 2 h fast, 8 h after initiation of the light cycle. Blood glucose was determined at baseline and various time-points using a handheld glucometer (GE100 blood glucose monitoring system, Taichung, Taiwan) following IP injection of insulin (chow diet-fed mice, 0.5 U/kg corrected body mass; HFD-fed mice, 0.75 U/kg corrected body mass). Oral glucose tolerance tests (O-GTT) were conducted following 6 h fast, 8 h after initiation of the light cycle. Blood glucose was determined at baseline and following oral gavage of a 20% glucose solution (chow diet-fed mice, 2 g/kg corrected body mass; HFD-fed mice, 1 g/kg corrected body mass). Intraperitoneal and oral pyruvate tolerance tests (IP-PTT and O-PTT) were conducted following overnight 16 h fast, 4 h after initiation of the light cycle. Blood glucose was determined at baseline and following administration of a 0.3 g/mL solution of pyruvate dissolved in PBS (2 g/kg corrected body mass). AUC was calculated using the trapezoid rule in GraphPad Prism. Total peak area from baseline was determined for each mouse; baseline was defined as basal blood glucose concentration (time 0), except for ITTs, where baseline was considered to be blood glucose concentration 60 min post-injection.
In preliminary experiments we found it challenging during IP injections to consistently avoid the markedly engorged cecum of microbiome-deficient mice, which dominates the peritoneal cavity. Consequently, where possible we substituted or complimented procedures using IP injections, with parallel procedures conducted using subcutaneous injections and oral gavage.
Hepatic Metabolomics
Following 16 h fast, control, GF and CD mice were injected IP with pyruvate (2 g/kg corrected body mass) or saline. After 20 min, mice were anesthetized via isoflurane inhalation and after a total time of 30 min from injection, mice were euthanized. Liver tissue (100 mg) was immediately excised from the left lobe, snap frozen and stored at −80 °C. Liver was subsequently homogenized in approximately 300 μL ice-cold PBS (to yield 333 mg/mL), followed by centrifugation at 13,000 g for 15 min at 4 °C. Supernatants were removed and centrifuged again at 13,000 g for 10 min, 4 °C. Proteins were then precipitated by adding acetonitrile/methanol (acetonitrile:methanol:homogenate; 2:2:1; v/v/v), and centrifuged at 13,000 g for 15 min, 4 °C. 100 °L of extract was stored at −80 °C until analysis.
LC-MS metabolomics analysis of polar metabolites was performed using a Cogent Diamond Hydride type C column coupled to an Agilent Accurate Mass 6224 time of flight (TOF) operated in the positive and negative ionization mode (Eoh and Rhee, 2013). For targeted analysis, metabolites were identified based on an in-house library with accurate mass-retention time identifiers, followed by peak integration using ProFinder 8.0 (Agilent Technologies). Only metabolites with an average peak area above 3000 AU (negative mode) or 5000 AU (positive mode) were included. For each metabolite, the magnitude of change was defined as the difference between the average peak area in GF or CD mice compared to control; significance was determined by Student’s t-test. A metabolite was determined to be significantly differentially regulated (microbiome-dependent metabolite) if the magnitude of change was significant (P < 0.05) in both GF and CD groups, and if the change was in the same direction. Microbiome-dependent metabolites (in Human Metabolome Database format) were used as inputs for analysis by MetaboAnalyst Targeted Pathway Analysis, choosing Mus musculus pathway library, hypergeometric test for over representation analysis (Chong et al., 2018). Pathways with raw P-value < 0.05 and pathway impact score > 0 were identified. These pathways were then compared to those from untargeted analysis, analyzed using XCMS online version 2.3.0 (Tautenhahn et al., 2012, Huan et al., 2017). Pairwise comparisons between saline and pyruvate-treated mice were made for mice in the positive and negative ionization modes, and PCA was performed. Pathway analysis was conducted using unpaired parametric t-test (Welch t-test, unequal variances), P <0.05 and threshold 0.1.
Serum Metabolomics
Metabolites were extracted from 10 °L of serum using 80 % methanol as previously described (Goncalves et al., 2018). Pre-cooled 80 % methanol (1 mL) was added to each sample and stored at −80 °C overnight. Samples were then centr ifuged at 4 °C, 15 mins at 14,000 rpm. The supernatants were extracted. Targeted LC/MS analyses were performed on a Q Exactive Orbitrap mass spectrometer (Thermo Scientific) coupled to a Vanquish HPLC system (Thermo Scientific). The Q Exactive operated in polarity-switching mode. A Sequant ZIC-HILIC column (2.1 mm i.d. × 150 mm, Merck) was used for separation of metabolites. Flow rate was set at 150 μL/min. Buffers consisted of 100 % acetonitrile for mobile A, and 0.1 % NH4OH/20 mM CH3COONH4 in water for mobile B. Gradient ran from 85 % to 30 % A in 20 min followed by a wash in 10 min with 30 % A and re-equilibration at 85 % A. Metabolites were identified on the basis of exact mass within 5 ppm and standard retention times. Relative metabolite quantitation was performed based on peak area for each metabolite and analyzed using in-house written scripts. For each of the specific metabolites identified, the peak intensity data for each sample was uploaded (in Human Metabolome Database format) to the MetaboAnalyst “Statistical Analysis” module, the data normalized by log transformation and auto-scaling, and unsupervised Ward/Pearson cluster analysis performed based on the top 75 metabolites that demonstrated significance, by 1-way ANOVA, between groups. Individual metabolites were then determined to be significantly differentially regulated as a function of gut microbiota (“microbiome-dependent metabolite”) if the magnitude of change was significant (Student’s t-test with P < 0.05) in both GF and CD groups and if the change was in the same direction. Pathway analysis was conducted using XCMS online version 3.7.1 (Tautenhahn et al., 2012, Huan et al., 2017). Comparisons between control and CD or GF mice were made in the negative ionization modes. Pathway analysis was conducted using unpaired parametric t-test (Welch t-test, unequal variances), P <0.05 and threshold 0.1.
QUANTIFICATION AND STATISTICAL ANALYSIS
Group sizes were calculated to achieve statistical power of 0.80 and type 1 error rate of 5% using http://powerandsamplesize.com, Atlanta, GA, USA. With exception of GF mice that did not maintain GF status (2 of 49), no mice were excluded. Due to constraints of housing conditions, investigators were not blinded to mouse groupings. For the creation of CD mice, groups of mice were initially matched for weight. Statistical analysis is described in each figure legend and was determined using GraphPad Prism software. ‘n’ refers to the individual animals/samples and normal distributions were assumed. Two-tailed unpaired Student’s t-tests were used for comparing 2 groups; one-way ANOVA, with or without repeated measures, was used for comparing 3–5 groups; and two-way ANOVA, with or without repeated measures, was used for comparing more than one factor between groups. Differences were adjudicated using the post-hoc analysis recommended by PRISM. Statistical outliers were determined via Grubbs’ test (P < 0.05) and removed. P < 0.05 was considered to be statistically significant.
DATA AND CODE AVAILABILITY
Gut microbiome sequence data are available from NCBI with BioProject accession number PRJNA589879 (https://www.ncbi.nlm.nih.gov/bioproject/).
ADDITIONAL RESOURCES
N/A
Supplementary Material
KEY RESOURCES TABLE
| REAGENT or RESOURCE | SOURCE | IDENTIFIER |
|---|---|---|
| Antibodies | ||
| Acetyl-CoA carboxylase Antibody | Cell Signaling Technology | Cat# 3662; RRID: AB_2219400 |
| Akt | Cell Signaling Technology | Cat# 9272: RRID: AB_329827 |
| AMPKα | Cell Signaling Technology | Cat# 2532; RRID: AB_330331 |
| Anti-GSK-3β | BD Biosciences | Cat# 610201: RRID: AB_397600 |
| Anti-UCP1 | Abcam | Cat# ab155117; RRID: AB_2783809 |
| Anti-β-Actin | Sigma-Aldrich | Cat# A5441; RRID: AB_476744 |
| Beta tubulin | Novus Biologicals | Cat# NB100-56459; IMG5810A, RRID: AB_1152679 |
| G6Pase-α | Santa Cruz Biotechnology | Cat# sc-25840; RRID: AB_2107514 |
| GAPDH | Novus Biologicals | Cat# NB100-56875; RRID: AB_838305 |
| HSP 90α/β Antibody | Santa Cruz Biotechnology | Cat# sc-7947; RRID: AB_2121235 |
| IRDye 680RD Goat anti-Mouse | Odyssey | Cat# 925-68070; RRID: AB_2651128 |
| IRDye 800CW Goat anti-Rabbit | Odyssey | Cat# 925-32211; RRID: AB_2651127 |
| PEPCK | Santa Cruz Biotechnology | Cat# sc-271029; RRID: AB_10610383 |
| Phospho-Acetyl-CoA carboxylase (Ser79) | Cell Signaling Technology | Cat# 3661; RRID: AB_330337 |
| Phospho-Akt (Ser473) | Cell Signaling Technology | Cat# 9271; RRID: AB_329825 |
| Phospho-AMPKα (Thr172) (40H9) | Cell Signaling Technology | Cat# 2535; RRID: AB_331250 |
| Phospho-GSK3a/b (Ser21/9) | Cell Signaling Technology | Cat# 9331S; RRID: AB_329830 |
| Bacterial and Virus Strains | ||
| Biological Samples | ||
| Chemicals, Peptides, and Recombinant Proteins | ||
| Neomycin trisulfate salt hydrate | SIGMA-ALDRICH | Cat# N5285-25G |
| Metronidazole | Patterson Veterinary | Cat# 07-834-3611 |
| Vancomycin hydrochloride from Streptomyces orientalis | SIGMA-ALDRICH | Cat# V8138-1G |
| Ampicillin | SIGMA-ALDRICH | Cat# A1593-25G |
| CL316,243 hydrate | SIGMA-ALDRICH | Cat# C5976-5MG |
| Sodium acetate | SIGMA-ALDRICH | Cat# S2889 |
| Sodium propionate | SIGMA-ALDRICH | Cat# P1880 |
| Sodium butyrate | SIGMA-ALDRICH | Cat# B5887 |
| Humulin® R U-100 | Lilly | Cat# 0002821501 |
| Hy-Case® SF, Casein acid hydrolysate | SIGMA-ALDRICH | Cat# C9386-500G |
| Critical Commercial Assays | ||
| Multi lipid calibrator | WAKO Diagnostics | Cat# 464-01601 |
| L-Typ TG-M Color A | WAKO Diagnostics | Cat# 994-02891 |
| L-Typ TG-M Color B | WAKO Diagnostics | Cat# 990-02991 |
| Deposited Data | ||
| 16S rDNA microbiome sequencing data | NCBI BioProject | https://www.ncbi.nlm.nih.gov/bioproject/; PRJNA589879 |
| Experimental Models: Cell Lines | ||
| Experimental Models: Organisms/Strains | ||
| C57Bl/6J conventional mice | The Jackson Laboratory, Bar Harbor, ME, USA. | RRID: IMSR_JAX:000664 |
| C57Bl/6J germ-free mice | Lynn Bry: Gnotobiotics, Microbiology and Metagenomics core facility, Harvard Digestive Diseases Center, Brigham and Women’s Hospital, Boston, MA, USA. | |
| C57Bl/6J germ-free mice | David Artis: Jill Roberts Institute for Research in Inflammatory Bowel Disease, WCMC, New York, NY, USA. | |
| Oligonucleotides | ||
| UniF340: ACTCCTACGGGAGGCAGCAGT | (Barman et al., 2008) | N/A |
| UniR514: ATTACCGCGGCTGCTGGC | (Barman et al., 2008) | N/A |
| 18S_F: ATTGGAGGGCAAGTCTGGTG | (Einsele et al., 1997) | N/A |
| 18S_R: CCGATCCCTAGTCGGCATAG | (Einsele et al., 1997) | N/A |
| RPL32_F: CACCAGTCAGACCGATATG | N/A | |
| RPL32_R: TTCTCCGCACCCTGTTG | N/A | |
| Cyclophilin A_F: GGCCGATGACGAGCCC | N/A | |
| Cyclophilin A_R: TGTCTTTGGAACTTTGTCTGCAA | N/A | |
| Ucp1_F: TCAGGATTGGCCTCTAGGAC | N/A | |
| Ucp1_R: TGCATTCTGACCTTCACGAC | N/A | |
| Cidea_F: ATCACAACTGGCCTGGTTACG | N/A | |
| Cidea_R: TACTACCCGGTGTCCATTTCT | N/A | |
| Dio2_F: CTTCCTCCTAGATGCCTACAAAC | N/A | |
| Dio2_R: GGCATAATTGTTACCTGATTCAGG | N/A | |
| Prdm16_F: CCACCAGCGAGGACTTCAC | N/A | |
| Prdm16_R: GGAGGACTCTCGTAGCTCGAA | N/A | |
| Ppargc1a_F: TGCCCAGATCTTCCTGAACT | N/A | |
| Ppargc1a_R: TCTGTGAGAACCGCTAGCAA | N/A | |
| Ppara_F: GTGGCTGCTATAATTTGCTGTG | N/A | |
| Ppara_R: GAAGGTGTCATCTGGATGGTT | N/A | |
| Pparg_F: CACAATGCCATCAGGTTTGG | N/A | |
| Pparg_R: GCTGGTCGATATCACTGGAGATC | N/A | |
| Cd137_F: CGTGCAGAACTCCTGTGATAAC | N/A | |
| Cd137_R: GTCCACCTATGCTGGAGAAGG | N/A | |
| Pepck_F: TCATCATCACCCAAGAGCAG | N/A | |
| Pepck_R: CACATAGGGCGAGTCTGTCA | N/A | |
| G6Pase_F: TCGGAGACTGGTTCAACCTC | N/A | |
| G6Pase_R: ACAGGTGACAGGGAACTGCT | N/A | |
| Recombinant DNA | ||
| Software and Algorithms | ||
| MetaboAnalyst 4.0 | Xia Lab at McGill University, Canada. | https://www.metaboanalyst.ca/; RRID: SCR_015539 |
| XCMS | The Scripps Research Institute | https://xcmsonline.scripps.edu; RRID: SCR_015538 |
| Profinder (Mass Spectrometry Analysis) | Agilent | https://www.agilent.com/en/products/software-informatics/masshunter-suite/masshunter-for-life-science-research/profinder-software; RRID: SCR_017026 |
| Prism | GraphPad | https://www.graphpad.com/scientific-software/prism/; RRID: SCR_002798 |
| VassarStats: Website for Statistical Computation | Richard Lowry, Vassar College | www.vassarstats.net; RRID: SCR_010263 |
| FLIR Tools | FLIR | www.flir.com/products/flir-tools, RRID:SCR_016330 |
| Other | ||
| PicoLab Rodent Diet 20 (chow diet) | LabDiet | Cat# 5053* |
| JL Rat and Mouse/Auto/Irr 6F (irradiated chow diet) | LabDiet | Cat# 5KAI* |
| Rodent Diet with 60% kcal fat (Lard-based HFD). | Research Diets | Cat# D12492i |
| Rodent Diet with 60% kcal fat (Palm oil-based double irradiated HFD) | Research Diets | Cat# D18062706-1.5V |
| Promethion High-Definition Multiplexed Respirometry System for Mice | Sable Systems International | N/A |
| DB034 Laboratory Incubator | Darwin Chambers, St. Lois, MO, USA | N/A |
| E-Mitter Telemetry System Implants | STARR Life Sciences | N/A |
| Comprehensive Lab Animal Monitoring System (CLAMS) | Columbus Instruments | N/A |
| Bio-Huts™ for Mice (Shepherd shack) | Bioserv | Product# S3352-400 |
| Acorn Temp J-K-T Thermocouple Thermometer with RET-3 probe | Oakton Instruments, Vernon Hills, IL, USA | Item# WD-35627-00 |
| Infrared Camera | FLIR | Product# T430sc |
Highlights.
The gut microbiome is dispensable for the regulation of energy expenditure (EE)
EE determinations in microbiome-deficient mice must account for cecal engorgement
A cold-conditioned gut microbiome does not influence adaptive thermogenesis
The gut microbiome maintains euglycemia by regulating hepatic gluconeogenesis
Context and Significance.
The mixture of bacteria that normally resides in the gut is referred to as the gut microbiome. Alterations in the composition of this flora can contribute to metabolic diseases, including obesity and diabetes. Whether regulation of blood glucose levels by the gut microbiome is secondary to alterations in energy expenditure remains unclear. Here, Krisko and colleagues demonstrate that the gut microbiome does not regulate energy expenditure in mice, yet it produces molecules that support the capacity of the liver to produce glucose and maintain its normal levels in the blood. Because techniques are emerging that allow for the selective modification of the gut microbiome, these findings suggest new therapeutic approaches to control blood glucose and thus diabetes.
Acknowledgments
Support for the studies was provided by a Brigham and Women’s Hospital (BWH) Innovation Evergreen Fund award to D.E.C. and A.S.B. and the NIH (R37DK48873, R01DK56626 and R01DK103046 to D.E.C; R01DK107717 to A.S.B.). H.T.N is the recipient of a Pinnacle Research Award from the AASLD Foundation. T.I.K. is the recipient of a Weill Cornell Department of Medicine Pre-Career Award and acknowledges support from NIH T32DK007533. G.G.P. is supported by the Jill Roberts Institute. The authors gratefully acknowledge the technical assistance of Alexandra Giddon, Katherine B. LeClair and Marissa Cortopassi. The BWH Metabolic Core of the Harvard Digestive Diseases Center (NIH P30DK034854 and 1S10OD020100), the Weill Cornell Medical College (WCMC) Metabolic Phenotyping Center, the WCMC Proteomics and Metabolomics Core Facility and the Alkek Center for Metagenomics and Microbiome Research, Baylor College of Medicine, were used in the course of these studies. The authors thank Randy S. Longman for use of a Coy Chamber and Tanel Mahlakõiv for helpful discussions. GF mice and related support were provided at WCMC by Nicholas J. Bessman, Mei-Yi Zheng, Rielmer Pinedo and David Artis, and at the Harvard Digestive Diseases Center by Vladimir Yeliseyev and Lynn Bry.
Footnotes
Publisher's Disclaimer: This is a PDF file of an unedited manuscript that has been accepted for publication. As a service to our customers we are providing this early version of the manuscript. The manuscript will undergo copyediting, typesetting, and review of the resulting proof before it is published in its final form. Please note that during the production process errors may be discovered which could affect the content, and all legal disclaimers that apply to the journal pertain.
Declaration of interests
The authors declare no competing interests.
References
- AL-ASMAKH M & ZADJALI F 2015. Use of Germ-Free Animal Models in Microbiota-Related Research. J Microbiol Biotechnol, 25, 1583–8. [DOI] [PubMed] [Google Scholar]
- ALTMAIER E, RAMSAY SL, GRABER A, MEWES HW, WEINBERGER KM & SUHRE K 2008. Bioinformatics analysis of targeted metabolomics-uncovering old and new tales of diabetic mice under medication. Endocrinology, 149, 3478–89. [DOI] [PubMed] [Google Scholar]
- ALVES A, BASSOT A, BULTEAU AL, PIROLA L & MORIO B 2019. Glycine Metabolism and Its Alterations in Obesity and Metabolic Diseases. Nutrients, 11, 1356. [DOI] [PMC free article] [PubMed] [Google Scholar]
- ALVES-BEZERRA M, LI Y, ACUNA M, IVANOVA AA, COREY KE, ORTLUND EA & COHEN DE 2018. Thioesterase Superfamily Member 2 Promotes Hepatic VLDL Secretion by Channeling Fatty Acids into Triglyceride Biosynthesis. Hepatology. [DOI] [PMC free article] [PubMed] [Google Scholar]
- BACKHED F, DING H, WANG T, HOOPER LV, KOH GY, NAGY A, SEMENKOVICH CF & GORDON JI 2004. The gut microbiota as an environmental factor that regulates fat storage. Proc Natl Acad Sci USA, 101, 15718–23. [DOI] [PMC free article] [PubMed] [Google Scholar]
- BARMAN M, UNOLD D, SHIFLEY K, AMIR E, HUNG K, BOS N & SALZMAN N 2008. Enteric salmonellosis disrupts the microbial ecology of the murine gastrointestinal tract. Infect Immun, 76, 907–15. [DOI] [PMC free article] [PubMed] [Google Scholar]
- BARTELT A & HEEREN J 2014. Adipose tissue browning and metabolic health. Nat Rev Endocrinol, 10, 24–36. [DOI] [PubMed] [Google Scholar]
- BETZ MJ & ENERBACK S 2015. Human Brown Adipose Tissue: What We Have Learned So Far. Diabetes, 64, 2352–60. [DOI] [PubMed] [Google Scholar]
- BIDOT WA, ERICSSON AC & FRANKLIN CL 2018. Effects of water decontamination methods and bedding material on the gut microbiota. PLoS One, 13, e0198305. [DOI] [PMC free article] [PubMed] [Google Scholar]
- BROWN K, ABBOTT DW, UWIERA RRE & INGLIS GD 2018. Removal of the cecum affects intestinal fermentation, enteric bacterial community structure, and acute colitis in mice. Gut Microbes, 9, 218–235. [DOI] [PMC free article] [PubMed] [Google Scholar]
- CANNON B & NEDERGAARD J 2004. Brown adipose tissue: function and physiological significance. Physiol. Rev, 84, 277–359. [DOI] [PubMed] [Google Scholar]
- CAPORASO JG, LAUBER CL, WALTERS WA, BERG-LYONS D, HUNTLEY J, FIERER N, OWENS SM, BETLEY J, FRASER L, BAUER M, GORMLEY N, GILBERT JA, SMITH G & KNIGHT R 2012. Ultra-high-throughput microbial community analysis on the Illumina HiSeq and MiSeq platforms. ISME J, 6, 1621–4. [DOI] [PMC free article] [PubMed] [Google Scholar]
- CHEVALIER C, STOJANOVIC O, COLIN DJ, SUAREZ-ZAMORANO N, TARALLO V, VEYRAT-DUREBEX C, RIGO D, FABBIANO S, STEVANOVIC A, HAGEMANN S, MONTET X, SEIMBILLE Y, ZAMBONI N, HAPFELMEIER S & TRAJKOVSKI M 2015. Gut Microbiota Orchestrates Energy Homeostasis during Cold. Cell, 163, 1360–74. [DOI] [PubMed] [Google Scholar]
- CHONDRONIKOLA M, VOLPI E, BORSHEIM E, PORTER C, ANNAMALAI P, ENERBACK S, LIDELL ME, SARAF MK, LABBE SM, HURREN NM, YFANTI C, CHAO T, ANDERSEN CR, CESANI F, HAWKINS H & SIDOSSIS LS 2014. Brown adipose tissue improves whole-body glucose homeostasis and insulin sensitivity in humans. Diabetes, 63, 4089–99. [DOI] [PMC free article] [PubMed] [Google Scholar]
- CHONG J, SOUFAN O, LI C, CARAUS I, LI S, BOURQUE G, WISHART DS & XIA J 2018. MetaboAnalyst 4.0: towards more transparent and integrative metabolomics analysis. Nucleic Acids Res, 46, W486–W494. [DOI] [PMC free article] [PubMed] [Google Scholar]
- COLE JR, WANG Q, FISH JA, CHAI B, MCGARRELL DM, SUN Y, BROWN CT, PORRAS-ALFARO A, KUSKE CR & TIEDJE JM 2014. Ribosomal Database Project: data and tools for high throughput rRNA analysis. Nucleic Acids Res, 42, D633–42. [DOI] [PMC free article] [PubMed] [Google Scholar]
- CRUZ M, MALDONADO-BERNAL C, MONDRAGON-GONZALEZ R, SANCHEZ-BARRERA R, WACHER NH, CARVAJAL-SANDOVAL G & KUMATE J 2008. Glycine treatment decreases proinflammatory cytokines and increases interferon-gamma in patients with type 2 diabetes. J Endocrinol Invest, 31, 694–9. [DOI] [PubMed] [Google Scholar]
- CUMMINGS JH & MACFARLANE GT 1997. Role of intestinal bacteria in nutrient metabolism. JPEN J Parenter Enteral Nutr, 21, 357–65. [DOI] [PubMed] [Google Scholar]
- DE VADDER F, KOVATCHEVA-DATCHARY P, GONCALVES D, VINERA J, ZITOUN C, DUCHAMPT A, BACKHED F & MITHIEUX G 2014. Microbiota-generated metabolites promote metabolic benefits via gut-brain neural circuits. Cell, 156, 84–96. [DOI] [PubMed] [Google Scholar]
- DEN BESTEN G, LANGE K, HAVINGA R, VAN DIJK TH, GERDING A, VAN EUNEN K, MULLER M, GROEN AK, HOOIVELD GJ, BAKKER BM & REIJNGOUD DJ 2013. Gut-derived short-chain fatty acids are vividly assimilated into host carbohydrates and lipids. Am J Physiol Gastrointest Liver Physiol, 305, G900–10. [DOI] [PubMed] [Google Scholar]
- DUCA FA, SWARTZ TD, SAKAR Y & COVASA M 2012. Increased oral detection, but decreased intestinal signaling for fats in mice lacking gut microbiota. PLoS One, 7, e39748. [DOI] [PMC free article] [PubMed] [Google Scholar]
- EDGAR RC 2010. Search and clustering orders of magnitude faster than BLAST. Bioinformatics, 26, 2460–1. [DOI] [PubMed] [Google Scholar]
- EDGAR RC 2013. UPARSE: highly accurate OTU sequences from microbial amplicon reads. Nat Methods, 10, 996–8. [DOI] [PubMed] [Google Scholar]
- EDGAR RC 2016. SINTAX, a simple non-Bayesian taxonomy classifier for 16S and ITS sequences. bioRxiv. [Google Scholar]
- EINSELE H, HEBART H, ROLLER G, LOFFLER J, ROTHENHOFER I, MULLER CA, BOWDEN RA, VAN BURIK J, ENGELHARD D, KANZ L & SCHUMACHER U 1997. Detection and identification of fungal pathogens in blood by using molecular probes. J Clin Microbiol, 35, 1353–60. [DOI] [PMC free article] [PubMed] [Google Scholar]
- EOH H & RHEE KY 2013. Multifunctional essentiality of succinate metabolism in adaptation to hypoxia in Mycobacterium tuberculosis. Proc Natl Acad Sci USA, 110, 6554–9. [DOI] [PMC free article] [PubMed] [Google Scholar]
- FABBIANO S, SUAREZ-ZAMORANO N, CHEVALIER C, LAZAREVIC V, KIESER S, RIGO D, LEO S, VEYRAT-DUREBEX C, GAIA N, MARESCA M, MERKLER D, GOMEZ DE AGUERO M, MACPHERSON A, SCHRENZEL J & TRAJKOVSKI M 2018. Functional Gut Microbiota Remodeling Contributes to the Caloric Restriction-Induced Metabolic Improvements. Cell Metab, 28, 907–921 e7. [DOI] [PMC free article] [PubMed] [Google Scholar]
- FERRANNINI G, NAMWANJE M, FANG B, DAMLE M, LI D, LIU Q, LAZAR MA & QIANG L 2016. Genetic backgrounds determine brown remodeling of white fat in rodents. Mol Metab, 5, 948–958. [DOI] [PMC free article] [PubMed] [Google Scholar]
- FUJISAKA S, USSAR S, CLISH C, DEVKOTA S, DREYFUSS JM, SAKAGUCHI M, SOTO M, KONISHI M, SOFTIC S, ALTINDIS E, LI N, GERBER G, BRY L & KAHN CR 2016. Antibiotic effects on gut microbiota and metabolism are host dependent. J Clin Invest, 126, 4430–4443. [DOI] [PMC free article] [PubMed] [Google Scholar]
- GAGGINI M, CARLI F, ROSSO C, BUZZIGOLI E, MARIETTI M, DELLA LATTA V, CIOCIARO D, ABATE ML, GAMBINO R, CASSADER M, BUGIANESI E & GASTALDELLI A 2018. Altered amino acid concentrations in NAFLD: Impact of obesity and insulin resistance. Hepatology, 67, 145–158. [DOI] [PubMed] [Google Scholar]
- GALL WE, BEEBE K, LAWTON KA, ADAM KP, MITCHELL MW, NAKHLE PJ, RYALS JA, MILBURN MV, NANNIPIERI M, CAMASTRA S, NATALI A, FERRANNINI E & GROUP RS 2010. alpha-hydroxybutyrate is an early biomarker of insulin resistance and glucose intolerance in a nondiabetic population. PLoS One, 5, e10883. [DOI] [PMC free article] [PubMed] [Google Scholar]
- GARCIA D & SHAW RJ 2017. AMPK: Mechanisms of Cellular Energy Sensing and Restoration of Metabolic Balance. Mol Cell, 66, 789–800. [DOI] [PMC free article] [PubMed] [Google Scholar]
- GONCALVES MD, HWANG SK, PAULI C, MURPHY CJ, CHENG Z, HOPKINS BD, WU D, LOUGHRAN RM, EMERLING BM, ZHANG G, FEARON DT & CANTLEY LC 2018. Fenofibrate prevents skeletal muscle loss in mice with lung cancer. Proc Natl Acad Sci U S A, 115, E743–E752. [DOI] [PMC free article] [PubMed] [Google Scholar]
- HUAN T, FORSBERG EM, RINEHART D, JOHNSON CH, IVANISEVIC J, BENTON HP, FANG M, AISPORNA A, HILMERS B, POOLE FL, THORGERSEN MP, ADAMS MWW, KRANTZ G, FIELDS MW, ROBBINS PD, NIEDERNHOFER LJ, IDEKER T, MAJUMDER EL, WALL JD, RATTRAY NJW, GOODACRE R, LAIRSON LL & SIUZDAK G 2017. Systems biology guided by XCMS Online metabolomics. Nat Methods, 14, 461–462. [DOI] [PMC free article] [PubMed] [Google Scholar]
- HUMAN MICROBIOME PROJECT, C. 2012a. A framework for human microbiome research. Nature, 486, 215–21. [DOI] [PMC free article] [PubMed] [Google Scholar]
- HUMAN MICROBIOME PROJECT, C. 2012b. Structure, function and diversity of the healthy human microbiome. Nature, 486, 207–14. [DOI] [PMC free article] [PubMed] [Google Scholar]
- IKEDA K, KANG Q, YONESHIRO T, CAMPOREZ JP, MAKI H, HOMMA M, SHINODA K, CHEN Y, LU X, MARETICH P, TAJIMA K, AJUWON KM, SOGA T & KAJIMURA S 2017. UCP1-independent signaling involving SERCA2b-mediated calcium cycling regulates beige fat thermogenesis and systemic glucose homeostasis. Nat Med, 23, 1454–1465. [DOI] [PMC free article] [PubMed] [Google Scholar]
- KAJIMURA S, SPIEGELMAN BM & SEALE P 2015. Brown and Beige Fat: Physiological Roles beyond Heat Generation. Cell Metab, 22, 546–59. [DOI] [PMC free article] [PubMed] [Google Scholar]
- KANG HW, OZDEMIR C, KAWANO Y, LECLAIR KB, VERNOCHET C, KAHN CR, HAGEN SJ & COHEN DE 2013. Thioesterase superfamily member 2/Acyl-CoA thioesterase 13 (Them2/Acot13) regulates adaptive thermogenesis in mice. J. Biol. Chem, 288, 33376–33386. [DOI] [PMC free article] [PubMed] [Google Scholar]
- KAZAK L, CHOUCHANI ET, JEDRYCHOWSKI MP, ERICKSON BK, SHINODA K, COHEN P, VETRIVELAN R, LU GZ, LAZNIK-BOGOSLAVSKI D, HASENFUSS SC, KAJIMURA S, GYGI SP & SPIEGELMAN BM 2015. A creatine-driven substrate cycle enhances energy expenditure and thermogenesis in beige fat. Cell, 163, 643–55. [DOI] [PMC free article] [PubMed] [Google Scholar]
- KAZAK L, CHOUCHANI ET, LU GZ, JEDRYCHOWSKI MP, BARE CJ, MINA AI, KUMARI M, ZHANG S, VUCKOVIC I, LAZNIK-BOGOSLAVSKI D, DZEJA P, BANKS AS, ROSEN ED & SPIEGELMAN BM 2017. Genetic Depletion of Adipocyte Creatine Metabolism Inhibits Diet-Induced Thermogenesis and Drives Obesity. Cell Metab, 26, 693. [DOI] [PMC free article] [PubMed] [Google Scholar]
- KIM KS, OH DH, KIM JY, LEE BG, YOU JS, CHANG KJ, CHUNG HJ, YOO MC, YANG HI, KANG JH, HWANG YC, AHN KJ, CHUNG HY & JEONG IK 2012. Taurine ameliorates hyperglycemia and dyslipidemia by reducing insulin resistance and leptin level in Otsuka Long-Evans Tokushima fatty (OLETF) rats with long-term diabetes. Exp Mol Med, 44, 665–73. [DOI] [PMC free article] [PubMed] [Google Scholar]
- KLUGER MJ, CONN CA, FRANKLIN B, FRETER R & ABRAMS GD 1990. Effect of gastrointestinal flora on body temperature of rats and mice. Am J Physiol, 258, R552–7. [DOI] [PubMed] [Google Scholar]
- KUBECK R, BONET-RIPOLL C, HOFFMANN C, WALKER A, MULLER VM, SCHUPPEL VL, LAGKOUVARDOS I, SCHOLZ B, ENGEL KH, DANIEL H, SCHMITT-KOPPLIN P, HALLER D, CLAVEL T & KLINGENSPOR M 2016. Dietary fat and gut microbiota interactions determine diet-induced obesity in mice. Mol Metab, 5, 1162–1174. [DOI] [PMC free article] [PubMed] [Google Scholar]
- LI B, LI L, LI M, LAM SM, WANG G, WU Y, ZHANG H, NIU C, ZHANG X, LIU X, HAMBLY C, JIN W, SHUI G & SPEAKMAN JR 2019. Microbiota Depletion Impairs Thermogenesis of Brown Adipose Tissue and Browning of White Adipose Tissue. Cell Rep, 26, 2720–2737 e5. [DOI] [PubMed] [Google Scholar]
- LI G, XIE C, LU S, NICHOLS RG, TIAN Y, LI L, PATEL D, MA Y, BROCKER CN, YAN T, KRAUSZ KW, XIANG R, GAVRILOVA O, PATTERSON AD & GONZALEZ FJ 2017. Intermittent Fasting Promotes White Adipose Browning and Decreases Obesity by Shaping the Gut Microbiota. Cell Metab, 26, 801. [DOI] [PMC free article] [PubMed] [Google Scholar]
- LI Y, SCHNABL K, GABLER SM, WILLERSHAUSER M, REBER J, KARLAS A, LAURILA S, LAHESMAA M, M UD, BAST-HABERSBRUNNER A, VIRTANEN KA, FROMME T, BOLZE F, O’FARRELL LS, ALSINA-FERNANDEZ J, COSKUN T, NTZIACHRISTOS V, NUUTILA P & KLINGENSPOR M 2018. Secretin-Activated Brown Fat Mediates Prandial Thermogenesis to Induce Satiation. Cell. [DOI] [PubMed] [Google Scholar]
- LIM S, HONEK J, XUE Y, SEKI T, CAO Z, ANDERSSON P, YANG X, HOSAKA K & CAO Y 2012. Cold-induced activation of brown adipose tissue and adipose angiogenesis in mice. Nat Protoc, 7, 606–15. [DOI] [PubMed] [Google Scholar]
- MARDINOGLU A, SHOAIE S, BERGENTALL M, GHAFFARI P, ZHANG C, LARSSON E, BACKHED F & NIELSEN J 2015. The gut microbiota modulates host amino acid and glutathione metabolism in mice. Mol Syst Biol, 11, 834. [DOI] [PMC free article] [PubMed] [Google Scholar]
- MARTINEZ-GURYN K, HUBERT N, FRAZIER K, URLASS S, MUSCH MW, OJEDA P, PIERRE JF, MIYOSHI J, SONTAG TJ, CHAM CM, REARDON CA, LEONE V & CHANG EB 2018. Small Intestine Microbiota Regulate Host Digestive and Absorptive Adaptive Responses to Dietary Lipids. Cell Host Microbe, 23, 458–469 e5. [DOI] [PMC free article] [PubMed] [Google Scholar]
- MARUVADA P, LEONE V, KAPLAN LM & CHANG EB 2017. The Human Microbiome and Obesity: Moving beyond Associations. Cell Host Microbe, 22, 589–599. [DOI] [PubMed] [Google Scholar]
- MINA AI, LECLAIR RA, LECLAIR KB, COHEN DE, LANTIER L & BANKS AS 2018. CalR: A Web-Based Analysis Tool for Indirect Calorimetry Experiments. Cell Metab, 28, 656–666 e1. [DOI] [PMC free article] [PubMed] [Google Scholar]
- MOLINARO A, CAESAR R, HOLM LM, TREMAROLI V, CANI PD & BACKHED F 2017. Host-microbiota interaction induces bi-phasic inflammation and glucose intolerance in mice. Mol Metab, 6, 1371–1380. [DOI] [PMC free article] [PubMed] [Google Scholar]
- NEIS EP, DEJONG CH & RENSEN SS 2015. The role of microbial amino acid metabolism in host metabolism. Nutrients, 7, 2930–46. [DOI] [PMC free article] [PubMed] [Google Scholar]
- OKADA K, LECLAIR KB, ZHANG Y, LI Y, OZDEMIR C, KRISKO TI, HAGEN SJ, BETENSKY RA, BANKS AS & COHEN DE 2016. Thioesterase superfamily member 1 suppresses cold thermogenesis by limiting the oxidation of lipid droplet-derived fatty acids in brown adipose tissue. Mol Metab, 5, 340–351. [DOI] [PMC free article] [PubMed] [Google Scholar]
- OPDEBEECK B, MAUDSLEY S, AZMI A, DE MARE A, DE LEGER W, MEIJERS B, VERHULST A, EVENEPOEL P, D’HAESE PC & NEVEN E 2019. Indoxyl Sulfate and p-Cresyl Sulfate Promote Vascular Calcification and Associate with Glucose Intolerance. J Am Soc Nephrol, 30, 751–766. [DOI] [PMC free article] [PubMed] [Google Scholar]
- PECK SC, DENGER K, BURRICHTER A, IRWIN SM, BALSKUS EP & SCHLEHECK D 2019. A glycyl radical enzyme enables hydrogen sulfide production by the human intestinal bacterium Bilophila wadsworthia. Proc Natl Acad Sci U S A, 116, 3171–3176. [DOI] [PMC free article] [PubMed] [Google Scholar]
- QUAST C, PRUESSE E, YILMAZ P, GERKEN J, SCHWEER T, YARZA P, PEPLIES J & GLOCKNER FO 2013. The SILVA ribosomal RNA gene database project: improved data processing and web-based tools. Nucleic Acids Res, 41, D590–6. [DOI] [PMC free article] [PubMed] [Google Scholar]
- RAMOS MG, BAMBIRRA EA, CARA DC, VIEIRA EC & ALVAREZ-LEITE JI 1997. Oral administration of short-chain fatty acids reduces the intestinal mucositis caused by treatment with Ara-C in mice fed commercial or elemental diets. Nutr Cancer, 28, 212–7. [DOI] [PubMed] [Google Scholar]
- RIDAURA VK, FAITH JJ, REY FE, CHENG J, DUNCAN AE, KAU AL, GRIFFIN NW, LOMBARD V, HENRISSAT B, BAIN JR, MUEHLBAUER MJ, ILKAYEVA O, SEMENKOVICH CF, FUNAI K, HAYASHI DK, LYLE BJ, MARTINI MC, URSELL LK, CLEMENTE JC, VAN TREUREN W, WALTERS WA, KNIGHT R, NEWGARD CB, HEATH AC & GORDON JI 2013. Gut microbiota from twins discordant for obesity modulate metabolism in mice. Science, 341, 1241214. [DOI] [PMC free article] [PubMed] [Google Scholar]
- ROTHWELL NJ & STOCK MJ 1979. A role for brown adipose tissue in diet-induced thermogenesis. Nature, 281, 31–5. [DOI] [PubMed] [Google Scholar]
- ROUND JL & MAZMANIAN SK 2009. The gut microbiota shapes intestinal immune responses during health and disease. Nat Rev Immunol, 9, 313–23. [DOI] [PMC free article] [PubMed] [Google Scholar]
- RUI L 2014. Energy metabolism in the liver. Compr Physiol, 4, 177–97. [DOI] [PMC free article] [PubMed] [Google Scholar]
- SAVAGE DC & DUBOS R 1968. Alterations in the mouse cecum and its flora produced by antibacterial drugs. J Exp Med, 128, 97–110. [DOI] [PMC free article] [PubMed] [Google Scholar]
- SCHONFELD P & WOJTCZAK L 2016. Short-and medium-chain fatty acids in energy metabolism: the cellular perspective. J Lipid Res, 57, 943–54. [DOI] [PMC free article] [PubMed] [Google Scholar]
- SEALE P 2015. Transcriptional Regulatory Circuits Controlling Brown Fat Development and Activation. Diabetes, 64, 2369–75. [DOI] [PMC free article] [PubMed] [Google Scholar]
- SEGATA N, IZARD J, WALDRON L, GEVERS D, MIROPOLSKY L, GARRETT WS & HUTTENHOWER C 2011. Metagenomic biomarker discovery and explanation. Genome Biol, 12, R60. [DOI] [PMC free article] [PubMed] [Google Scholar]
- SHERTZER HG, WOODS SE, KRISHAN M, GENTER MB & PEARSON KJ 2011. Dietary whey protein lowers the risk for metabolic disease in mice fed a high-fat diet. J Nutr, 141, 582–7. [DOI] [PMC free article] [PubMed] [Google Scholar]
- SMITH PM, HOWITT MR, PANIKOV N, MICHAUD M, GALLINI CA, BOHLOOLY YM, GLICKMAN JN & GARRETT WS 2013. The microbial metabolites, short-chain fatty acids, regulate colonic Treg cell homeostasis. Science, 341, 569–73. [DOI] [PMC free article] [PubMed] [Google Scholar]
- SOMM E, HENRY H, BRUCE SJ, AEBY S, ROSIKIEWICZ M, SYKIOTIS GP, ASRIH M, JORNAYVAZ FR, DENECHAUD PD, ALBRECHT U, MOHAMMADI M, DWYER A, ACIERNO JS JR., SCHOONJANS K, FAJAS L, GREUB G & PITTELOUD N 2017. beta-Klotho deficiency protects against obesity through a crosstalk between liver, microbiota, and brown adipose tissue. JCI Insight, 2. [DOI] [PMC free article] [PubMed] [Google Scholar]
- SONNENBURG ED & SONNENBURG JL 2014. Starving our microbial self: the deleterious consequences of a diet deficient in microbiota-accessible carbohydrates. Cell Metab, 20, 779–786. [DOI] [PMC free article] [PubMed] [Google Scholar]
- SPEAKMAN JR 2013. Measuring energy metabolism in the mouse - theoretical, practical, and analytical considerations. Front Physiol, 4, 34. [DOI] [PMC free article] [PubMed] [Google Scholar]
- STAFFAS A, BURGOS DA SILVA M, SLINGERLAND AE, LAZRAK A, BARE CJ, HOLMAN CD, DOCAMPO MD, SHONO Y, DURHAM B, PICKARD AJ, CROSS JR, STEIN-THOERINGER C, VELARDI E, TSAI JJ, JAHN L, JAY H, LIEBERMAN S, SMITH OM, PAMER EG, PELED JU, COHEN DE, JENQ RR & VAN DEN BRINK MRM 2018. Nutritional Support from the Intestinal Microbiota Improves Hematopoietic Reconstitution after Bone Marrow Transplantation in Mice. Cell Host Microbe, 23, 447–457 e4. [DOI] [PMC free article] [PubMed] [Google Scholar]
- STOCK MJ 1999. Gluttony and thermogenesis revisited. Int J Obes Relat Metab Disord, 23, 1105–17. [DOI] [PubMed] [Google Scholar]
- SUAREZ-ZAMORANO N, FABBIANO S, CHEVALIER C, STOJANOVIC O, COLIN DJ, STEVANOVIC A, VEYRAT-DUREBEX C, TARALLO V, RIGO D, GERMAIN S, ILIEVSKA M, MONTET X, SEIMBILLE Y, HAPFELMEIER S & TRAJKOVSKI M 2015. Microbiota depletion promotes browning of white adipose tissue and reduces obesity. Nat Med, 21, 1497–501. [DOI] [PMC free article] [PubMed] [Google Scholar]
- SWARTZ TD, DUCA FA, DE WOUTERS T, SAKAR Y & COVASA M 2012. Up-regulation of intestinal type 1 taste receptor 3 and sodium glucose luminal transporter-1 expression and increased sucrose intake in mice lacking gut microbiota. Br J Nutr, 107, 621–30. [DOI] [PubMed] [Google Scholar]
- TAUTENHAHN R, PATTI GJ, RINEHART D & SIUZDAK G 2012. XCMS Online: a web-based platform to process untargeted metabolomic data. Anal Chem, 84, 5035–9. [DOI] [PMC free article] [PubMed] [Google Scholar]
- THAISS CA, ITAV S, ROTHSCHILD D, MEIJER M, LEVY M, MORESI C, DOHNALOVA L, BRAVERMAN S, ROZIN S, MALITSKY S, DORI-BACHASH M, KUPERMAN Y, BITON I, GERTLER A, HARMELIN A, SHAPIRO H, HALPERN Z, AHARONI A, SEGAL E & ELINAV E 2016. Persistent microbiome alterations modulate the rate of post-dieting weight regain. Nature. [DOI] [PubMed] [Google Scholar]
- TSCHOP MH, SPEAKMAN JR, ARCH JR, AUWERX J, BRUNING JC, CHAN L, ECKEL RH, FARESE RV JR., GALGANI JE, HAMBLY C, HERMAN MA, HORVATH TL, KAHN BB, KOZMA SC, MARATOS-FLIER E, MULLER TD, MUNZBERG H, PFLUGER PT, PLUM L, REITMAN ML, RAHMOUNI K, SHULMAN GI, THOMAS G, KAHN CR & RAVUSSIN E 2012. A guide to analysis of mouse energy metabolism. Nat. Methods, 9, 57–63. [DOI] [PMC free article] [PubMed] [Google Scholar]
- U DIN M, SAARI T, RAIKO J, KUDOMI N, MAURER SF, LAHESMAA M, FROMME T, AMRI EZ, KLINGENSPOR M, SOLIN O, NUUTILA P & VIRTANEN KA 2018. Postprandial Oxidative Metabolism of Human Brown Fat Indicates Thermogenesis. Cell Metab, 28, 207–216 e3. [DOI] [PubMed] [Google Scholar]
- UKROPEC J, ANUNCIADO RP, RAVUSSIN Y, HULVER MW & KOZAK LP 2006. UCP1-independent thermogenesis in white adipose tissue of cold-acclimated Ucp1−/− mice. Biol Chem, 281, 31894–908. [DOI] [PubMed] [Google Scholar]
- USSAR S, FUJISAKA S & KAHN CR 2016. Interactions between host genetics and gut microbiome in diabetes and metabolic syndrome. Mol Metab, 5, 795–803. [DOI] [PMC free article] [PubMed] [Google Scholar]
- VON ESSEN G, LINDSUND E, CANNON B & NEDERGAARD J 2017. Adaptive facultative diet-induced thermogenesis in wild-type but not in UCP1-ablated mice. Am J Physiol Endocrinol Metab, 313, E515–E527. [DOI] [PubMed] [Google Scholar]
- VRIEZE A, VAN NOOD E, HOLLEMAN F, SALOJARVI J, KOOTTE RS, BARTELSMAN JF, DALLINGA-THIE GM, ACKERMANS MT, SERLIE MJ, OOZEER R, DERRIEN M, DRUESNE A, VAN HYLCKAMA VLIEG JE, BLOKS VW, GROEN AK, HEILIG HG, ZOETENDAL EG, STROES ES, DE VOS WM, HOEKSTRA JB & NIEUWDORP M 2012. Transfer of intestinal microbiota from lean donors increases insulin sensitivity individuals with metabolic syndrome. Gastroenterology, 143, 913–6 e7. [DOI] [PubMed] [Google Scholar]
- WALTERS W, HYDE ER, BERG-LYONS D, ACKERMANN G, HUMPHREY G, PARADA A, GILBERT JA, JANSSON JK, CAPORASO JG, FUHRMAN JA, APPRILL A & KNIGHT R 2016. Improved Bacterial 16S rRNA Gene (V4 and V4–5) and Fungal Internal Transcribed Spacer Marker Gene Primers for Microbial Community Surveys. mSystems, 1. [DOI] [PMC free article] [PubMed] [Google Scholar]
- WANG X, NIU C, LU J, LI N & LI J 2014. Hydrolyzed protein supplementation improves protein content and peroxidation of skeletal muscle by adjusting the plasma amino acid spectrums in rats after exhaustive swimming exercise: a pilot study. J Int Soc Sports Nutr, 11, 5. [DOI] [PMC free article] [PubMed] [Google Scholar]
- WEIR JB 1949. New methods for calculating metabolic rate with special reference to protein metabolism. J Physiol, 109, 1–9. [DOI] [PMC free article] [PubMed] [Google Scholar]
- WINIARSKA K, SZYMANSKI K, GORNIAK P, DUDZIAK M & BRYLA J 2009. Hypoglycaemic, antioxidative and nephroprotective effects of taurine in alloxan diabetic rabbits. Biochimie, 91, 261–70. [DOI] [PubMed] [Google Scholar]
- WOLF KJ, DAFT JG, TANNER SM, HARTMANN R, KHAFIPOUR E & LORENZ RG 2014. Consumption of acidic water alters the gut microbiome and decreases the risk of diabetes in NOD mice. J Histochem Cytochem, 62, 237–50. [DOI] [PMC free article] [PubMed] [Google Scholar]
- WORTHMANN A, JOHN C, RUHLEMANN MC, BAGUHL M, HEINSEN FA, SCHALTENBERG N, HEINE M, SCHLEIN C, EVANGELAKOS I, MINEO C, FISCHER M, DANDRI M, KREMOSER C, SCHEJA L, FRANKE A, SHAUL PW & HEEREN J 2017. Cold-induced conversion of cholesterol to bile acids in mice shapes the gut microbiome and promotes adaptive thermogenesis. Nat Med, 23, 839–849. [DOI] [PubMed] [Google Scholar]
- XIAO H, GULEN MF, QIN J, YAO J, BULEK K, KISH D, ALTUNTAS CZ, WALD D, MA C, ZHOU H, TUOHY VK, FAIRCHILD RL, DE LA MOTTE C, CUA D, VALLANCE BA & LI X 2007. The Toll-interleukin-1 receptor member SIGIRR regulates colonic epithelial homeostasis, inflammation, and tumorigenesis. Immunity, 26, 461–75. [DOI] [PubMed] [Google Scholar]
- YANG CY & TARNG DC 2018. Diet, gut microbiome and indoxyl sulphate in chronic kidney disease patients. Nephrology (Carlton), 23 Suppl 4, 16–20. [DOI] [PubMed] [Google Scholar]
- ZHANG F, HAO G, SHAO M, NHAM K, AN Y, WANG Q, ZHU Y, KUSMINSKI CM, HASSAN G, GUPTA RK, ZHAI Q, SUN X, SCHERER PE & OZ OK 2018. An Adipose Tissue Atlas: An Image-Guided Identification of Human-like BAT and Beige Depots in Rodents. Cell Metab, 27, 252–262 e3. [DOI] [PMC free article] [PubMed] [Google Scholar]
- ZIETAK M, KOVATCHEVA-DATCHARY P, MARKIEWICZ LH, STAHLMAN M, KOZAK LP & BACKHED F 2016. Altered Microbiota Contributes to Reduced Diet-Induced Obesity upon Cold Exposure. Cell Metab, 23, 1216–1223. [DOI] [PMC free article] [PubMed] [Google Scholar]
Associated Data
This section collects any data citations, data availability statements, or supplementary materials included in this article.
Supplementary Materials
Data Availability Statement
Gut microbiome sequence data are available from NCBI with BioProject accession number PRJNA589879 (https://www.ncbi.nlm.nih.gov/bioproject/).