

Abstract
Background:
Imaging research has not yet delivered reliable psychiatric biomarkers. One challenge, particularly among youth, is high comorbidity. This challenge might be met through canonical correlation analysis (CCA) designed to model mutual dependencies between symptom dimensions and neural measures. We map the multivariate associations that intrinsic functional connectivity manifests with pediatric symptoms of anxiety, irritability, and attention-deficit/hyperactivity disorder (ADHD) as common, impactful, co-occurring problems. We evaluate the replicability of such latent dimensions in an independent sample.
Methods:
We obtained ratings of anxiety, irritability, and ADHD, and 10 minutes of resting-state functional magnetic resonance imaging data, from two independent cohorts. Both cohorts (discovery: N=182; replication: N=326) included treatment-seeking youth with anxiety disorders, disruptive mood dysregulation disorder, ADHD, or without psychopathology. Functional connectivity was modeled as partial correlations among 216 brain areas. CCA, and independent-component analysis (ICA) jointly sought maximally-correlated, maximally-interpretable rsfMRI/clinical dimensions.
Results:
We identified seven canonical variates in the discovery and five in the replication cohort. Of these canonical variates, three exhibited similarities across datasets: two variates consistently captured shared aspects of irritability, ADHD, and anxiety, while the third was specific to anxiety. Across cohorts, canonical variates did not relate to specific resting-state networks but comprised edges interconnecting established networks within and across both hemispheres.
Conclusions:
Findings revealed two replicable types of clinical variates, one related to multiple symptom dimensions and a second relatively specific to anxiety. Both types involved a multitude of broadly-distributed, weak brain connections as opposed to strong connections encompassing known resting-state networks.
Keywords: intrinsic brain connectivity, latent dimension, anxiety, irritability, disruptive behavior, youth
Introduction
The current study combines the dimensional assessment of psychiatric symptoms, potentially providing a better fit to neural measures than diagnostic categories (1-5) with resting-state functional magnetic resonance imaging (rsfMRI). We exploit advanced multivariate statistical techniques to identify highly correlated latent dimensions of psychopathology and brain connectivity. This is essential in identifying neural mechanisms that mediate clinical symptoms, and thus represent appropriate targets for novel interventions. Such work is particularly needed among youth, where seeds of later-life psychopathology present as common, often co-occurring problems (6). Specifically, the study focuses on the neural correlates of pediatric irritability, attention deficit hyperactivity disorder (ADHD), and anxiety given prior evidence of both shared and distinct neural correlates among these symptom domains (1).
We use canonical correlation analysis (CCA) to simultaneously model dimensional clinical and neural measures (7,8). This approach might be more sensitive to complex relations among symptom and neural data than alternative approaches. This includes approaches used previously that first model covariance structure among clinical dimensions before relating these latent symptom dimensions to pre-selected brain networks (1).
Recent studies apply CCA to clinical and rsfMRI data in adults and adolescents (9,10). The current study extends such work in three ways. First, while prior work applied CCA to rsfMRI-data in treatment-seeking adults (10) and community-dwelling youth (9), we target treatment-seeking youth identified by clinicians. Second, prior work in youth confirmed that this method can differentiate well-established, but vastly distinct, clinical domains such as psychosis, emotional, and behavioral problems. Here, we focus on three more closely-related and often-comorbid domains: irritability, ADHD, and anxiety. We test a hypothesis consistent with previous work utilizing other latent variable approaches combined with task-based fMRI (1,2): CCA yields latent phenotypes that capture both unique and shared aspects of irritability, ADHD, and anxiety. However, unlike past work, brain connectivity is not evoked by highly controlled tasks in the current study. Thus, more broadly-distributed neural circuitry correlates are expected in the current study, as compared to correlates in previous studies.
Finally, as a third extension of past work, we evaluate the latent variables' replicability using novel sampling and analytic techniques. Prior CCA studies find replicable associations when discovery and replication cohorts represent subsets of the same sample (9,10) but not when they arise from independent cohorts (11). Robustness against sampling variability is essential for clinical applications of CCA, which possesses exploratory components that can make replication difficult. Thus, the current study utilizes data from two independent cohorts of treatment-seeking youth assessed with similar methods. We treat the smaller sample (N=182) as the discovery dataset, as it was assessed with homogenous imaging parameters. The larger cohort (N=326) assessed with heterogeneous imaging parameters serves as a replication dataset (12). Moreover, we employ analytic techniques that leverage independent-component analysis (ICA) to improve interpretability of the canonical variates (13). Finally, we utilized a novel, stepwise permutation scheme (14) that addresses limitations in other CCA studies concerning the handling of nuisance variables and possible inflation of type-I errors.
Methods
Participants
Both samples comprised healthy volunteers (HV) and youth diagnosed with an anxiety disorder (ANX), disruptive mood dysregulation disorder (DMDD), or attention-deficit/hyperactivity disorder (ADHD) by licensed clinicians using the Kiddie Schedule for Affective Disorders and Schizophrenia (K-SADS) (15). Exclusion criteria were neurological disorders, autism and bipolar spectrum disorders, psychosis, substance use, MRI contraindications, and full-scale IQ < 70. Anxiety was assessed using the parent- and youth-reported ratings of the five subscales of the Screen for Child Anxiety Related Disorders (SCARED) (16). Irritability was assessed with the first six items of the parent- and youth-reported Affective Reactivity Index (ARI) (17). Parents quantified ADHD symptoms such as inattention and disruptive behavior through seven items assessed with the ADHD subscale of the Conners (18) in the discovery and the Child Behavior Checklist (19) in the replication sample. These 29 ratings of anxiety, irritability, and disruptive behavior (18 parent-reported, 11 self-reported) were used as input for the joint CCA+ICA.
Samples were similar in terms of sex ratios, proportions of anxiety disorders, oppositional defiant disorder, medication-free-to-medication-use ratios, and levels of parent-reported symptoms of irritability, ADHD, and anxiety. However, the discovery sample was older, had a higher IQ, a lower proportion of ADHD cases, a higher proportion of diagnosis-free and DMDD cases, and lower self-reported irritability and anxiety. Both cohorts were ethnically diverse and were recruited from urban, semi-rural, and rural areas (Figure 1, Supplement).
Figure 1.

Demographics and clinical characteristics of the discovery and replication samples.
Acquisition and preprocessing of imaging data
Discovery sample data were acquired at one site with two identical 3.0T scanners. The replication sample comprised data from multiple 1.5T and 3.0T scanners. A high-resolution T1-weighted structural image and 10 minutes of blood-oxygen-level-dependent (BOLD) changes during rest were collected from all participants, although sequences varied between samples and within the replication dataset (Supplement). Quality of the imaging data was assessed using MRIQC (20). The automated pipeline FMRIPREP (21) was used for preprocessing. We refrained from motion scrubbing and used instead ICA-AROMA, which reduces motion-related artifacts at least as well (22,23).
Functional connectivity
The rsfMRI-connectivity network comprised 216 nodes derived from a 200-region parcellation scheme (24), augmented by 8 subcortical regions per hemisphere obtained using FreeSurfer segmentation (nucleus accumbens, nucleus caudatus, pallidum, putamen, amygdala, hippocampus, thalamus and ventral diencephalon) (25). Framewise displacement and spatial standard deviation of the temporal difference data (26), but not global signal, were regressed out from the time series. Functional connectivity was quantified using partial correlations, which offer an estimate of direct (as opposed to indirect or shared) connectivity between each pair of nodes (edges). As the resulting network matrices are symmetric, only half of the edges (i.e., 23,220) were analyzed.
CCA, ICA, and permutation testing
Covariates (age, sex, race, IQ, psychotropic medication, and scanner for the discovery sample; additionally, site and sequence type for the replication sample) were regressed out from both imaging and clinical variables before dimensionality reduction. All 29 symptom ratings were included; dimensionality of rsfMRI was reduced using principal component analysis (PCA) prior to CCA (7). Residuals were projected to a lower dimensional space where data are exchangeable, thus mitigating spurious dependencies among observations introduced by residualization (14).
Given two sets of variables (here, imaging data, Y, and symptom ratings, X), CCA seeks linear mixtures within each set (i.e., canonical variables, CVs; U = Y×A and V = X×B), such that each resulting mixture (U) from one set is maximally correlated with a corresponding mixture (V) from the other set, but uncorrelated with all other mixtures in either set. We use upper-case letters U and V to represent the whole set of canonical variables on the imaging and clinical side, respectively, and lower-case letters, followed by subscripts to indicate the order of the canonical correlations, from higher to smaller, uk and vk, to denote specific latent variables.
It is possible that small perturbations in the original data could lead to arbitrary rotations of the CCA solutions. To mitigate the problem and aid interpretability, we subjected the stacked canonical variables to independent component analysis (ICA), seeking canonical variables that were not only orthogonal, but also statistically independent. The joint CCA+ICA procedure was performed using a modification of a recently proposed algorithm for permutation inference for CCA (14), thus allowing not only characterization and better disambiguation of the resulting CVs, but also valid statistical inference (details in the Supplement). Below, where we refer to results of CCA, these are to be understood as results of the joint inference using CCA+ICA.
As the number of CVs is determined by the smallest input dataset, we obtained 29 CVs. Statistical significance was determined using 10000 permutations. In the permutation test, for each estimated CV (post-ICA), variance already explained by CVs with stronger, significant canonical correlations were removed in an iterative procedure (14). Canonical correlations were considered significant at alpha = 0.05 after family wise error rate (FWER) correction using a closed testing procedure. The non-symmetric redundancy index (27), which gives the mean variance of the clinical data explained by imaging data, and vice versa, is reported in the Supplement.
Replicability
Replicability of the CVs was determined based on three criteria: (1) stability within the same dataset across variations in the number of PCA components that entered CCA relative to the sample size (input-to-participant ratio), (2) similarities of latent clinical patterns, and (3) similarities of latent connectivity patterns identified independently in the two samples. A prior CCA study in youth reported replicability only for clinical but not rsfMRI patterns (9); thus, we decided to evaluate the replicability of the clinical and the connectivity patterns as separate criteria.
To evaluate the first criterion, we performed three analyses that varied the input-to-participant ratios. The primary analyses used an input-to-participant ratio of 1:2, which translated into 64 rsfMRI components explaining 75% of the between-subject variance in rsfMRI-connectivity in the discovery sample. In the replication cohort, 134 rsfMRI components were used; these explained only 57% of the variance, possibly due to more unstructured noise in this dataset. This primary analysis was supplemented by two secondary analyses using input-to-participant ratios of 1:3 and 1:4 thereby reducing risks of overfitting, at the expense of explaining less variance. This was accomplished by using fewer imaging principal components as input to the CCA. Results were compared across the three ratios by examining cross-correlations among CCA components (e.g., corr(v1∣1:2, YD×a1∣1:3) and corr(u1∣1:2, XD×b1∣1:3)). Statistical significance was determined using 10000 permutations, with a threshold of pFWER < .05 within each set of comparisons. As psychiatric symptoms might relate to components that explain relatively little variance in the imaging data, we will also discuss CVs that solely replicated at the 1:3 ratio but could be found in the replication cohort.
To test the second and third criteria, we used joint CCA+ICA in the replication dataset. Canonical weights from each dataset were applied to the input data from the other dataset; these products were then correlated with the CVs identified in that dataset [e.g., corr(v1∣D, YD × a1∣R) and corr(u1∣D, XD×b1∣R)]. Clinical and connectivity patterns were considered replicable when both the application of weights from the discovery to the replication dataset and the application of weights from the replication to discovery dataset yielded statistically-significant associations. We used 10000 permutations to establish significance. However, thresholds differed for clinical and connectivity patterns. We used a stringent threshold of pFWER < .05 to determine replicability of the imaging and clinical patterns; additionally, we also investigate a more lenient threshold of puncorr < .05 for replicability of the connectivity pattern. This decision was motivated by two factors. First, a prior CCA study finding replicable clinical patterns did not report replicable connectivity patterns across two subsets of a single sample (9). This raises questions as to whether any evidence of replicability can be detected with even liberal statistical thresholds. Second, in the current study, significant differences exist between cohorts in all metrics quantifying the quality of the imaging data (Figure S1); this contrasts with the broadly similar profiles for symptom ratings (Table S1 and Figure S1).
Interpretation of canonical variables
To interpret the significant CVs, we investigated their correlations with the residualized input data. These correlations between latent variables derived from the CCA and input data (i.e., symptom ratings, connectivity matrices) are henceforth referred to as canonical loadings. Consistent with prior studies (7,28), we focused on clinical items with loadings ∣r∣ > 0.2 , resembling a small to moderate effect, to interpret and label key CVs. However, we extend this approach by limiting our focus to replicating clinical loadings, i.e., loadings ∣r∣ > 0.2 that could be observed across samples. Similarly, we emphasize edge loadings that replicate across samples. However, given the differences in the quality of the imaging data across samples, we apply a more lenient threshold of ∣r∣ > 0.15 to the replication cohort.
Results
In the discovery cohort, seven CVs associated symptoms to rsfMRI-connectivity (CV1∣D: r = 0.74, pFWER = 0.0029; CV2∣D: r = 0.73, pFWER = 0.0045; CV3∣D: r = 0.73, pFWER = 0.0092; CV4∣D: r = 0.70, pFWER = 0.0175; CV5∣D: r = 0.69, pFWER = 0.0245; CV6∣D: r = 0.69, pFWER = 0.0340; CV7∣D: r = 0.68, pFWER = 0.0497; Figure S2). These seven CVs explained 27.7% of symptom-level variance and 8.1% of rsfMRI-connectivity variance. Joint CCA+ICA in the replication dataset generated five CVs (CV1∣R: r = 0.75, pFWER = 0.0198; CV2∣R: r = 0.72, pFWER = 0.0311; CV3∣R: r = 0.72, pFWER = 0.0321; CV4∣R: r = 0.72, pFWER = 0.0364; CV5∣R: r = 0.71, pFWER = 0.0440; Supplementary Figure S11) that represented 18.8% of the variance in the clinical data and 0.9% of the variance in the rsfMRI-connectivity data.
Our key hypothesis concerned identifying both cross-dimension and specific variates. Consistent with this hypothesis, latent clinical phenotypes (v1-7∣D and v1-5∣R) could be differentiated in terms of specificity of associated symptoms. In both datasets, we observed latent variables that loaded ∣r∣ > 0.2 exclusively on several items from the anxiety domain (v7∣D, v1∣R) and others capturing aspects shared across two (v3∣D, v4∣D, v3∣R) or all three domains (v1∣D, v2∣D, v5∣D, v6∣D, v2∣R, v4∣R, v5∣R; Figure 2, Supplementary Figure S12, Table S7 and S12).
Figure 2. Clinical loadings in the discovery dataset.
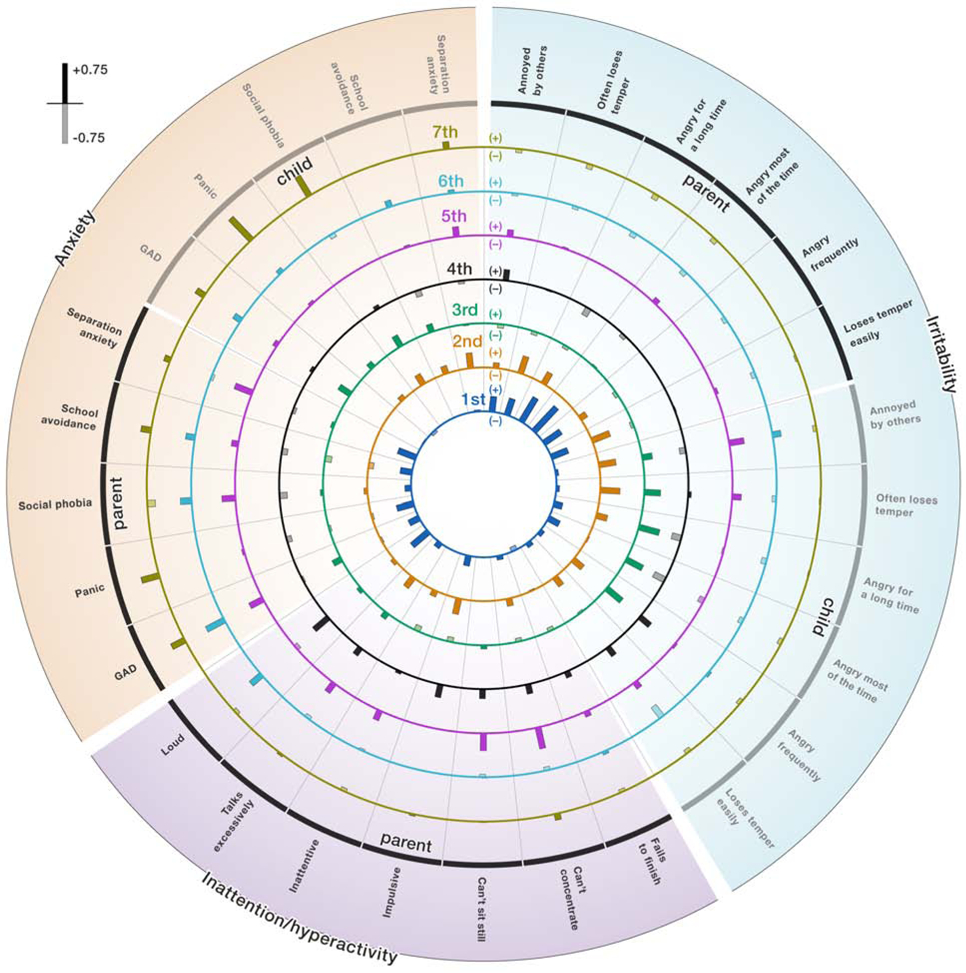
Associations between the latent dimensions and symptoms in the domains of anxiety, irritability, and behavioral problems. Each of the seven concentric circles shows the positive (solid fill) and negative correlations (transparent fill) between the canonical variate and the original symptom ratings as bars. The length of the bars indicates the strength of the association. Exact numbers of the loadings are provided in the Supplementary Table S3. Note that CCA results are characterized by sign indeterminacy meaning that it is valid to flip the sign for an entire latent dimension, which will affect the directions of the correlations.
All latent variables (u1-7∣D and u1-5∣R) involved distinct, albeit broadly distributed, connectivity patterns with many connections between well-known resting-state networks within and across both hemispheres. All u1-7∣D and u1-5∣R showed equal numbers of negative and positive correlations with edges. Connectivity patterns were denser in the discovery relative to the replication dataset applying a threshold of ∣r∣ > 0.2 (discovery dataset: u1∣D: 1404 connections, u2∣D: 2068 connections, u3∣D: 5602 connections, u4∣D: 2490 connections, u5∣D: 2968 connections, u6∣D: 2656 connections and u7∣D: 3226 connections; replication dataset: u1∣R: 150 connections; u2∣R: 130 connections, u3∣R: 74 connections; u4∣R: 74 connections; u5∣R: 132 connections; Figures 3, 4, 5, Supplementary Figures S5-10,S13-17).
Figure 3. Replicable, transdimensional latent variable (CV3∣D, CV5∣R).

Scatter plots on panel A show canonical variate 3 from the discovery dataset and 5 from the replication dataset, which represent linear combinations of brain connectivity scores obtained during rsfMRI in the horizontal axis, and linear combinations of clinical scores derived from symptom ratings in the vertical axis. Panel B shows clinical loadings ∣r∣ > 0.2 in for both datasets, showing the same symptoms but an informant effect. Dark red indicates symptoms associated with the latent dimension in both datasets. Panel C depicts edges in red that load strongly positively on u3∣D and u5∣R. Edges that load strongly negatively on u3∣D and u5∣R are depicted in blue. Given baseline differences in the strength of the connectivity patterns, connectivity maps were thresholded at ∣r∣ > 0.2 for the discovery sample and at ∣r∣ > 0.15 for the replication sample. Next only edges that loaded highly positively or negatively in both datasets were retained for this figure.
Figure 4. Replicable, shared aspects of disruptive behavior and irritability (CV4∣D, CV4∣R).

Scatter plots on panel A show canonical variate 4 from the discovery dataset and 4 from the replication dataset, which represent linear combinations of brain connectivity scores obtained during rsfMRI in the horizontal axis, and linear combinations of clinical scores derived from symptom ratings in the vertical axis. Panel B shows clinical loadings ∣r∣ > 0.2 in for both datasets. Dark red indicates symptoms associated with the latent dimension in both datasets. Panel C depicts edges in red that load strongly positively on u4∣D and u4∣R. Edges that load strongly negatively on u4∣D and u4∣R are depicted in blue. Given baseline differences in the strength of the connectivity patterns, connectivity maps were thresholded at ∣r∣ > 0.2 for the discovery sample and at ∣r∣ > 0.15 for the replication sample. Next only edges that loaded highly positively or negatively in both datasets were retained for this figure.
Figure 5. Replicable, anxiety-specific latent variable (CV7∣D, CV3∣R).

Scatter plots on panel A show canonical variate 7 from the discovery dataset and 3 from the replication dataset, which represent linear combinations of brain connectivity scores obtained during rsfMRI in the horizontal axis, and linear combinations of clinical scores derived from symptom ratings in the vertical axis. Panel B shows clinical loadings ∣r∣ > 0.2 in for both datasets. Dark red indicates symptoms associated with the latent dimension in both datasets. Panel C depicts edges in red that load strongly positively on u7∣D and u3∣R. Edges that load strongly negatively on u7∣D and u3∣R are depicted in blue. Given baseline differences in the strength of the connectivity patterns, connectivity maps were thresholded at ∣r∣ > 0.2 for the discovery sample and at ∣r∣ > 0.15 for the replication sample. Next only edges that loaded highly positively or negatively in both datasets were retained for this figure.
We highlight three CVs passing all three replicability criteria highlighted in the methods section, and two latent dimensions passing only the first two replicability criteria (stability within the same dataset and replicability of clinical patterns). Full results concerning replicability appear in supplementary material (Supplementary Tables S8-11, S13-20). We will describe replicable CVs based on the specificity of the clinical patterns ranging from shared between all three clinical domains to anxiety-specific.
Irritability, anxiety and ADHD (CV2∣D, CV3∣D and CV5∣R)
In both samples, CV2∣D, CV3∣D and CV5∣R were robust to variations in the participant-to-input ratios (all r > .67, all pFWER = .0001, Supplementary Tables S8-11, S13-16). Clinical patterns associated with v3∣D and v5∣R were negatively associated across samples (corr(v5∣R, XR×b3∣D): r=−0.20, puncorr=0.0006, pFWER=0.0175; corr(v3∣D, XD×b5∣R): r=−0.19, puncorr= 0.0141, pFWER=0.3797). Both v3∣D and v5∣R loaded >.20 on the irritability and anxiety domains, where close inspection suggested informant effects; v3∣D captured youth-reported whereas v5∣R loaded on parent-reported irritability and anxiety (Figure 3, Supplementary Table S7 and S12). Yet, connectivity patterns correlated across samples (corr(u5∣R, YR×a3∣D): r=0.12, puncorr=0.0375, pFWER=0.7425; corr(u3∣D, YD×a5∣R): r=0.32, puncorr=0.0001, pFWER=0.0007). Inspection of the connectivity loadings showed that, in both samples, this transdimensional phenotype was associated with edges interconnecting established resting-state networks within and across both hemispheres (Supplementary Figure S18).
Interestingly, v2∣D was also robust against variations in participant-to-input ratios, and showed substantial positive loadings >.20 on the same three parent-report items from the irritability domain (“Often loses temper”, “Angry for a long time”, “Loses temper easily”) and one from the ADHD domain as v5∣R (“Talks excessively”; Figures 2 and S12, Supplementary Tables S7 and S12). Moreover, clinical loadings for CV2∣D and CV5∣R significantly correlated across cohorts (corr(v5∣R, XR×b2∣D): r=0.25, puncorr=0.0001, pFWER=0.0004; corr(v2∣D, XD×b5∣R): r=0.45, puncorr=0.0001, pFWER=0.0001). However, within each sample, connectivity patterns associated with the two latent phenotypes were different, although brain connectivity data informed latent clinical dimensions.
Disruptive behavior and irritability (CV4∣D and CV4∣R)
In both cohorts, CV4∣D and CV4∣R were robust to input-to-participant ratio variations (all r>.31, pFWER=.0001, Supplementary Tables S8-11, S13-16). Similarities between CV4∣D and CV4∣R arose when applying clinical weights from the discovery to the replication dataset (corr(v4∣R, XR×b4∣D): r=0.19, puncorr=0.0006, pFWER=0.0229) and vice versa (corr(v4∣D, XD×b4∣R): r=0.27, puncorr=0.0009, pFWER=0.0190). Connectivity patterns were also associated using an uncorrected threshold, when applying weights from the replication to the discovery sample (corr(u4∣D, YD×a4∣R): r=0.19, puncorr=0.0108, pFWER=0.3494).
Across samples, CV4∣D and CV4∣R loaded > .20 on three items characterizing disruptive behavior from the ADHD domain (“Can’t sit still”, “Impulsive”, “Loud”), and one item from the domain of irritability (“Loses temper easily”). Further, CV4∣D and CV4∣R loaded both negatively on one irritability item (“Angry most of the time”; Figures 4, Supplementary Tables S7 and S12). Inspection of substantial edge loadings in both samples indicated strong representations in the variate of connections among nodes in motor, attention, default-mode and temporal-parietal networks (Supplementary Figure S19).
Anxiety (CV7∣D and CV1∣R, CV3∣R)
The last set of replicable CVs comprised CV7∣D in the discovery cohort, which correlated with both CV1∣R and CV3∣R in the replication data set. All three CVs emerged in analyses using input-to-participant ratios of 1:2 and 1:3 (all r>.31. all pFWER=.0001, Supplementary Tables S8-11, S13-16). Associations manifested between v7∣D and v3∣R for clinical (corr(v7∣D, XD×b3∣R): r=0.31, puncorr=0.0001, pFWER=0.0017; corr(v3∣R, XR×b7∣D): r=0.44, puncorr=0.0001, pFWER=0.0001) and for connectivity patterns, when applying an uncorrected threshold (corr(u7∣D, YD×a3∣R): r=0.19, puncorr=0.0136, pFWER=0.4120; corr(u3∣R, YR×a7∣D): r=0.10, puncorr=0.0696, pFWER=1). For V7∣D and v3∣R, both variates loaded >.20 on the same three anxiety items (“parent-reported GAD”, “youth-reported GAD”, “youth-reported panic”; Figure 5, Supplementary Tables S7 and S12). Replicable edges connected subcortical structures with the dorsal-attention and motor network as well as the control and default-mode networks with sensory, motor and attention networks (Supplementary Figure S20).
Similarities in the clinical patterns were also observed between v7∣D and v1∣R. Both loaded >.20 on four items measuring anxiety (“parent-reported GAD”, “parent-reported panic”, “parent-reported school avoidance”, “youth-reported panic”; corr(v7∣D, XD×b1∣R): r=0.45, puncorr=0.0001, pFWER=0.0001; corr(v1∣R, XR×b7∣D): r=0.51, puncorr=0.0001, pFWER=0.0001; Figures 2, S12; Supplementary Tables S7, S12). However, unlike for u3∣R associated connectivity patterns between u7∣D and u1∣R were uncorrelated even when the uncorrected threshold was applied.
Discussion
Three key findings emerge from this study. First, analyses found seven CVs in a discovery dataset; four showed stability within the discovery dataset and replicability of clinical patterns in an independent sample; three CVs demonstrated at least weak signs of replicability for the associated rsfMRI connectivity patterns. This suggests the presence of meaningful relations between patterns of intrinsic brain connectivity and psychiatric symptom dimensions in youth. Second, the three most strongly replicable CVs from the discovery dataset varied in clinical specificity; one loaded on all three domains, the second captured shared aspects of irritability and ADHD, and the third loaded specifically on anxiety. Finally, canonical variates showed weak to modest associations with multiple edges spanning widely-distributed brain areas.
Pediatric psychopathology involves broadly correlated symptom dimensions (1-6). Dimensions of irritability, ADHD, and anxiety are particularly closely interrelated. Understanding of these cross-dimension relations may follow from research on shared and unique neural correlates. Past work in this area assessed symptom covariation independent of imaging data before then relating symptoms to task-based imaging patterns (1). CCA connects clinical and neural measures simultaneously to identify more complex relations (7,8). We used rating scales employed in the previous task-based fMRI research examining unique and shared dimensions of pediatric psychopathology (1). Using these measures, the current rsfMRI study identified two variates loading strongly on multiple clinical dimensions and a third loading strongly only on anxiety items. Thus, consistent with our hypotheses based on past studies, current findings demonstrate coexisting cross-dimensional and domain-specific neural correlates in treatment-seeking youth.
The detection of only anxiety, but not irritability or ADHD-specific neural correlates in the current study could reflect many factors. These include differences between task-based and rsfMRI methods, differential sensitivity in CCA to particular domain-specific features, or biological features of anxiety that generate specific rsfMRI signatures. Additional imaging research might seek to refine clinical groupings based on replicable cross-study patterns for these and other interrelated dimensions.
Findings in the current and past CCA studies exhibited both similarities and differences. Cross-sample correlations for clinical loadings in the current study were notably similar in magnitude to those for variables involving emotion symptoms in the only other study of cross-domain pediatric psychopathology (9). Given differences across the two studies, such consistency speaks to the robust nature of pediatric emotional-problem manifestations. The previous study also found strong cross-sample replicability for a pure externalizing factor, which did not emerge in the current study. Failure to detect this factor might reflect lesser diversity in targeted symptoms or larger proportions of treatment-seeking cases in the current study. Finally, unlike past research in treatment-seeking adults, the current study showed cross-sample replicability of latent clinical and connectivity patterns; a finding that might reflect age-related differences or distinct analytic approaches.
Interesting rsfMRI patterns manifested. Connectivity related to clinical dimensions was broadly distributed, involving hundreds of relatively weakly loading interhemispheric and within-hemisphere connections spanning distinct networks. Moreover, while within-sample stability was acceptable in the discovery sample, rsfMRI patterns minimally correlated across datasets. Interestingly, such weak replicability manifested alongside stronger replicability for clinical patterns, themselves defined by relations with rsfMRI. Replicable clinical patterns defined by less replicable rsfMRI patterns raise important questions for future studies. First, greater cross-sample differences existed for the fMRI than clinical assessments. Thus, it remains unclear if homogeneous cross-sample imaging methods could generate improved rsfMRI replicability. Second, replicable clinical patterns defined by minimally replicable fMRI patterns could arise from “many-to-one” mappings between neural and clinical variables. Such configurations commonly underlie brain-behavior relations at many spatial scales. Thus, it remains unclear if such “many-to-one” patterns also represent a common motif for mental disorders.
From the clinical perspective, broadly distributed connectivity disturbances might require a diverse set of approaches to identify targets for novel interventions. Currently, therapies such as cognitive training or neural stimulation target functions in specific networks (29-31). However, at least for pediatric anxiety, irritability, and disruptive behavior, broadly distributed patterns may better represent the nature of connectivity disturbances during rest than patterns limited to particular networks. The focus on broad connectivity disturbances as opposed to particular networks might increase effect sizes of studies relating clinical domains intrinsic brain connectivity.
Findings inform analytic decisions in future CCA studies. Different analyses within and across samples utilized different rsfMRI data, accounted for different amounts of overall rsfMRI variance, and yielded differences in CV structure. That input affects output is not unique to CCA. However, no ground truth informs selection of PCA-based or other input components for CCA. Thus, risk of overfitting is balanced against risk of omitting relevant variance through dimensionality reduction. Over-fitting is reduced by ensuring proportionally more research participants than variables (32,33). However, particularly in moderately-sized datasets, dimensionality reduction can exclude rsfMRI variance components that, even if small, powerfully relate clinical dimensions to connectivity patterns. Such factors create challenges that likely impact findings. The presence of modestly-replicable clinical loadings across analyses in the current study suggests the promise of continued iterative work targeting these challenges.
One major limitation of the present study are the medium sample sizes. Also, differences in scanners, imaging-acquisition parameters and data-quality indices introduced noise which decreased the probability of fully replicating findings across datasets. In effect, larger proportions of rsfMRI-connectivity variance are explained in the smaller but homogeneous discovery sample, as evidenced by PCA. Further, we did not include youth-ratings of ADHD symptoms or ratings of depressive symptoms, another highly prevalent symptom dimension in youth.
Our findings implicate co-occurring trans-dimensional and anxiety-specific neural features in pediatric psychopathology. Results further suggest that pediatric clinical dimensions reflect widely distributed brain connectivity patterns. Thus, as with genetic correlates, neural correlates of some pediatric-psychopathology dimensions may reflect hundreds of individually-small associations.
Supplementary Material
KEY RESOURCES TABLE
| Resource Type | Specific Reagent or Resource | Source or Reference | Identifiers | Additional Information |
|---|---|---|---|---|
| Add additional rows as needed for each resource type | Include species and sex when applicable. | Include name of manufacturer, company, repository, individual, or research lab. Include PMID or DOI for references; use “this paper” if new. | Include catalog numbers, stock numbers, database IDs or accession numbers, and/or RRIDs. RRIDs are highly encouraged; search for RRIDs at https://scicrunch.org/resources. | Include any additional information or notes if necessary. |
| Antibody | N/A | N/A | N/A | |
| Bacterial or Viral Strain | N/A | N/A | N/A | |
| Biological Sample | N/A | N/A | N/A | |
| Cell Line | N/A | N/A | N/A | |
| Chemical Compound or Drug | N/A | N/A | N/A | |
| Commercial Assay Or Kit | N/A | N/A | N/A | |
| Deposited Data; Public Database | N/A | participants from the discovery sample did not consent to data sharing; data from the replication cohort is available from the Child Mind Institute (http://fcon_1000.projects.nitrc.org/indi/cmi_healthy_brain_network/) | sub-NDARAA948VFH sub-NDARAC349YUC sub-NDARAD481FXF sub-NDARAE199TDD sub-NDARAG340ERT sub-NDARAH948UF0 sub-NDARAM277WZT sub-NDARAP176AD1 sub-NDARAR025WX4 sub-NDARAT100AEQ sub-NDARAU708TL8 sub-NDARAV610EY3 sub-NDARAV894XWD sub-NDARAW179AYF sub-NDARAX283MAK sub-NDARBA507GCT sub-NDARBA521RA8 sub-NDARBF805EHN sub-NDARBG188RA5 sub-NDARBJ159HXB sub-NDARBK082PDD sub-NDARBL444FBA sub-NDARBM173BJG sub-NDARBT607PZL sub-NDARBU112XZE sub-NDARBU730PN8 sub-NDARBV167RMU sub-NDARBV364MBC sub-NDARBX121UM9 sub-NDARBX974XDR sub-NDARBZ216FW8 sub-NDARCA789EE0 sub-NDARCF052AE0 sub-NDARCG159AAP sub-NDARCG808HDJ sub-NDARCJ007GF8 sub-NDARCJ363KLE sub-NDARCK647MU6 sub-NDARCL080RHP sub-NDARCR582GKJ sub-NDARCU118LMX sub-NDARCV606ZZ5 sub-NDARCW611MK5 sub-NDARCW946WNE sub-NDARCZ947WU5 sub-NDARDE283PLC sub-NDARDH086ZKK sub-NDARDJ825GBP sub-NDARDL511UND sub-NDARDN770HY6 sub-NDAREC182WW2 sub-NDAREC648WEL sub-NDAREF164ZUJ sub-NDAREF893ZM8 sub-NDAREG561ML5 sub-NDAREK395BM3 sub-NDAREK947FYP sub-NDAREL063PMX sub-NDAREM018TJQ sub-NDAREM731BYM sub-NDAREN667YTZ sub-NDAREU551GPC sub-NDAREV527ZRF sub-NDARFB107PVH sub-NDARFB969EMV sub-NDARFF644ZGD sub-NDARFG851ZNZ sub-NDARFG943GVZ sub-NDARFJ179MG0 sub-NDARFL411AT1 sub-NDARFM619GTV sub-NDARFR109LKT sub-NDARFT834NT1 sub-NDARFU395UBW sub-NDARFV780ABD sub-NDARFW292PBD sub-NDARFY612EMR sub-NDARGA507DCC sub-NDARGB000CW8 sub-NDARGB040MGR sub-NDARGE536BGD sub-NDARGF445UFB sub-NDARGF543PM2 sub-NDARGH074MU6 sub-NDARGH775KF5 sub-NDARGJ395FKP sub-NDARGT022BEW sub-NDARGU667MCK sub-NDARGV781AMW sub-NDARGX760NYV sub-NDARHA387FPM sub-NDARHB764VZ2 sub-NDARHC462NGR sub-NDARHE899FJV sub-NDARHG152GZC sub-NDARHJ034LDM sub-NDARHJ126UW2 sub-NDARHK506HLW sub-NDARHL238VL2 sub-NDARHP176DPE sub-NDARHR372GJ7 sub-NDARHR944BBY sub-NDARHW216PER sub-NDARHX877BLQ sub-NDARHX934KJ5 sub-NDARHY676RYH sub-NDARHZ923PAH sub-NDARJA262HTY sub-NDARJA788CH7 sub-NDARJB233RL7 sub-NDARJC514CE0 sub-NDARJC559WW5 sub-NDARJF517HC8 sub-NDARJG298YVA sub-NDARJH367WKY sub-NDARJH707GJM sub-NDARJM036PVX sub-NDARJM708VGE sub-NDARJN531EN3 sub-NDARJP146GT9 sub-NDARJP489HCE sub-NDARJT615WM7 sub-NDARJT730WP0 sub-NDARJX258XF0 sub-NDARJZ526HN3 sub-NDARKB290YNY sub-NDARKC880ZHY sub-NDARKF442GZ5 sub-NDARKF615JNZ sub-NDARKG859AGN sub-NDARKM551DA4 sub-NDARKR195PL9 sub-NDARKV807EMJ sub-NDARKW010CT2 sub-NDARKX346VTV sub-NDARLA516PH1 sub-NDARLB547HJD sub-NDARLF032LXH sub-NDARLF142AF5 sub-NDARLF446MT5 sub-NDARLM196YRG sub-NDARLP181HLA sub-NDARLR030EW6 sub-NDARLR620FW6 sub-NDARLY483UNZ sub-NDARLZ104NDT sub-NDARMA449YB6 sub-NDARMB216LA6 sub-NDARME656MTN sub-NDARME930DE7 sub-NDARMF116AFR sub-NDARMH249AWF sub-NDARMH763YZD sub-NDARMK825WAX sub-NDARMM782KJK sub-NDARMM905VYR sub-NDARMN376BMF sub-NDARMT882AWE sub-NDARMV247HRA sub-NDARMW178UDD sub-NDARMW252AJW sub-NDARMX032AU3 sub-NDARMY533CYM sub-NDARMY967HNA sub-NDARNB824ARJ sub-NDARND348HB3 sub-NDARNF873FCV sub-NDARNG689AAP sub-NDARNH147WGN sub-NDARNH200DA6 sub-NDARNJ633HHX sub-NDARNJ894VH2 sub-NDARNK005BRN sub-NDARNK322PHW sub-NDARNK329VC3 sub-NDARNK740ZVM sub-NDARNL599TMZ sub-NDARNM783ZVV sub-NDARNR734JZH sub-NDARNT042GRA sub-NDARNT541VT2 sub-NDARNT572CMD sub-NDARNT939YMG sub-NDARNU770PM5 sub-NDARNV332JF2 sub-NDARNW218ZBU sub-NDARNZ615UEU sub-NDARPC817XZ5 sub-NDARPD568LHV sub-NDARPE056ACA sub-NDARPE596LZL sub-NDARPF118ABV sub-NDARPF937BDQ sub-NDARPH513LP3 sub-NDARPP337KUQ sub-NDARPV303LAX sub-NDARPW482TVE sub-NDARPW786GC4 sub-NDARPZ621ZLE sub-NDARRA537FWW sub-NDARRA719CPH sub-NDARRB338YZ0 sub-NDARRB359CRR sub-NDARRC295CHW sub-NDARRE333EKT sub-NDARRG199RU4 sub-NDARRH725XYA sub-NDARRJ763GUF sub-NDARRK882CLT sub-NDARRL218DJ5 sub-NDARRL315KV3 sub-NDARRN619WHY sub-NDARRP592GHK sub-NDARRP818DWL sub-NDARRU979UBW sub-NDARRV837BZQ sub-NDARRY268AF2 sub-NDARRY280KNW sub-NDARRZ199KNG sub-NDARTB755MF5 sub-NDARTC652JK4 sub-NDARTD925CTP sub-NDARTF833WXB sub-NDARTG035JK8 sub-NDARTG679NKQ sub-NDARTH610GMK sub-NDARTK185PBH sub-NDARTK657DV6 sub-NDARTK834FT9 sub-NDARTR365NCY sub-NDARTU768MY1 sub-NDARTU777GVV sub-NDARTW850GHU sub-NDARTX012JHM sub-NDARTX659HAF sub-NDARUD764NFJ sub-NDARUF069EHR sub-NDARUG492VF0 sub-NDARUJ779NM0 sub-NDARUM569EV1 sub-NDARUP249AMD sub-NDARUR987CDM sub-NDARUT470BM4 sub-NDARUT792WX7 sub-NDARUV263YB5 sub-NDARUX408KJ1 sub-NDARUY730ANT sub-NDARVB811FVD sub-NDARVC195NLH sub-NDARVG132NF6 sub-NDARVG436WGG sub-NDARVG461LA2 sub-NDARVG971CHH sub-NDARVH033CA4 sub-NDARVN363NNQ sub-NDARVN646NZP sub-NDARVU320XJZ sub-NDARVU683CTN sub-NDARVX162AZU sub-NDARVX547MA0 sub-NDARWA513WM2 sub-NDARWE145GN9 sub-NDARWF122UUJ sub-NDARWG831JJ8 sub-NDARWJ414WB8 sub-NDARWK065NJ9 sub-NDARWM319UU2 sub-NDARWM656UWL sub-NDARWN691CG7 sub-NDARWP595TE6 sub-NDARWR247CE1 sub-NDARWV155PRG sub-NDARWV677EFC sub-NDARWW005GCU sub-NDARWX380JJK sub-NDARWZ709DLY sub-NDARXC418YG7 sub-NDARXE193CZ1 sub-NDARXF497LYF sub-NDARXF956ZU6 sub-NDARXH597ML1 sub-NDARXK462WRZ sub-NDARXL697DA6 sub-NDARXP557DLJ sub-NDARXR346UT5 sub-NDARXR637JER sub-NDARXU437UFZ sub-NDARXY337ZH9 sub-NDARXY532ZTT sub-NDARXZ685TU4 sub-NDARXZ902NFM sub-NDARYA030ZG7 sub-NDARYC466ER1 sub-NDARYE221LZB sub-NDARYG874EKA sub-NDARYH110YV9 sub-NDARYH480GTD sub-NDARYH697TPA sub-NDARYJ638RTN sub-NDARYL272HDW sub-NDARYL758JGG sub-NDARYM257RR6 sub-NDARYM277DEA sub-NDARYM334BZ5 sub-NDARYM586MYN sub-NDARYN174NPH sub-NDARYN484LLR sub-NDARYN595JMA sub-NDARYU120NDA sub-NDARYU323ZDJ sub-NDARYX806FL1 sub-NDARYY664KHF sub-NDARZD099KWW sub-NDARZE963MEU sub-NDARZG263HRK sub-NDARZG690NHH sub-NDARZK601NG9 sub-NDARZK732FZ0 sub-NDARZL855WVA sub-NDARZM903TNL sub-NDARZN277NR6 sub-NDARZR567HWG sub-NDARZT772PU4 sub-NDARZT940RZG sub-NDARZW873DN3 sub-NDARZY668NMV |
|
| Genetic Reagent | N/A | N/A | N/A | |
| Organism/Strain | N/A | N/A | N/A | |
| Peptide, Recombinant Protein | N/A | N/A | N/A | |
| Recombinant DNA | N/A | N/A | N/A | |
| Sequence-Based Reagent | N/A | N/A | N/A | |
| Software; Algorithm | N/A | https://github.com/JuliaLinke/Linke_jointCCAICA | N/A | |
| Transfected Construct | N/A | N/A | N/A | |
| Other |
Acknowledgements
The authors’ research is supported by the National Institute of Mental Health (NIMH) Intramural Research Program (ZIAMH002786, ZIAMH002778, ZIAMH002782), conducted under NIH Clinical Study Protocols described at ClinicalTrials.gov (NCT02531893, NCT00025935, and NCT00018057).
Footnotes
Publisher's Disclaimer: This is a PDF file of an unedited manuscript that has been accepted for publication. As a service to our customers we are providing this early version of the manuscript. The manuscript will undergo copyediting, typesetting, and review of the resulting proof before it is published in its final form. Please note that during the production process errors may be discovered which could affect the content, and all legal disclaimers that apply to the journal pertain.
Competing interests
The authors report no biomedical financial interests or potential conflicts of interest.
References
- 1.Kircanski K, White LK, Tseng W-L, Wiggins JL, Frank HR, Sequeira S, et al. (2018): A Latent Variable Approach to Differentiating Neural Mechanisms of Irritability and Anxiety in Youth. JAMA Psychiatry 75: 631. [DOI] [PMC free article] [PubMed] [Google Scholar]
- 2.Shanmugan S, Wolf DH, Calkins ME, Moore TM, Ruparel K, Hopson RD, et al. (2016): Common and Dissociable Mechanisms of Executive System Dysfunction Across Psychiatric Disorders in Youth. Am J Psychiatry 173: 517–526. [DOI] [PMC free article] [PubMed] [Google Scholar]
- 3.Kaczkurkin AN, Moore TM, Calkins ME, Ciric R, Detre JA, Elliott MA, et al. (2018): Common and dissociable regional cerebral blood flow differences associate with dimensions of psychopathology across categorical diagnoses. Mol Psychiatry 23: 1981–1989. [DOI] [PMC free article] [PubMed] [Google Scholar]
- 4.Stoddard J, Tseng W-L, Kim P, Chen G, Yi J, Donahue L, et al. (2017): Association of Irritability and Anxiety With the Neural Mechanisms of Implicit Face Emotion Processing in Youths With Psychopathology. JAMA Psychiatry 74: 95. [DOI] [PMC free article] [PubMed] [Google Scholar]
- 5.Tseng W-L, Deveney CM, Stoddard J, Kircanski K, Frackman AE, Yi JY, et al. (2019): Brain Mechanisms of Attention Orienting Following Frustration: Associations With Irritability and Age in Youths. Am J Psychiatry 176: 67–76. [DOI] [PMC free article] [PubMed] [Google Scholar]
- 6.Angold A, Costello EJ, Erkanli A (1999): Comorbidity. J Child Psychol Psychiatry 40: 57–87. [PubMed] [Google Scholar]
- 7.Smith SM, Nichols TE, Vidaurre D, Winkler AM, Behrens TEJ, Glasser MF, et al. (2015): A positive-negative mode of population covariation links brain connectivity, demographics and behavior. Nat Neurosci 18: 1565–1567. [DOI] [PMC free article] [PubMed] [Google Scholar]
- 8.Wang H-T, Smallwood J, Mourao-Miranda J, Xia CH, Satterthwaite TD, Bassett DS, Bzdok D (2018): Finding the needle in high-dimensional haystack: A tutorial on canonical correlation analysis. ArXiv181202598 Cs Stat. Retrieved June 23, 2020, from http://arxiv.org/abs/1812.02598 [DOI] [PubMed] [Google Scholar]
- 9.Xia CH, Ma Z, Ciric R, Gu S, Betzel RF, Kaczkurkin AN, et al. (2018): Linked dimensions of psychopathology and connectivity in functional brain networks. Nat Commun 9: 3003. [DOI] [PMC free article] [PubMed] [Google Scholar]
- 10.Drysdale AT, Grosenick L, Downar J, Dunlop K, Mansouri F, Meng Y, et al. (2017): Resting-state connectivity biomarkers define neurophysiological subtypes of depression. Nat Med 23: 28–38. [DOI] [PMC free article] [PubMed] [Google Scholar]
- 11.Dinga R, Schmaal L, Penninx BWJH, van Tol MJ, Veltman DJ, van Velzen L, et al. (2019): Evaluating the evidence for biotypes of depression: Methodological replication and extension of. Neuroimage Clin 22: 101796. [DOI] [PMC free article] [PubMed] [Google Scholar]
- 12.Alexander LM, Escalera J, Ai L, Andreotti C, Febre K, Mangone A, et al. (2017): An open resource for transdiagnostic research in pediatric mental health and learning disorders. Sci Data 4: 170181. [DOI] [PMC free article] [PubMed] [Google Scholar]
- 13.Miller KL, Alfaro-Almagro F, Bangerter NK, Thomas DL, Yacoub E, Xu J, et al. (2016): Multimodal population brain imaging in the UK Biobank prospective epidemiological study. Nat Neurosci 19: 1523–1536. [DOI] [PMC free article] [PubMed] [Google Scholar]
- 14.Winkler AM, Renaud O, Smith SM, Nichols TE (2020): Permutation Inference for Canonical Correlation Analysis. NeuroImage 117065. [DOI] [PMC free article] [PubMed] [Google Scholar]
- 15.Kaufman J, Birmaher B, Brent D, Rao U, Flynn C, Moreci P, et al. (1997): Schedule for Affective Disorders and Schizophrenia for School-Age Children-Present and Lifetime Version (K-SADS-PL): Initial Reliability and Validity Data. J Am Acad Child Adolesc Psychiatry 36: 980–988. [DOI] [PubMed] [Google Scholar]
- 16.Birmaher B, Khetarpal S, Brent D, Cully M, Balach L, Kaufman J, Neer SM (1997): The Screen for Child Anxiety Related Emotional Disorders (SCARED): Scale Construction and Psychometric Characteristics. J Am Acad Child Adolesc Psychiatry 36: 545–553. [DOI] [PubMed] [Google Scholar]
- 17.Stringaris A, Goodman R, Ferdinando S, Razdan V, Muhrer E, Leibenluft E, Brotman MA (2012): The Affective Reactivity Index: a concise irritability scale for clinical and research settings: The Affective Reactivity Index. J Child Psychol Psychiatry 53: 1109–1117. [DOI] [PMC free article] [PubMed] [Google Scholar]
- 18.Conners CK, Pitkanen J, Rzepa SR (2011): Conners 3rd Edition (Conners 3; Conners 2008). In: Kreutzer JS, DeLuca J, Caplan B, editors. Encyclopedia of Clinical Neuropsychology. New York, NY: Springer New York, pp 675–678. [Google Scholar]
- 19.Achenbach TM, Rescorla LA (2001): Manual for the ASEBA School-Age Forms & Profiles: An Integrated System of Multi-Informant Assessment. Burlington: University of Vermont: Research Center for Children, Youth and Families. [Google Scholar]
- 20.Esteban O, Birman D, Schaer M, Koyejo OO, Poldrack RA, Gorgolewski KJ (2017): MRIQC: Advancing the automatic prediction of image quality in MRI from unseen sites ((Bernhardt BC, editor)). PLOS ONE 12: e0184661. [DOI] [PMC free article] [PubMed] [Google Scholar]
- 21.Esteban O, Markiewicz CJ, Blair RW, Moodie CA, Isik AI, Erramuzpe A, et al. (2019): fMRIPrep: a robust preprocessing pipeline for functional MRI. Nat Methods 16: 111–116. [DOI] [PMC free article] [PubMed] [Google Scholar]
- 22.Ciric R, Wolf DH, Power JD, Roalf DR, Baum GL, Ruparel K, et al. (2017): Benchmarking of participant-level confound regression strategies for the control of motion artifact in studies of functional connectivity. NeuroImage 154: 174–187. [DOI] [PMC free article] [PubMed] [Google Scholar]
- 23.Parkes L, Fulcher B, Yücel M, Fornito A (2018): An evaluation of the efficacy, reliability, and sensitivity of motion correction strategies for resting-state functional MRI. NeuroImage 171:415–436. [DOI] [PubMed] [Google Scholar]
- 24.Schaefer A, Kong R, Gordon EM, Laumann TO, Zuo X-N, Holmes AJ, et al. (2018): Local-Global Parcellation of the Human Cerebral Cortex from Intrinsic Functional Connectivity MRI. Cereb Cortex 28: 3095–3114. [DOI] [PMC free article] [PubMed] [Google Scholar]
- 25.Fischl B, Salat DH, Busa E, Albert M, Dieterich M, Haselgrove C, et al. (2002): Whole Brain Segmentation. Neuron 33: 341–355. [DOI] [PubMed] [Google Scholar]
- 26.Power JD, Mitra A, Laumann TO, Snyder AZ, Schlaggar BL, Petersen SE (2014): Methods to detect, characterize, and remove motion artifact in resting state fMRI. NeuroImage 84: 320–341. [DOI] [PMC free article] [PubMed] [Google Scholar]
- 27.Stewart D, Love W (1968): A general canonical correlation index. Psychol Bull 70: 160–163. [DOI] [PubMed] [Google Scholar]
- 28.Alnæs D, Kaufmann T, Marquand AF, Smith SM, Westlye LT (2019): Patterns of Socio-Cognitive Stratification and Perinatal Risk in the Child Brain. Neuroscience. 10.1101/839969 [DOI] [PMC free article] [PubMed] [Google Scholar]
- 29.Craske MG, Treanor M, Conway CC, Zbozinek T, Vervliet B (2014): Maximizing exposure therapy: An inhibitory learning approach. Behav Res Ther 58: 10–23. [DOI] [PMC free article] [PubMed] [Google Scholar]
- 30.Hanlon CA, Dowdle LT, Henderson JS (2018): Modulating Neural Circuits with Transcranial Magnetic Stimulation: Implications for Addiction Treatment Development ((Nader MA, editor)). Pharmacol Rev 70: 661–683. [DOI] [PMC free article] [PubMed] [Google Scholar]
- 31.White LK, Sequeira S, Britton JC, Brotman MA, Gold AL, Berman E, et al. (2017): Complementary Features of Attention Bias Modification Therapy and Cognitive-Behavioral Therapy in Pediatric Anxiety Disorders. Am J Psychiatry 174: 775–784. [DOI] [PMC free article] [PubMed] [Google Scholar]
- 32.Pituch KA, Stevens JP (2016): Applied Multivariate Statistics for the Social Sciences, 6th ed. New York, NY: Routledge. [Google Scholar]
- 33.Tabachnick BG, Fidell LS (2001): Using Multivariate Statistics. Needham Heights, MA: Allyn and Bacon. [Google Scholar]
Associated Data
This section collects any data citations, data availability statements, or supplementary materials included in this article.