

Abstract
Background
Non‐alcoholic fatty liver (NAFL) disease (NAFLD) is the most common chronic liver disease in the world. While most subjects have ‘inert’ NAFL, a subset will progress to non‐alcoholic steatohepatitis (NASH) and its life‐threatening complications. A substantial body of literature supports that a low muscle mass, low strength, and/or muscle fatty infiltration (myosteatosis) are associated with NAFLD severity. Here, we evaluated the muscle compartment in NASH preclinical models to decipher the kinetics of muscle alterations in relation with liver disease progression.
Methods
We developed and validated a micro‐computed tomography‐based methodology to prospectively study skeletal muscle mass and density in muscle and liver (i.e. reflecting fatty infiltration) in a high‐throughput and non‐invasive manner in three preclinical NAFLD/NASH rodent models: fat aussie (FOZ) mice fed a high‐fat diet (FOZ HF), wild‐type (WT) mice fed a high‐fat high‐fructose diet (WT HFF), and WT mice fed a high‐fat diet (WT HF). We compared them with WT mice fed a normal diet (WT ND) used as controls.
Results
‐FOZ HF with fibrosing NASH had sarcopenia characterized by a reduced muscle strength when compared with WT HF and WT HFF with early NASH and WT ND controls (165.2 ± 5.2 g vs. 237.4 ± 11.7 g, 256 ± 5.7 g, and 242.9 ± 9.3 g, respectively, P 60; 0.001). Muscle mass or strength was not lower in FOZ HF, WT HF, and WT HFF with early NASH than in controls. Myosteatosis was present in FOZ HF with fibrosing NASH, but also in FOZ HF, WT HF, and WT HFF with early NASH (muscle density = 0.50 ± 0.02, 0.62 ± 0.02, 0.70 ± 0.05, and 0.75 ± 0.03, respectively, with P 60; 0.001 when compared with respective controls). Myosteatosis degree was strongly correlated with NAFLD activity score (r = −0.87, n = 67, P 60; 0.001). In multivariate analysis, the association between myosteatosis and NASH was independent from homeostatic model assessment of insulin resistance and visceral fat area (P 60; 0.05). Myosteatosis degree powerfully discriminated NASH from benign NAFL and normal liver (area under the receiver operating characteristic = 0.96, n = 67, P 60; 0.001).
Conclusions
Taken together, our data support that there is no sarcopenia in obese mice with early NASH. In contrast, the severity of myosteatosis reflects on hepatocellular damage and inflammation during early NASH development. This observation prompts us to exploit myosteatosis as a novel non‐invasive marker of NASH.
Keywords: NAFLD, Steatohepatitis, Muscle density, Myosteatosis, Sarcopenia, Muscle, Muscle fat, Micro‐CT, Obesity
Introduction
Non‐alcoholic fatty liver (NAFL) disease (NAFLD) is the most common chronic liver disease in the world. 1 , 2 , 3 NAFLD encompasses a spectrum of diseases ranging from NAFL, affecting 25% of the world adult population, 1 , 3 to non‐alcoholic steatohepatitis (NASH) that will sooner or later lead to fibrosis and eventually to end‐stage liver disease and hepatocellular cancer. 1 Today, except if severe fibrosis is present, tools are lacking to identify among NAFLD patients those with NASH and thus at risk of progressive liver disease. 1 , 3 Examination of a liver biopsy is the only mean to diagnose the transition. 4
Almost all chronic diseases are associated with alterations of the muscle compartment. A low muscle mass, low strength, and/or severe muscle fatty infiltration (often designated as myosteatosis) are clearly recognized as powerful indicators of the disease prognosis. 5 Liver diseases are no exception. A broad literature has already linked sarcopenia 6 , 7 (used abusively as a synonym for mere low muscle mass in most liver studies) and myosteatosis to prognosis in cirrhosis. 8 , 9 , 10 , 11 Hence, it is now suggested to take into account muscle parameters in the evaluation of patients for liver transplantation. 9 , 12 , 13 Highly cited studies have expanded on this literature with strong data supporting the presence of muscle alterations in NAFLD patients with liver fibrosis. 11 , 14 , 15 , 16 , 17 , 18 , 19 , 20 , 21 , 22 They reported that a low muscle mass, low strength and/or myosteatosis are associated with fibrosis severity in NAFLD. 11 , 14 , 15 , 16 , 17 , 18 , 19 , 20 , 21 , 22 , 23 Nonetheless, whether muscle alterations are mere consequences of severe liver dysfunction or whether they precede or accompany liver disease progression is unknown. These questions generate a large interest in the field of NAFLD. 11 , 19 , 24 We need longitudinal data to address such hypotheses. However, because of the long time‐course of NAFLD progression in humans and the lack of muscle data at asymptomatic early disease stages, it is unrealistic to obtain such data in humans.
To unravel the sequence of events, we therefore characterized muscles and liver in three validated preclinical models of NAFLD/NASH. We used high‐fat (HF) diet‐fed fat aussie (FOZ) (FOZ HF), HF high‐fructose diet‐fed wild‐type (WT) mice (WT HFF), and HF diet‐fed WT mice (WT HF). We purposedly neglected models with amino acid‐deficient diets or genetic models that have innate disrupted leptin signalling to exclude potential bias for muscle compartment alterations. 19 , 25 FOZ HF, WT HFF, and WT HF mice exhibit obesity, insulin resistance, liver steatosis, and recapitulate key histological NASH features after 4, 16, and 34 weeks of diet, respectively. With this study, we discovered that sarcopenia is not present in early NASH. In contrast, severe muscle fatty infiltration (i.e. myosteatosis) was a consistent, specific, and early marker of NASH in three preclinical models. Thus, our data foster the exploitation of myosteatosis as a novel non‐invasive indicator of NASH in NAFLD.
Materials and methods
Animal and diets
The FOZ mouse strain on a non‐obese diabetic mice B10 background 26 was bred and maintained at a constant temperature of 22°C and exposed at all times to a 12 h light/12 h dark cycle. Heterozygous mice (−/+) were used for breeding and homozygous FOZ (−/−) (n = 48) and WT (+/+) (n = 89) male littermates for the dietary experiments. Soon after weaning (at 5 weeks of age noted as Time 0 in our timeline) mice were turned on a HF diet (60% of calories from fat, 0.03% cholesterol—Research Diets D12492), HF diet supplemented with 30% fructose in drinking water (HFF) or kept on a rodent chow [normal diet (ND), 10% of calories from fat; Carfil Quality, Oud‐Turnhout, Belgium] (Supporting information, Figure S1A). At Time 0 and once a month, we recorded body weight, glycaemia and insulinemia; we measured food intake; and we performed a whole‐body computed tomography (CT) scan to evaluate the muscle and liver compartment non‐invasively. Groups of n = 5–9 mice were sacrificed at relevant time points. At the time of sacrifice, mice were anaesthetised (ketamine/xylazine), and blood was withdrawn by cardiac puncture. Liver and muscles (tibialis anterior, extensor digitorum longus, soleus, gastrocnemius, quadriceps, and erector spinae/quadratus lumborum) were quickly harvested and weighted; and samples were snap frozen in liquid nitrogen and stored at −80°C until analyses, fixed in 4% formalin and embedded in paraffin (liver and muscles) or directly embedded in optimal cutting temperature compound, and frozen for histological analyses. FOZ ND data are shown inFigure S2 for information but will not be presented hereafter for simplification as they exhibited the same liver and muscle phenotype as WT HF. All experiments have been performed in accordance with the Animal Research: Reporting of In Vivo Experiments guidelines. Anthropometric data and detail histological analysis of the animals of this cohort have been published in De Rudder et al. 27 The animals were handled according to the guidelines for humane care of laboratory animals established by the Université catholique de Louvain in accordance with European regulations, and the study protocol was approved by the university ethics committee (2016/UCL/MD/003).
Metabolic parameters and biochemical analyses
Glucose and insulin levels were monthly monitored on tail blood using a glucometer (Accu‐Chek) and a commercial ELISA test (Mercodia AB, Sweden), respectively. Homeostatic model assessment of insulin resistance (HOMA‐IR) was calculated as [glycaemia (mmol/L) × insulinemia (mU/L)]/22.5. 28 Food consumption was measured over a 7 day period once a month and divided by the number of animals in the cage (n = 5–6). We reported energy intake in kilocalorie per mouse per day. Lipids were extracted from 50 mg of liver or 100 mg of muscle (erector spinae/quadratus lumborum) using methanol and chloroform, and total lipids were quantitated using the vanillin–phosphoric acid reaction. 29 Results were normalized on weighted muscle or liver.
Micro‐computed tomography
Once a month, we performed micro‐CT on mice anaesthetized with isoflurane to monitor changes in body composition, skeletal muscle mass, skeletal muscle, and liver fatty infiltration. Scanning was performed with a Skyscan 1278 (Bruker micro‐CT, Kontich, Belgium) at 50 μm voxel resolution using a source voltage of 65 kV and a current of 770 μA. Aluminium filter was set on 1 mm to optimize contrast while minimizing dose. Rotation step for the X‐ray source was set on 0.7°. Average scanning time per animal was 2.5 min, allowing for very high throughput. Raw images were then reconstructed with NRecon to 3D cross‐sectional image data sets using the following parameters: beam hardening to 10%, smoothing to 2%, minimum for CS to Image Conversion to 0%, maximum to 0.02%. Analyses of reconstructed images were performed using SkyScan software (CTan), and segmentation of different tissue compartments was based on specific tissue density in Hounsfield units (HU). Three types of analyses were performed on micro‐CT reconstructed data sets. Whole body analysis: whole body fat volume, whole body lean volume (muscles and organs), and whole‐body bone volume, all reported in cubic centimetre. μCT‐estimated body weight was computed by adding the volumetric density of fat free mass (1.05 g/cm3), fat mass (0.95 g/cm3), and bone mass (1.92 g/cm3) multiplied by their measured volume. 30 Single slice‐based analysis: The surface (mm2) and density (in HU) of erector spinae/quadratus lumborum and psoas muscle, here designed as ‘dorsal muscle’, were semi‐automatically measured. First, two regions of interest were manually drawn on the dorsal muscle area at L4 and L5. Then, a grey value threshold (30 to 97) was applied to exclude non‐lean tissue (i.e. mostly bone). Finally, muscle area and density (transformed in HU) measures at L4 and L5 were saved and respectively averaged. We computed the relative dorsal muscle area by normalizing dorsal muscle area (mm2) by body weight (g). Visceral fat was semi‐automatically measured at L4 using manual region of interest delineation and grey value threshold (30 to 57). Virtual liver biopsy was performed by placing a 3D cylindrical region of interest (±1.3 cm3) in the liver avoiding large vessels, and the mean density (HU) of the entire volume was automatically computed. In each animal, dorsal muscle and liver density were normalized to spleen density (an internal invariant control). The muscle‐to‐spleen ratio and the liver‐to‐spleen ratio are referred to as the muscle and the liver density, respectively.
Muscle strength
A grip strength test measured the combined strength of the forelimb and hindlimb using a grid connected to a sensor (Panlab‐Bioseb, Vitrolles, France). The mice were gently laid on the top of a grid inclined at 45° and were pulled back steadily until the grip was released down the complete length of the grid. Force was tested three to five times sequentially and retested again 20 min later. Results are presented as the mean of the two highest values of absolute force recorded for each test.
Histology, immunohistochemistry, and immunofluorescence
Formalin‐fixed paraffin‐embedded sections stained with haematoxylin and eosin or Sirius red were used for histological evaluation of the liver and NAFLD activity score (NAS), blindly assessed as per Kleiner et al., 31 or for fibrosis assessment, respectively. Fibrosis area was automatically assessed using a dedicated software (Biocellvia, France) and expressed as the ratio of the area of stained collagen fibres vs. the area of the liver section in percentage as reported for this cohort in De Rudder et al. 27
Non‐alcoholic steatohepatitis diagnosis was defined according to the SAF algorithm; thus, samples with NAS ≥ 3 with at least 1 point in each sub‐score (i.e. steatosis, inflammation, and ballooning) were considered as NASH while those with at least 1 point in steatosis were considered as NAFL. 32
Wheat‐germ agglutinin (RL‐1022, Vector) was immunodetected on 4 μm thick paraffin sections of quadriceps muscle to measure fibre size. Slides were scanned using Pannoramic 250 Flash III scanner (3DHISTECH), and the fibre00027;s size was measured on the entire sections using an in‐house macro on the image analysis tool Author Version 2017.2 (Visiopharm, Denmark).
Statistics
All data are presented as mean ± SEM. Statistical analyses were performed using a two‐tailed Student00027;s t test, a one‐way analysis of variance (ANOVA), or a two‐way ANOVA (mixed model) followed by Bonferroni00027;s post‐hoc using GraphPad Prism 8 software. Multivariate analyses were performed on SPSS (v24) using binary logistic regression. Differences were considered significant at values of P 60; 0.05.
Results
Sarcopenia associates with fibrosing non‐alcoholic steatohepatitis, but not with early non‐alcoholic steatohepatitis
After 34 weeks of HF diet, WT and FOZ had severe obesity (52.9 ± 2.3 g and 62.4 ± 2.1 g, respectively) (Figure 1A) associated with early NASH in WT HF and with fibrosing NASH in FOZ HF mice (Figures 1B and S3A,B). Chow‐fed WT (WT ND) used as controls had a normal weight and liver. FOZ HF mice with fibrosing NASH had lower muscle mass than WT HF with early NASH (Figure 1C). Accordingly, the size of the muscle fibres was smaller in quadriceps of FOZ HF (median size 2219.3 μm2) compared with WT HF (median size 2858 μm2) (Figure 1D). Muscle mass was similar in FOZ HF with NASH and in controls ( 1C,D . Muscle strength was 30% lower in FOZ HF (165.2 ± 5.2 g) than in WT HF (237.4 ± 11.7 g) (Figure 1E). Obese WT mice on a HF diet had increased muscle mass (Figure 1C) and muscle fibre size (Figure 1D), but similar grip strength than chow‐fed controls (Figure 1E). Hence, muscle strength was preserved at the expense of increased muscle mass in WT HF. Thus, low muscle mass and strength are not present in early NASH but may rather associate with severe fibrotic liver disease.
FIGURE 1.
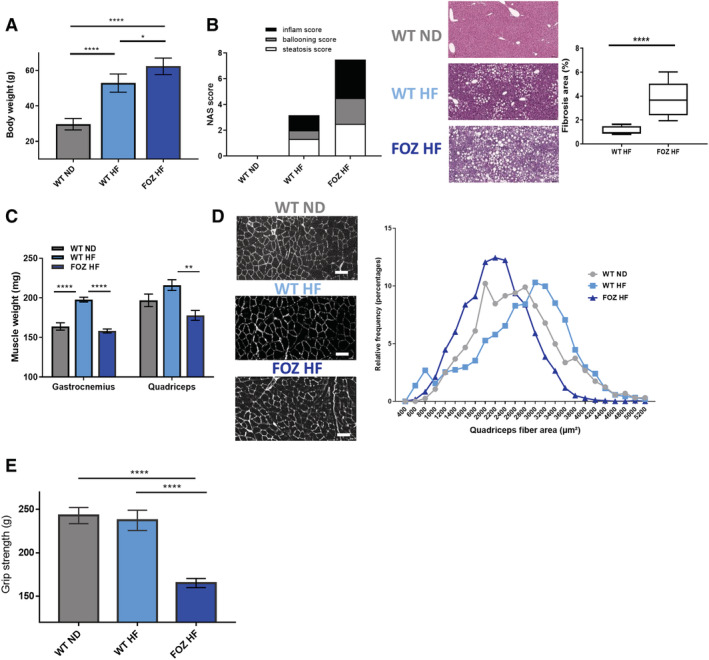
Fibrosing non‐alcoholic steatohepatitis is associated with severe muscle alterations in high‐fat (HF) diet‐fed fat aussie (FOZ HF) mice. (A) Body weight of wild‐type (WT) normal diet (WT ND), WT HF, and FOZ HF mice after 34 weeks of diet (n = 6 WT ND, n = 5 WT HF, n = 5 FOZ HF, one‐way ANOVA). (B) Left, histological non‐alcoholic fatty liver disease activity score (NAS) performed on haematoxylin and eosin (H38;E)‐stained liver sections. Center, representative histological pictures, scale bar = 100 μm. Right, fibrosis area percentage calculated on entire liver sections (n = 3–4 per group). Line, median value; box, 25–75% percentile; whiskers, min and max. (C) Gastrocnemius and quadriceps muscle weight in WT ND, WT HF, and FOZ HF (n = 6 WT ND, n = 5 WT HF, n = 5 FOZ HF, one‐way ANOVA). (D) Left, paraffin cross‐section of quadriceps with myofibers stained with wheat‐germ agglutinin (WGA). Scale bar = 50 μm. Right, histogram of relative frequency distribution (%) of myofibers size (WT ND n = 4, mean = 2632.8 ± 20.3 μm2 and median = 2579 μm2; WT HF n = 4, mean = 2749 ± 19.5 μm2 and median = 2858.5 μm2; FOZ HF n = 3, mean = 2221.8 ± 14.9 μm2 and median = 2219.3 μm2). WT ND, WT HF, and FOZ HF mean fibre sizes are all significantly different from each other with P 60; 0.0001 (one‐way ANOVA). (E) Absolute grip strength (n = 4–9 animals per group, one‐way ANOVA). All data are mean ± SEM. *P 60; 0.05, **P 60; 0.01, ***P 60; 0.001, ****P 60; 0.0001.
Micro‐computed tomography is an effective tool to evaluate body composition, liver steatosis, and muscle alterations non‐invasively
To evaluate the kinetics of muscle alterations in relation to liver disease progression in NAFLD mouse models, we searched for a non‐invasive methodology to enable longitudinal follow‐up of liver and muscles changes. We chose micro‐CT as this tool has previously been validated for body composition measurements (i.e. fat free, fat, and bone mass) in rodent models. 33 Of note, we previously reported that micro‐CT derived liver densities accurately reflect liver lipid content and steatosis. 27 We first used micro‐CT to measure whole body fat mass and fat‐free mass (Figures 2A,B and S4) and found an excellent agreement between micro‐CT‐estimated and measured body weight (r = 0.99, P 60; 0.0001) (Figure 2C). Fat mass and fat‐free mass (Figure 2A,B) were higher in FOZ HF than in WT HF at W34. Drawing inspiration from the clinical gold standard, 6 , 7 , 34 we then measured the surface and the density of dorsal muscles (erector spinae, quadratum lumborum, and psoas) at the fourth and fifth lumbar levels (L4 and L5) (Figure S5) as surrogates for muscle mass and fatty infiltration, respectively. The technique has never been applied to micro‐CT scan and small animals up to now. Therefore, to validate it, we correlated dorsal muscle area at L4 and L5 (averaged) (Figure 2D) with gastrocnemius weight. We found a high positive correlation (r = 0.85) (Figure 2E). We then correlated dorsal muscle density with dorsal muscle lipid content quantitated by a biochemical method and found a high negative correlation (r = −0.83) (Figure 2F). Hence, dorsal muscle area and density adequately reflect muscle mass and specific dorsal muscles fatty infiltration (i.e. myosteatosis), respectively.
FIGURE 2.
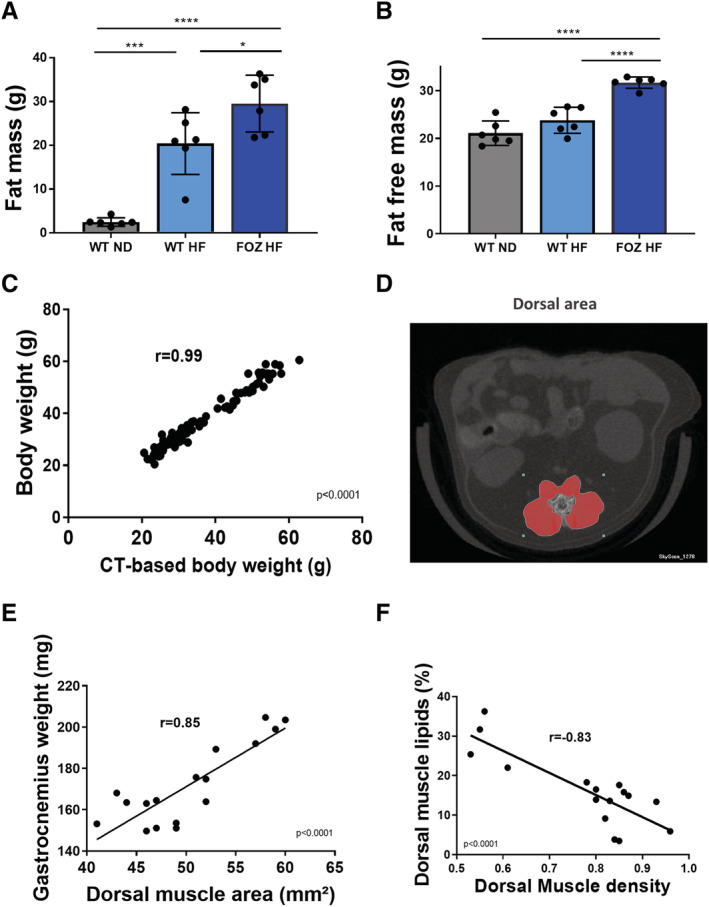
Micro‐computed tomography (CT) allows for non‐invasive ‘all‐in‐one’ evaluation of body composition, muscle mass, myosteatosis, and liver steatosis. (A) Fat mass and (B) fat‐free mass (i.e. lean body mass including muscles and organs, bones excluded) of wild‐type normal diet (WT ND), WT high‐fat‐(HF) fed (WT HF), and HF diet‐fed fat aussie (FOZ HF) mice at W34 (n = 6 per group, one‐way ANOVA). (C) Correlation between body weight and micro‐CT‐based body weight computed by adding fat‐free mass, fat mass, and bone mass measured from reconstructed CT acquisitions (Pearson00027;s coefficient r = 0.99, n = 109, P 60; 0.0001). (D) Illustration of dorsal muscle area region of interest (ROI) at L4 on micro‐CT acquisitions (E) correlation between dorsal muscle area (L4 and L5 averaged) and gastrocnemius muscle weight (Pearson00027;s coefficient r = 0.85, n = 18, P 60; 0.0001). (F) Correlation between dorsal muscle density (L4 and L5 averaged) and lipid content in dorsal muscle (biochemical measure) (Pearson00027;s coefficient r = −0.83, n = 16, P 60; 0.0001). All data are mean ± SEM, except indicated otherwise. *P 60; 0.05, **P 60; 0.01, ***P 60; 0.001, ****P 60; 0.0001.
We then performed micro‐CT scan in WT ND, WT HF, and FOZ HF at W34 to measured liver densities using 3D liver biopsy (Figure 3A, see Materials and Methods). We found equally low liver densities in WT HF and FOZ HF (Figure 3B). Dorsal muscle area was higher in WT HF than in controls and substantially lower in FOZ HF than in WT HF (Figure 3C), a result that parallels changes in gastrocnemius and quadriceps muscle mass (Figure 1C). Interestingly, dorsal muscle density was low in HF‐fed animals and in particular, significantly lower in FOZ HF than in WT HF (Figure 3D). Visceral fat area measured at L4 was not different between FOZ HF and WT HF (Figure 3E).
FIGURE 3.
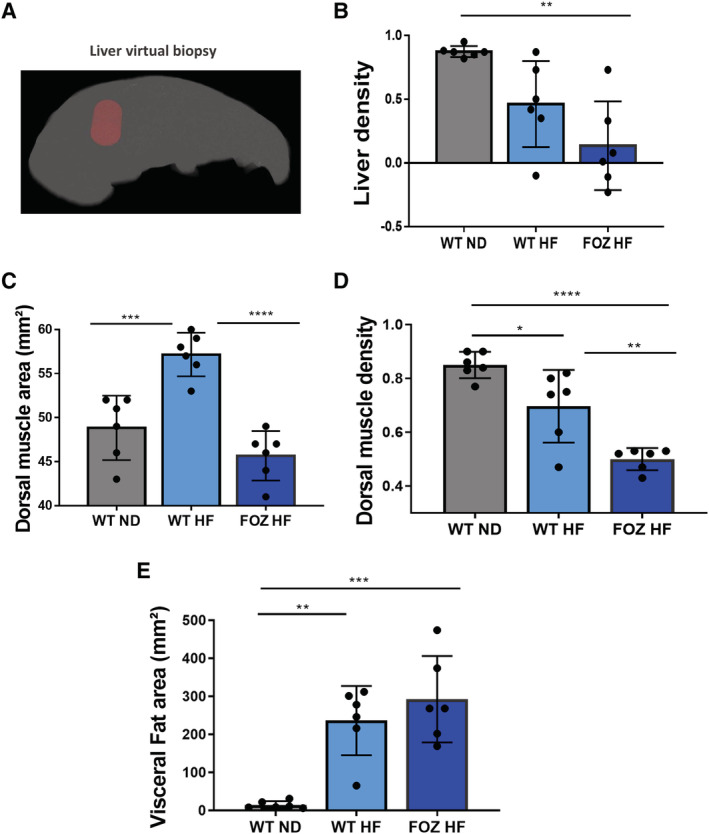
Muscle density but not muscle mass decreases according to liver disease severity. (A) Illustration of 3D liver biopsy as a cylindrical region of interest within the liver parenchyma avoiding large vessels for measuring liver density. (B) Liver density values in wild‐type normal diet fed mice(WT ND), WT high‐fat (HF)‐fed mice (WT HF), and HF diet‐fed fat aussie mice (FOZ HF) (n = 6 per group) after 34 weeks of diet (one‐way ANOVA). (C) Dorsal muscle area of WT ND, WT HF, and FOZ HF after 34 weeks of diet (one‐way ANOVA). (D) Dorsal muscle density of WT ND, WT HF, and FOZ HF after 34 weeks of diet (one‐way ANOVA). (E) Visceral fat area (at L4) of WT ND, WT HF, and FOZ HF after 34 weeks of diet (one‐way ANOVA). All data are mean ± SEM, except indicated otherwise. *P 60; 0.05, **P 60; 0.01, ***P 60; 0.001, ****P 60; 0.0001.
Thus, micro‐CT is a suitable tool to assess liver fat and the muscle compartment non‐invasively in mice. Our data further support that early NASH is not associated with low muscle mass. In contrast and remarkably, myosteatosis (reflected by a low dorsal muscle density) is found in both early and fibrosing NASH, and its degree seems related to liver disease severity (Figures 1B and 3D).
Myosteatosis is the earliest muscle alteration in mice with non‐alcoholic steatohepatitis
To decipher the time‐course of muscle alterations in relation to liver disease progression, we conducted a longitudinal study in FOZ and WT mice fed a HF or a ND over a 34 week study period. At selected time points, we performed a micro‐CT to investigate the dorsal muscle and the liver non‐invasively and sacrificed a subset of mice to harvest tissues. As already reported in this cohort, 27 WT ND had normal liver histology at all times; WT HF developed modest steatosis during most of the study period, but early NASH at W34; all FOZ HF had NASH from W8 on, with minimal fibrosis at W20 and patent pericellular fibrosis at W34 (Figures 4A and S3A,B). Weight gain was slower in WT HF than in FOZ HF, but animals in both groups reached severe obesity at W34 (Figure 4B). FOZ HF consumed slightly more calories than WT HF and WT ND (Figure S1B). HOMA‐IR was significantly higher in FOZ HF and WT HF than in WT ND from W4 on (Figure 4C). Visceral fat area increased in WT HF and in FOZ HF from W4 on, albeit at a slower rate in WT HF than in FOZ HF. Nonetheless, animals in both group reached similar visceral fat area at W34 (Figures 3E and 4D).
FIGURE 4.
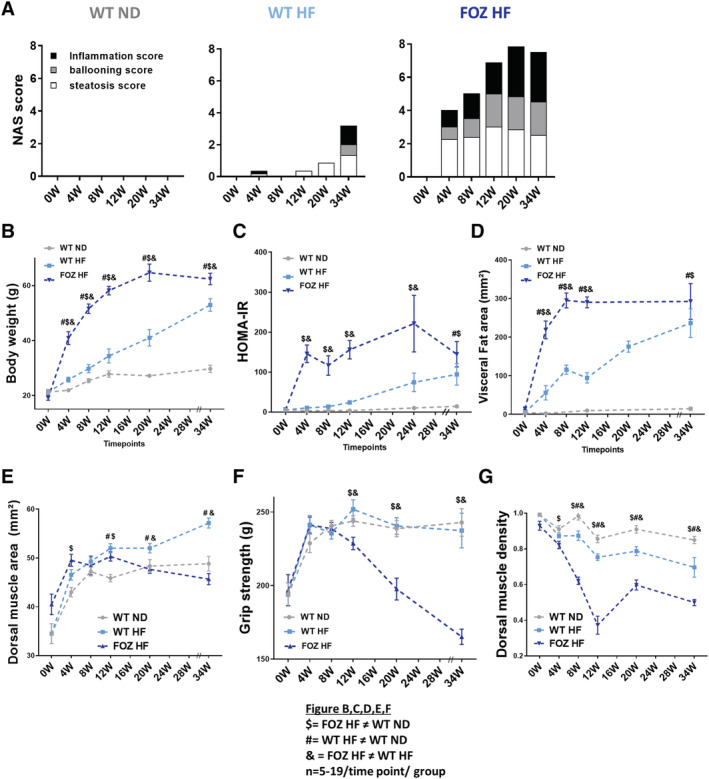
Myosteatosis is the earliest muscle alteration in mice with non‐alcoholic steatohepatitis. (A) Non‐alcoholic fatty liver disease activity score (NAS) of wild‐type normal diet (WT ND), WT high‐fat‐(HF) fed (WT HF), and HF diet‐fed fat aussie (FOZ HF) mice according to time point studied (n = 5–9 per group per time point). (B) Body weight, (C) homeostatic model assessment of insulin resistance (HOMA‐IR), (D) visceral fat area (L4), (E) dorsal muscle area (L4 and L5 averaged), (F) grip strength, and (G) dorsal muscle density (L4 and L5 averaged) measured in vivo by micro‐CT in WT ND, WT HF, and FOZ HF during feeding experiment (n = 5–19 per group per time point, two‐way ANOVA: $ = FOZ HF significantly different from WT ND; # = WT HF significantly different from WT ND; 38; = FOZ HF significantly different from WT HF). W, weeks.
Interestingly, in WT mice, high fat feeding caused an increase in muscle mass in parallel with body weight gain (Figure 4E). This was not seen in FOZ HF, although being overtly obese. Hence, relative muscle mass was lower in FOZ HF than in WT HF and WT ND at all time points (Figure S6A). Also, muscle mass of FOZ HF was similar if not higher to that of WT ND control mice (Figures 4E and S6B) and did not vary during the study period in spite of the progression of liver disease up to severe NASH, in opposition with the human literature. 14 , 15 , 16 , 18 Muscle strength similarly increased in all groups up to W8 (Figure 4F), compatible with animals00027; growth, but steeply decreased only in FOZ HF thereafter. Hence, early NASH (as in FOZ HF at W4 and W8 or WT HF at W34) did not associate with loss of muscle mass or strength. In contrast, muscle density was significantly lower in FOZ HF than in WT ND and WT HF as from W4 and W8, respectively (Figure 4G). Thus, myosteatosis is the earliest muscle alteration in FOZ HF mice that have NASH.
The association between non‐alcoholic steatohepatitis and myosteatosis is not model specific and is independent from visceral fat area and insulin resistance
NASH is present in WT HF at W34 and FOZ HF from W8 on. These mice are severely obese and insulin resistant, two conditions that could cause myosteatosis independently from liver disease severity. To verify whether our findings are not the mere reflection of a severe dysmetabolic status, we evaluated the muscle compartment in WT mice fed a high‐fat diet supplemented with fructose in drinking water (WT HFF), a regimen shown to cause NASH with 24 weeks, 25 and compared them with WT HF controls (NAFL). The mice in the two groups were perfectly matched for calorie intake (Figure S7A), body weight (Figure 5A), HOMA‐IR (Figure 5B), fasting glycaemia (Figure S7B), and liver steatosis (Figures 5C and S7C) and visceral fat area (Figure 5D). Muscle mass (Figure 5E) and muscle strength (Figure 5F) were similar in the two groups. Remarkably, only muscle density differed between WT HFF and WT HF with lower muscle density in WT HFF than in WT HF (Figure 5G). We analysed the liver histology at sacrifice and found key NASH features (i.e. inflammation and ballooning), but not fibrosis, in WT HFF (Figures 5H and S7D). WT HF exhibited simple steatosis. Hence, the lower muscle density in WT HFF was the only parameter able to discriminate early NASH from NAFL in this model.
FIGURE 5.
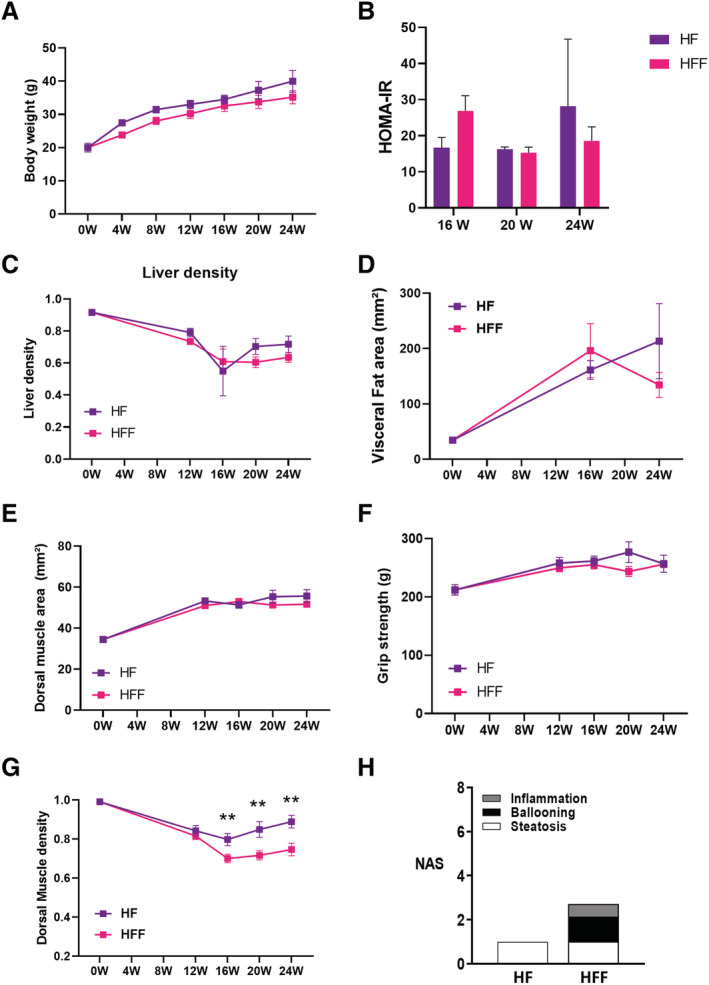
The association between non‐alcoholic steatohepatitis and myosteatosis is not model specific. (A) Body weight, (B) homeostatic model assessment of insulin resistance (HOMA‐IR), (C) liver steatosis, and (D) visceral fat area (L4), (E) dorsal muscle area (L4 and L5 averaged) measured in vivo by micro‐CT, (F) grip strength, and (G) dorsal muscle density in high‐fat (HF) diet‐fed wild‐type (WT) mice (WT HF) and HF high‐fructose diet‐fed WT mice (WT HFF) during feeding experiment (n = 4–11 per group per time point, two‐way ANOVA, *P 60; 0.05). (H) Non‐alcoholic fatty liver disease activity score (NAS) of WT HF and WT HFF at sacrifice. All data are mean ± SEM, *P 60; 0.05, **P 60; 0.01, ***P 60; 0.001, ****P 60; 0.0001. W, weeks.
We then evaluated whether the association between myosteatosis and NASH was independent from insulin resistance and visceral fat area, two potential confounding factors (Table S1). We used multivariate analysis in the pooled animal cohort from the two experiments (WT ND, WT HF, FOZ HF, and WT HFF, total n = 84). In univariate analysis, muscle density was a significant predictor of NASH whether all animal were considered (n = 84) or only those with NAFLD (n = 45) (Table S1). We then adjusted the analysis for HOMA‐IR and visceral fat area, available in n = 53 animals of the pooled cohort (n = 31 in animals with NAFLD). Remarkably, muscle density remained the only significant predictor of NASH (Table S1). These data strongly support our key messages, that are, that there is no sarcopenia in early NASH and that the association between myosteatosis and NASH is related to liver disease severity and is not explained by the metabolic milieu.
Myosteatosis strongly discriminates non‐alcoholic steatohepatitis from fatty liver in preclinical models of non‐alcoholic fatty liver disease
Myosteatosis was seen in three independent NASH rodent models (i.e. WT HF, WT HFF, and FOZ HF). In FOZ HF, myosteatosis could not be explained by the higher body weight as illustrated in Figure 6A, wherein animals exhibited a wide range of muscle densities (≃0.8 to 0.2) for a similar body weight range.
FIGURE 6.
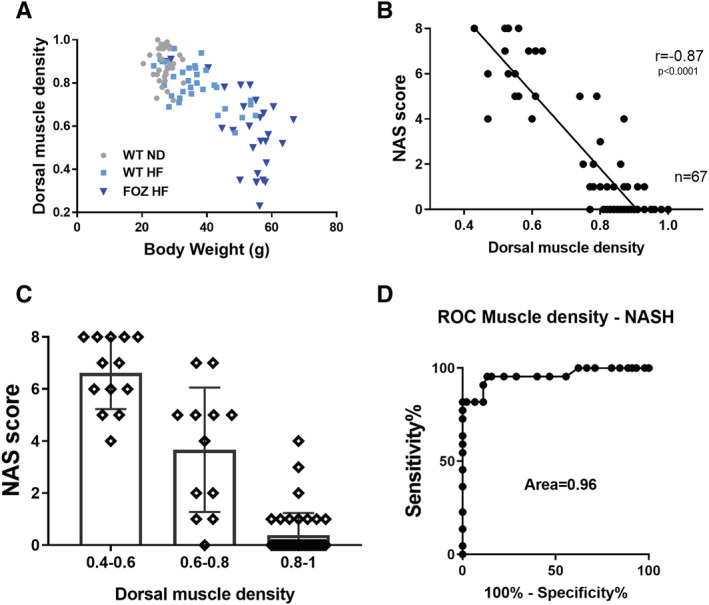
Myosteatosis strongly discriminates non‐alcoholic steatohepatitis (NASH) from non‐alcoholic fatty liver (NAFL) in preclinical model of NAFL disease (NAFLD). (A) Relationship between body weight and dorsal muscle density. Muscle density is linearly correlated with body weight in high‐fat (HF) diet‐fed wild‐type (WT) mice (WT HF) but not in HF diet‐fed fat aussie mice (FOZ HF), where there is a wide range of dorsal muscle density in a restricted range of body weight (n = 112). (B) Correlation between NAS score and dorsal muscle density (Pearson00027;s coefficient r = −0.87, n = 67, P 60; 0.0001). (C) Relationship between muscle density and NAS score. Muscle densities are subdivided into three sub‐groups: low (0.4–0.6), mild (0.6–0.8), and high (0.8–1) density (n = 67). (D) Receiver operating characteristic (ROC) curve to evaluate the performance of dorsal muscle density to diagnose NASH (NAS ≥ 3 with at least 1 point in each sub‐score) vs. no‐NASH; n = 67, area under the receiver operating characteristic (ROC) (AUROC) = 0.96, 95% confidence interval (CI) of 0.92–1, P 60; 0.0001. At a threshold of <0.805, dorsal muscle density had 95.45%% sensitivity (95% CI of 77.16–99.88%) and 86.67% specificity (95% CI of 73.21–94.95%) to identify NASH. All data are mean ± SD. W, weeks.
This, as well as the absence of relationship with visceral adiposity and insulin resistance, prompted us to propose that myosteatosis could be a marker to distinguish NASH from NAFL. We correlated muscle density and NAFLD severity, as histologically evaluated with the NAS score. In the longitudinal mice cohort (i.e. WT ND, WT HF, and FOZ HF at 0, 4, 8, 12, 20, and 34 weeks), dorsal muscle density strongly negatively correlated with the NAS score (r = −0.87) (Figure 6B). The correlation persisted when animals without NAFLD (i.e. NAS = 0) were excluded (r = −0.83). Strikingly, 95% of mice with a dorsal muscle density over 0.8 did not have NASH (39 out of 41), while 100% of mice with a muscle density 60;0.6 had NASH (Figure 6C). The likelihood ratio for having NASH with a muscle density 60;0.76 was 37. We then tested the diagnostic power of muscle density. Muscle density distinguishes NASH from NAFL and normal liver with a nearly maximum performance score [area under the receiver operating characteristic (ROC) (AUROC) = 0.96, P 60; 0.0001] (Figure 6D). This impressive diagnostic power was maintained when only animals with NAFLD (i.e. at least 1 point in steatosis sub‐score) were considered (AUROC = 0.93, P 60; 0.0001). An optimal muscle density cut‐off of 0.805 had a sensitivity and a specificity of 95.45% and 86.67%, respectively, to predict NASH.
Discussion
An increasing body of clinical literature has linked skeletal muscle alterations with NAFLD presence and severity. 11 , 14 , 15 , 16 , 17 , 18 , 19 , 20 , 21 However, most studies are cross‐sectional and do not allow for longitudinal assessment of skeletal muscle changes in relation with liver disease progression. Hence, whether sarcopenia and/or myosteatosis are mere consequences of NASH or whether their onset might precede or parallel NASH remain largely unknown. To answer these questions, we performed a longitudinal study in which we monitored muscle alterations in relation with liver disease progression in preclinical NAFLD models. We drew inspiration from the clinical gold standard 7 and developed and validated a micro‐CT‐based methodology for specific measurement of muscle mass, myosteatosis, and liver steatosis in vivo in mice. The technique accurately measures muscle mass and muscle and liver fatty infiltration. Moreover, it has a very high throughput (2.5 min scanning time per animal), and post‐processing analysis is trivial. Previous studies have used micro‐CT to evaluate liver steatosis in mice, 35 , 36 but the muscle indices validated here represent seminal data with potential applications beyond the scope of liver studies. With this technique, we showed in three independent NAFLD/NASH rodent models that sarcopenia (as evidenced by a low muscle strength, but a not low muscle mass) is present in mice with fibrosing NASH, but not in those with early NASH or NAFL. Hence, among the NAFLD spectrum, only fibrosing NASH is associated with sarcopenia. These findings contrast with available clinical data. 14 , 15 , 16 , 17 , 18 , 19 , 20 , 21 , 37 , 38 It is however important to state that the vast majority of clinical sarcopenia studies scaled muscle mass on body weight or body mass index to compute sarcopenia indexes. 14 , 15 , 16 , 17 , 18 , 19 , 20 , 21 , 37 , 38 Because obesity per se is a well‐known risk factor for NAFLD, 3 it is not surprising to find a low relative muscle mass when muscle mass is scaled on body weight or body mass index in NAFLD patients. Data reported by Peng et al. 39 strongly support this proposal. When muscle mass was scaled on body weight, the odds ratio for having sarcopenia was 1.73 (95% confidence interval 1.31–2.28) in NAFLD patients. In contrast, when muscle mass was scaled on height, the odds ratio for having sarcopenia was 0.63 (95% confidence interval 0.46–0.87), supporting a lower risk for sarcopenia in NAFLD. Hence, clinical studies with muscle strength evaluation, gold standard techniques to measure muscle mass, and adequate data presentation are urgently needed to clarify the relationship between NAFLD and sarcopenia. 6
Of note, FOZ HF had decreased muscle strength, but not a low muscle mass when compared with WT ND controls. Rather, we observed a non‐adaptation to increasing body weight (hence, low relative muscle mass). A plausible explanation could be that the chronic work load imposed by excess weight in obese mice (WT HF, WT HFF, and FOZ HF) may prevent absolute muscle mass loss and maintain muscle strength, at least up to a certain point.
In contrast to sarcopenia, myosteatosis was found in three independent preclinical NASH models, both in early and fibrosing NASH. Its degree was strongly correlated with liver disease activity, and the association was independent from visceral fat or insulin resistance. Because our data support that myosteatosis is model independent and is not entirely explained by weight gain or metabolic disorder, we hypothesized that it could represent a surrogate diagnostic marker for NASH. We stratified muscle density according to histological NAS (i.e. the gold standard to evaluate NASH activity). We found that the likelihood ratio for having NASH with a muscle density 60;0.76 was 37. We therefore tested the diagnostic power of muscle density (reflecting myosteatosis severity on a continuous scale) on the entire longitudinal cohort using ROC curve. Muscle density had an impressive diagnostic performance to discriminate NASH from NAFL or normal liver (AUROC 0.96, n = 67, P 60; 0.0001).
Muscle mass is evaluated in most clinical NAFLD studies because bioelectrical impedance analysis or dual X‐ray absorptiometry are readily available. However, these techniques do not allow for muscle fat evaluation. Conversely, studies that used CT scan or magnetic resonance imaging enable quantification of muscle fatty infiltration and suggested a plausible association between myosteatosis and NAFLD. For instance, Kitajima et al. 17 reported an association between myosteatosis and NASH severity in NAFLD patients (n = 208). Recently, Tanaka et al. 21 reported the presence of low muscle density in patients with NAFLD when compared with controls (total n = 632). Some very recent papers nicely complement these findings. 23 , 40 Nonetheless, because of the lack of liver biopsy 21 , 23 , 40 or improper analysis, 17 none explores the potential of myosteatosis to diagnose early NASH in a steatotic liver. Currently, early NASH diagnosis relies on a liver biopsy. However, this invasive procedure is not performed unless transaminases are perturbed or signs of advanced fibrosis are present, such as captured non‐invasively by Fibrosis‐4 (FIB‐4), NAFLD fibrosis score (NFS), or liver stiffness measurements. 41 Notwithstanding, hepatic transaminases are not always elevated in patients with NASH, 42 and the diagnostic power of non‐invasive scores or imaging for fibrosis detection is poor at early stages of the disease (60;F2). 41 Hence, a substantial proportion of patients with NASH‐F0–1 are probably undiagnosed with current guidelines. These patients have an increased risk for liver disease progression. 3 Moreover, they also are at risk of cardiovascular events and of hepatocellular carcinoma, even in the absence of fibrosis. 3 Therefore, there is an urgent need for the development of new markers to detect patients with early NASH, as this may help identifying an at‐risk population on which to concentrate surveillance and treatment options.
Overall, our preclinical data pave the way for well‐designed prospective clinical study to determine whether the evaluation of myosteatosis could help stratify at‐risk patients for NASH among the two billion adults with NAFLD. 3 Noteworthy, validated clinical tools to evaluate myosteatosis are readily available in research settings 43 and in clinical routine, with point‐of‐care technique such as ultrasound, 44 which are suitable for large population screening.
Whether myosteatosis is a mere signature of the metabolic syndrome or whether it drives a pathophysiological process for disease progression still needs to be determined. 19 , 24 Thus, myosteatosis and NASH may represent two manifestations of ectopic lipid storage and lipotoxicity. The skeletal muscle is now recognized as an endocrine organ per se, secreting myokines that act distantly. 45 It is thus tempting to speculate that severe fat infiltration may modify the secretome of skeletal muscles and in turn influence liver disease progression. Although the exploration of mechanisms leading to myosteatosis and sarcopenia in NASH (such as specific muscle insulin resistance) and the plausible consequences on muscle secretome go beyond the diagnostic scope of this paper, investigating whether a muscle‐to‐liver axis operates in NAFLD pathophysiology 19 could bring new mechanistic insights of high significance for therapeutic development.
To the best of our knowledge, this is the first study wherein the muscle compartment was investigated longitudinally, non‐invasively, and invasively with gold standard methods in three validated NAFLD models, with a complete validation of a novel non‐invasive methodology (micro‐CT). With this study, we believe to be the first to answer the long‐standing ‘egg or chicken’ sarcopenia paradigm in NAFLD. 25 Indeed, our experimental data strongly support that there is no sarcopenia in mice with obesity, metabolic syndrome, and NAFL or early NASH. Rather, sarcopenia associates with active and fibrosing liver disease. In contrast, myosteatosis, an under‐explored muscle change with potential pathophysiological relevance for liver disease progression, is the earliest muscle alteration in NASH. It was consistently found in three independent preclinical models. Myosteatosis predicted NASH with an impressive diagnostic performance (AUROC = 0.96). Hence, our data call for exploiting muscle fat content for non‐invasive diagnosis of NASH in NAFLD. Despite validation in three mouse models, whether muscle undergoes modification according to a similar kinetics in human NAFLD/NASH is unknown. Longitudinal studies with appropriate methodology for muscle and liver assessment (i.e. imaging and liver biopsy) are now needed to determine whether the non‐invasive evaluation of myosteatosis has a diagnostic and/or a prognosis value in patients with NAFLD. Myosteatosis and NASH are associated with increased mortality in patients, 8 , 46 and each condition carries an increased risk for cardiovascular complications, 47 , 48 , 49 reported as the first cause of mortality in NAFLD. 1 Moreover, myosteatosis is associated with incident type 2 diabetes, 50 a condition tightly linked with NAFLD, and predicts mortality in these patients. 51 Thus, myosteatosis might not only represent an early marker of NASH but could also directly influence its outcome. Further studies are needed to clarify this issue and determine whether myosteatosis could become a new therapeutic target in NAFLD.
Author contributions
M.N. and I.A.L. conceived and designed the study. M.N., G.V., and M.D.R. performed animal experiments. G.V. and M.N. designed micro‐CT protocols. O.S. and C.B. provided expert advice and support for muscle testing and IHC and morphometrical quantification. Y.H. and J.‐P.T. critically discussed study design, data, and manuscript for scientific content. M.N. and I.A.L. wrote the manuscript, with contributions from all authors. I.A.L. obtained funding.
Conflict of interest
The authors declare that they have no conflict of interest in relation to this work to disclose.
Funding
This work was supported by the PhD fellowship from FRIA (FNRS, Belgium) [grant number 31618719 (to M.N.)] and by the Fund for Scientific Medical Research (FNRS Belgium) [grant number T.0141.19 (to I.A.L.)].
Supporting information
Figure S1. FOZ HF consumes more calories than WT ND and WT HF and had severe insulin‐resistance (a) Composition of standard chow (left) and high fat diet (right). (b) Food intake expressed in kcal/mice/day (n = 5–6 mice/group/time point, two‐way ANOVA). All data are mean±SEM.
Figure S2. FOZ ND exhibit the same liver and muscle phenotype than WT HF (a) Body weight, (b) Liver density, (c) Dorsal muscle area (L4 and L5 averaged), (d) Dorsal muscle density (L4 and L5 averaged) measured in‐vivo by micro‐CT and (e) Grip strength of WT ND, WT HF, FOZ ND and FOZ HF at different time point until W34 (n = 5–19/group/time point, two‐way ANOVA, $ = FOZ HF significantly different from WT ND # = WT HF significantly different from WT ND, 38; = FOZ HF significantly different than WT HF, * = FOZ HF significantly different from WT HF). (two‐way ANOVA). All data are mean±SEM.
Figure S3. FOZ HF mice have visible fibrosis from W20 on (a) Left, representative histological picture of sirius red staining in 34 W FOZ HF (scale bar = 125 μm). Right, representative image of mask used for automated analysis of fibrosis area. (b) Fibrosis area on entire liver sections (n = 3–4/group). Line,median value; box, 25%–75% percentile; whiskers, min and max, one‐way ANOVA. **p 60; 0.01, ****p 60; 0.0001
Figure S4. in‐vivo 3D whole body acquisition with micro‐CT. Whole body composition of WT ND, WT HF and FOZ HF at 0 W, 12 W and 34 W. Density‐based colour‐scale (pinkish to red = high density values identifying lean tissues, turquoise to green = low density values identifying fat).
Figure S5. in‐vivo 3D reconstruction of liver and dorsal muscle with micro‐CT. Liver and dorsal muscle reconstruction of WT ND, WT HF and FOZ HF at 0 W, 12 W and 34 W. Density‐based colour‐scale (red = high density value representing lean mass, yellow = low density value representing fat infiltration). Note: This figure illustrates fatty infiltration in liver and muscles, thus all items have similar colour‐scale, but not size‐scale.
Figure S6. FOZ HF fail to adapt their muscle mass according to body weight gain. (a) Dorsal muscle area relative to body weight (n = 5–19/group/time point, two‐way ANOVA). (b) Gastrocnemius muscle weight at 0 W, 12 W and 34 W in WT ND, WT HF and FOZ HF (n = 5–9/group/time point, one‐way ANOVA). All data are mean±SEM.
Figure S7. WT HFF exhibits key NASH features, but remain metabolically comparable with WT HF. (a) Food intake expressed in kcal/mice/day (n = 4–11 mice/group/time point, student t test). (b) Fasting glycaemia over the study period (n = 4–11 mice/group/time point, two‐way ANOVA). (c) and (d) Representative liver histology in WT HF and WT HFF with H38;E staining (c) and F4:80 IHC (d) with respective automated computerized quantification (Biocellvia, Marseille, France).
Table S1. Muscle density is independently associated with NASH.
Acknowledgements
We thank Geoffrey C. Farrell (ANU College of Health 38; Medicine, Canberra, Australia) for providing FOZ mice and Lieven Desmet (Louvain Institute of Data Analysis and Modelling in Economics and Statistics, Louvain‐la‐Neuve, Belgium) for his assistance in statistical analyses. We thank Héloïse Louvegny (UCLouvain, Belgium) for her assistance during mice experiments. The authors certify that they comply with the ethical guidelines for publishing in the Journal of Cachexia, Sarcopenia and Muscle: update 2019. 52
Nachit M., De Rudder M., Thissen J.‐P., Schakman O., Bouzin C., Horsmans Y., Vande Velde G., and Leclercq I. A. (2021) Myosteatosis rather than sarcopenia associates with non‐alcoholic steatohepatitis in non‐alcoholic fatty liver disease preclinical models, Journal of Cachexia, Sarcopenia and Muscle, 12, 144–158, doi: 10.1002/jcsm.12646
Greetje Vande Velde and Isabelle A. Leclercq contributed equally to this study.
References
- 1. Younossi ZM. Non‐alcoholic fatty liver disease—a global public health perspective. J Hepatol 2019;70:531–544. [DOI] [PubMed] [Google Scholar]
- 2. Chalasani N, Younossi Z, Lavine JE, Charlton M, Cusi K, Rinella M, et al. The diagnosis and management of nonalcoholic fatty liver disease: practice guidance from the American Association for the Study of Liver Diseases. Hepatology 2018;67:328–357. [DOI] [PubMed] [Google Scholar]
- 3. Sanyal AJ. Past, present and future perspectives in nonalcoholic fatty liver disease. Nat Rev Gastroenterol Hepatol 2019;16:377–386. [DOI] [PubMed] [Google Scholar]
- 4. Younossi ZM, Loomba R, Anstee QM, Rinella ME, Bugianesi E, Marchesini G, et al. Diagnostic modalities for nonalcoholic fatty liver disease, nonalcoholic steatohepatitis, and associated fibrosis. Hepatology 2018;68:349–360. [DOI] [PMC free article] [PubMed] [Google Scholar]
- 5. Prado CM, Purcell SA, Alish C, Pereira SL, Deutz NE, Heyland DK, et al. Implications of low muscle mass across the continuum of care: a narrative review. Ann Med 2018;1–39. [DOI] [PMC free article] [PubMed] [Google Scholar]
- 6. Cruz‐Jentoft AJ, Bahat G, Bauer J, Boirie Y, Bruyère O, Cederholm T, et al. Sarcopenia: revised European consensus on definition and diagnosis. Age Ageing 2019;48:16–31. [DOI] [PMC free article] [PubMed] [Google Scholar]
- 7. Cruz‐Jentoft AJ, Sayer AA. Sarcopenia. Lancet 2019;393:2636–2646. [DOI] [PubMed] [Google Scholar]
- 8. Montano‐Loza AJ, Angulo P, Meza‐Junco J, Prado CMM, Sawyer MB, Beaumont C, et al. Sarcopenic obesity and myosteatosis are associated with higher mortality in patients with cirrhosis. J Cachexia Sarcopenia Muscle 2016;7:126–135. [DOI] [PMC free article] [PubMed] [Google Scholar]
- 9. Ebadi M, Montano‐Loza AJ. Clinical relevance of skeletal muscle abnormalities in patients with cirrhosis. Dig Liver Dis 2019;51:1493–1499. [DOI] [PubMed] [Google Scholar]
- 10. Bhanji RA, Narayanan P, Moynagh MR, Takahashi N, Angirekula M, Kennedy CC, et al. Differing impact of sarcopenia and frailty in nonalcoholic steatohepatitis and alcoholic liver disease. Liver Transpl 2019;25:14–24. [DOI] [PMC free article] [PubMed] [Google Scholar]
- 11. Bhanji RA, Narayanan P, Allen AM, Malhi H, Watt KD. Sarcopenia in hiding: the risk and consequence of underestimating muscle dysfunction in nonalcoholic steatohepatitis. Hepatology 2017;66:2055–2065. [DOI] [PubMed] [Google Scholar]
- 12. Montano‐Loza AJ, Duarte‐Rojo A, Meza‐Junco J, Baracos VE, Sawyer MB, Pang JXQ, et al. Inclusion of sarcopenia within MELD (MELD‐sarcopenia) and the prediction of mortality in patients with cirrhosis. Clin Transl Gastroenterol 2015;6:e102–e102. [DOI] [PMC free article] [PubMed] [Google Scholar]
- 13. Carey EJ, Lai JC, Sonnenday C, Tapper EB, Tandon P, Duarte‐Rojo A, et al. A North American Expert Opinion Statement on Sarcopenia in Liver Transplantation. Hepatology 2019;70:1816–1829. [DOI] [PMC free article] [PubMed] [Google Scholar]
- 14. Koo BK, Kim D, Joo SK, Kim JH, Chang MS, Kim BG, et al. Sarcopenia is an independent risk factor for non‐alcoholic steatohepatitis and significant fibrosis. J Hepatol 2017;66:123–131. [DOI] [PubMed] [Google Scholar]
- 15. Petta S, Ciminnisi S, Di Marco V, Cabibi D, Cammà C, Licata A, et al. Sarcopenia is associated with severe liver fibrosis in patients with non‐alcoholic fatty liver disease. Aliment Pharmacol Ther 2017;45:510–518. [DOI] [PubMed] [Google Scholar]
- 16. Gan D, Wang L, Jia M, Ru Y, Ma Y, Zheng W, et al. Low muscle mass and low muscle strength associate with nonalcoholic fatty liver disease. Clin Nutr 2020;39:1124–1130. [DOI] [PubMed] [Google Scholar]
- 17. Kitajima Y, Hyogo H, Sumida Y, Eguchi Y, Ono N, Kuwashiro T, et al. Severity of non‐alcoholic steatohepatitis is associated with substitution of adipose tissue in skeletal muscle. J Gastroenterol Hepatol 2013;28:1507–1514. [DOI] [PubMed] [Google Scholar]
- 18. Hong HC, Hwang SY, Choi HY, Yoo HJ, Seo JA, Kim SG, et al. Relationship between sarcopenia and nonalcoholic fatty liver disease: the Korean Sarcopenic Obesity Study. Hepatology 2014;59:1772–1778. [DOI] [PubMed] [Google Scholar]
- 19. Nachit M, Leclercq IA. Emerging awareness on the importance of skeletal muscle in liver diseases: time to dig deeper into mechanisms! Clin Sci 2019;133:465–481. [DOI] [PubMed] [Google Scholar]
- 20. Issa D, Alkhouri N, Tsien C, Shah S, Lopez R, McCullough A, et al. Presence of sarcopenia (muscle wasting) in patients with nonalcoholic steatohepatitis. Hepatology 2014;60:428–429. [DOI] [PMC free article] [PubMed] [Google Scholar]
- 21. Tanaka M, Okada H, Hashimoto Y, Kumagai M, Nishimura H, Oda Y, et al. Relationship between nonalcoholic fatty liver disease and muscle quality as well as quantity evaluated by computed tomography. Liver Int 2020;40:120–130. [DOI] [PubMed] [Google Scholar]
- 22. Kang S, Moon MK, Kim W, Koo BK. Association between muscle strength and advanced fibrosis in non‐alcoholic fatty liver disease: a Korean nationwide survey. J Cachexia Sarcopenia Muscle 2020. [DOI] [PMC free article] [PubMed] [Google Scholar]
- 23. Oshida N, Shida T, Oh S, Kim T, Isobe T, Okamoto Y, et al. Urinary levels of Titin‐N fragment, a skeletal muscle damage marker, are increased in subjects with nonalcoholic fatty liver disease. Sci Rep 2019;9:19498. [DOI] [PMC free article] [PubMed] [Google Scholar]
- 24. De Fré CH, De Fré MA, Kwanten WJ, Op de Beeck BJ, Van Gaal LF, Francque SM. Sarcopenia in patients with non‐alcoholic fatty liver disease: is it a clinically significant entity? Obes Rev 2019;20:353–363. [DOI] [PubMed] [Google Scholar]
- 25. Farrell G, Schattenberg JM, Leclercq I, Yeh MM, Goldin R, Teoh N, et al. Mouse models of nonalcoholic steatohepatitis: toward optimization of their relevance to human nonalcoholic steatohepatitis. Hepatology 2019;69:2241–2257. [DOI] [PubMed] [Google Scholar]
- 26. Arsov T, Larter CZ, Nolan CJ, Petrovsky N, Goodnow CC, Teoh NC, et al. Adaptive failure to high‐fat diet characterizes steatohepatitis in Alms1 mutant mice. Biochem Biophys Res Commun 2006;342:1152–1159. [DOI] [PubMed] [Google Scholar]
- 27. De Rudder M, Bouzin C, Nachit M, Louvegny H, Vande Velde G, Julé Y, et al. Automated computerized image analysis for the user‐independent evaluation of disease severity in preclinical models of NAFLD/NASH. Lab Invest 2020;100:147–160. [DOI] [PubMed] [Google Scholar]
- 28. Isokuortti E, Zhou Y, Peltonen M, Bugianesi E, Clement K, Bonnefont‐Rousselot D, et al. Use of HOMA‐IR to diagnose non‐alcoholic fatty liver disease: a population‐based and inter‐laboratory study. Diabetologia 2017;60:1873–1882. [DOI] [PubMed] [Google Scholar]
- 29. Bligh EG, Dyer WJ. A rapid method of total lipid extraction and purification. Can J Biochem Physiol 1959;37:911–917. [DOI] [PubMed] [Google Scholar]
- 30. Granton PV, Norley CJ, Umoh J, Turley EA, Frier BC, Noble EG, et al. Rapid in vivo whole body composition of rats using cone beam μCT. J Appl Physiol 2010;109:1162–1169. [DOI] [PubMed] [Google Scholar]
- 31. Kleiner DE, Brunt EM, Van Natta M, Behling C, Contos MJ, Cummings OW, et al. Design and validation of a histological scoring system for nonalcoholic fatty liver disease. Hepatology 2005;41:1313–1321. [DOI] [PubMed] [Google Scholar]
- 32. Bedossa P, Poitou C, Veyrie N, Bouillot J‐L, Basdevant A, Paradis V, et al. Histopathological algorithm and scoring system for evaluation of liver lesions in morbidly obese patients. Hepatology 2012;56:1751–1759. [DOI] [PubMed] [Google Scholar]
- 33. Beaucage KL, Pollmann SI, Sims SM, Dixon SJ, Holdsworth DW. Quantitative in vivo micro‐computed tomography for assessment of age‐dependent changes in murine whole‐body composition. Bone Reports 2016;5:70–80. [DOI] [PMC free article] [PubMed] [Google Scholar]
- 34. Mourtzakis M, Prado CMM, Lieffers JR, Reiman T, McCargar LJ, Baracos VE. A practical and precise approach to quantification of body composition in cancer patients using computed tomography images acquired during routine care. Appl Physiol Nutr Metab 2008;33:997–1006. [DOI] [PubMed] [Google Scholar]
- 35. Wyatt SK, Barck KH, Kates L, Zavala‐Solorio J, Ross J, Kolumam G, et al. Fully‐automated, high‐throughput micro‐computed tomography analysis of body composition enables therapeutic efficacy monitoring in preclinical models. Int J Obes (Lond) 2015;39:1630–1637. [DOI] [PubMed] [Google Scholar]
- 36. Lubura M, Hesse D, Neumann N, Scherneck S, Wiedmer P, Schürmann A. Non‐invasive quantification of white and brown adipose tissues and liver fat content by computed tomography in mice. Hennige AM, ed. PLoS ONE 2012;7:e37026. [DOI] [PMC free article] [PubMed] [Google Scholar]
- 37. Wijarnpreecha K, Kim D, Raymond P, Scribani M, Ahmed A. Associations between sarcopenia and nonalcoholic fatty liver disease and advanced fibrosis in the USA. Eur J Gastroenterol Hepatol 2019;31:1121–1128. [DOI] [PubMed] [Google Scholar]
- 38. Lee YH, Kim SU, Song K, Park JY, do Kim Y, Ahn SH, et al. Sarcopenia is associated with significant liver fibrosis independently of obesity and insulin resistance in nonalcoholic fatty liver disease: nationwide surveys (KNHANES 2008–2011). Hepatology 2016;63:776–786. [DOI] [PubMed] [Google Scholar]
- 39. Peng T‐C, Wu L‐W, Chen W‐L, Liaw F‐Y, Chang Y‐W, Kao T‐W. Nonalcoholic fatty liver disease and sarcopenia in a Western population (NHANES III): the importance of sarcopenia definition. Clin Nutr 2019;38:422–428. [DOI] [PubMed] [Google Scholar]
- 40. Zhang W, Huang R, Wang Y, Rao H, Wei L, Su GL, et al. Fat accumulation, liver fibrosis, and metabolic abnormalities in Chinese patients with moderate/severe versus mild hepatic steatosis. Hepatol Commun 2019;3:1585–1597. [DOI] [PMC free article] [PubMed] [Google Scholar]
- 41. Castera L, Friedrich‐Rust M, Loomba R. Noninvasive assessment of liver disease in patients with nonalcoholic fatty liver disease. Gastroenterology 2019;156:1264–1281.e4. [DOI] [PMC free article] [PubMed] [Google Scholar]
- 42. Ma X, Liu S, Zhang J, Dong M, Wang Y, Wang M, et al. Proportion of NAFLD patients with normal ALT value in overall NAFLD patients: a systematic review and meta‐analysis. BMC Gastroenterol 2020;20:10. [DOI] [PMC free article] [PubMed] [Google Scholar]
- 43. Albano D, Messina C, Vitale J, Sconfienza LM. Imaging of sarcopenia: old evidence and new insights. Eur Radiol 2020;30:2199–2208. [DOI] [PubMed] [Google Scholar]
- 44. Harris‐Love MO, Seamon BA, Teixeira C, Ismail C. Ultrasound estimates of muscle quality in older adults: reliability and comparison of Photoshop and ImageJ for the grayscale analysis of muscle echogenicity. PeerJ 2016;4:e1721. [DOI] [PMC free article] [PubMed] [Google Scholar]
- 45. Eckel J. Myokines in metabolic homeostasis and diabetes. Diabetologia 2019;62:1523–1528. [DOI] [PubMed] [Google Scholar]
- 46. Kazemi‐Bajestani SMR, Mazurak VC, Baracos V. Computed tomography‐defined muscle and fat wasting are associated with cancer clinical outcomes. Semin Cell Dev Biol 2016;54:2–10. [DOI] [PubMed] [Google Scholar]
- 47. Granados A, Gebremariam A, Gidding SS, Terry JG, Carr JJ, Steffen LM, et al. Association of abdominal muscle composition with prediabetes and diabetes: the CARDIA study. Diabetes Obes Metab 2019;21:267–275. [DOI] [PMC free article] [PubMed] [Google Scholar]
- 48. Haykowsky MJ, Nicklas BJ, Brubaker PH, Hundley WG, Brinkley TE, Upadhya B, et al. Regional adipose distribution and its relationship to exercise intolerance in older obese patients who have heart failure with preserved ejection fraction. JACC Hear Fail 2018;6:640–649. [DOI] [PMC free article] [PubMed] [Google Scholar]
- 49. Terry JG, Shay CM, Schreiner PJ, Jacobs DR, Sanchez OA, Reis JP, et al. Intermuscular adipose tissue and subclinical coronary artery calcification in midlifehighlights. Arterioscler Thromb Vasc Biol 2017;37:2370–2378. [DOI] [PMC free article] [PubMed] [Google Scholar]
- 50. Miljkovic I, Kuipers AL, Cvejkus R, Bunker CH, Patrick AL, Gordon CL, et al. Myosteatosis increases with aging and is associated with incident diabetes in African ancestry men. Obesity (Silver Spring) 2016;24:476–482. [DOI] [PMC free article] [PubMed] [Google Scholar]
- 51. Tucker BM, Hsu FC, Register TC, Xu J, Smith SC, Murea M, et al. Psoas and paraspinous muscle measurements on computed tomography predict mortality in European Americans with type 2 diabetes mellitus. J Frailty Aging 2019;8:72–78. [DOI] [PubMed] [Google Scholar]
- 52. von Haehling S, Morley JE, Coats AJS, Anker SD. Ethical guidelines for publishing in the Journal of Cachexia, Sarcopenia and Muscle: update 2019. J Cachexia Sarcopenia Muscle 2019;10:1143–1145. [DOI] [PMC free article] [PubMed] [Google Scholar]
Associated Data
This section collects any data citations, data availability statements, or supplementary materials included in this article.
Supplementary Materials
Figure S1. FOZ HF consumes more calories than WT ND and WT HF and had severe insulin‐resistance (a) Composition of standard chow (left) and high fat diet (right). (b) Food intake expressed in kcal/mice/day (n = 5–6 mice/group/time point, two‐way ANOVA). All data are mean±SEM.
Figure S2. FOZ ND exhibit the same liver and muscle phenotype than WT HF (a) Body weight, (b) Liver density, (c) Dorsal muscle area (L4 and L5 averaged), (d) Dorsal muscle density (L4 and L5 averaged) measured in‐vivo by micro‐CT and (e) Grip strength of WT ND, WT HF, FOZ ND and FOZ HF at different time point until W34 (n = 5–19/group/time point, two‐way ANOVA, $ = FOZ HF significantly different from WT ND # = WT HF significantly different from WT ND, 38; = FOZ HF significantly different than WT HF, * = FOZ HF significantly different from WT HF). (two‐way ANOVA). All data are mean±SEM.
Figure S3. FOZ HF mice have visible fibrosis from W20 on (a) Left, representative histological picture of sirius red staining in 34 W FOZ HF (scale bar = 125 μm). Right, representative image of mask used for automated analysis of fibrosis area. (b) Fibrosis area on entire liver sections (n = 3–4/group). Line,median value; box, 25%–75% percentile; whiskers, min and max, one‐way ANOVA. **p 60; 0.01, ****p 60; 0.0001
Figure S4. in‐vivo 3D whole body acquisition with micro‐CT. Whole body composition of WT ND, WT HF and FOZ HF at 0 W, 12 W and 34 W. Density‐based colour‐scale (pinkish to red = high density values identifying lean tissues, turquoise to green = low density values identifying fat).
Figure S5. in‐vivo 3D reconstruction of liver and dorsal muscle with micro‐CT. Liver and dorsal muscle reconstruction of WT ND, WT HF and FOZ HF at 0 W, 12 W and 34 W. Density‐based colour‐scale (red = high density value representing lean mass, yellow = low density value representing fat infiltration). Note: This figure illustrates fatty infiltration in liver and muscles, thus all items have similar colour‐scale, but not size‐scale.
Figure S6. FOZ HF fail to adapt their muscle mass according to body weight gain. (a) Dorsal muscle area relative to body weight (n = 5–19/group/time point, two‐way ANOVA). (b) Gastrocnemius muscle weight at 0 W, 12 W and 34 W in WT ND, WT HF and FOZ HF (n = 5–9/group/time point, one‐way ANOVA). All data are mean±SEM.
Figure S7. WT HFF exhibits key NASH features, but remain metabolically comparable with WT HF. (a) Food intake expressed in kcal/mice/day (n = 4–11 mice/group/time point, student t test). (b) Fasting glycaemia over the study period (n = 4–11 mice/group/time point, two‐way ANOVA). (c) and (d) Representative liver histology in WT HF and WT HFF with H38;E staining (c) and F4:80 IHC (d) with respective automated computerized quantification (Biocellvia, Marseille, France).
Table S1. Muscle density is independently associated with NASH.