Abstract
Mounting research papers have suggested that long non‐coding RNAs (lncRNAs) elicit important functions in the progression of osteosarcoma (OS). This study focused on the role of TNK2‐AS1 in OS. TNK2‐AS1 was powerfully expressed in OS tissues and cell lines. In addition, TNK2‐AS1 downregulation inhibited proliferative, migratory, and invasive capacities while promoting apoptosis in OS cells. miR‐4319 was removed by TNK2‐AS1 and therefore TNK2‐AS1 elevated WDR1 expression in OS cells. miR‐4319 had an inhibitory influence on OS progression, while WDR1 was a contributor to OS progression. Rescue assays certified that TNK2‐AS1 promoted malignant phenotypes in vitro and the growth in vivo of OS cells by upregulating WDR1. In depth, we found that YY1 accelerated the transcription of TNK2‐AS1 in OS cells, and that its role in OS also depended on TNK2‐AS1‐regulated WDR1. In conclusion, TNK2‐AS1 was positively modulated by YY1 and aggravated the development of OS by ‘sponging’ miR‐4319 to elevate WDR1. The findings highlighted that TNK2‐AS1 might be a promising target for the treatment of OS.
Keywords: miR‐4319, osteosarcoma, TNK2‐AS1, WDR1, YY1
TNK2‐AS1 was upregulated and facilitated the progression of OS cells. miR‐4319 was expressed at low levels in OS cells and hampered proliferation, migration, and invasion. WDR1 could bind to miR‐4319 in OS cells. WDR1 facilitated the progression of OS cells. TNK2‐AS1 downregulation repressed OS growth in vivo. YY1 accelerated the transcription of TNK2‐AS1.

1. INTRODUCTION
Osteosarcoma (OS) manifests in bone and exhibits high levels of malignancy world‐wide. 1 OS is commonly found and diagnosed among children and teenagers, for whom there is a low overall 5‐y survival rate and dismal postoperative recovery rate. 2 The poor prognosis for patients with OS is partly attributed to its difficult identification in the early stages of disease, followed by rapid progression. 3 Currently, no effective drugs for treating OS are available and acquired chemoresistance is the main hindrance for chemotherapy. Therefore, to improve the results of therapy, it is imperative to find mechanisms underlying OS development and identify biomarkers.
Increasing research efforts have identified and illustrated that long non‐coding RNAs (lncRNAs) have crucial roles in modulating multiple biological behaviors such as cell proliferation, apoptosis, and motility. 4 , 5 lncRNA SOX2‐OT is linked to poor prognosis for patients with OS and promotes OS cell proliferation and motility by regulating SOX2. 6 XIST is upregulated in OS cells and contributes to OS cell proliferation and metastasis. 7 TNK2‐AS1 is reported to have key functions in non–small‐cell lung cancer (NSCLC). 8 This novel lncRNA has not been studied previously in relation to OS.
Competing endogenous RNA (ceRNA) regulatory systems have been applied to analyze the role of lncRNAs or circRNAs in regulating biological processes. 9 In such systems, lncRNAs serve as the ceRNA of mRNAs by competitively binding to miRNAs so that mRNAs are released from binding to miRNAs. 10 DANCR has been reported to accelerate OS progression by enhancing AXL receptor tyrosine kinase by ‘sponging’ miR‐33a‐5p and 11 SNHG15 boosted cell invasion, autophagy, and proliferation in OS by absorbing miR‐141. 12 lncRNA MALAT1 acted as a ceRNA against CDK9 to promote OS progression by absorbing miR‐206. 13 In this study, we analyzed the possible ceRNA role of TNK2‐AS1 in OS, as well as downstream molecules. The main task of this study was to analyze the function and probable regulation mode of TNK2‐AS1 in OS. YY1 was found to induce TNK2‐AS1 transcription to activate the TNK2‐AS1/miR‐4319/WDR1 axis in OS cells.
2. MATERIALS AND METHODS
2.1. Specimen collection
OS tissues and paired non‐tumor tissues were acquired from 60 patients with OS at the Affiliated Cancer Hospital of Zhengzhou University, Henan Cancer Hospital, China. All specimens were frozen in liquid nitrogen and maintained at −80°C. This study was approved by the Ethics Committee of the Affiliated Cancer Hospital of Zhengzhou University, Henan Cancer Hospital, and each patient gave informed consent before the study.
2.2. Cell lines
Human OS cell lines (U2OS, HOS, Saos‐2 and 143B) and a human osteoblast cell line (hFOB1.19) were acquired commercially from the ATCC Cell Bank. DMEM purchased from Invitrogen was used for cell culture after the addition of 1% penicillin‐streptomycin and 10% FBS.
2.3. RNA extraction and RT‐qPCR
Total RNAs from cultured cells or tissues were extracted using TRIzol reagent (Invitrogen) and then used for cDNA synthesis as detailed by the manufacturer (TaKaRa). Quantitative analyses were carried out using SYBR Premix Ex Taq II reagents (TaKaRa), with U6 or GAPDH as the internal reference as needed. Relative expression was calculated based on the 2‐ΔΔCt method. Primer sequences are listed in Table 1.
Table 1.
Primer sequences
| Genes | Forward primer (5′→3′) | Reverse primer (5′→3′) |
|---|---|---|
| TNK2‐AS1 | TAACAGGACTGGGCTTCCTTAC | GGGGACGCAGGATGTAGG |
| GAPDH | GGAGCGAGATCCCTCCAAAAT | GGCTGTTGTCATACTTCTCATGG |
| U6 | CTCGCTTCGGCAGCACA | AACGCTTCACGAATTTGCGT |
| miR‐4761‐3p | CCGAGTAGTACTGTGCATATC | CTCAACTGGTGTCGTGGA |
| miR‐4712‐5p | CGAGGAAATGAGAGACCTGT | CTCAACTGGTGTCGTGGA |
| miR‐770‐5p | TAGAGTCCAGTACCACGTGT | CTCAACTGGTGTCGTGGA |
| miR‐1913 | TCGAGTCTGCCCCCTCCGCTG | CTCAACTGGTGTCGTGGA |
| miR‐324‐3p | TAATATCCCACTGCCCCAGGT | CTCAACTGGTGTCGTGGA |
| miR‐3918 | TATATACAGGGCCGCAGATG | CTCAACTGGTGTCGTGGA |
| miR‐129‐1‐3p | TAGAGAAGCCCTTACCCCAAA | CTCAACTGGTGTCGTGGA |
| miR‐129‐2‐3p | ATGAGAAGCCCTTACCCCAAA | CTCAACTGGTGTCGTGGA |
| miR‐125a‐5p | TCGAGTCCCTGAGACCCTTTA | CTCAACTGGTGTCGTGGA |
| miR‐125b‐5p | TCGAGTCCCTGAGACCCTA | CTCAACTGGTGTCGTGGA |
| miR‐4319 | CCGAGTCCCTGAGC | CTCAACTGGTGTCGTGGA |
| miR‐328‐3p | TAGATCTGGCCCTCTCTGC | CTCAACTGGTGTCGTGGA |
| miR‐802 | TCGGCAGGCAGTAACAAAGATTC | CTCAACTGGTGTCGTGGA |
| miR‐3126‐5p | TCGAGTGAGGGACAGATGC | CTCAACTGGTGTCGTGGA |
| miR‐6875‐5p | TAGAGTGAGGGACCCAGG | CTCAACTGGTGTCGTGGA |
| miR‐452‐5p | CCGAGAACTGTTTGCAGAG | CTCAACTGGTGTCGTGGA |
| miR‐4676‐3p | CCGAGCACTGTTTCACCAC | CTCAACTGGTGTCGTGGA |
| miR‐892c‐3p | CCGAGCACTGTTTCCTTTC | CTCAACTGGTGTCGTGGA |
| SMG5 | CCGAAGCAAAAGTCCTCCAC | CAGCTCCTCAGCCTTTCTCC |
| TYSND1 | GCACTTCCATGAAGGCGAGG | GGAGCACCGTGATGGGAATG |
| WDR1 | GGGATACCACGCAGAAGGAG | GCTTGATGTCCACGCTGTTG |
| NCKAP5L | TTGCATTTCCTAGCAAGGTGAC | CTGGGAACAAGGAAGAGAAGC |
| GUCD1 | TTTTGCCCACAGCACATGAC | GGGGCTACCACCATTTTGCAG |
| AIFM1 | GCACGCTCTAACATCTGGGT | TTGGGGTTGTCTTGTGCAGT |
| YY1 | CCCAAGGGATCAGTGTGGTG | GGGGACTGGGTGATAACGTG |
2.4. Plasmid transfection
shRNAs targeting specifically TNK2‐AS1, WDR1, and YY1, as well as the corresponding non‐cancer (NC) shRNAs, were procured from GeneChem. miR‐4319 mimics/inhibitor and NC mimics/inhibitor were procured from Gene Pharma Company. pcDNA3.1 vectors were purchased from Invitrogen and used to construct pcDNA3.1/WDR1 and pcDNA3.1/YY1 vectors, with the empty vector as the NC. Plasmid transfection into U2OS and Saos‐2 cells was conducted for 48 h in 24‐well plates using lipofectamine 2000 reagent (Invitrogen). All sequences are provided in Table S1.
2.5. Colony formation assay
In total, 500 U2OS and Saos‐2 cells were plated into each well of 6‐well plates and cultured for 14 d. Colonies were fixed in 4% paraformaldehyde, stained with 0.1% crystal violet and then counted.
2.6. EdU staining assay
Here, 5 × 10⁴ U2OS and Saos‐2 cells were fixed then permeabilized in 0.5% Triton X‐100, and then incubated with 100 μL EdU medium for 3 h. Cell proliferation was monitored by EdU staining reagent (RiboBio) following the user guide. Nuclear detection was achieved using DAPI staining. After that, cells were observed using fluorescence microscopy (Olympus).
2.7. Transwell assay
Cell migration was detected using transwell chambers (Corning Co.), with Matrigel‐precoating for cell invasion examination. Here, 5 × 10³ U2OS and Saos‐2 cells in serum‐free medium were added to the upper chambers, and the lower chambers were filled with complete culture medium. Cells on the bottom were fixed 24 h later, followed by staining in crystal violet and counted under a light microscope.
2.8. TUNEL assay
U2OS and Saos‐2 cells were fixated on coverslips with 4% paraformaldehyde, washed in PBS and permeabilized in 0.1% Triton X‐100. Cell apoptosis was estimated using the One‐Step TUNEL Apoptosis Assay Kit (Beyotime). After DAPI staining, apoptotic cells were detected by fluorescence microscopy.
2.9. Bioinformatics analysis
miRNAs interacting with TNK2‐AS1 and that of target mRNAs for selected miRNA were identified using the starBase v.2.0 database (http://starbase.sysu.edu.cn/) in accordance with the suggested method. 14
2.10. Western blot
Total cell protein extracts were obtained for protein separation using 12% SDS‐PAGE, followed by protein transfer onto PVDF membranes. After treatment with 5% nonfat milk, membranes were probed with diluted primary antibodies (1:2000) against GAPDH (loading control; ab9485) and Bcl‐2 (ab32124), Bax (ab32503) and WDR1 (ab173574) overnight at 4°C. Membranes were then washed in TBST, followed by incubation with diluted HRP‐labeled secondary antibody (1:5000; ab205718) for 2 h at room temperature. Signals were examined using the ECL detection system (Bio‐Rad).
2.11. Subcellular fractionation
Here, 1 × 10⁶ U2OS and Saos‐2 cells in precooled PBS were subjected to cell fractionation buffer and then centrifuged to separate the cell nucleus and cell cytoplasm based on the methodology in the PARIS™ kit (Invitrogen). Expression levels of GAPDH, TNK2‐AS1, and U6 were monitored using RT‐qPCR.
2.12. Fluorescence in situ hybridization (FISH)
U2OS and Saos‐2 cells were dehydrated and then air dried for incubation with the TNK2‐AS1‐FISH probes (RiboBio) in hybridization buffer. Cells were washed and stained in Hoechst solution for nuclei staining. Cells were observed by fluorescence microscopy.
2.13. RNA immunoprecipitation
RNA immunoprecipitation (RIP) assay was performed for U2OS and Saos‐2 cells as instructed by the supplier for the Magna RIP™ RNA binding protein immunoprecipitation kit (Millipore). Cell lysates were treated with magnetic beads conjugated to human Ago2 antibody (#2897, Cell Signaling Technology) or to control IgG antibody (ab172730, Abcam) in RIP buffer. After digestion, RNA immunoprecipitates were acquired for RT‐qPCR analysis.
2.14. RNA pull‐down assay
RNA pull‐down assay was performed on U2OS and Saos‐2 cells using the Pierce Magnetic RNA‐Protein Pull‐Down Kit (Thermo Fisher Scientific). Sequences of miR‐4319 with wild‐type or mutated seed regions were synthesized and biotinylated into Bio‐miR‐4319‐WT/Mut probes, with a nonsense sequence biotinylated as NC (Bio‐NC). Cell extracts were treated with the above probes and streptavidin‐conjugated magnetic beads. Finally, RNAs pulled down by beads were analyzed by RT‐qPCR.
2.15. Luciferase reporter assay
Full‐length fragments of TNK2‐AS1 or WDR1 3′UTR covering wild‐type or mutated miR‐4319 target sites were inserted into pmirGLO reporter vectors (Promega), named TNK2‐AS1‐WT/Mut (full length: 4103 nucleotides) and WDR1‐WT/Mut (full length: 1039 nucleotides). After co‐transfecting the above recombinant reporters with miR‐4319 mimics or NC mimics for 48 h using lipofectamine 2000, U2OS and Saos‐2 cells were subjected to the Luciferase Reporter Assay System (Promega) to detect luciferase activity. For transcription analysis, cells were co‐transfected with pGL3 reporter vector (Promega) covering the indicated TNK2‐AS1 promoter sequences (wild‐type, site 1‐ or site 2‐mutated, or site 1/2‐mutated) and pcDNA3.1/YY1 or NC‐pcDNA3.1 vectors. Luciferase activity was also tested using the Luciferase Reporter Assay System 48 h later.
2.16. In vivo animal experiments
Here, 1 × 10⁶ U2OS cells were transfected with sh‐NC, sh‐TNK2‐AS1#1, or sh‐TNK2‐AS1#1 + pcDNA3.1/WDR1 for 48 h, and the 3 types of U2OS cells were then injected subcutaneously into male BALB/c nude mice (6 wk old; National Laboratory Animal Center, Beijing, China). Tumor volume was monitored every 4 d, and mice were killed by cervical decapitation at 28 d after injection. Tumors were excised carefully from mice for weight assessment and the following analyses. Animal‐related experiments were approved by the Animal Research Ethics Committee of Zhengzhou University.
2.17. Chromatin immunoprecipitation (ChIP)
Based on the specified protocol, ChIP assay was conducted in U2OS and Saos‐2 cells using the EZ ChIP™ Chromatin Immunoprecipitation Kit (Millipore). Crosslinked chromatin DNA was collected and sonicated into 200‐bp to 1000‐bp fragments, and then immunoprecipitated with YY1 antibody (#63227, Cell Signaling Technology) or control IgG antibody (#3900, Cell Signaling Technology). Quantification of DNA fragments in precipitates was accomplished using RT‐qPCR.
2.18. Statistical analyses
Bio‐triple repeats were applied for all assays, and experimental results are given as means ± standard deviation (SD) after processing using PRISM 6 software (GraphPad, San Diego, CA, USA). Group difference was estimated by t test or one‐way ANOVA, with a P < .05 threshold of statistical significance.
3. RESULTS
3.1. TNK2‐AS1 is upregulated in OS and facilitates malignancy in OS cells
To explore the function of TNK2‐AS1 in OS, we 1st used RT‐qPCR to detect its expression under different conditions. TNK2‐AS1 was upregulated in OS cell lines (U2OS, HOS, Saos‐2 and 143B) compared with human osteoblasts (hFOB1.19) (Figure 1A), but not upregulated in chondrosarcoma or Ewing sarcoma cell lines when compared with the corresponding normal controls (Figure S1A). TNK2‐AS1 expression was elevated in 60 OS samples relative to matched non‐tumor samples (Figure S1B). U2OS and Saos‐2 cells were utilized for further functional assays due to their higher TNK2‐AS1 expression levels in all tested OS cell lines. TNK2‐AS1 expression in U2OS and Saos‐2 cells was lower after transfection with sh‐TNK2‐AS1#1/2 (Figure 1B), and this reduction seemed dose dependent (Figure S1C). The results of colony formation and EdU assays demonstrated that TNK2‐AS1 downregulation markedly hampered OS cell proliferation (Figure 1C,D). Similarly, the migration and invasion of OS cells were also dramatically blocked by downregulated TNK2‐AS1 (Figure 1E,F). Conversely, in the absence of TNK2‐AS1, cell apoptosis rate was greatly increased (Figure 1G), accompanied by a decrease in Bcl‐2 protein levels and an increase in Bax protein levels (Figure 1H). Overall, TNK2‐AS1 expression levels were high and contributed to OS malignancy.
Figure 1.
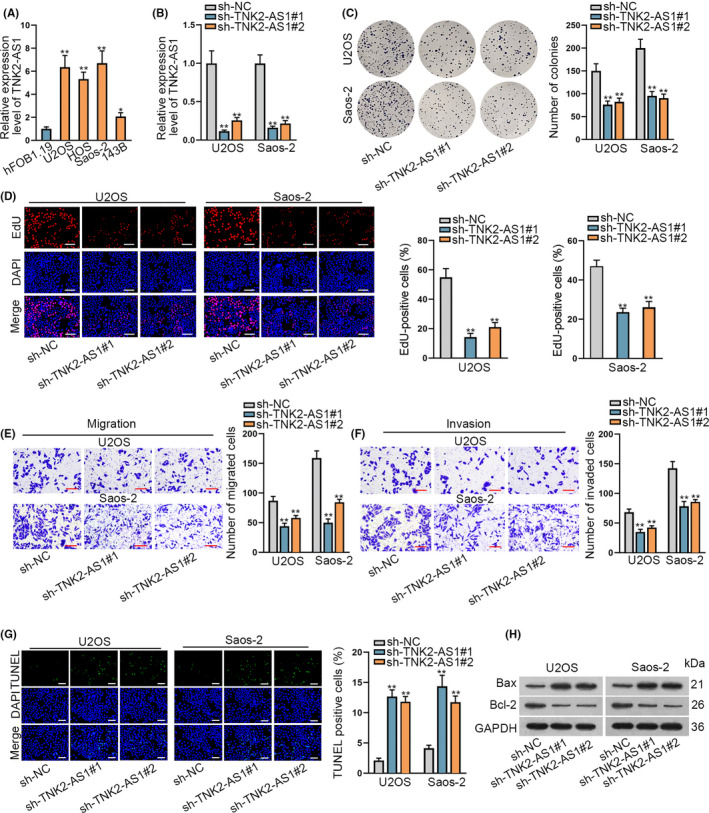
TNK2‐AS1 was upregulated and facilitated the oncogenic phenotypes of OS cells. A, TNK2‐AS1 expression was examined by RT‐qPCR in OS cell lines (U2OS, HOS, Saos‐2 and 143B) and a human osteoblast line (hFOB1.19). B, Expression of TNK2‐AS1 in cells transfected with sh‐TNK2‐AS1#1/2 was tested by RT‐qPCR. C, D, Colony formation and EdU assays assessed the proliferation of U20S and Saos‐2 cells with or without TNK2‐AS1 silence. D: scale bars = 120 μm. E, F, Cell migration and invasion were evaluated by transwell assays. G, H, TUNEL assays evaluated cell apoptosis rate and western blot measured the level of proteins associated with apoptosis. G: scale bars = 120 μm. * P < .05, ** P < .01
3.2. miR‐4319 is expressed at low levels in OS cells and inhibits OS cell proliferation, migration, and invasion
Analysis of TNK2‐AS1 regulation in OS started by determining its subcellular localization in OS cells. Data from nuclear‐cytoplasmic fractionation and FISH assays showed that TNK2‐AS1 accumulated mainly in the cytoplasm (Figure 2A,B). Results of RIP assays demonstrated that Ago2 and IgG could be precipitated specifically by their corresponding antibodies (Figure S1D), while TNK2‐AS1 was found in abundance after precipitation of anti‐Ago2 (Figure 2C), highlighting the ceRNA potential of TNK2‐AS1 in OS cells. miRNAs were then analyzed to access possible interactions with TNK2‐AS1. The starBase v.2.0 database (http://starbase.sysu.edu.cn/) predicted that, in total, 19 miRNAs could bind to TNK2‐AS1 (Table S2). RT‐qPCR data demonstrated that only miR‐4319 had poor expression in OS cell lines compared with in hFOB1.19 cells (Figure 2D). Downregulation of miR‐4319 in 60 OS tissues was identified when compared with paired non‐cancerous controls (Figure S1E). Binding sequences between TNK2‐AS1 and miR‐4319 are shown in Figure 2E. Outcomes of RNA pull‐down assays showed that the Bio‐miR‐4319‐WT combination could pull down TNK2‐AS1 but that Bio‐miR‐4319‐Mut could not (Figure 2F). miR‐4319 expression was elevated in 2 OS cells after transfection with miR‐4319 mimics (Figure 2G), and this elevation seemed dose dependent (Figure S1F). Luciferase activity of TNK2‐AS1‐WT was clearly decreased following miR‐4319 upregulation, but that of TNK2‐AS1‐Mut remained unchanged (Figure 2H). Effects of miR‐4319 on OS cell functions were analyzed. Results demonstrated that overexpression of miR‐4319 could inhibit cell proliferation (Figure 2I,J), and retard cell migration and invasion (Figure 2K,L), but facilitate cell apoptosis (Figure 2M,N). Therefore, miR‐4319 was a tumor suppressing factor that could bind to TNK2‐AS1 in OS cells.
Figure 2.
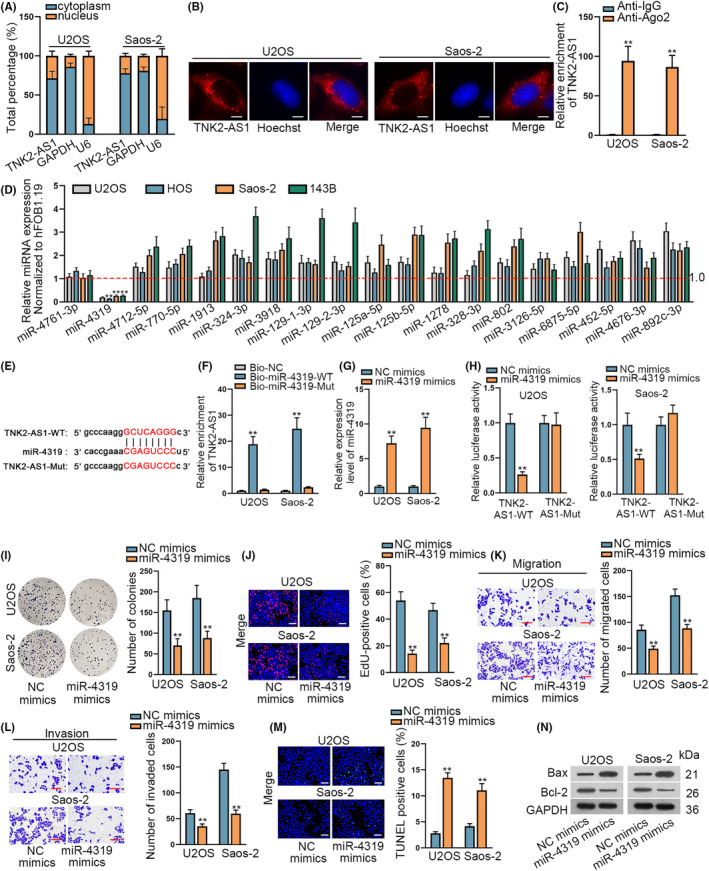
miR‐4319 was expressed at low levels in OS cells and hampered cell proliferation, migration, and invasion. A, B, Nuclear cytoplasm fractionation and FISH assays identified the place of TNK2‐AS1 in OS cells. B: scale bars = 10 μm. C, RIP assays demonstrated that TNK2‐AS1 could bind to Ago2. D, 19 miRNA expression levels in OS cell lines were evaluated by RT‐qPCR. E, Binding sequences between TNK2‐AS1 and miR‐4319 were predicted using the starBase database. F, RNA pull‐down assay verified that miR‐4319 could bind to TNK2‐AS1. G, miR‐4319 expression was examined by RT‐qPCR in cells transfected with miR‐4319 mimics or NC mimics. H, Luciferase reporter assays verified that miR‐4319 could bind to TNK2‐AS1. I‐N, Effects of miR‐4319 on OS cells were assessed by colony formation, EdU, transwell assay, TUNEL, and western blot experiments. J: scale bars = 120 μm, M: scale bars = 120 μm. ** P < .01
3.3. WDR1 binds to miR‐4319 in OS cells
The downstream target of miR‐4319 in OS was investigated. The starBase database predicted that 6 mRNAs had the possibility to bind to miR‐4319 based on the following criteria: CLIP Data: strict stringency (≥5), Degradome Data: high stringency (≥3), with results shown in Table S3. Only WDR1 expression, however, decreased following miR‐4319 upregulation (Figure 3A). WDR1 expression was also reduced in response to TNK2‐AS1 downregulation (Figures 3B and S2A). RT‐qPCR data showed high levels of WDR1 expression in OS cell lines and tissues (Figures 3C and S2B,C). RIP assays demonstrated that both Ago2 and IgG were precipitated by their respective antibodies (Figure S2D), whereas TNK2‐AS1, WDR1 and miR‐4319 were precipitated in abundance only by the Ago2 antibody (Figure 3D). Binding sites between WDR1 and miR‐4319 were forecast by bioinformatics analysis (Figure 3E). RNA pull‐down data verified that miR‐4319 could bind to WDR1 only in its wild‐type state (Figure 3F). Furthermore, luciferase reporter assay results demonstrated that the luciferase activity of WRD1‐WT decreased following miR‐4319 overexpression, but no change was seen in the WDR1‐Mut (Figure 3G). To achieve miR‐4319 inhibition in U2OS and Saos‐2 cells, a miR‐4319 inhibitor was transfected into 2 cell lines (Figure 3H). Reduced WDR1 expression levels found due to TNK2‐AS1 depletion were recovered following miR‐4319 inhibition (Figures 3I and S2E). In summary, WDR1 targeted by miR‐4319 was positively regulated by TNK2‐AS1 in OS cells.
Figure 3.
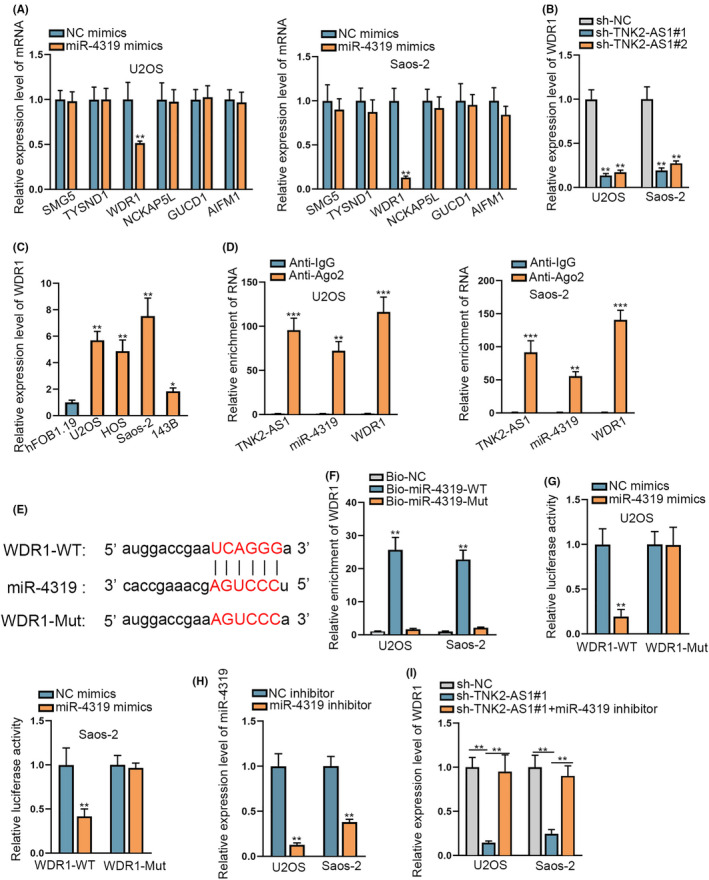
WDR1 could bind to miR‐4319 in OS cells. A, Expression levels of 6 mRNAs were evaluated by RT‐qPCR in cells with or without miR‐4319 upregulation. B, WDR1 expression was evaluated by RT‐qPCR in cells with TNK2‐AS1 depletion or not. C, WDR1 expression was analyzed by RT‐qPCR in OS cell lines. D, RIP assays corroborated the coexistence of TNK2‐AS1, miR‐4319, and WDR1 in RISCs. E, Binding sequences between miR‐4319 and WDR1 were predicted using the starBase database. F, G, RNA pull‐down and luciferase reporter assays validated that miR‐4319 bound to WDR1 at predicted sites. H, miR‐4319 expression was evaluated by RT‐qPCR in cells with miR‐4319 inhibitor or NC inhibitor. I, WDR1 expression was tested through RT‐qPCR in cells with sh‐TNK2‐AS1#1 or together with miR‐4319 inhibitor. * P < .05, ** P < .01
3.4. WDR1 is a malignancy‐facilitator in OS and is required for TNK2‐AS1‐contributed OS progression
Next, we analyzed the influence of WDR1 on OS progression. Loss‐of‐function experiments were performed after confirming reduced WDR1 expression due to sh‐WDR1#1/2 in U2OS and Saos‐2 cells (Figures 4A and S2F). The proliferative ability of OS cells was reduced following WDR1 silencing based on colony formation data and EdU assays (Figure 4B,C). Similarly, migration and invasion of OS cells were reduced following WDR1 downregulation (Figure 4D,E). In contrast, cell apoptosis increased after downregulation of WDR1 (Figure 4F,G). Rescue assays were used to determine whether WDR1 was important in TNK2‐AS1‐affected OS development. Increased WDR1 expression in U2OS cells was found following transfection with pcDNA3.1/WDR1 (Figures 4H and S2G). Rescue assays demonstrated that TNK2‐AS1 depletion‐hindered cell proliferation was restored following upregulation of WDR1 (Figure 4I,J). Reduction in cell migration and invasion due to silenced TNK2‐AS1 was reversed by WDR1 overexpression (Figure 4K,L). Increase in apoptosis induced by TNK2‐AS1 silencing was counteracted by upregulation of WDR1 (Figure 4M,N). In conclusion, WDR1 accelerated the oncogenic characteristics of OS cells; TNK2‐AS1 expediated OS progression by upregulating WDR1.
Figure 4.
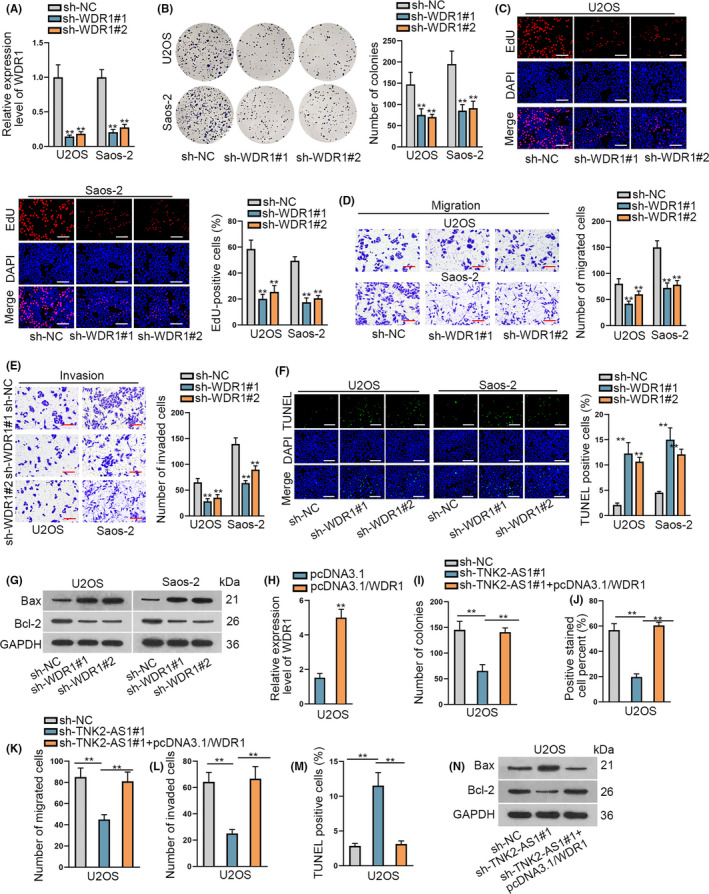
WDR1 facilitated the progression of OS and its overexpression rescued the effect of silenced TNK2‐AS1 on OS cells. A, WDR1 expression was evaluated by RT‐qPCR in OS cells with sh‐WDR#1/2. B‐G, Effects of WDR1 on OS cells were assessed by functional assays. C: scale bars = 120 μm, F: scale bars = 120 μm. H, Expression of WDR1 was examined by RT‐qPCR in cells with pcDNA3.1/WDR1 transfection. I‐N, Rescue assays were carried out in cells containing transfected sh‐NC, sh‐TNK2‐AS1#1 or sh‐TNK2‐AS1#1 plus pcDNA3.1/WDR1. ** P < .01
3.5. TNK2‐AS1 depends on WDR1 to enhance OS tumorigenesis in vivo
To further confirm the effects of TNK2‐AS1 on OS progression, we carried out in vivo experiments. TNK2‐AS1 expression decreased in tumors derived from sh‐TNK2‐AS1#1‐transfected U2OS cells, but co‐transfection of pcDNA3.1/WDR1 had no effect on TNK2‐AS1 levels in the above tumors (Figure 5A). Reduced WDR1 expression was also detected in tumors from TNK2‐AS1‐depleted cells, however this reduction could be reversed in tumors co‐transfected with sh‐TNK2‐AS1#1 and pcDNA3.1/WDR1 (Figure 5B). Therefore, the growth rate of tumors with TNK2‐AS1 inhibited decreased, but recovery of WDR1 induced by pcDNA3.1/WDR1 offset this decrease (Figure 5C). A similar outcome was also seen when accessing tumor weight (Figure 5D). Decrease in cell proliferation in tumors with TNK2‐AS1 downregulated was also detected, but recovered by WDR1 overexpression (Figure 5E). Conversely, increased cell apoptosis in these tumors following TNK2‐AS1 silencing was counteracted by WDR1 upregulation (Figure 5F,G). In summary, TNK2‐AS1 facilitated the growth of OS cells in vivo by targeting WDR1.
Figure 5.
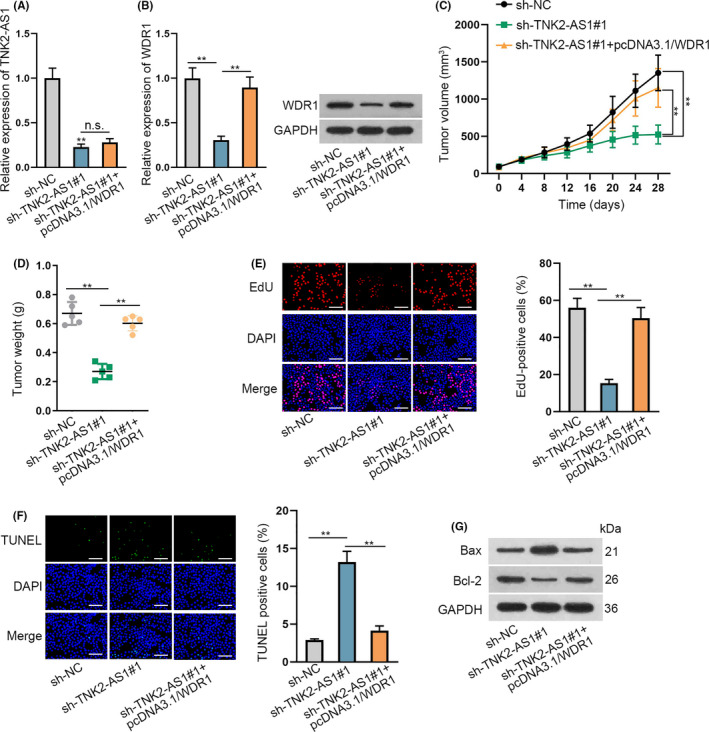
TNK2‐AS1 downregulation repressed OS tumor growth in vivo. A, TNK2‐AS1 expression was tested by RT‐qPCR in tumors from nude mice injected with indicated U2OS cells. B, Expression of WDR1 in above tumors was analyzed by RT‐qPCR and western blot. C, D Tumor volume and weight were examined. E‐G, Proliferation and apoptosis of cells in these tumors were assessed by EdU and TUNEL assays, as well as western blot analysis. E: scale bars = 120 μm, F: scale bars = 120 μm. ** P < .01
3.6. YY1 accelerates transcription of TNK2‐AS1 in OS cells
Lastly, we explored the region upstream of TNK2‐AS1 in OS cells. As predicted by the UCSC database (http://genome.ucsc.edu/), YY1 might be a potential transcription factor for TNK2‐AS1 (Appendix S1). Furthermore, the JASPAR database (http://jaspar.genereg.net/) predicted the DNA‐binding motif in YY1 and the binding sites for YY1 in the TNK2‐AS1 promoter (Figure 6A,B). To assess the effect of YY1 on TNK2‐AS1 expression in OS cells, we reduced YY1 expression using sh‐YY1#1/2 and augmented its expression using pcDNA3.1/YY1 (Figure 6C). TNK2‐AS1 expression was reduced in the absence of YY1 and increased on YY1 overexpression (Figure 6D). In addition, YY1 expression in OS tissues and cell lines was similar to that of TNK2‐AS1 (Figure S3A,B). Data from ChIP assay verified that the TNK2‐AS1 promoter was pulled down by the YY1 antibody (Figure 6E). Outcomes of luciferase reporter assays revealed that, along with YY1 upregulation, the luciferase activity of the TNK2‐AS1 promoter‐WT had increased to c. 4‐fold and that of the TNK2‐AS1 promoter with a site 1 or site 2 mutation was increased almost 2‐3‐fold, but there was no change in expression for the TNK2‐AS1 promoter with mutations in sites 1/2 (Figure 6F). Upregulation of YY1 led to OS cell proliferation, migration, and invasion, however these effects could be offset by WDR1 deficiency (Figure S3C‐F), proving that WDR1 was indispensable for YY1‐regulated OS progression. Taken together, YY1 facilitates the transcription of TNK2‐AS1 to boost WDR1 in OS.
Figure 6.
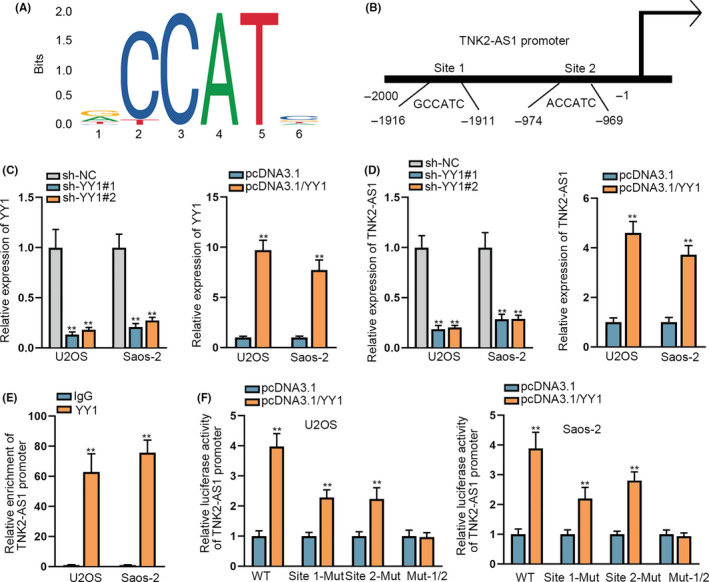
YY1 accelerated the transcription of TNK2‐AS1. A, The binding motif of YY1 was obtained from JASPAR. B, Binding sites for YY1 in the TNK2‐AS1 promoter were also predicted using JASPAR. C, D, RT‐qPCR evaluated YY1 and TNK2‐AS1 expression level s in cells transfected with sh‐YY1#1/2 or pcDNA3.1/YY1. E, ChIP assays confirmed that YY1 bound to the TNK2‐AS1 promoter. F, Luciferase reporter assay confirmed the effect of YY1 on TNK2‐AS1 transcription, as well as the precise binding sites of YY1 at the TNK2‐AS1 promoter.** P < .01
4. DISCUSSION
Osteosarcoma usually occurs in teenagers and has a rapid development. Targeted therapy has achieved increasing attention based on identification of non‐coding RNAs that function in various diseases. Mounting studies have reported that dysregulation of lncRNAs could lead to the initiation of or hasten the development of diseases including OS. For example, DLX6‐AS1 contributed to the stemness of OS cells by regulating miR‐129‐5p/DLK1 and Wnt signaling. 15 ODRUL accelerated OS progression by absorbing miR‐3182 to enhance MMP2. 16 TNK2‐AS1 was recently identified to boost the proliferation and migration of human aortic smooth muscle cells by regulating VEGFA and FGF1 through absorbing miR‐150‐5p. 17 Wang, Y., et al found that TNK2‐AS1 strengthened the viability and migration of NSCLC cells by targeting STAT3. 8 In this study, we 1st identified that TNK2‐AS1 was upregulated in OS cell lines and tissues. Furthermore, data from loss‐of‐function assays revealed that TNK2‐AS1 could decrease cell proliferation, migration, and invasion and accelerate cell apoptosis in OS. Increasingly, studies have highlighted the key role of cytoplasmic lncRNAs in ceRNA regulatory systems in diseases including OS. For example, GAS5 had inhibitory effects on cell growth and epithelial‐mesenchymal transition (EMT) in OS by modulating miR‐221/ARH1 axis. 18 LINC00858 exerted an oncogenic function in OS by modulating CDK14 and inhibiting miR‐139. 19 SNHG12 acted as a ceRNA against Notch2 by absorbing miR‐195‐5p to accelerate metastasis in OS. 20 In this study, we 1st illustrated that TNK2‐AS1 mainly accumulated in the cytoplasm of OS cells. Then, we validated miR‐4319 as downstream absorbed by TNK2‐AS1 in OS cells. miR‐4319 was downregulated in OS cells and played a role as a progression‐inhibitor in OS. This finding was consistent with those of several previous studies on colorectal cancer 21 and esophageal squamous cell carcinoma. 22
WDR1, an oncogene discovered in diverse cancers such as NSCLC 23 and breast cancer, 24 was identified as the target of miR‐4319 in OS cells. In the current research, we found that WDR1 was upregulated in OS cells and tissues, and that it worked as a tumor‐promoter in OS. Previous reports have elucidated that WDR1 could facilitate cytoskeletal reorganization in its dephosphorylated state, 25 which defines it as a key modulator of many biological processes such as cell proliferation and migration. 26 A recent work recognized WDR1 as an activator of the Wnt/β‐catenin pathway in pancreatic cancer. 27 If WDR1 functions in OS in the above way remains to be explored in the future. Here we demonstrated that overexpression of WDR1 could counteract the effects induced by TNK2‐AS1 downregulation in OS cells in vitro and in vivo, suggesting that TNK2‐AS1 protects WDR1 from miR‐4319‐induced silencing to inhibit OS development.
Upregulation of TNK2‐AS1 in OS cells was attributed to its transcriptional activation induced by YY1. YY1 has been shown to be a transcription factor in multiple cancers. 28 For instance, YY1 activated PVT1 to regulate lung cancer progression. 29 One report indicated the enhanced expression of YY1 as a transcription factor in OS cells; 30 the significance of YY1 in OS has been reported previously. De Nigris et al suggested that enhanced YY1 expression was highly related to an unfavorable prognosis in patients with OS. 31 YY1 depletion resulted in a large decrease in OS cell invasiveness and metastasis. 32 In this study, we found that YY1 could bind to the TNK2‐AS1 promoter to accelerate TNK2‐AS1 transcription in OS cells.
In summary, the present work demonstrated that TNK2‐AS1 activated by YY1 elicited oncogenic functions in OS by enhancing WDR1 and sequestering miR‐4319. Our study is the 1st to show the important role of TNK2‐AS1 in OS, and provided the 1st support for TNK2‐AS1 as a promising target for treating patients with OS.
DISCLOSURE
The authors have no conflicts of interest.
ETHICS APPROVAL AND CONSENT TO PARTICIPATE
Sample collection was achieved under the approval of the Ethics Committee of the Affiliated Cancer Hospital of Zhengzhou University, Henan Cancer Hospital, and all patients involved signed their informed consent before this study. Animal‐related experiments were approved by the Animal Research Ethics Committee of Zhengzhou University, China.
Supporting information
Figure S1
Figure S2
Figure S3
Table S1
Table S2
Table S3
Appendix S1
ACKNOWLEDGMENTS
We sincerely appreciate all laboratory members. Funding details are as following: Department of Science and Technology of Henan Province, 182102410001; Applied Research in the Diagnosis and Treatment of Osteosarcoma, 2018.1‐2019.12.
Yao W, Yan Q, Du X, Hou J. TNK2‐AS1 upregulated by YY1 boosts the course of osteosarcoma through targeting miR‐4319/WDR1. Cancer Sci. 2021;112:893–905. 10.1111/cas.14727
REFERENCES
- 1. Valery PC, Laversanne M, Bray F. Bone cancer incidence by morphological subtype: a global assessment. Cancer Causes Control. 2015;26:1127‐1139. [DOI] [PubMed] [Google Scholar]
- 2. Simpson E, Brown HL. Understanding osteosarcomas. JAAPA. 2018;31:15‐19. [DOI] [PubMed] [Google Scholar]
- 3. Anderson ME. Update on survival in osteosarcoma. The Orthop Clin North Am. 2016;47:283‐292. [DOI] [PubMed] [Google Scholar]
- 4. Kotake Y, Goto T, Naemura M, Inoue Y, Okamoto H, Tahara K. Long noncoding RNA PANDA positively regulates proliferation of osteosarcoma cells. Anticancer Res. 2017;37:81‐85. [DOI] [PubMed] [Google Scholar]
- 5. Wang H, Yu Y, Fan S, Luo L. Knockdown of long non‐coding RNA NEAT1 inhibits proliferation and invasion and induces apoptosis of osteosarcoma by inhibiting miR‐194 expression. Yonsei Med J. 2017;58:1092‐1100. [DOI] [PMC free article] [PubMed] [Google Scholar]
- 6. Wang Z, Tan M, Chen G, Li Z, Lu X. LncRNA SOX2‐OT is a novel prognostic biomarker for osteosarcoma patients and regulates osteosarcoma cells proliferation and motility through modulating SOX2. IUBMB Life. 2017;69:867‐876. [DOI] [PubMed] [Google Scholar]
- 7. Li GL, Wu YX, Li YM, Li J. High expression of long non‐coding RNA XIST in osteosarcoma is associated with cell proliferation and poor prognosis. Eur Rev Med Pharmacol Sci. 2017;21:2829‐2834. [PubMed] [Google Scholar]
- 8. Wang Y, Han D, Pan L, Sun J. The positive feedback between lncRNA TNK2‐AS1 and STAT3 enhances angiogenesis in non‐small cell lung cancer. Biochem Biophys Res Commun. 2018;507:185‐192. [DOI] [PubMed] [Google Scholar]
- 9. Li Y, Huo C, Lin X, Xu J. Computational Identification of Cross‐Talking ceRNAs. Adv Exp Med Biol. 2018;1094:97‐108. [DOI] [PubMed] [Google Scholar]
- 10. Yan H, Rao J, Yuan J, et al. Long non‐coding RNA MEG3 functions as a competing endogenous RNA to regulate ischemic neuronal death by targeting miR‐21/PDCD4 signaling pathway. Cell Death Dis. 2017;8:3211. [DOI] [PMC free article] [PubMed] [Google Scholar]
- 11. Jiang N, Wang X, Xie X, et al. lncRNA DANCR promotes tumor progression and cancer stemness features in osteosarcoma by upregulating AXL via miR‐33a‐5p inhibition. Cancer Lett. 2017;405:46‐55. [DOI] [PubMed] [Google Scholar]
- 12. Liu K, Hou Y, Liu Y, Zheng J. LncRNA SNHG15 contributes to proliferation, invasion and autophagy in osteosarcoma cells by sponging miR‐141. J Biomed Sci. 2017;24:46. [DOI] [PMC free article] [PubMed] [Google Scholar]
- 13. Ren D, Zheng H, Fei S, Zhao JL. MALAT1 induces osteosarcoma progression by targeting miR‐206/CDK9 axis. J Cell Physiol. 2018;234:950‐957. [DOI] [PubMed] [Google Scholar]
- 14. Li J‐H, Liu S, Zhou H, Qu L‐H, Yang J‐H. starBase v2.0: decoding miRNA‐ceRNA, miRNA‐ncRNA and protein–RNA interaction networks from large‐scale CLIP‐Seq data. Nucleic Acids Res. 2014;42:D92‐D97. [DOI] [PMC free article] [PubMed] [Google Scholar]
- 15. Luo L, Tang H, Ling L, et al. LINC01638 lncRNA activates MTDH‐Twist1 signaling by preventing SPOP‐mediated c‐Myc degradation in triple‐negative breast cancer. Oncogene. 2018. [DOI] [PubMed] [Google Scholar]
- 16. Zhu KP, Ma XL, Zhang CL. LncRNA ODRUL contributes to osteosarcoma progression through the miR‐3182/MMP2 Axis. Mol Ther. 2017;25:2383‐2393. [DOI] [PMC free article] [PubMed] [Google Scholar] [Retracted]
- 17. Cai T, Cui X, Zhang K, Zhang A, Liu B, Mu JJ. LncRNA TNK2‐AS1 regulated ox‐LDL‐stimulated HASMC proliferation and migration via modulating VEGFA and FGF1 expression by sponging miR‐150‐5p. J Cell Mol Med. 2019;23:7289‐7298. [DOI] [PMC free article] [PubMed] [Google Scholar]
- 18. Ye K, Wang S, Zhang H, Han H, Ma B, Nan W. Long noncoding RNA GAS5 suppresses cell growth and epithelial‐mesenchymal transition in osteosarcoma by regulating the miR‐221/ARHI pathway. J Cell Biochem. 2017;118:4772‐4781. [DOI] [PubMed] [Google Scholar]
- 19. Gu Z, Hou Z, Zheng L, Wang X, Wu L, Zhang C. Long noncoding RNA LINC00858 promotes osteosarcoma through regulating miR‐139‐CDK14 axis. Biochem Biophys Res Comm. 2018;503:1134‐1140. [DOI] [PubMed] [Google Scholar]
- 20. Zhou S, Yu L, Xiong M, Dai G. LncRNA SNHG12 promotes tumorigenesis and metastasis in osteosarcoma by upregulating Notch2 by sponging miR‐195‐5p. Biochem Biophys Res Comm. 2018;495:1822‐1832. [DOI] [PubMed] [Google Scholar]
- 21. Huang L, Zhang Y, Li Z, et al. MiR‐4319 suppresses colorectal cancer progression by targeting ABTB1. United European Gastroenterol J. 2019;7:517‐528. [DOI] [PMC free article] [PubMed] [Google Scholar]
- 22. Hu X, Wang M, Cao L, et al. miR‐4319 suppresses the growth of esophageal squamous cell carcinoma via targeting NLRC5. Curr Mol Pharmacol. 2019. [DOI] [PubMed] [Google Scholar]
- 23. Yuan B, Zhang R, Hu J, et al. WDR1 promotes cell growth and migration and contributes to malignant phenotypes of non‐small cell lung cancer through ADF/cofilin‐mediated actin dynamics. Int J Biol Sci. 2018;14:1067‐1080. [DOI] [PMC free article] [PubMed] [Google Scholar]
- 24. Xiang Y, Liao XH, Yao A, et al. MRTF‐A‐miR‐206‐WDR1 form feedback loop to regulate breast cancer cell migration. Exp Cell Res. 2017;359:394‐404. [DOI] [PubMed] [Google Scholar]
- 25. Mentel M, Ionescu AE, Puscalau‐Girtu I, et al. WDR1 is a novel EYA3 substrate and its dephosphorylation induces modifications of the cellular actin cytoskeleton. Sci Rep. 2018;8:2910. [DOI] [PMC free article] [PubMed] [Google Scholar]
- 26. Ono S. Functions of actin‐interacting protein 1 (AIP1)/WD repeat protein 1 (WDR1) in actin filament dynamics and cytoskeletal regulation. Biochem Biophys Res Commun. 2018;506:315‐322. [DOI] [PMC free article] [PubMed] [Google Scholar]
- 27. Li H, Liu X, Jiang S, et al. WD repeat‐containing protein 1 maintains β‐Catenin activity to promote pancreatic cancer aggressiveness. Br J Cancer. 2020;123:1012‐1023. [DOI] [PMC free article] [PubMed] [Google Scholar]
- 28. Agarwal N, Theodorescu D. The role of transcription factor YY1 in the biology of cancer. Crit Rev Oncog. 2017;22:13‐21. [DOI] [PMC free article] [PubMed] [Google Scholar]
- 29. Huang T, Wang G, Yang L, et al. Transcription factor YY1 modulates lung cancer progression by activating lncRNA‐PVT1. DNA Cell Biol. 2017;36:947‐958. [DOI] [PubMed] [Google Scholar]
- 30. de Nigris F, Botti C, de Chiara A, et al. Expression of transcription factor Yin Yang 1 in human osteosarcomas. Eur J Cancer. 1990;2006(42):2420‐2424. [DOI] [PubMed] [Google Scholar]
- 31. de Nigris F, Zanella L, Cacciatore F, et al. YY1 overexpression is associated with poor prognosis and metastasis‐free survival in patients suffering osteosarcoma. BMC Cancer. 2011;11:472. [DOI] [PMC free article] [PubMed] [Google Scholar]
- 32. de Nigris F, Rossiello R, Schiano C, et al. Deletion of Yin Yang 1 protein in osteosarcoma cells on cell invasion and CXCR4/angiogenesis and metastasis. Can Res. 2008;68:1797‐1808. [DOI] [PubMed] [Google Scholar]
Associated Data
This section collects any data citations, data availability statements, or supplementary materials included in this article.
Supplementary Materials
Figure S1
Figure S2
Figure S3
Table S1
Table S2
Table S3
Appendix S1


