

ABSTRACT
Obesity is a growing worldwide problem that generally starts in the early years of life and affects minorities more often than Whites. Thus, there is an urgency to determine factors that can be used as targets as indicators of obesity. In this study, we attempt to generate a profile of gut and oral microbial clades predictive of disease status in African American (AA) and European American (EA) children. 16S rDNA sequencing of the gut and saliva microbial profiles were correlated with salivary amylase, socioeconomic factors (e.g., education and family income), and obesity in both ethnic populations. Gut and oral microbial diversity between AA and EA children showed significant differences in alpha-, beta-, and taxa-level diversity. While gut microbial diversity between obese and non-obese was not evident in EA children, the abundance of gut Klebsiella and Magasphaera was associated with obesity in AA children. In contrast, an abundance of oral Aggregatibacter and Eikenella in obese EA children was observed. These observations suggest an ethnicity-specific association with gut and oral microbial profiles. Socioeconomic factors influenced microbiota in obesity, which were ethnicity dependent, suggesting that specific approaches to confront obesity are required for both populations.
KEYWORDS: Microbiome, minorities, obesity, disparity, socioeconomic factors
Introduction
Childhood obesity is a growing worldwide health problem that disproportionately affects ethnic minorities.1 In the United States, nearly 13.7 million children and adolescents are obese.2 Childhood obesity can lead to several health problems, including cardiovascular disease, type 2 diabetes, certain types of cancer, and coronavirus disease 2019 (COVID-19).3,4 The incidence of childhood obesity in African Americans (AAs) (22%) is higher than that of European Americans (EAs) (14.1%). Although the exact cause of this difference is not well established, physical and dietary habits could contribute to changes in the microbial composition and lead to obesity. Additionally, obesity has high heritability, suggesting that genetic factors, in addition to environmental factors, may be involved.5 We ascertained various factors that can impact obesity to define disparate rates in AA compared to EA populations in the United States.
The microbiome is influenced by numerous factors, including the environment, geographic location, genetics, and diet. A Western diet, comprised of low fiber, high sugar, and animal fat, influences the intestinal microbiome and has been linked to obesity.6,7 The salivary amylase gene (AMY1) helps in the digestion of starch by hydrolyzing the ∝-1,4 glycosidic bonds.8 AMY1 accounts for 40% to 50% of total protein in human saliva9,10 The salivary amylase protein level is correlated with the copy number.11 According to one study, variation in copy numbers (CNV) of AMY1 is directly dependent on the consumption of starch in a diet.8 AMY1 CNV is inversely associated with body mass index (BMI) and obesity.12 A recent study showed that AMY1 CNV is correlated with the composition and function of oral and gut microbiome.13
In another recent study, evaluation of gut microbiota differences across ethnicities of US populations revealed that a strong association between ethnicity and abundance of certain taxa was shown where Christensenellaceae was associated with BMI.14 High BMI has been associated with a decrease in gut microbial diversity.15 The obesity-associated gut microbiome can lead to altered colonic gene expression, suggesting an interaction between gene-environmental factors and obesity, as well as other diseases.16
There is a paucity of information to understand the factors influencing ethnic disparity in childhood obesity. In the present study, we compared socioeconomic factors such as maternal education, family income, and AMY1 CNV association with salivary and fecal microbiota in non-obese and obese AA and EA children.
Results
We evaluated differences in gut and oral microbiomes of 60 children with AA (n = 30) and EA (n = 30) ethnicity. Equal numbers of male and female children were included in both ethnic groups. Participants included non-obese and obese children with median mean age of 8.6 years. There were no significant differences in overall weight, height, BMI z-score, and AMYI CNV between the 2 groups. However, family income and parental education were significantly different (P < .001) between AA and EA populations. The characteristics of the study population are shown in Table 1.
Table 1.
Characteristics of the study population
| Characteristica | AA (n = 30) | EA (n = 30) | Total (N = 60) | P value |
|---|---|---|---|---|
|
Sex (No.) Female (%) Male (%) |
18 (60) 12 (40) |
17 (56.7) 13 (43.3) |
35 (58.3) 25 (41.7) |
1.00 |
|
Age (y) Mean (SD) |
8.56 (1.57) |
8.56 (1.27) |
8.56 (1.41) |
.83 |
|
Body weight (lb) Mean (SD) |
81 (32.3) |
73.3 (17.2) |
77.2 (26) |
.25 |
|
Height (cm) Mean (SD) |
135 (14) |
133 (9.37) |
134 (11.8) |
.61 |
|
BMI Mean (SD) |
19.6 (4.19) |
18.6 (3.05) |
19.1 (3.67) |
.29 |
|
Non-obese 5th – 95th percentileb (%) Mean BMI (SD) Obese ≥95th percentile Mean BMI (SD) |
21 (70) 17.47 (1.81) 9 (30) 24.50 (4.07) |
22 (73.3) 17.27 (2.27) 8 (26.7) 22.16 (1.73) |
43 (71.7) 17.37 (2.04) 17 (28.3) 23.40 (3.32) |
.75 .15 |
|
BMI
z-score Mean (SD) |
1.237 (1.11) |
0.992 (1.35) |
1.11 (1.23) |
.45 |
|
AMY1 CNV Mean (SD) |
6.89 (2.58) |
7.33 (2.36) |
7.11 (2.46) |
.49 |
|
Annual income ($USD) < 25,000 (%) 25,001–50,000 (%) 50,001–75,000 (%) >75,001 (%) |
23 (76.7) 0 (0) 2 (6.67) 5 (16.7) |
2 (6.67) 7 (23.3) 8 (26.7) 13 (43.3) |
25 (41.7) 7 (11.7) 10 (16.7) 18 (30) |
<.001 |
|
Maternal education No higher education (%) Higher education (%) |
13 (43.3) 17 (56.7) |
6 (20) 24 (80) |
19 (31.7) 41 (68.3) |
<.001 |
Abbreviations: AA, African American; BMI, body mass index; CNV, variation in copy number; EA, European American.
aData expressed as mean (SD) and P < .05 is considered as statistically significant.
bNo participants were recruited with less than 5th percentile BMI.
Gut Microbial Diversity Associated with Ethnicity
As ethnicity plays a vital role in microbial differences in the human microbiome, we first evaluated differences between the microbiome of AA and EA children. Also, a comparison of oral and gut microbiota showed differential structure and composition, with most taxa being differentially expressed in both sites (Figure S1). We compared gut microbial diversity between AA and EA participants. There were significant differences in the alpha and beta diversity between AA and EA participants (Figure 1a and b), supporting the previously published observations that microbial differences were dependent on race.7,17,18 Differential abundance analysis showed a higher abundance of Ruminococcaceae in AA children compared to EA children (Figure 1c). Race-associated bacterial differences were observed in many genera, including Anaerotruncus, Desulfovibrio, Marvinbryantia, Oxalobacter, Prevotella, Senegalimassilia, and Slackia, all showing higher abundance in AA children than EA children (Figure 1c, at FDR [false discovery rate] <0.1).
Figure 1.
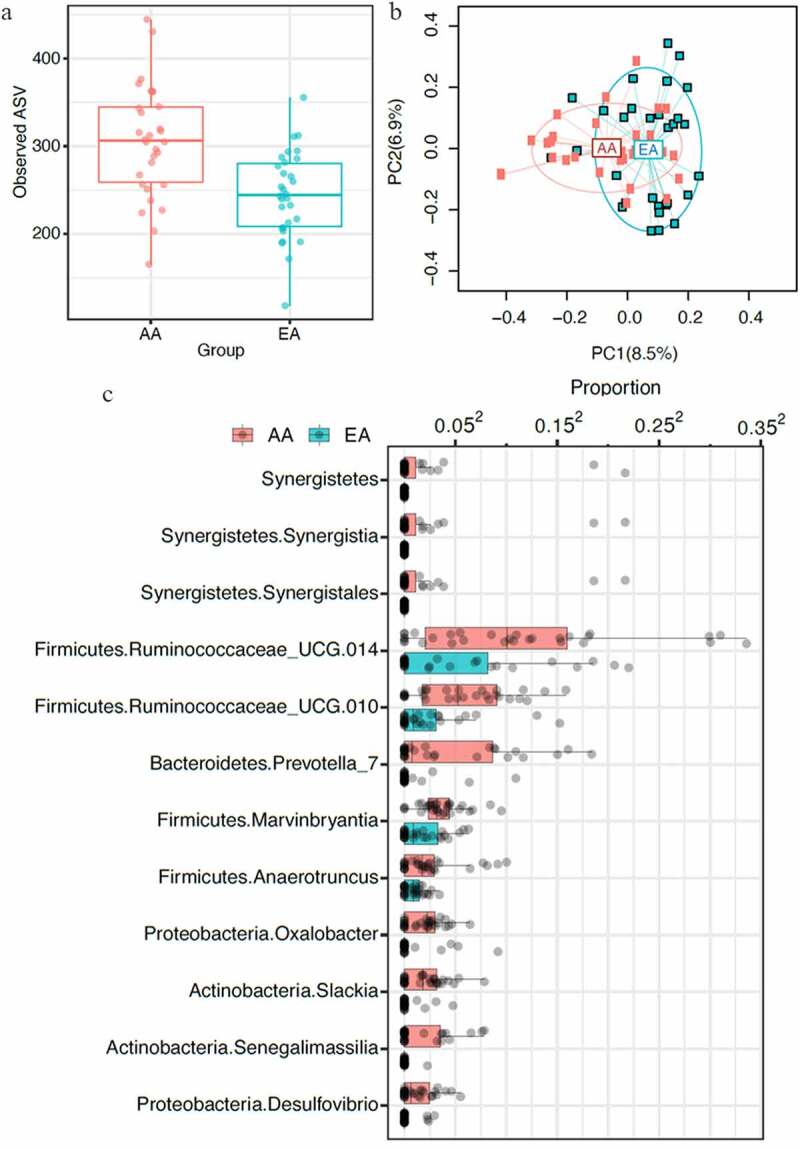
Gut microbiota variability, defined by 16S rDNA sequencing, between children of African American (AA) and European American (EA) ethnic populations (n = 60) showed significant differences between the 2 populations. A, Comparison of species richness, alpha diversity, defined by observed amplicon sequence variants (ASV) of AA and EA populations showed significant differences (p ≤ .05). B, Principal coordinate analysis (PCoA) plot based on the bray-curtis distance matrix constructed using ASVs. The percentage of variability explained by the corresponding coordinate is indicated on the axes. Each point represents a sample – red symbols indicate aa population and blue symbols indicate ea population. The lines indicate vectors representing the relationships between ASVs and each sample category. The ellipses serve a visual guide to group differences. Comparison of beta diversity between aa and ea populations showed significant differences in community structure (p ≤ .05). C, Differential abundance of taxa in AA and EA populations at 10% false discovery rate. Each dot represents a participant. The relative abundances were plotted on the square-root scale to better visualize the low abundance taxa
Oral Microbiota Differs By Ethnicity
Next, we determined whether oral microbiota has any ethnic specificity. The alpha diversity was similar between the AA and EA groups (Figure 2a and b). But comparison of oral bacterial diversity and composition showed a considerable difference in beta diversity between AA and EA ethnicity (Figure 2b). Differential abundance analysis showed an increased abundance of genera belonging to Firmicutes and Actinobacteria in the AA group and a higher abundance of Proteobacteria, Fusobacteria, and Tenericutes in the EA group (Figure S2). Streptococcus was present with an increased abundance in AA children compared to EA children, whereas Butyrivibrio, Capnocytophaga, Fusobacterium, Haemophilus, and Prevotella were reduced in AA compared to EA children (Figure 2c). Prevotella is a key bacterium that showed high abundance in the stool samples of AA children, but were at low levels in the oral microbiome of EA children.
Figure 2.
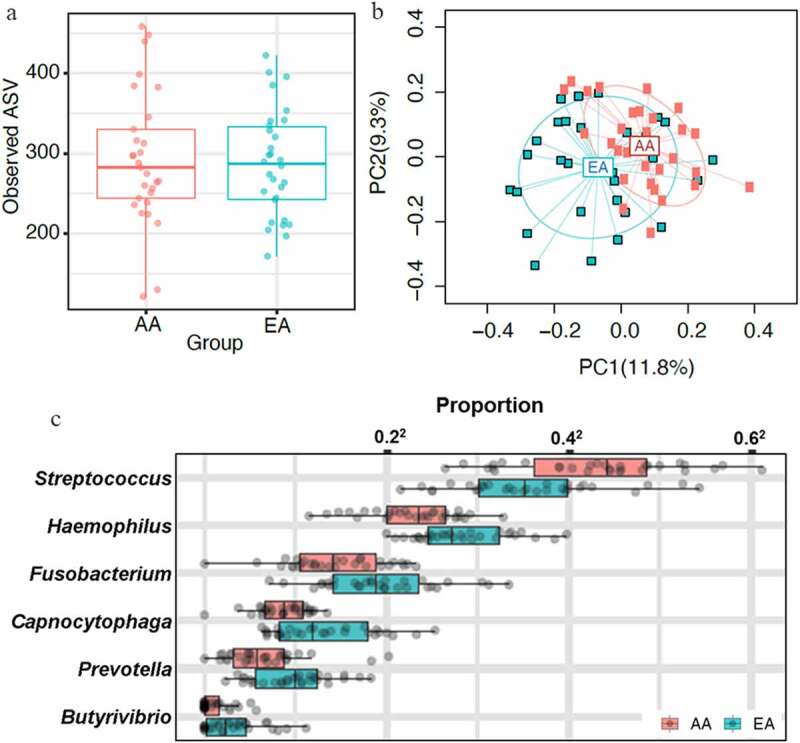
Oral microbiota comparison between AA and EA populations (n = 60) showed similar alpha diversity with considerable difference in beta diversity with ethnicity-specific taxa. Oral microbiota was sequenced using saliva samples. A, Alpha diversity was analyzed by observed ASVs. No significant difference in alpha diversity of oral microbiota was observed between AA and EA groups. B,Bray-curtis distance matrix for beta diversity between AA and EA populations was analyzed using permanova. Comparison between AA and EA groups showed a significant difference in beta diversity (p ≤ .05). C, Genus-level differentially abundant taxa in AA and EA groups at 10% false discovery rate were presented. The relative abundances were plotted on the square-root scale to better visualize the low abundance taxa. Streptococcus was present with an increased abundance in AA children compared to EA children, and 5 genera, butyrivibrio, capnocytophaga, fusobacterium, haemophilus, and prevotella, were abundant in EA but no in AA groups
Gut Microbiota is Associated With Obesity in AA Population
The initial groups of normal and overweight participants did not show any substantial differences (Figure S3), so they were divided into only obese and non-obese groups (normal and overweight groups were combined into non-obese). When both groups were analyzed individually, a substantial difference in alpha diversity (number of observed ASVs [amplicon sequence variants]) and beta diversity between obese and non-obese children was observed only in AA children (Figure 3a and b). The major microbiota difference was observed in the presence of rare and less abundant taxa. Differential abundance analysis of the AA group revealed the association of obesity with the abundance of taxa from Actinobacteria, Proteobacteria, and Firmicutes and notably Klebsiella and Magasphaera in obese AA children (Figure 3c, at FDR <0.1). Children from the EA group did not show a substantial difference in taxa abundance between obese and non-obese participants, suggesting that obesity-associated gut microbiome may be race dependent.
Figure 3.
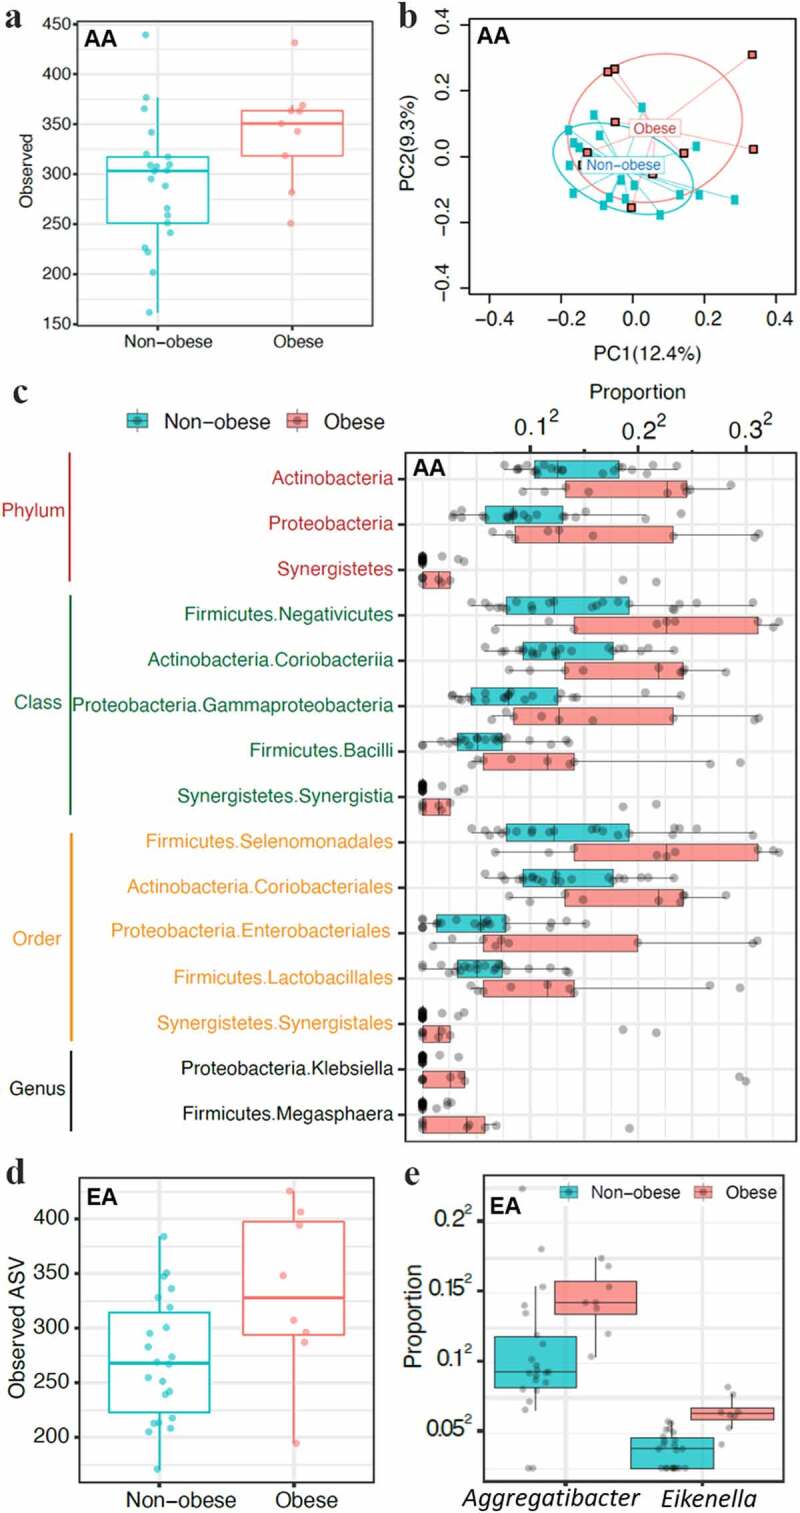
Microbiota differences between obese and non-obese children showed ethnicity-dependent associations. Oral microbial diversity was associated with obesity in EA children and gut microbial diversity in aa children. A-C, Gut microbiota differences in stool samples between obese and non-obese AA children. A, Alpha diversity measured by observed ASVs showed increased diversity in obese children compared to non-obese children. B, Beta diversity (bray-curtis distance) showed significant differences in gut microbiota between obese and non-obese AA children (p ≤ .05). C, Differentially abundant taxa in obese and non-obese AA children (n = 30). Children from the EA group did not show major differences in gut microbiota alpha and beta diversity as well as differences in taxa abundance between obese and non-obese participants (not shown). D-E, Oral microbial diversity was associated with obesity in EA children only (n = 30). D, Salivary microbial alpha-diversity comparison between obese and non-obese EA children showed obesity was associated with increased diversity. E, Genera Aggregatibacter and Eikenella abundance was increased in obese compared to non-obese EA children. Children from the AA group did not show significant differences in alpha, beta, and taxa diversity in salivary microbiota (not shown)
Oral Microbiota is Associated With Obesity in EA Children
An analysis on the association of oral microbiota with obesity did not show any considerable difference in alpha and beta diversity, and no taxa were found to be substantially associated in the AA group. On the other hand, a considerable difference in alpha diversity (observed ASV numbers) between obese and non-obese children was observed in the EA group (Figure 3d). Abundance of Aggregatibacter and Eikenella in the EA group were associated with obesity (Figure 3e, at FDR <0.1). These results suggest that obesity-associated oral microbiota may also be race dependent.
AMY1 Copy Numbers Not Correlated With Obesity
Recently, some studies have shown an association between salivary amylase enzyme and obesity, while others did not confirm this association.11,12,19,20 In this data set, there was no significant correlation between BMI z-score and AMY1 CNV in either population (Figure 4a). Also, no significant association was observed between oral microbiota and AMY1 CNV in either population. However, an increase in alpha diversity of gut microbiota was observed in children with low AMY1 CNV compared to high CNV (Figure 4b). Higher abundance of Bifidobacteriaceae representing Actinobacteria was present in children with low AMY1 CNV compared to high AMY1 in both populations (Figure 4c). These data suggest an association of gut microbiota with AMY1 even though there was no correlation between the BMI z-score and AMY1 CNV in the present data.
Figure 4.
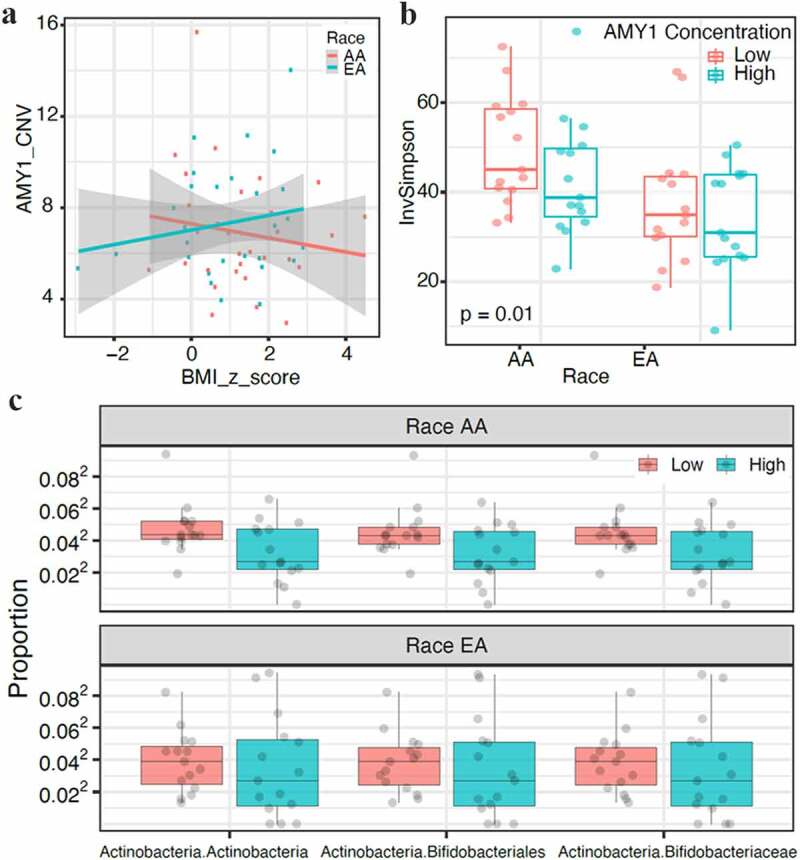
Correlation of AMY1 copy numbers (CNVs) with body mass index (BMI) and gut microbiome. AMY1 is not associated with BMI. A, AMY1 and BMI z-score did not show any correlation in EA and AA populations (n = 60). B, Alpha diversity measured by inverse simpson index (inv simpson) showed a significant difference in gut microbial diversity between low and high levels of AMY1 in AA children (p = .01) but not EA children. C, AMY1 levels reflected taxa diversity in the gut microbiome with low abundance of Bifidobacteriaceae representing Actinobacteria in AMY1-high children when compared to amy1-low children in both populations (p ≤ .05)
Role of Socioeconomic Factors in Obesity and Correlation to Microbiota
A report by The Centers for Disease Control and Prevention (CDC) in 2017 suggested that the prevalence of obesity can differ based on race, income, and education.21 Generally, lower-income groups and non-college graduates have a higher prevalence of obesity.21 Here, we tested whether obesity in the children of AA and EA groups is dependent on the income and education status of parents. Families with at least 1 parent with a college degree or any degree after high school were classified as having higher education. There was no significant difference in the BMI z-score in the 2 populations based on the education of parents (Figure 5a). As shown in Table 1, 77% of the AA group and 7% of the EA group had an annual household income of less than $25,000, showing a considerable difference in overall income between the 2 populations. Using a cutoff of $50,000 as low annual income allowed us to classifying 30% of children in the EA group as low income. Both AA and EA groups did not show a significant association of higher BMI z-score with an annual household income of more than $50,000 (Figure S4).
Figure 5.
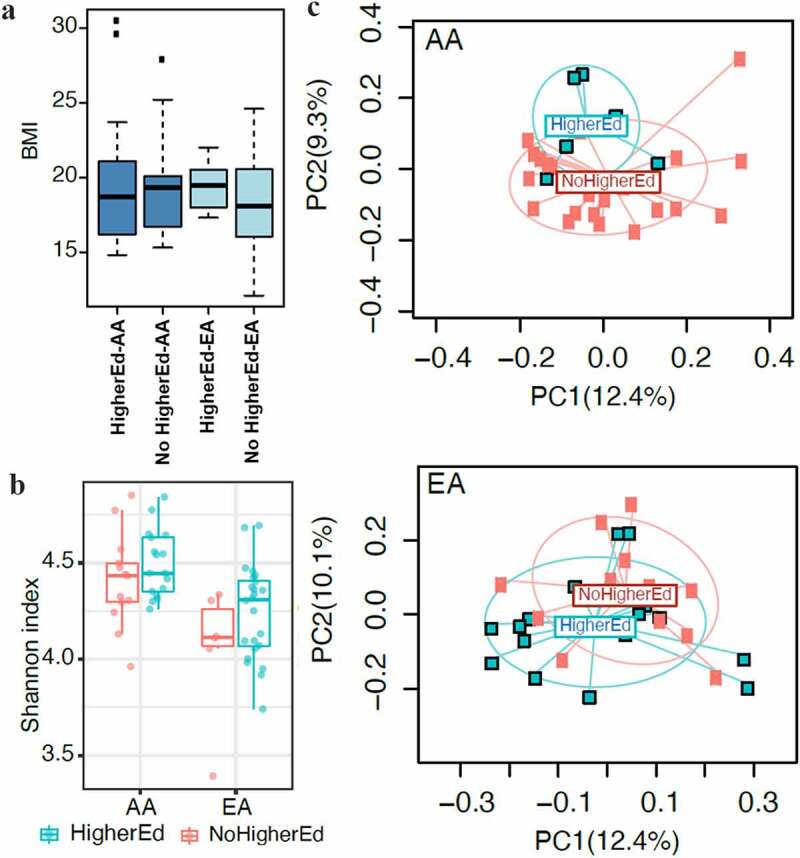
Educational status of parents did not impact BMI but did influence gut microbial diversity. Families with 1 parent with college degree were categorized as higher education. A, Correlation between educational status of parents and BMI z-score of children was not significant in either populations. B, Education levels of parents correlated with a nonsignificant but an increased trend of gut microbiota alpha diversity. C, Beta diversity in children of both groups showed significant differences associated with their parent’s educational status (P = .02). However, no abundance of specific taxa in gut microbiota was observed based on the educational status of the parents in both populations. No significant associations between educational status and oral microbiota were observed between populations (not shown)
A comparison of gut microbial composition based on the education of parents showed that a higher education status of parents was associated with a nonsignificant trend toward an increase in microbial diversity as measured by the Shannon index (P = .06) (Figure 5b). Interestingly, higher education was more strongly associated with beta diversity in the AA group than the EA group (Figure 5c). However, no abundance of specific taxa was observed based on the educational status of parents. Also, no associations between the education status and the oral microbiota were found.
Next, we determined whether income had any correlation with gut or oral microbiota in both populations. While there was no significant difference in the gut microbiota’s alpha diversity, the beta diversity was significantly associated with income (Figure 6a). Children from low-income families from both AA and EA populations had lower levels of Faecalitalea and higher Phascolarcobacterium, both belonging to the Firmicutes phylum (Figure 6b, at FDR <0.1). For the oral microbiota, no significant association was observed in the alpha diversity, though the microbial community structure was significantly different, as observed by a difference in beta diversity (Figure 6c). Interestingly, a strong association was evident only in the EA group. Differential abundance analysis showed an association of a higher abundance of Streptococcus in the EA group with low income only (Figure 6d). These data suggest that a microbial association between obesity and socioeconomic factors is dependent on ethnicity.
Figure 6.
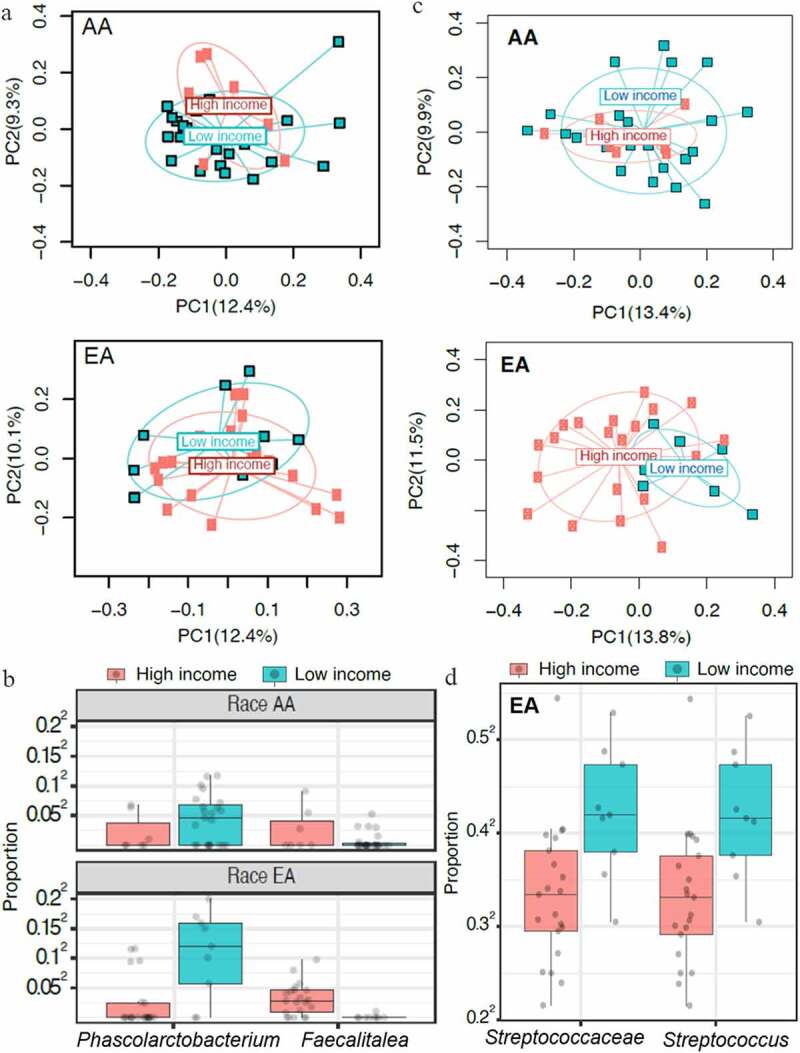
Family income strongly influences gut and oral microbiota based on ethnicity. A cutoff of $50,000 per family was used as low annual income. A, In both AA and EA children belonging to higher income families, an increased beta diversity in gut microbiota was shown (P = .03). No correlation between income and gut microbial alpha diversity was observed in both groups. B, Both groups had increased abundance of gut Phascolarcobacteria, with a decrease in Faecalitalea (both belonging to the phylum Firmicutes) in families with low income (P ≤ .05). Oral microbial diversity differed based on the income of the EA and AA families. C, Beta diversity as determined by Bray-Curtis distance was associated with income in both groups (P = .001). D, Differentially abundant taxa analysis of oral microbiota showed increased abundance of Streptococcus in EA children from low-income families. No differentially abundant taxa were associated with income in AA children (not shown)
Discussion
he recent COVID-19 pandemic has brought into focus the disproportionate burden of illness, with higher mortality rates in minority populations than the White population, according to the CDC.22 Even though the cause of this major disparity remains unclear, comorbidities have been suggested as the primary reason. An association between gut microbiota and obesity has been documented.16,23,24 There is an evidence of increased obesity prevalence in minorities, which starts during childhood. Hence, an insight into the factors that strongly influence oral and gut microbiome is essential to understand the cause of the variation in obesity.
There is limited information available on the gut and oral microbial profile in obese children of AA and EA ethnicity, and reports have not been consistent.25,26 One study reported an increase in Enterobacteriaceae in obese children compared to children of healthy weight, while another reported an increase in Bacteroides in obese Mexican children. In a study of a small adult AA population, a variability of gut microbiota was observed according to ethnicities with heritable taxa.14 A recent study suggested that heritability of certain microbes from an overweight mother to infant predisposes to obesity in adulthood.27 Magasphaera, a vaginal microbe, has been associated with obesity in adults.23 We observed an increased abundance of Magasphaera in obese children of AA descent. Similarly, Coriobacteriaceae and Runmicoccaceae observed in infants born to overweight mothers were increased in obese AA children.27 Whether the presence of these microbes in obese children is hereditary or due to mode of delivery is unclear, as birth mode was not collected in this study. The differences in BMI-associated taxa in children of AA and EA descent could also be due to the fact that heritable taxons of bacteria vary by ethnicity.14 Indeed, children of EA and AA descent showed variability in gut microbiome, as observed by alpha and beta diversity. AA children had a higher abundance of Anaerotruncus, Desulfovibrio, Marvinbryantia, Prevotella, Slackia, Senegalimassilia, Runmicoccaceae, and Oxalobacter, and the final 2 have been associated with obesity.27,28 Slackia spp are gut-associated bacteria that have been suggested to play a role in host lipid xenobiotic metabolism,29 and its abundance may be dependent on diet. Sulfate-reducing bacteria, Desulfovibrio, are reported to be associated with a high-fat diet,30 and its co-occurrence in the gut with Prevotella has been speculated to work synergistically for degrading mucin.31 Desulfovibrio has been reported in autistic children.32 A study on colorectal cancer showed that the richness of Desulfovibrio in the gut was associated with AA patients.33 In the present study, Desulfovibrio did not markedly correlate with obesity. Also, the abundance of Anaerotruncus, Marvinbryantia, and Senegalimassilia, not known to be related to obesity, in AA children was a novel observation. However, no major difference in the taxa between obese and non-obese EA children was somewhat surprising. Reasons for this could include mode of birth and diet. A previous study in AA and EA populations did show an increase in Prevotella in AAs, although that study was dependent on diet.7 An increase in Prevotella has been correlated with enhanced glucose metabolism in the gut.34 A recently published study showed that the association between gut Prevotella and BMI was most noticeable among AA adults.35 However in the present study, Prevotella in the gut of AA children did not associate with BMI, suggesting that the Prevotella-BMI association may be dependent on age.
Interestingly, the oral microbiome of EA children showed microbial variability between obese and non-obese children, whereas AA children did not show that variability. Salivary microbiota in obese EA children showed an abundance of Aggregatibacter and Eikenella, both associated with periodontitis and obesity.36–38 Aggregatibacter has been described as an oral pathogen associated with obesity in AA and Japanese adults.37 Eikenella was found to be increased in obese Brazilian patients with chronic periodontitis.38 Hence, the changes in oral microbiome may also have regional specificity. Gupta et al39 showed how geography, ethnicity, and subsistence play a role in the diversity of human microbiome composition. While many opportunistic pathogenic species, such as Streptococcus, Butyrivibrio, Capnocytophaga, Fusobacterium, Haemophilus, and Prevotella,40,41 showed differences in salivary microbiome between AA and EA children, Streptococcus are the only bacteria that differentiated with higher abundance in AA children, supporting a previous study of its increased presence in low-income AA populations.38 The present data suggest that the oral microbiome in obesity is much more relevant for EA children than AA children.
Reduced AMY1 copy numbers have been associated with increased BMI and obesity risk in European and Asian populations.11,42 In this study, no association between AMY1 CNV and BMI was observed in either population. The salivary microbiome in obese children has shown low diversity similar to obese children with type 2 diabetes.43 We did not observe any association between AMY1 CNV and oral microbiome in either population. However, there was an inverse relation between copy numbers and gut microbial diversity. Low AMY1 CNV was associated with increased gut microbial diversity in the AA population and obese AA children, supporting previous observations of low CNV association with gut diversity. Low AMY1 CNV has been associated with obesity and an increased abundance of Prevotella in Mexican children.44 In this study, a higher abundance of Bifidobacteriaceae was associated with low AMY1 CNV, suggesting that these associations could be ethnic-specific. Even though no association between AMY1 and oral microbiome was observed, salivary microbiota differed between the 2 populations and was markedly different between obese and non-obese children.
We then determined whether microbial variability can be explained by differences in socioeconomic factors within the 2 studied populations. A racial disparity in obesity has been reported, with a higher incidence of obesity in Blacks than Whites among individuals with higher education levels.45 In this study, families with parents having a college degree showed an increase in beta diversity in AA children. It is assumed that education would help parents pick healthier dietary options. However, since education levels were not associated with BMI, it suggests that increased awareness about obesity and diet is required.
Poverty has been associated with an increased burden of obesity.46 In this study, AA families with a higher annual income showed an association with obesity in children. However, 76% of the AA families had low income; thus, more families with higher income need to be studied. On the other hand, income had no correlation with obesity in the EA group, though increased beta diversity was associated with families with a higher annual income. Low income was associated with increased abundance of Phascolarcobacterium, a microbe present in the human gastrointestinal tract.47 This bacterium uses succinate produced by other bacteria and leads to production of propionate; thus, it is a microbe of health. However, when increased in abundance due to a high-fat diet, it has been associated with metabolic disorders in rats.48 On the other hand, Faecalitalea, a butyrate-producing Firmicute and reported to be 1 of the baseline species in healthy human gut,49 was decreased in children from low-income families. This suggests that income-based choice of diet may have a substantial influence on gut microbiota. However, the study is limited by low numbers of children in each category as well as differences in income and education levels between the 2 studied ethnic groups, impacting the ability to detect associations. Further limitations include a lack of other data, including metagenomics, transcriptomics, and metabolomics, that can provide an in-depth insight into ethnic-specific factors associated with obesity. Further studies are required to confirm these associations in ethnic populations.
Conclusions
Observations from this study suggest that, while children of AA descent show an association with gut microbiota and obesity, children of EA descent show an association between salivary microbiome and obesity. This means that in order to more accurately show that gut microbes are associated with obesity, different ethnic groups need to be studied, and any solution should be adapted to different ethnic populations. The study has limitations in the numbers of participants in various associations tested. Thus, further studies with increased numbers of children from the 2 populations are required to determine specific associations to provide ethnic-specific solutions to the obesity.
Materials and Methods
Participants and Anthropometric Parameters
All patients fulfilled the established exclusion and inclusion criteria. The study was approved by the institutional review board of Auburn University. Written informed consent was received from all participants and their parents prior to inclusion in the study. The inclusion criteria to admit participants in the study were age between 6 and 10 years and either EA or AA ethnicity. The exclusion criteria included children with major health problems associated with obesity, including cardiovascular disease or type 2 diabetes, and children who were taking antibiotics. The AA children (n = 30; 18 female, 12 male) and EA children (n = 30; 17 female, 13 male) residing in the state of Alabama, USA, were enrolled with the consent of their parents. Children with the major health problems outlined above were excluded from the study. The characteristics of the study population are given in Table 1.
Participants’ height was measured to the nearest 1/8 inch and weight to the nearest 4 ounces,26 and measurements were used to calculate BMI z-score,12 to assess for obesity, and to approximate the ideal weight for a person, considering both sex and age.50 The children were classified as normal weight, overweight, and obese based on CDC guidelines (https://www.cdc.gov/obesity/data/childhood.html). Based on BMI cutoff, non-obese groups are from the 5th to 95th percentile derived by combining the normal weight (5th to <85th percentile) and overweight (85th to <95th percentile) categories. Participants with a BMI ≥95th percentile were considered obese.
Sample Collection
Saliva collection was done using a saliva collection kit (DNA Genotek Inc., Ontario, Canada). Before the collection of saliva, children were asked to briefly rinse their mouth to avoid the influence of any food particles present. Fecal samples were collected using a stool collection kit (LPCO diagnostics, MS). Both saliva and fecal samples were transported immediately to the laboratory (using a temperature-controlled container) and stored at – 80°C.
AMY1 Gene Copy Number
DNA was extracted from saliva using the PrepIT.L2P method (DNA GenoTek, Ontario, Canada). Copy numbers for the AMY1 gene were done by polymerase chain reaction (PCR) (eMethods).12 Briefly, using a digital PCR (QuantStudio 3D Digital PCR) comprising 2 TaqMan assays (Hs07226361_cn FAM-labeled and Hs07226361_cn, FAM-labeled). For the PCR reaction, 14.5 μL of reaction mixture containing 7.25 μL of PCR Master Mix, 6 μL of diluted DNA (10 ng/μL), 0.725 μL of 20× RNase P, and 0.725 μL of 20× AMY1 were loaded into the PCR chip. PCR was performed by setting the appropriate parameters (initial denaturation at 96°C for 10 min, 39 cycles of 60°C for 2 min, and 98°C for 30 sec, followed by 1 cycle of 60°C incubation for 2 min, and then 4°C hold). After PCR reaction, the PCR chip was subjected to QuantStudio 3D Digital scanning and analysis (QuantStudio 3D Analysis Suite Software).
16S rDNA Sequencing
Fecal and oral samples were subjected to genomic DNA isolation using the MoBio PowerSoil Kit (QIAGEN, USA). Genomic DNA was subjected to PCR amplification of the V3-V5 region of 16S rDNA using 50 ng cDNA and 0.3 µM barcoded primers (V3_F: TCGTCGGCAGCGTCAGATGTGTATAAGAGACAGCCTACGGGAGGCAGCAG; V5_R: GTCTCGTGGGCTCGGAGATGTGTATAAGAGACAGCCGTCAATTCMTTTRAGT) with Kapa HiFi Hotstart Ready Mix (Kapa Biosystems). Samples were pooled to equal concentrations, then sequenced for 16S rRNA using the MiSeq 600 cycle v3kit (Illumina Inc.). Sequence files were denoised by DADA2 into ASVs;51 the SILVA database52 was used to assign taxonomy to ASVs using Naïve Bayes classifier, and FastTree53 was used to construct the phylogenetic tree among ASVs. Following quality control, we obtained 7,243,786 high-quality reads and a total of 12,842 ASVs. The median (range) of the sequencing depths for fecal and oral samples were 56,439 (9,099–118,425) and 56,559 (3,033–133,629), respectively.
Statistical Analysis
Anthropometric Data Analysis
Growth in children occurs until approximately 20 years of age. Therefore, the BMI z-scores were calculated using SPSS macro-based World Health Organization growth reference 2007 data adjusted for age and sex.54
AMY1 CNV
Calculation of AMY1 gene CNV was analyzed by the ratio between AMY1 and the RNAase P gene CNV obtained from 3D digital PCR analysis in an excel spreadsheet. The anthropometric data were compared between mean values of EA and AA groups by independent sample t test using SPSS (version 24, IBM, Armonk, NY, USA). The results in Table 1 are expressed as mean (SD), and P < .05 was considered statistically significant.
Microbiome Analysis
The microbiome data analysis was conducted for alpha diversity, beta diversity, and taxa abundances. We have tested the association between race, BMI, AMY1 CNV, parental education and parental income (referred as “variables of interest”), and oral and stool microbiomes. To improve statistical power, we first pooled both EA and AA participants in association tests adjusting for race. Next, we conducted association tests in both the EA group and the AA group to identify potential race-dependent associations.
Alpha Diversity Analysis
Three alpha diversity metrics – observed ASV number,53 Shannon index, and Inverse Simpson index – were calculated based on the rarefied ASV counts to control for sequencing depth difference (“estimate richness” function in Bioconductor package phyloSeq).55 Observed ASV number is a species richness measure, while the Shannon index and Inverse Simpson index measure overall diversity, taking into account both species richness and evenness, with the latter putting more emphasis on abundant species. A simple linear model was used to test the association between alpha diversity measures and variables of interest, adjusting for other covariates when necessary.
Beta Diversity Analysis
Unweighted and weighted UniFrac and Bray-Curtis (BC) distances were constructed using the ASV table and the phylogenetic tree (R package, GUniFrac).56 Rarefaction was performed on the ASV table before calculating distances. Based on these distance matrices, Permutational Multivariate Analysis of Variance (PERMANOVA) was used to test for an association between variables of interest and the overall microbiota composition, adjusting for other covariates when necessary (R package, vegan).57
Differential Abundance Analysis
Only taxa with a presence in more than 10% of the samples and with a relative abundance greater than 0.2% in at least 1 sample were tested. This reduced the total number of tests. The count data was normalized by the geometric mean of pairwise ratios size factor.58 To identify differentially abundant taxa, permutation tests (999 permutations) were performed for each taxon, using the F-statistic of a linear model (square-root transformed, normalized abundance as the outcome) as the test statistic.59 FDR control (B-H procedure) was used to correct for multiple testing at each taxonomic level, and FDR-adjusted P values or Q values <.10 were considered significant (“p.adjust” in R). For non-multiple hypothesis testing, P<.05 was considered statistically significant.
Supplementary Material
Funding Statement
This work was supported by the Alabama Agricultural Experiment Station and the Hatch Program of the National Institute of Food and Agriculture Hatch, U.S. Department of Agriculture, and Auburn University Intramural Grant program to T.G.
Acknowledgments:
We are grateful to all study participants and their families for their contribution to this study. We thank all other technical and administrative staff of the institution for their support
Author contributions:
V.T., T.G., B.B., and J.R.B. designed the concept. B.B., T.G., and V.T. designed the research experiments. B.B., V.S., and P.A. carried out the experimental work. B.B., J.C., L.Y., and V.T. analyzed the data. B.B. and V.T. wrote the manuscript with the input of coauthors. All authors read and approved the final version of the manuscript.
Additional files:
Supplementary Materials
Disclosure of Potential:
No other disclosures were reported.
Conflicts of Interest:
All the authors declare no conflicts of interest.
Supplementary material
Supplemental data for this article can be accessed on the publisher’s website.
References
- 1.Ng M, Fleming T, Robinson M, Thomson B, Graetz N, Margono C, Mullany EC, Biryukov S, Abbafati C, Abera SF, et al. Global, regional, and national prevalence of overweight and obesity in children and adults during 1980-2013: A systematic analysis for the global burden of disease study 2013. Lancet. 2014;384(9945):766–15. doi: 10.1016/S0140-6736(14)60460-8. [DOI] [PMC free article] [PubMed] [Google Scholar]
- 2.Ogden CL, Carroll MD, Kit BK, Flegal KM.. Prevalence of childhood and adult obesity in the united states, 2011-2012. Jama-Journal of the American Medical Association. 2014;311(8):806–814. doi: 10.1001/jama.2014.732. [DOI] [PMC free article] [PubMed] [Google Scholar]
- 3.Smith KB, Smith MS. Obesity statistics. Prim Care. 2016;43(1):121. doi: 10.1016/j.pop.2015.10.001. [DOI] [PubMed] [Google Scholar]
- 4.Huang Y, Lu Y, Huang YM, Wang M, Ling W, Sui Y, Zhao HL. Obesity in patients with covid-19: A systematic review and meta-analysis. Metabolism. 2020;113:154378. doi: 10.1016/j.metabol.2020.154378. [DOI] [PMC free article] [PubMed] [Google Scholar]
- 5.Wardle J, Carnell S, Haworth CM, Plomin R. Evidence for a strong genetic influence on childhood adiposity despite the force of the obesogenic environment. Am J Clin Nutr. 2008;87(2):398–404. doi: 10.1093/ajcn/87.2.398. [DOI] [PubMed] [Google Scholar]
- 6.Zhao L. The gut microbiota and obesity: from correlation to causality. Nat Rev Microbiol. 2013;11(9):639–647. doi: 10.1038/nrmicro3089. [DOI] [PubMed] [Google Scholar]
- 7.De Filippo C, Cavalieri D, Di Paola M, Ramazzotti M, Poullet JB, Massart S, Collini S, Pieraccini G, Lionetti P. Impact of diet in shaping gut microbiota revealed by a comparative study in children from europe and rural africa. Proc Natl Acad Sci U S A. 2010;107(33):14691–14696. doi: 10.1073/pnas.1005963107. [DOI] [PMC free article] [PubMed] [Google Scholar]
- 8.Santos JL, Saus E, Smalley SV, Cataldo LR, Alberti G, Parada J, Gratacos M, Estivill X. Copy number polymorphism of the salivary amylase gene: implications in human nutrition research. J Nutrigenet Nutrigenomics. 2012;5(3):117–131. doi: 10.1159/000339951. [DOI] [PubMed] [Google Scholar]
- 9.Oppenheim FG, Salih E, Siqueira WL, Zhang W, Helmerhorst EJ. Salivary proteome and its genetic polymorphisms. Ann N Y Acad Sci. 2007;1098(1):22–50. doi: 10.1196/annals.1384.030. [DOI] [PubMed] [Google Scholar]
- 10.Noble RE. Salivary alpha-amylase and lysozyme levels: A non-invasive technique for measuring parotid vs submandibular/sublingual gland activity. J Oral Sci. 2000;42(2):83–86. doi: 10.2334/josnusd.42.83. [DOI] [PubMed] [Google Scholar]
- 11.Falchi M, El-Sayed Moustafa JS, Takousis P, Pesce F, Bonnefond A, Andersson-Assarsson JC, Sudmant PH, Dorajoo R, Al-Shafai MN, Bottolo L, et al. Low copy number of the salivary amylase gene predisposes to obesity. Nat Genet. 2014;46(5):492–497. doi: 10.1038/ng.2939. [DOI] [PMC free article] [PubMed] [Google Scholar]
- 12.Venkatapoorna CMK, Ayine P, Parra EP, Koenigs T, Phillips M, Babu JR, Sandey M, Geetha T. Association of salivary amylase (amy1) gene copy number with obesity in alabama elementary school children. Nutrients. 2019;11(6):6. doi: 10.3390/nu11061379. [DOI] [PMC free article] [PubMed] [Google Scholar]
- 13.Poole AC, Goodrich JK, Youngblut ND, Luque GG, Ruaud A, Sutter JL, Waters JL, Shi Q, El-Hadidi M, Johnson LM, et al. Human salivary amylase gene copy number impacts oral and gut microbiomes. Cell Host Microbe. 2019;25(4):553–564 e557. doi: 10.1016/j.chom.2019.03.001. [DOI] [PubMed] [Google Scholar]
- 14.Brooks AW, Priya S, Blekhman R, Bordenstein SR. Gut microbiota diversity across ethnicities in the united states. PLoS Biol. 2018;16(12):e2006842. doi: 10.1371/journal.pbio.2006842. [DOI] [PMC free article] [PubMed] [Google Scholar]
- 15.Chen J, Wright K, Davis JM, Jeraldo P, Marietta EV, Murray J, Nelson H, Matteson EL, Taneja V. An expansion of rare lineage intestinal microbes characterizes rheumatoid arthritis. Genome Med. 2016;8(1):43. doi: 10.1186/s13073-016-0299-7. [DOI] [PMC free article] [PubMed] [Google Scholar]
- 16.Qin Y, Roberts JD, Grimm SA, Lih FB, Deterding LJ, Li R, Chrysovergis K, Wade PA. An obesity-associated gut microbiome reprograms the intestinal epigenome and leads to altered colonic gene expression. Genome Biol. 2018;19(1):7. doi: 10.1186/s13059-018-1389-1. [DOI] [PMC free article] [PubMed] [Google Scholar]
- 17.Yang YH, Zheng W, Cai QY, Shrubsole MJ, Pei ZH, Brucker R, Steinwandel M, Bordenstein SR, Li ZG, Blot WJ, et al. Racial differences in the oral microbiome: data from low-income populations of african ancestry and european ancestry. Msystems. 2019;4(6):6. doi: 10.1128/mSystems.00639-19. [DOI] [PMC free article] [PubMed] [Google Scholar]
- 18.Radjabzadeh D, Boer CG, Beth SA, van der Wal P, Kiefte-De Jong JC, Jansen MAE, Konstantinov SR, Peppelenbosch MP, Hays JP, Jaddoe VWV, et al. Diversity, compositional and functional differences between gut microbiota of children and adults. Sci Rep. 2020;10(1):1040. doi: 10.1038/s41598-020-57734-z. [DOI] [PMC free article] [PubMed] [Google Scholar]
- 19.Viljakainen H, Andersson-Assarsson JC, Armenio M, Pekkinen M, Pettersson M, Valta H, Lipsanen-Nyman M, Makitie O, Lindstrand A. Low copy number of the amy1 locus is associated with early-onset female obesity in finland. Plos One. 2015;10(7):7. doi: 10.1371/journal.pone.0131883. [DOI] [PMC free article] [PubMed] [Google Scholar]
- 20.Marcovecchio ML, Florio R, Verginelli F, De Lellis L, Capelli C, Verzilli D, Chiarelli F, Mohn A, Cama A. Low amy1 gene copy number is associated with increased body mass index in prepubertal boys. Plos One. 2016;11(5):5. doi: 10.1371/journal.pone.0154961. [DOI] [PMC free article] [PubMed] [Google Scholar]
- 21.Ogden CL, Carroll MD, Fakhouri TH, Hales CM, Fryar CD, Li XF, Freedman DS. Prevalence of obesity among youths by household income and education level of head of household - united states 2011-2014. Mmwr-Morbidity and Mortality Weekly Report. 2018;67(6):186–189. doi: 10.15585/mmwr.mm6706a3. [DOI] [PMC free article] [PubMed] [Google Scholar]
- 22.Garg S, Kim L, Whitaker M, O’Halloran A, Cummings C, Holstein R, Prill M, Chai SJ, Kirley PD, Alden NB, et al. Hospitalization rates and characteristics of patients hospitalized with laboratory-confirmed coronavirus disease 2019-covid-net, 14 states, march 1-30, 2020. Mmwr-Morbidity and Mortality Weekly Report. 2020;69(15):458–464. doi: 10.15585/mmwr.mm6915e3. [DOI] [PMC free article] [PubMed] [Google Scholar]
- 23.Turnbaugh PJ, Hamady M, Yatsunenko T, Cantarel BL, Duncan A, Ley RE, Sogin ML, Jones WJ, Roe BA, Affourtit JP, et al. A core gut microbiome in obese and lean twins. Nature. 2009;457(7228):480–484. doi: 10.1038/nature07540. [DOI] [PMC free article] [PubMed] [Google Scholar]
- 24.Ley RE, Backhed F, Turnbaugh P, Lozupone CA, Knight RD, Gordon JI. Obesity alters gut microbial ecology. Proc Natl Acad Sci U S A. 2005;102(31):11070–11075. doi: 10.1073/pnas.0504978102. [DOI] [PMC free article] [PubMed] [Google Scholar]
- 25.Hollister EB, Foster BA, Dahdouli M, Ramirez J, Lai Z. Characterization of the stool microbiome in hispanic preschool children by weight status and time. Childhood Obesity (Print). 2017;14(2):122–130. doi: 10.1089/chi.2017.0122. [DOI] [PMC free article] [PubMed] [Google Scholar]
- 26.Karlsson CL, Onnerfalt J, Xu J, Molin G, Ahrne S, Thorngren-Jerneck K. The microbiota of the gut in preschool children with normal and excessive body weight. Obesity (Silver Spring). 2012;20(11):2257–2261. doi: 10.1038/oby.2012.110. [DOI] [PubMed] [Google Scholar]
- 27.Tun HM, Bridgman SL, Chari R, Field CJ, Guttman DS, Becker AB, Mandhane PJ, Turvey SE, Subbarao P, Sears MR, et al. Roles of birth mode and infant gut microbiota in intergenerational transmission of overweight and obesity from mother to offspring. JAMA Pediatr. 2018;172(4):368–377. doi: 10.1001/jamapediatrics.2017.5535. [DOI] [PMC free article] [PubMed] [Google Scholar]
- 28.Sakhaee K. Unraveling the mechanisms of obesity-induced hyperoxaluria. Kidney Int. 2018;93(5):1038–1040. doi: 10.1016/j.kint.2018.01.012. [DOI] [PMC free article] [PubMed] [Google Scholar]
- 29.Cho GS, Ritzmann F, Eckstein M, Huch M, Briviba K, Behsnilian D, Neve H, Franz CM. Quantification of slackia and eggerthella spp. In Human Feces and Adhesion of Representatives Strains to Caco-2 Cells Front Microbiol. 2016;7:658. [DOI] [PMC free article] [PubMed] [Google Scholar]
- 30.Hildebrandt MA, Hoffmann C, Sherrill-Mix SA, Keilbaugh SA, Hamady M, Chen YY, Knight R, Ahima RS, Bushman F, Wu GD. High-fat diet determines the composition of the murine gut microbiome independently of obesity. Gastroenterology. 2009. e1711–1712;137(5):1716–1724. doi: 10.1053/j.gastro.2009.08.042. [DOI] [PMC free article] [PubMed] [Google Scholar]
- 31.Arumugam M, Raes J, Pelletier E, Le Paslier D, Yamada T, Mende DR, Fernandes GR, Tap J, Bruls T, Batto JM, et al. Enterotypes of the human gut microbiome. Nature. 2011;473(7346):174–180. doi: 10.1038/nature09944. [DOI] [PMC free article] [PubMed] [Google Scholar]
- 32.Kang DW, Park JG, Ilhan ZE, Wallstrom G, Labaer J, Adams JB, Krajmalnik-Brown R. Reduced incidence of prevotella and other fermenters in intestinal microflora of autistic children. PLoS One. 2013;8(7):e68322. doi: 10.1371/journal.pone.0068322. [DOI] [PMC free article] [PubMed] [Google Scholar]
- 33.Yazici C, Wolf PG, Kim H, Cross TL, Vermillion K, Carroll T, Augustus GJ, Mutlu E, Tussing-Humphreys L, Braunschweig C, et al. Race-dependent association of sulfidogenic bacteria with colorectal cancer. Gut. 2017;66(11):1983–1994. doi: 10.1136/gutjnl-2016-313321. [DOI] [PMC free article] [PubMed] [Google Scholar]
- 34.Kovatcheva-Datchary P, Nilsson A, Akrami R, Lee YS, De Vadder F, Arora T, Hallen A, Martens E, Bjorck I, Backhed F. Dietary fiber-induced improvement in glucose metabolism is associated with increased abundance of prevotella. Cell Metab. 2015;22(6):971–982. doi: 10.1016/j.cmet.2015.10.001. [DOI] [PubMed] [Google Scholar]
- 35.Stanislawski MA, Dabelea D, Lange LA, Wagner BD, Lozupone CA. Gut microbiota phenotypes of obesity. Npj Biofilms and Microbiomes. 2019;5(1):5. doi: 10.1038/s41522-019-0091-8. [DOI] [PMC free article] [PubMed] [Google Scholar]
- 36.Maciel SS, Feres M, Goncalves TED, Zimmermann GS, HDP DS, Figueiredo LC, Duarte PM. Does obesity influence the subgingival microbiota composition in periodontal health and disease? J Clin Periodontol. 2016;43(12):1003–1012. doi: 10.1111/jcpe.12634. [DOI] [PubMed] [Google Scholar]
- 37.Aoyama N, Suzuki J, Thanakun S, Izumi Y, Minabe M, Isobe M. Elevated concentrations of specific periodontopathic pathogens associated with severe periodontitis in japanese patients with cardiovascular disease and concomitant obesity. Journal of Oral Biosciences. 2018;60(2):54–58. doi: 10.1016/j.job.2018.02.005. [DOI] [Google Scholar]
- 38.Yang Y, Cai Q, Zheng W, Steinwandel M, Blot WJ, Shu XO, Long J. Oral microbiome and obesity in a large study of low-income and african-american populations. J Oral Microbiol. 2019;11(1):1650597. doi: 10.1080/20002297.2019.1650597. [DOI] [PMC free article] [PubMed] [Google Scholar]
- 39.Gupta VK, Paul S, Dutta C. Geography, ethnicity or subsistence-specific variations in human microbiome composition and diversity. Front Microbiol. 2017;8:1162. doi: 10.3389/fmicb.2017.01162. [DOI] [PMC free article] [PubMed] [Google Scholar]
- 40.Yang CY, Yeh YM, Yu HY, Chin CY, Hsu CW, Liu H, Huang PJ, Hu SN, Liao CT, Chang KP, et al. Oral microbiota community dynamics associated with oral squamous cell carcinoma staging. Front Microbiol. 2018;9:862. doi: 10.3389/fmicb.2018.00862. [DOI] [PMC free article] [PubMed] [Google Scholar]
- 41.Wang J, Qi J, Zhao H, He S, Zhang Y, Wei S, Zhao F. Metagenomic sequencing reveals microbiota and its functional potential associated with periodontal disease. Sci Rep. 2013;3(1):1843. doi: 10.1038/srep01843. [DOI] [PMC free article] [PubMed] [Google Scholar]
- 42.Wen W, Cho YS, Zheng W, Dorajoo R, Kato N, Qi L, Chen CH, Delahanty RJ, Okada Y, Tabara Y, et al. Meta-analysis identifies common variants associated with body mass index in east asians. Nat Genet. 2012;44(3):307–311. doi: 10.1038/ng.1087. [DOI] [PMC free article] [PubMed] [Google Scholar]
- 43.Janem WF, Scannapieco FA, Sabharwal A, Tsompana M, Berman HA, Haase EM, Miecznikowski JC, Mastrandrea LD. Salivary inflammatory markers and microbiome in normoglycemic lean and obese children compared to obese children with type 2 diabetes. PloS One. 2017;12(3):e0172647. doi: 10.1371/journal.pone.0172647. [DOI] [PMC free article] [PubMed] [Google Scholar]
- 44.Leon-Mimila P, Villamil-Ramirez H, Lopez-Contreras BE, Moran-Ramos S, Macias-Kauffer LR, Acuna-Alonzo V, Del Rio-Navarro BE, Salmeron J, Velazquez-Cruz R, Villarreal-Molina T, et al. Low salivary amylase gene (amy1) copy number is associated with obesity and gut prevotella abundance in mexican children and adults. Nutrients. 2018;10(11):11. doi: 10.3390/nu10111607. [DOI] [PMC free article] [PubMed] [Google Scholar]
- 45.Jackson CL, Szklo M, Yeh HC, Wang NY, Dray-Spira R, Thorpe R, Brancati FL. Black-white disparities in overweight and obesity trends by educational attainment in the united states, 1997-2008. J Obes. 2013;2013:140743. doi: 10.1155/2013/140743. [DOI] [PMC free article] [PubMed] [Google Scholar]
- 46.Hruschka DJ, Han SY. Anti-fat discrimination in marriage more clearly explains the poverty-obesity paradox. Behav Brain Sci. 2017;40:e120E120. doi: 10.1017/S0140525X1600145X. [DOI] [PubMed]
- 47.Wu F, Guo X, Zhang J, Zhang M, Ou Z, Peng Y. Phascolarctobacterium faecium abundant colonization in human gastrointestinal tract. Exp Ther Med. 2017;14(4):3122–3126. doi: 10.3892/etm.2017.4878. [DOI] [PMC free article] [PubMed] [Google Scholar]
- 48.Lecomte V, Kaakoush NO, Maloney CA, Raipuria M, Huinao KD, Mitchell HM, Morris MJ. Changes in gut microbiota in rats fed a high fat diet correlate with obesity-associated metabolic parameters. PLoS One. 2015;10(5):e0126931. doi: 10.1371/journal.pone.0126931. [DOI] [PMC free article] [PubMed] [Google Scholar]
- 49.King CH, Desai H, Sylvetsky AC, LoTempio J, Ayanyan S, Carrie J, Crandall KA, Fochtman BC, Gasparyan L, Gulzar N, et al. Baseline human gut microbiota profile in healthy people and standard reporting template. PLoS One. 2019;14(9):e0206484. doi: 10.1371/journal.pone.0206484. [DOI] [PMC free article] [PubMed] [Google Scholar]
- 50.de Onis M, Onyango AW, Borghi E, Siyam A, Nishida C, Siekmann J. Development of a who growth reference for school-aged children and adolescents. Bull World Health Organ. 2007;85(9):660–667. doi: 10.2471/BLT.07.043497. [DOI] [PMC free article] [PubMed] [Google Scholar]
- 51.Callahan BJ, McMurdie PJ, Rosen MJ, Han AW, Johnson AJ, Holmes SP. Dada2: high-resolution sample inference from illumina amplicon data. Nat Methods. 2016;13(7):581–583. doi: 10.1038/nmeth.3869. [DOI] [PMC free article] [PubMed] [Google Scholar]
- 52.Quast C, Pruesse E, Yilmaz P, Gerken J, Schweer T, Yarza P, Peplies J, Glockner FO. The silva ribosomal rna gene database project: improved data processing and web-based tools. Nucleic Acids Res. 2012;41(D1):D590–596. doi: 10.1093/nar/gks1219. [DOI] [PMC free article] [PubMed] [Google Scholar]
- 53.Price MN, Dehal PS, Arkin AP, Poon AFY. FastTree 2 – approximately Maximum-Likelihood Trees for Large Alignments. Plos One. 2010;5(3):3. doi: 10.1371/journal.pone.0009490. [DOI] [PMC free article] [PubMed] [Google Scholar]
- 54.Butte NF, Garza C, de Onis M. Evaluation of the feasibility of international growth standards for school-aged children and adolescents. Journal of Nutrition. 2007;137(1):153–157. doi: 10.1093/jn/137.1.153. [DOI] [PubMed] [Google Scholar]
- 55.McMurdie PJ, Holmes HS, Watson M. phyloseq: an R Package for Reproducible Interactive Analysis and Graphics of Microbiome Census Data. PLoS One. 2013;8(4):e61217. doi: 10.1371/journal.pone.0061217. [DOI] [PMC free article] [PubMed] [Google Scholar]
- 56.Chen J, Bittinger K, Charlson ES, Hoffmann C, Lewis J, Wu GD, Collman RG, Bushman FD, Li HZ. Associating microbiome composition with environmental covariates using generalized unifrac distances. Bioinformatics. 2012;28(16):2106–2113. doi: 10.1093/bioinformatics/bts342. [DOI] [PMC free article] [PubMed] [Google Scholar]
- 57.McArdle BH, Anderson MJ. Fitting multivariate models to community data: A comment on distance-based redundancy analysis. Ecology. 2001;82(1):290–297. doi: 10.1890/0012-9658(2001)082[0290:FMMTCD]2.0.CO;2. [DOI] [Google Scholar]
- 58.Chen L, Reeve J, Zhang L, Huang S, Wang X, Gmpr CJ. A robust normalization method for zero-inflated count data with application to microbiome sequencing data. PeerJ. 2018;6:e4600. doi: 10.7717/peerj.4600. [DOI] [PMC free article] [PubMed] [Google Scholar]
- 59.Hale VL, Chen J, Johnson S, Harrington SC, Yab TC, Smyrk TC, Nelson H, Boardman LA, Druliner BR, Levin TR, et al. Shifts in the fecal microbiota associated with adenomatous polyps. Cancer Epidemiol Biomarkers Prev. 2017;26(1):85–94. doi: 10.1158/1055-9965.EPI-16-0337. [DOI] [PMC free article] [PubMed] [Google Scholar]
Associated Data
This section collects any data citations, data availability statements, or supplementary materials included in this article.