

Abstract
The predictive effect of circulating tumor DNA (ctDNA) in colorectal cancer (CRC) treatment is still highly discussed. The primary objective of our study was to investigate a possible prognostic/predictive value of ctDNA under regorafenib treatment. This prospective multicenter translational biomarker phase II pilot study enrolled 30 metastatic CRC patients (67% men, 33% women) treated with regorafenib. ctDNA was assessed in plasma before treatment start and at defined time points during administration. Measurement of tumor fraction as well as mutation and copy number analysis of CRC driver genes were performed by next‐generation sequencing approaches. Multivariate analyses for survival and treatment efficacy were adjusted to age, gender and Eastern Cooperative Oncology Group. Disease control rate was 30%. Median tumor fraction at baseline was 18.5% (0‐49.9). Mutations in CRC driver genes or genes involved in angiogenesis were identified in 25 patients (83.3%). KRAS mutations were detected in 13 of 14 KRAS‐positive tumors; in three patients without KRAS mutation in the respective tumors, acquired mutations as a consequence of prior anti‐EGFR treatment were detected. In a subset of patients, novel occurring mutations or focal amplifications were detected. A tumor fraction of 5% and higher at baseline was significantly associated with a decreased OS (P = .022; hazard ratio 3.110 (95% confidence interval: 1.2‐8.2). ctDNA is detectable in a high proportion of mCRC patients. Higher ctDNA levels are associated with survival among regorafenib treatment. Moreover, our data highlight the benefit of a combined evaluation of mutations and somatic copy number alterations in advanced cancer patients.
Keywords: circulating tumor DNA, metastatic colorectal cancer, prospective pilot study, regorafenib, sequencing
What's new?
The predictive effect of circulating tumor DNA (ctDNA) in colorectal cancer (CRC) treatment remains under discussion. This prospective multicenter translational biomarker phase II pilot study investigated the possible predictive/prognostic value of ctDNA in metastatic CRC patients treated with regorafenib, a multi‐kinase inhibitor. Overall, alterations in CRC driver genes could be identified in 87% of patients. The data indicated that a tumor fraction of >5% was significantly associated with decreased survival. Moreover, the combined evaluation of mutations and somatic copy number alterations enabled the detection of novel changes occurring during treatment.
Abbreviations
- aVAF
average variant allele frequencies
- cfDNA
cell‐free DNA
- CRC
colorectal cancer
- ctDNA
circulating tumor DNA
- DCR
disease control rate
- ECOG
Eastern Cooperative Oncology Group
- gw z‐score
genome‐wide z‐score
- hVAF
highest variant allele frequencies
- IGV
Integrated Genome Viewer
- iTF
ichorCNA tumor fraction
- mCRC
metastatic colorectal cancer
- mFAST‐SeqS
modified fast aneuploidy screening test‐sequencing system
- NGS
next‐generation sequencing
- ORR
overall response rate
- OS
overall survival
- PFS
progression‐free survival
- SCNA
somatic copy number alterations
- sWGS
shallow whole‐genome sequencing
- vWF
von Willebrand factor
- WT
wild type
1. INTRODUCTION
Despite significant improvement of diagnosis and treatment, colorectal cancer (CRC) is still a leading cause of death worldwide. 1 Currently, a variety of molecular biomarker such as microsatellite instability, RAS status or HER2 amplification are used for the selection of targeted therapies of metastatic CRC (mCRC). 2 Recently, regorafenib has been approved for the third‐line treatment in patients with refractory mCRC based on the results of the CORRECT trial. 3 Unlike other available targeted treatments, regorafenib is a multikinase inhibitor, which in addition to VEGF signaling inhibits several other pathways. 4 Regorafenib compared to best‐supportive care alone led to a significant increase in median overall survival (OS) and a significant prolongation of median progression‐free survival (PFS). Findings were further validated by the positive results of the CONCUR study in an Asian population. 5 However, despite a 16‐week disease control rate in 19% of cases, more than half of the patients experienced adverse events such as hand‐foot skin reaction, fever and fatigue, which severely impair quality of life.
Therefore, predictive biomarker for the overall clinical benefit from regorafenib is urgently needed. In addition to in vitro studies 6 and molecular profiling from tumor tissue, 7 several studies have explored the use of circulating biomarkers. 7 , 8 , 9 In particular, cell‐free circulating tumor DNA (ctDNA) in plasma has been demonstrated as a promising predictive and prognostic biomarker. Although ctDNA generally reflects a small fraction of the total cell‐free plasma DNA (cfDNA), all kinds of tumor‐specific alterations can be reconstructed from plasma. 10 , 11 , 12 Noninvasive, molecular profiling from plasma to track clonal evolution under anti‐EGFR therapy was first evaluated by Siravegna and colleagues, 13 followed by multiple studies analyzing distinct genetic alterations in ctDNA by digital droplet polymerase chain reaction, BEAMing, and next‐generation sequencing (NGS) methodologies. 14 , 15 , 16 Although numerous studies investigated the utility of ctDNA for anti‐EGFR agents, its use for the evaluation or prediction of response to regorafenib is less explored. One large study including more than 500 patients demonstrated a clinical benefit in a range of patient subgroups based on mutational status and protein biomarker concentrations assessed in blood. 17
Therefore, we aimed to investigate a possible pertinence of ctDNA as a prognostic and/or early predictive marker in the treatment of mCRC patients receiving regorafenib. In this prospective exploratory study, we integrated different sequencing protocols to comprehensively analyze ctDNA including mFAST‐SeqS, shallow whole‐genome sequencing (sWGS) and a gene panel to assess mutations in CRC driver genes and genes involved in angiogenesis.
2. PATIENTS AND METHODS
2.1. Study design
This prospective translational exploratory study was planned multicentric at the Medical University of Vienna (Division of Oncology), the Medical University of Graz (Division of Oncology), the Klinikum Wels‐Grieskirchen (all Austria) and the University Hospital Zurich (Medical Oncology and Hematology Clinic) (Switzerland). However, due to low patient accrual at most centers, the majority of patients (n = 25) were recruited at Medical University of Vienna. Patients with histologically proven mCRC receiving regorafenib in standard dose (160 mg od po, 3 weeks on/1 week off) were enrolled between October 2017 and July 2018. Exclusion criteria were as follows: active or clinically significant cardiac disease, thrombotic, embolic, venous or arterial events, such as cerebrovascular accident (including transient ischemic attacks) deep vein thrombosis or pulmonary embolism within 6 months of informed consent, previous malignancy other than CRC in the last 3 years. CT scans of the chest and abdomen were performed at baseline and then every 8 weeks during treatment (or earlier for patients with suspected disease progression). CT scans were centrally reviewed to evaluate treatment response according to RECIST criteria, version 1.1.
2.2. Identification of somatic mutations in tumor tissue
Tissue biopsy was performed within 4 weeks before the start of regorafenib and (optional) 8 weeks after treatment initiation. RAS status was routinely assessed at the respective pathologies and retrieved from the pathology report.
2.3. cfDNA extraction
Blood samples were prospectively collected into two cfDNA BCT tubes (Streck) from patients within 2 weeks before regorafenib application and every 4 weeks during treatment for centralized ctDNA analysis. Plasma extraction from blood was performed as described previously. 18 cfDNA was isolated from 2 mL of plasma using the DSP Circulating DNA kit on a QIASymphony (QIAGEN) according to the manufacturer's protocol. For quantification of cfDNA, we used the Qubit dsDNA HS Assay Kit (Life Technologies).
2.4. mFAST‐SeqS estimation of tumor fraction
In order to stratify samples based on their overall tumor fraction in cfDNA, Modified Fast Aneuploidy Screening Test‐Sequencing System (mFAST‐SeqS) was applied as previously described. 19 Briefly, Line‐1 (L1) amplicon libraries were generated using 1 ng of cfDNA. Amplicon libraries were sequenced on the Illumina MiSeq or NextSeq platform to generate a minimum of 100 000 single‐end reads for each amplicon library. A z‐score statistic was applied to calculate the deviation of read counts for each chromosome arm compared to healthy controls. In addition, a genome‐wide z‐score (gw z‐score), that is, the squared sum of all chromosome arm‐specific z‐scores was calculated. Gw z‐scores of 3 and 5 were used as threshold values.
2.5. Mutation analysis using a custom SureSelect panel
All baseline samples (n = 30) and the available end of treatment samples (EOT) (n = 14) were processed for high‐resolution mutation analysis. To this end, we designed a SureSelectXT‐HS custom panel (Agilent) covering 68 genes with a total size of 260 kb using the Agilent SureDesign platform (Table S1). In addition to the most frequently mutated genes in CRC such as APC, BRAF, KRAS, NRAS or TP53, we included genes associated with angiogenesis. Molecular barcoded libraries were prepared from 15 to 25 ng of cfDNA according to the modified protocol from Mansukhani et al. 20 Hybrid capture was performed from 500 to 1000 ng of the library according to the same protocol. Enriched libraries were quality checked using a High‐Sensitivity Kit on an Agilent Bioanalyzer and quantified with qPCR. After sequencing on the Illumina NextSeq platform in a 2 × 150 bp paired‐end mode, an average of 153.5 million reads (range 65.5‐210.9) was obtained resulting in an average unique sequencing depth of 2430x. Mapping, alignment and variant calling were performed using the SureCall SNPPET SNP Caller (version 4.0.1.46) with the following parameters: variant score threshold 0.01, minimum quality for base Q30, variant call quality threshold Q40, minimum allele frequency 0.001, minimum number of reads per barcode 2, no region padding and masked overlap between reads. Variant annotation and further filtering for somatic variants were performed using the Golden Helix software. Finally, variant calls were visually inspected using the Integrated Genome Viewer (IGV). Only variants with at least one duplex pair of consensus families, in which the variant was not the last base in the read end and including at least two reads with different alignment positions, were considered as true variants. Additionally, variants that were identified in cfDNA from healthy controls (n = 3) were removed. The measurement was performed using the Seraseq ctDNA reference material v2 (SeraCare), which is a full‐process plasma‐like material supporting the assessment of the entire workflow from extraction through the analysis. It includes 40 clinically relevant mutations across 28 genes, of which 23 were covered by our panel, at variant allele frequencies (VAFs), that is, 2%, 1%, 0.5%. 0.25%, 0.125%, and a wild‐type (WT) sample, the assay performance was evaluated. We determined a limit of detection of VAF of 0.5%.
2.6. Deep sequencing
Deep sequencing was performed as previously described by our group. 21 Briefly, target‐specific primers covering mutations identified with the SureSelect panel were designed and tested with a reference DNA (Promega). Due to the limited availability of plasma, DNA mutation assays were multiplexed per patient. Amplicon libraries were prepared from 1 to 3 ng plasma DNA and sequenced in 150 bp paired‐end run on an Illumina NextSeq or MiSeq sequencer. Sequencing data were analyzed using an in‐house pipeline 21 and mutations were visualized using IGV (version 2.3.58).
2.7. sWGS for genome‐wide copy number profiling
Unenriched libraries were subjected to sWGS, aiming at 4‐5 million reads (75 bp, paired‐end, NextSeq platform). Sequencing data were analyzed using previously described. 18 Focal events were called according to Ulz et al. 22 ichorCNA tumor fractions (iTFs) from sWGS data were calculated using a probabilistic hidden Markov model (HMM) called ichorCNA. 23
2.8. Statistical analysis
Descriptive statistics were used to assess the clinical and genetical variables associated with baseline ctDNA levels. A Cox regression model was used to estimate hazard ratios (HRs) with 95% confidence intervals (CIs). Multivariate analyses were adjusted for age, gender and baseline expression of the corresponding variable. For disease control rate (DCR) an exact 95% CI based on the approach of Clopper and Pearson was calculated. Kaplan‐Meier estimates for OS and PFS including 95% CIs for the medians were performed. Statistical analyses were performed using the open‐source statistical software package R, version 3.5.1 (The R Foundation for Statistical Computing, Vienna, Austria) including the packages “Survival” and “survMisc.” Plots were generated in R, version 3.5.1 and GraphPad Prism 8.4.2.
3. RESULTS
3.1. Patients' characteristics
A total of 30 patients were enrolled (Vienna, n = 25; Graz n = 1; Wels, n = 1; Zurich, n = 3) (Figure 1A). Overall, the cohort included more men (n = 20, 76%) than women (n = 10, 33%) with an average age of 60 years (range, 33‐78). Nine patients (30%) had their tumor in the right flexure while 21 patients (70%) were left sided (beyond the left colon flexure). Sixteen patients (53%) had an Eastern Cooperative Oncology Group (ECOG) of 0 while 14 patients (47%) had an ECOG of 1. Only two patients showed partial remission and seven patients (23%) experienced a stable disease leading to an overall response rate (ORR) of 7% (2 patients) and a DCR of 30% (9 patients) according to RECIST. A total of 21 patients (70%) presented progressive disease and did not respond to regorafenib treatment. The median OS since first diagnosis was 41 months (95% CI: 32‐50) while median OS since the start of target treatment was 4.8 months (95% CI: 2.4‐7.3). Median PFS was 2.1 months (95% CI: 1‐3) (Table S2).
FIGURE 1.
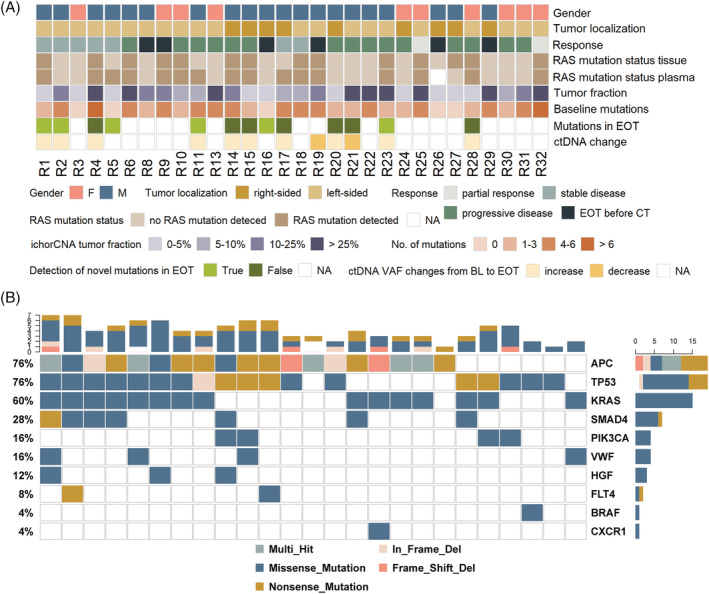
Patient characteristics and mutation profile of the cohort. A, A total of 30 metastatic CRC treated with regorafenib were included in the study. Shown, in descending order, are sex, tumor localization and response to regorafenib based on the RECIST criteria (end of treatment [EOT] before computed tomography [CT], treatment was stopped due to side effects or progression before CT scan was scheduled), the RAS mutation status in tissue and plasma, the ichorCNA‐derived tumor traction (iTF) in %, the number of mutations identified with the SureSelect panel in the baseline samples, the presence of novel occurring mutation in the EOT samples and the ctDNA from baseline to EOT. B, Oncoprint of the most frequently mutated genes (top 10) in our cohort. Shown is an overview of genomic alterations (legend) in particular genes (rows) affecting individual samples (columns) [Color figure can be viewed at wileyonlinelibrary.com]
3.2. Molecular profiling results from plasma DNA
First, we assessed the KRAS status in plasma DNA and observed four cases (13%) with discordant tissue‐plasma results. A total of 14/30 (46%) patients had KRAS‐mutated tumors (Figure 1A). The respective KRAS mutation could be detected in plasma DNA of 13/14 patients (93%). Most likely due to a low tumor fraction (TF) in patient R27, who did not show a mutation at all, the respective mutation was missed in plasma. However, ctDNA analysis identified three cases (R5, R11, R17) with KRAS mutations that were not detected in tissue. The KRAS mutations were consistently detected in available follow‐up samples, suggesting a reliable detection in plasma. Since all three patients had a prior history of cetuximab the KRAS mutations were most likely acquired as a consequence of prior EGFR‐directed therapy.
Not surprisingly, in addition to KRAS the most frequently mutated genes included APC, TP53, SMAD and PIK3CA, whereas mutations in the angiogenesis‐associated genes were less prevalent (Figure 1B). However, missense mutations in the HGF and VWF genes, which in contrast to our data are not among the most frequently mutated genes in CRC according to the COSMIC database, were identified in three (10%) and four (13%) patients, respectively.
At baseline, in 25 of 30 patients (83%) at least one mutation could be identified, with an average of 3.5 mutations (range 0‐7) per patient. In five patients (R3, R5, R16, R26, R27) no mutation could be detected prior to treatment initiation. This was consistent with a low tumor fraction (iTF) calculated with ichorCNA form sWGS data in these samples. However, in two of these patients (R5, R16), mutations could be identified at the EOT indicating an increase of ctDNA during treatment. Moreover, in 6 of 13 patients, of which EOT samples were available and baseline sequencing yielded informative results (46%), novel mutations were detected that were not present at baseline, among them a mutation in the VWF gene. In patient R2, who in principle had high levels of ctDNA at both time points (iTF 25% and 35% at baseline and at EOT, respectively) a variety of subclonal mutations were identified with VAFs ranging from 0.6% to 1.7% each of which were either detected at baseline (n = 4) or EOT (n = 3). For a detailed summary of mutations identified at baseline and EOT see (Table S3, Figure S1).
In addition to mutation profiling, we established genome‐wide copy number alterations (SCNA) from sWGS and specifically called for focal events. Focal SCNA including well‐characterized driver genes in CRC such as amplifications of ERBB2, KRAS and RET or deletions of CDH1, PTEN and SMAD4 could be identified in 12/30 patients (40%). In one patient, a focal amplification at chromosome 13, which was recently reported to affect response to angiogenesis inhibitors 24 could be identified (Table S4). In three patients the emergence of novel focal alterations (R4: deletion of 16q22.1 harboring CDH1, R14: Xq28 harboring IRAK1, R17: 17q21 harboring CDC27 in R17) could be observed. Detailed copy number profiles are shown in Figure S2.
3.3. ctDNA levels assessed with orthogonal approaches
To determine the baseline tumor fraction, we applied several orthogonal measures including the gw z‐score established with mFAST‐SeqS, the iTF and the average variant allele frequency (aVAF) as well as the highest variant allele frequency (hVAF) of mutations identified with the SureSelect panel (Figure 2A). At baseline, the gw z‐score ranged from 0.1 to 122.3 with a median of 11.3. A gw z‐score of 3 and higher, which was previously established as the limit of the quantitative range, was observed in 21 (70%) patients indicating that most of the patients had elevated tumor levels. iTF and aVAF ranged from 0% to 48.8% and 0.7%‐49.8% with medians of 9.6% and 12.9%, respectively. Interestingly, the iTF showed a better correlation to the hVAF (r = 0.923) compared to the aVAF (r = 0.902) (Figure 2B, Figure S3). Gw z‐scores showed a slightly weaker, but still a good correlation to iTF (r = 0.825), aVAF (r = 0.825) and, hVAF (r = 0.802) (Figure S3).
FIGURE 2.
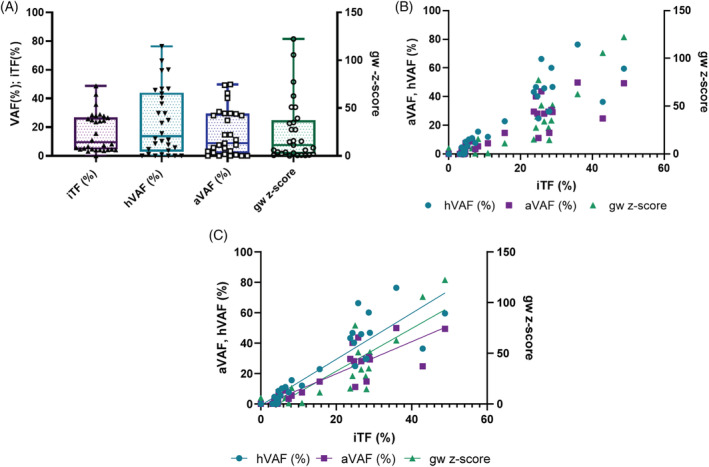
ctDNA levels at baseline. A, Distribution of various proxies for ctDNA levels prior to treatment initiation. iTF, tumor fraction calculated from ichorCNA; hVAF, highest variant allele frequency (VAF) identified with the SureSelect panel; aVAF, average VAF identified with the SureSelect panel; gw z‐score, genome‐wide z‐score calculated from mFAST‐SeqS. B, Linear regression of ctDNA levels calculated from ichorCAN compared to aVAF, hVAF and gw z‐scores [Color figure can be viewed at wileyonlinelibrary.com]
3.4. Tumor fraction at baseline predicts OS
To test whether the level of tumor‐derived DNA in plasma at baseline is predictive for OS and PFS, patients were stratified based on gw z‐score (cut‐offs of 3 and 5) as well as the iTF and aVAF both with cut‐offs of 5% and 10%, respectively. Although neither the gw z‐score nor the aVAF were predictive for OS, the iTF showed a significant association with OS (Figure 3). An iTF of >5% significantly increased the hazard to die to 2.9 when calculated since the first date of diagnosis (P = .027, 95% CI: 1.1‐7.5) or the initiation of regorafenib treatment (P = .028, 95% CI: 1.1‐7.3), respectively (Figure 3A). After adjusting for age and gender, this effect was even more apparent (P = .020, HR = 3.28, 95% CI: 1.2‐8.9 for OS from diagnosis and P = .022, HR 3.110, 95% CI: 1.2‐8.2 for OS from therapy start). Interestingly, a stratification by 10% iTF did not reach statistical significance (P = .060), but after adjustment for the covariates' age and sex, a significant effect was observed (P = .041, HR = 2.4, 95% CI: 1.1‐5.7) (Figure 3B). In contrast, baseline levels were not predictive for PFS. ctDNA levels were not associated with the number or location of metastases, although some patients with lung, lymph nodes or more than two metastatic sites tended to have higher ctDNA levels (Figure S4).
FIGURE 3.
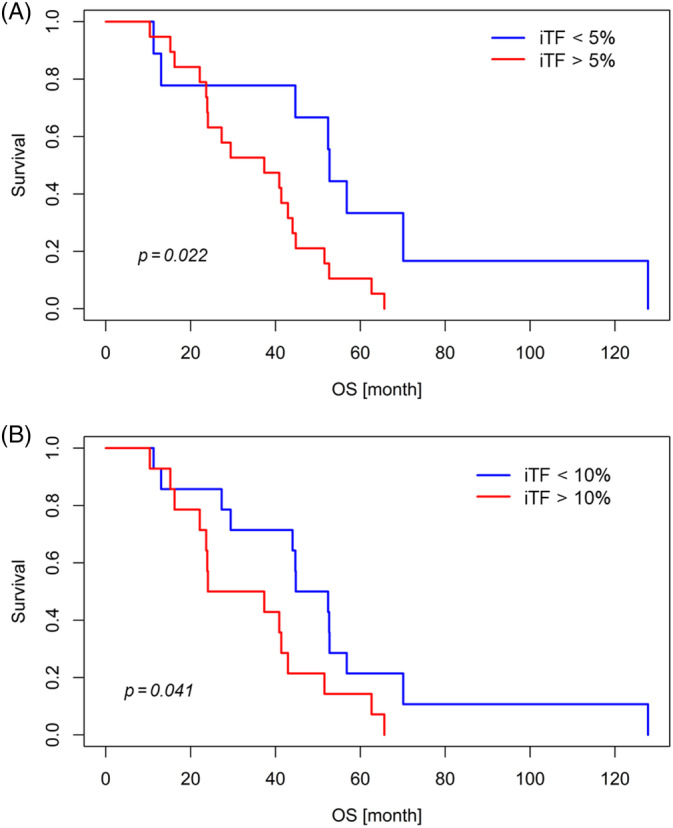
Kaplan–Meier survival analysis according to ichorCNA‐based tumor fraction (iTF) in metastatic CRC patients treated with regorafenib. Kaplan–Meier curves show that patients with iTF of (A) 5% and (B) 10% have significantly worse overall survival [Color figure can be viewed at wileyonlinelibrary.com]
3.5. Changes of tumor DNA levels and impact on survival
Next, we wanted to investigate whether changes of ctDNA levels are predictors of OS and PFS or treatment response. To this end, mutations identified at baseline were tracked in samples taken before the second treatment cycle as well as at EOT. However, due to the small sample size, that is, blood samples at EOT were available for only 14 patients, and a follow‐up sample at treatment cycle 2 was available for only 12 patients, and the fact that only two patients had an actual treatment benefit a statistical evaluation was not possible. Nonetheless, out of 15 informative samples, we observed similar or increased (at least 20% increase) iTFs in 12 nonresponders (80%) at EOT (Figure 4A). Only one patient each with PD and SD showed a slight decrease of iTF. Similar observations were made with the gw z‐score (Figure 4B). Likewise using SureSelect derived aVAF, 11 of 12 informative samples (92%) had similar or elevated ctDNA levels compared to baseline, and none of these patients responded to the treatment (Figure 4C). Compared to baseline, ctDNA levels were significantly increased at EOT for all three ctDNA proxies (P = .049 for iTF, P = .043 for aVAF, P = .021 for gw z‐score) (Figure 4A‐C). ctDNA level dynamics from baseline to the beginning of the cycle 2 was less clear as some patients showed a decrease, an increase or no change, respectively (Figure S5).
FIGURE 4.
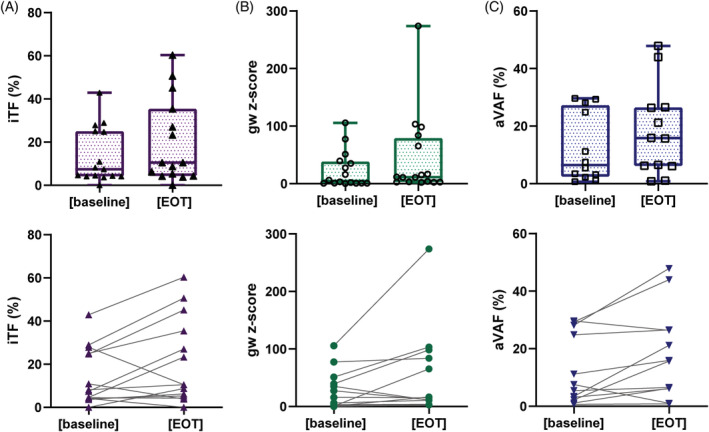
ctDNA levels at baseline and end of treatment (EOT). Upper panel: Distribution of various proxies for ctDNA levels prior to treatment initiation (baseline) and at EOT including (A) iTF, tumor fraction calculated from ichorCNA; (B) gw z‐score, genome‐wide z‐score calculated from mFAST‐SeqS; (C) aVAF, average variant allele frequency (VAF) identified with the SureSelect panel. Lower panel: Changing levels of ctDNA reflected as (A) iTF, (B) gw z‐score and (C) aVAF [Color figure can be viewed at wileyonlinelibrary.com]
4. DISCUSSION
In this prospective pilot study, we aimed to determine the predictive role of ctDNA in mCRC patients under regorafenib therapy. To this end, we evaluated the levels of ctDNA at baseline, the start of the second treatment cycle and at EOT. In contrast to other available studies, we integrated the detection of multiple classes of genomic alterations since the use of orthogonal approaches for the analysis of ctDNA can increase the number of molecular markers for monitoring. At baseline, we employed three orthogonal approaches to assess the tumor fraction, including two untargeted approaches (ichorCNA and mFAST‐SeqS), as well as a molecular barcoded gene panel (SureSelect) to assess tumor‐specific mutations in the most frequently mutated genes in CRC and in genes involved in angiogenesis. By our SureSelect gene panel, we detected mutations in common CRC driver genes such as APC, TP53 or KRAS in 83% of patients and assessed the ctDNA levels by the aVAF of all detected mutations. A comparison of the RAS status retrieved from routine pathology report revealed an overall concordance of 87% of plasma DNA and tumor tissue and a 93% concordance for RAS mutated tumors. Only one KRAS mutation was missed in plasma due to a very low tumor content in this patient. On the other hand, three plasma samples revealed acquired KRAS mutations as a consequence of prior anti‐EGFR treatment that were not present in the primary tissue. In contrast to mutation testing, ichorCNA and mFAST‐SeqS provide untargeted proxies for ctDNA load and additionally inform about the genome‐wide copy number status. 19 , 23 Although the detection of CNA in ctDNA is usually limited by the mutant allele fraction and the presence of CNAs in the tumor, mCRC is well suited for such analyses due to the high abundance of CNA in the tumor tissue and the relatively high tumor levels in advanced CRC patients. Compared to a barcoded gene panel, these methods are fast and inexpensive and enable a quick assessment of the tumor load. 19 , 23
Overall, ctDNA could be detected in 26 of 30 (87%) of patients. The average tumor fractions assessed with ichorCNA and the gene panel were 16.2% (median 9.6, range 0‐48.8) and 18.4% (median 12.9, range 0‐49.9), indicating that the majority of patient had high tumor levels. This was also consistent with the gw z‐scores established from mFAST‐SeqS and reflected previous reports, which reported mCRC as a high ctDNA tumor entity. 25 Recent studies demonstrated that the presence of liver metastases is correlated with high tumor levels, 26 , 27 an observation that is confirmed by our data, since most of our patients had liver metastases. However, additional metastases, for example, in lung or lymph nodes, did not significantly add to the tumor fraction although a trend toward higher ctDNA levels was observed.
Interestingly, despite a high concordance of iTF with aVAF and the gw z‐score, respectively, only the iTF was associated with of OS and unlike previous reports of our group for prostate, breast and lung cancer the gw z‐score was not informative for OS. 28 , 29 , 30 One possible explanation is that the gw z‐score is a only surrogate for TF and is affected by the number and amplitude of CNA, 30 while the iTF is a more accurate measure of the actual TF as it considers log2‐ratios of normalized read count over the entire genome. Similar data were obtained in large randomized study by Tabernero and colleagues, in which not only high KRAS levels assessed with BEAMing but also absolute cfDNA concentration were associated with a decreased OS. 17 In contrast to Tabernero et al, who used a tumor‐informed approach to assess the tumor burden in plasma, our data are based on comprehensive molecular profiling. Although screening for a small number of known mutations with high resolution assays can achieve a high analytical sensitivity, the use of gene panels enables a de novo mutation calling across many genes and can identify novel mutation that were not present or detected in the primary tissue, thereby representing the actual status of the tumor. In addition, the abundance of mutations may change due to the selective pressure of targeted treatments and therefore represent only subclones and not the actual tumor burden in plasma, whereas an untargeted genome‐wide assessment of tumor fraction is less prone to subclonal changes. Moreover, the inclusion of copy number analyses by sWGS provided high‐resolution information regarding CNAs, which are in addition to mutations a driving force in many cancers. 31 Recently, we identified a focal amplification on chr13, which might be associated with primary and secondary resistance to VEGF‐targeting treatment and indeed such an amplification was identified in one patient of this cohort. 24 In addition to this focal amplification, a variety of other focal events were identified in our cohort and some of them only occurred during treatment. Therefore, in late‐stage tumors, which quickly evolve due to progression and the selective pressure of treatments, a combined evaluation of mutations and SCNA independent of the genetic alterations in the primary tumor might be beneficial over targeted approaches.
None of our assessed parameters correlated with PFS. This can most likely be attributed to the small sample size and the fact that the ORR was dismal and 70% of patient did not respond at all to the treatment. For the same reason, the predictive value of early ctDNA changes was not sufficiently powered to confirm previous observations that early ctDNA changes are predictor of treatment response. 14 , 32 However, it is noteworthy that previous studies, in which a predictive value of ctDNA in mCRC could be demonstrated, included patients treated in first line or second line, 32 in contrast to our cohort of which patients were in their fourth or fifth treatment line. It is well known that the response rates of each subsequent treatment line is likely to be lower than those of prior one, and despite the presence of multiple metastases often only a target lesion is considered. Therefore, surrogate markers for clinical response other than tumor shrinkage might be needed for late‐stage mCRC patients. The majority of nonresponders showed elevated ctDNA levels at EOT and as already previously suggested, ctDNA and RECIST assessment might complement each other for evaluating of therapy success. 33
Recent studies reported methylation marks as highly sensitive marker for CRC screening and prognostication. 34 Although hardly any data are available for Stage IV, methylation marks shown to be prognostic in Stage I‐II cancers, might improve stratification in late‐stage CRC.
Since the majority of genetic profiles of CRC are derived from early‐stage tumors, the secondary aim of our study was to investigate whether mutations in angiogenesis‐related genes might occur at later stages and are associated with progression or affect response to regorafenib. Except for VWF (von Willebrand factor) (vWF), which mediates the adherence of platelets to subendothelium during primary hemostasis and HGF, the only known ligand of c‐Met, in which missense mutations were identified in four and three patients at baseline, respectively, no other genes were recurrently mutated. In one patient, a VWF mutation evolved during treatment. However, most of these and other mutations identified in angiogenesis‐related genes were subclonal indicating that they occurred at a later stage. Whether or not mutations in these genes are implicated in the response to regorafenib remains to be elucidated. Currently only a few resistance mechanisms to VEGF blockade are described and most of them can be attributed to the activation of compensatory pathways such as the HGF/c‐Met 35 or the FGFR pathway. 6 , 36 Moreover, elevated levels of vWF were shown to be associated with tumor‐related angiogenesis and the metastatic process. 37 Yet, mutations in these genes have not been described earlier. Further studies, such as validations of our findings in recently available large‐scale data of comprehensive genomic characterization of advanced tumors, are needed. 38
Taken together, despite the small sample size of our prospective study, our data demonstrate that the assessment and monitoring of ctDNA levels by integrating various genetic alterations is a promising approach and may have significant potential to improve monitoring in late stage CRC.
CONFLICT OF INTEREST
All authors except G.P. and E.H. declare that there is no conflict of interest. G.P. received honoraria for advisory boards and speaker's fee from Taiko, Servier, Bayer, Terumo, Roche, Merck, Amgen, Sanofi, Lilly, BMS and MSD. E.H. received honoraria from Roche for advisory boards, not related to our study.
ETHICS STATEMENT
Our study (NCT01983098) was approved by the institutional ethics committee of the Medical University of Vienna (EC no. 2014‐004927‐27) and was carried out in accordance with the requirements of the International Conference on Harmonization E6 for Good Clinical Practice as laid down in the Helsinki Declaration. All patients included provided written informed consent.
Supporting information
Appendix S1: Supporting information
Figure S2 Copy number profiles from baseline and if available end of treatment (EOT)
Table S3 Summary of mutation analysis using SureSelect
Table S4 Summary of focal copy number alterations
ACKNOWLEDGEMENTS
The analysis was supported by an independent research grant from Bayer (Austria) and by the Austrian Federal Ministry for Digital and Economic Affairs (Christian Doppler Research Fund for Liquid Biopsies for Early Detection of Cancer). E.H. and M.R.S. have an unrelated sponsored research agreement with Servier within CANCER‐ID, a project funded by the Innovative Medicines Joint Undertaking (IMI JU). E.H. receives funding from Freenome, South San Francisco, CA, and PreAnalytiX, Hombrechtikon, Switzerland.
Unseld M, Belic J, Pierer K, et al. A higher ctDNA fraction decreases survival in regorafenib‐treated metastatic colorectal cancer patients. Results from the regorafenib's liquid biopsy translational biomarker phase II pilot study. Int. J. Cancer. 2021;148:1452–1461. 10.1002/ijc.33303
Funding information Innovative Medicines Joint Undertaking; Austrian Federal Ministry for Digital and Economic Affairs
Contributor Information
Ellen Heitzer, Email: ellen.heitzer@medunigraz.at.
Gerald W. Prager, Email: gerald.prager@meduniwien.ac.at.
DATA AVAILABILITY STATEMENT
The data that support the findings of these studies are available from the corresponding authors upon request. All sequencing raw data have been deposited at the European Genome‐phenome Archive (EGA; http://www.ebi.ac.uk/ega/), which is hosted by the EBI, under the accession numbers EGAC00001000072, EGAS00001004491, EGAD00001006384, EGAD00001006385 and EGAD00001006386.
REFERENCES
- 1. Bray F, Ferlay J, Soerjomataram I, Siegel RL, Torre LA, Jemal A. Global cancer statistics 2018: GLOBOCAN estimates of incidence and mortality worldwide for 36 cancers in 185 countries. CA Cancer J Clin. 2018;68(6):394‐424. [DOI] [PubMed] [Google Scholar]
- 2. Lieu CH, Corcoran RB, Overman MJ. Integrating biomarkers and targeted therapy into colorectal cancer management. Am Soc Clin Oncol Educ Book. 2019;39:207‐215. [DOI] [PubMed] [Google Scholar]
- 3. Yoshino T, Komatsu Y, Yamada Y, et al. Randomized phase III trial of regorafenib in metastatic colorectal cancer: analysis of the CORRECT Japanese and non‐Japanese subpopulations. Invest New Drugs. 2015;33(3):740‐750. [DOI] [PMC free article] [PubMed] [Google Scholar]
- 4. Wilhelm SM, Dumas J, Adnane L, et al. Regorafenib (BAY 73‐4506): a new oral multikinase inhibitor of angiogenic, stromal and oncogenic receptor tyrosine kinases with potent preclinical antitumor activity. Int J Cancer. 2011;129(1):245‐255. [DOI] [PubMed] [Google Scholar]
- 5. Li J, Qin S, Xu R, et al. Regorafenib plus best supportive care versus placebo plus best supportive care in Asian patients with previously treated metastatic colorectal cancer (CONCUR): a randomised, double‐blind, placebo‐controlled, phase 3 trial. Lancet Oncol. 2015;16(6):619‐629. [DOI] [PubMed] [Google Scholar]
- 6. Cha Y, Kim HP, Lim Y, Han SW, Song SH, Kim TY. FGFR2 amplification is predictive of sensitivity to regorafenib in gastric and colorectal cancers in vitro. Mol Oncol. 2018;12(7):993‐1003. [DOI] [PMC free article] [PubMed] [Google Scholar]
- 7. Wong AL, Lim JS, Sinha A, et al. Tumour pharmacodynamics and circulating cell free DNA in patients with refractory colorectal carcinoma treated with regorafenib. J Transl Med. 2015;13:57. [DOI] [PMC free article] [PubMed] [Google Scholar]
- 8. Vandeputte C, Kehagias P, El Housni H, et al. Circulating tumor DNA in early response assessment and monitoring of advanced colorectal cancer treated with a multi‐kinase inhibitor. Oncotarget. 2018;9(25):17756‐17769. [DOI] [PMC free article] [PubMed] [Google Scholar]
- 9. Amatu A, Schirripa M, Tosi F, et al. High circulating methylated DNA is a negative predictive and prognostic marker in metastatic colorectal cancer patients treated with Regorafenib. Front Oncol. 2019;9:622. [DOI] [PMC free article] [PubMed] [Google Scholar]
- 10. Heitzer E, Haque IS, Roberts CES, Speicher MR. Current and future perspectives of liquid biopsies in genomics‐driven oncology. Nat Rev Genet. 2019;20(2):71‐88. [DOI] [PubMed] [Google Scholar]
- 11. Siravegna G, Marsoni S, Siena S, Bardelli A. Integrating liquid biopsies into the management of cancer. Nat Rev Clin Oncol. 2017;14(9):531‐548. [DOI] [PubMed] [Google Scholar]
- 12. Wan JCM, Massie C, Garcia‐Corbacho J, et al. Liquid biopsies come of age: towards implementation of circulating tumour DNA. Nat Rev Cancer. 2017;17(4):223‐238. [DOI] [PubMed] [Google Scholar]
- 13. Siravegna G, Mussolin B, Buscarino M, et al. Clonal evolution and resistance to EGFR blockade in the blood of colorectal cancer patients. Nat Med. 2015;21(7):827. [DOI] [PubMed] [Google Scholar]
- 14. Tie J, Kinde I, Wang Y, et al. Circulating tumor DNA as an early marker of therapeutic response in patients with metastatic colorectal cancer. Ann Oncol. 2015;26(8):1715‐1722. [DOI] [PMC free article] [PubMed] [Google Scholar]
- 15. Van Emburgh BO, Arena S, Siravegna G, et al. Acquired RAS or EGFR mutations and duration of response to EGFR blockade in colorectal cancer. Nat Commun. 2016;7:13665. [DOI] [PMC free article] [PubMed] [Google Scholar]
- 16. Barault L, Amatu A, Siravegna G, et al. Discovery of methylated circulating DNA biomarkers for comprehensive non‐invasive monitoring of treatment response in metastatic colorectal cancer. Gut. 2018;67(11):1995‐2005. [DOI] [PMC free article] [PubMed] [Google Scholar]
- 17. Tabernero J, Lenz HJ, Siena S, et al. Analysis of circulating DNA and protein biomarkers to predict the clinical activity of regorafenib and assess prognosis in patients with metastatic colorectal cancer: a retrospective, exploratory analysis of the CORRECT trial. Lancet Oncol. 2015;16(8):937‐948. [DOI] [PMC free article] [PubMed] [Google Scholar]
- 18. Heitzer E, Auer M, Hoffmann EM, et al. Establishment of tumor‐specific copy number alterations from plasma DNA of patients with cancer. Int J Cancer. 2013;133(2):346‐356. [DOI] [PMC free article] [PubMed] [Google Scholar]
- 19. Belic J, Koch M, Ulz P, et al. Rapid identification of plasma DNA samples with increased ctDNA levels by a modified FAST‐SeqS approach. Clin Chem. 2015;61(6):838‐849. [DOI] [PubMed] [Google Scholar]
- 20. Mansukhani S, Barber LJ, Kleftogiannis D, et al. Ultra‐sensitive mutation detection and genome‐wide DNA copy number reconstruction by error‐corrected circulating tumor DNA sequencing. Clin Chem. 2018;64(11):1626‐1635. [DOI] [PMC free article] [PubMed] [Google Scholar]
- 21. Heitzer E, Auer M, Gasch C, et al. Complex tumor genomes inferred from single circulating tumor cells by array‐CGH and next‐generation sequencing. Cancer Res. 2013;73(10):2965‐2975. [DOI] [PubMed] [Google Scholar]
- 22. Ulz P, Belic J, Graf R, et al. Whole‐genome plasma sequencing reveals focal amplifications as a driving force in metastatic prostate cancer. Nat Commun. 2016;7:12008. [DOI] [PMC free article] [PubMed] [Google Scholar]
- 23. Adalsteinsson VA, Ha G, Freeman SS, et al. Scalable whole‐exome sequencing of cell‐free DNA reveals high concordance with metastatic tumors. Nat Commun. 2017;8(1):1324. [DOI] [PMC free article] [PubMed] [Google Scholar]
- 24. Zhou Q, Perakis SO, Ulz P, et al. Cell‐free DNA analysis reveals POLR1D‐mediated resistance to bevacizumab in colorectal cancer. Genome Med. 2020;12(1):20. [DOI] [PMC free article] [PubMed] [Google Scholar]
- 25. Smith CG, Moser T, Mouliere F, et al. Comprehensive characterization of cell‐free tumor DNA in plasma and urine of patients with renal tumors. Genome Med. 2020;12(1):23. [DOI] [PMC free article] [PubMed] [Google Scholar]
- 26. Bachet JB, Bouche O, Taieb J, et al. RAS mutation analysis in circulating tumor DNA from patients with metastatic colorectal cancer: the AGEO RASANC prospective multicenter study. Ann Oncol. 2018;29(5):1211‐1219. [DOI] [PubMed] [Google Scholar]
- 27. Osumi H, Shinozaki E, Takeda Y, et al. Clinical relevance of circulating tumor DNA assessed through deep sequencing in patients with metastatic colorectal cancer. Cancer Med. 2019;8(1):408‐417. [DOI] [PMC free article] [PubMed] [Google Scholar]
- 28. Belic J, Graf R, Bauernhofer T, et al. Genomic alterations in plasma DNA from patients with metastasized prostate cancer receiving abiraterone or enzalutamide. Int J Cancer. 2018;143(5):1236‐1248. [DOI] [PMC free article] [PubMed] [Google Scholar]
- 29. de Wit S, Rossi E, Weber S, et al. Single tube liquid biopsy for advanced non‐small cell lung cancer. Int J Cancer. 2019;144(12):3127‐3137. [DOI] [PubMed] [Google Scholar]
- 30. Suppan C, Brcic I, Tiran V, et al. Untargeted assessment of tumor fractions in plasma for monitoring and prognostication from metastatic breast cancer patients undergoing systemic treatment. Cancer. 2019;11(8):1171‐1186. [DOI] [PMC free article] [PubMed] [Google Scholar]
- 31. Heitzer E, Ulz P, Geigl JB, Speicher MR. Non‐invasive detection of genome‐wide somatic copy number alterations by liquid biopsies. Mol Oncol. 2016;10(3):494‐502. [DOI] [PMC free article] [PubMed] [Google Scholar]
- 32. Osumi H, Shinozaki E, Yamaguchi K, Zembutsu H. Early change in circulating tumor DNA as a potential predictor of response to chemotherapy in patients with metastatic colorectal cancer. Sci Rep. 2019;9(1):17358. [DOI] [PMC free article] [PubMed] [Google Scholar]
- 33. Montagut C, Siravegna G, Bardelli A. Liquid biopsies to evaluate early therapeutic response in colorectal cancer. Ann Oncol. 2015;26(8):1525‐1527. [DOI] [PubMed] [Google Scholar]
- 34. Fan G, Zhang K, Yang X, Ding J, Wang Z, Li J. Prognostic value of circulating tumor DNA in patients with colon cancer: systematic review. PLoS One. 2017;12(2):e0171991. [DOI] [PMC free article] [PubMed] [Google Scholar]
- 35. Jahangiri A, De Lay M, Miller LM, et al. Gene expression profile identifies tyrosine kinase c‐met as a targetable mediator of antiangiogenic therapy resistance. Clin Cancer Res. 2013;19(7):1773‐1783. [DOI] [PMC free article] [PubMed] [Google Scholar]
- 36. Xie YH, Chen YX, Fang JY. Comprehensive review of targeted therapy for colorectal cancer. Signal Transduct Target Ther. 2020;5(1):22. [DOI] [PMC free article] [PubMed] [Google Scholar]
- 37. Damin DC, Rosito MA, Gus P, Roisemberg I, Bandinelli E, Schwartsmann G. Von Willebrand factor in colorectal cancer. Int J Colorectal Dis. 2002;17(1):42‐45. [DOI] [PubMed] [Google Scholar]
- 38. Priestley P, Baber J, Lolkema MP, et al. Pan‐cancer whole‐genome analyses of metastatic solid tumours. Nature. 2019;575(7781):210‐216. [DOI] [PMC free article] [PubMed] [Google Scholar]
Associated Data
This section collects any data citations, data availability statements, or supplementary materials included in this article.
Supplementary Materials
Appendix S1: Supporting information
Figure S2 Copy number profiles from baseline and if available end of treatment (EOT)
Table S3 Summary of mutation analysis using SureSelect
Table S4 Summary of focal copy number alterations
Data Availability Statement
The data that support the findings of these studies are available from the corresponding authors upon request. All sequencing raw data have been deposited at the European Genome‐phenome Archive (EGA; http://www.ebi.ac.uk/ega/), which is hosted by the EBI, under the accession numbers EGAC00001000072, EGAS00001004491, EGAD00001006384, EGAD00001006385 and EGAD00001006386.