

Abstract
Successfully managing risks to achieve wild polioviruses (WPV) eradication and address the complexities of oral poliovirus vaccine (OPV) cessation to stop all cases of paralytic poliomyelitis depends strongly on our collective understanding of poliovirus immunity and transmission. With increased shifting from OPV to inactivated poliovirus vaccine (IPV), numerous risk management choices motivate the need to understand the trade-offs and uncertainties and to develop models to help inform decisions. The US Centers for Disease Control and Prevention hosted a meeting of international experts in April 2010 to review the available literature relevant to poliovirus immunity and transmission. This expert review evaluates 66 OPV challenge studies and other evidence to support the development of quantitative models of poliovirus transmission and potential outbreaks. This review focuses on characterization of immunity as a function of exposure history in terms of susceptibility to excretion, duration of excretion, and concentration of excreted virus. We also discuss the evidence of waning of host immunity to poliovirus transmission, the relationship between the concentration of poliovirus excreted and infectiousness, the importance of different transmission routes, and the differences in transmissibility between OPV and WPV. We discuss the limitations of the available evidence for use in polio risk models, and conclude that despite the relatively large number of studies on immunity, very limited data exist to directly support quantification of model inputs related to transmission. Given the limitations in the evidence, we identify the need for expert input to derive quantitative model inputs from the existing data.
Keywords: polio eradication, risk management, dynamic modeling
INTRODUCTION
Following the 1988 World Health Assembly resolution to eradicate wild polioviruses (WPVs),(1) the Global Polio Eradication Initiative successfully eradicated type 2 wild polioviruses (WPV2) and made significant progress towards eradication of types 1 and 3 (WPV1 and WPV3).(2) Completing the last phases of polio eradication requires aggressive efforts to vaccinate people in the remaining reservoirs of WPV transmission, control and prevent outbreaks of WPVs and circulating vaccine-derived polioviruses (cVDPVs) in previously polio-free areas, and maintain high-quality surveillance to certify WPV eradication. Due to cases of poliomyelitis caused by cVDPVs and vaccine-associated paralytic polio (VAPP), ending all poliomyelitis caused by poliovirus will require cessation of the live, attenuated oral poliovirus vaccine (OPV) use after WPV eradication.(2, 3) A large number of complex policy decisions to manage risks before WPV eradication(4) and beyond(5, 6) motivate the use of models to understand the trade-offs between alternatives and quantify the impact of different assumptions on outcomes. Dynamic infection transmission models combined with probabilistic risk analyses can provide projections of disease burden anticipated with different courses of action.(7–10) These projections represent critical inputs to health economic analyses,(11) such as cost-effectiveness analyses and benefit-cost analyses, that aim to inform decisions by evaluating the benefits, risks, and costs of alternative options and providing insights about trade-offs.(12) In addition to projecting potential outcomes, these analytic models support policy discussions by providing structure to address complex problems and make key assumptions explicit, which helps to critically examine assumptions and encourage further study.(10, 13) Although recent models offer important insights, policy makers now face increasingly complex choices as they determine the optimal roles of different available vaccine tools (i.e., monovalent OPV (mOPV), bivalent OPV (bOPV), and trivalent OPV (tOPV), inactivated poliovirus vaccine (IPV), and antivirals) and manage global risks to achieve and maintain a polio-free world under real financial constraints. Making informed decisions requires an understanding of the immunity induced by the available vaccines and WPV infections and their effects on poliovirus transmission in different populations.
Poliovirus immunity and transmission represent complicated concepts. Only approximately 1 in 100 or fewer infections in immunologically naive (i.e., fully susceptible) individuals lead to paralytic polio,(14) and consequently transmission models must consider both symptomatic and asymptomatic infections. Moreover, while the ability of poliovirus vaccines to induce serum antibodies that protect individuals from paralytic poliomyelitis disease remains well-established, numerous challenge studies demonstrate that seropositive individuals can become re-infected and excrete poliovirus.(14, 15) Thus, although infections in individuals with prior immunity do not appear to lead to paralysis, prior immunity to disease does not prevent individuals from getting infected and participating in poliovirus transmission. To emphasize the distinction from immunity to symptomatic poliomyelitis disease, we use the term immunity to poliovirus transmission to refer to the combined effect of immunity on the probability of re-infection, duration and amount of excretion and infectiousness to others, which all affect participation in poliovirus transmission. Understanding immunity and its effects on poliovirus transmission in different populations requires careful review and interpretation of the available data.
This paper provides an expert review aimed at assessing the current state of the literature to support the development of inputs for quantitative models related to immunity to poliovirus transmission. Preparation of this expert review began with a meeting of the authors in April 2010, which also led to a synthesis of assessments from the experts for specific model inputs and the identification of key knowledge gaps.(16) We focus this review on 66 studies that measured the probability, duration, and concentration of poliovirus excretion by subjects with different exposure histories challenged with live, attenuated OPV or OPV candidate strains (i.e., OPV challenge studies). These studies provided the basis for characterizing different states of immunity that may result from exposure to polioviruses.(16) We also recognized the importance of waning of immunity and its effect of excretion on transmission, which only a few OPV challenge studies address. Consequently, in our review we considered the evidence from other types of studies, including studies that characterized seroimmunity, antibody kinetics, secondary attack rates, and epidemiological observations. Given the explicit context of our review to evaluate the evidence available to support risk analysis and modeling of poliovirus transmission in populations, we focused on several key topics and assessed and graded the existing literature relevant to these topics.
BACKGROUND AND METHODS
Scope of the review
Modeling poliovirus transmission requires characterization of the population immunity as it evolves over time for each of the three serotypes.(8) For polioviruses, the large number of combinations of potential types of individual immunity complicates the characterization of population immunity.(17) For example, individual immunity may result from exposure to wild polioviruses (WPVs) or from vaccination with OPV and/or IPV, which provide different types of immunity.(14, 15) In addition, OPV vaccination leads to secondary immunization of contacts(18–22) and both vaccines “take” at different rates for each serotype, as shown by widely varying seroconversion rates by serotype, setting, and vaccine.(4, 15, 23) Infection with a live poliovirus (LPV, i.e., a WPV, OPV, OPV-related virus, or VDPV) due to vaccination with OPV or natural exposure to a LPV leads to replication of poliovirus in the gut. This infection induces both serum antibodies, which provide systemic immunity and protection from paralytic poliomyelitis, and local antibodies that provide mucosal immunity. Mucosal immunity typically results in significant reduction in the probability, duration, and concentration of poliovirus excretion in feces upon challenge with a subsequent LPV,(24, 25) and OPV also prevents or substantially reduces excretion from the oropharynx,(26) which both may impact transmission.(27) In contrast, vaccination with IPV does not result in infection or virus replication. Compared to infection with an LPV, successful IPV vaccination results in systemic immunity and reduced oropharyngeal excretion if infected with a live poliovirus, but little or no enteric mucosal immunity.(26) As a result of the complexity of immunity, poliovirus infection transmission models must go beyond simple susceptible-infected-removed (SIR) models.(8) While we e recognize that the ability to participate in poliovirus transmission depends on many factors besides immunity, such as contact patterns and environmental conditions, we focus this review on the role of immunity and we assume that risk and policy models will capture the other factors in the basic reproductive number (R0)(8, 28) or more detailed characterizations of mixing.(29) Thus, for this review determining the specific immunity states used to characterize population immunity represents the first task in model development.(16)
A previously-published poliovirus transmission model(8) captured some of the complexity underlying population immunity for polioviruses by including the 4 different immunity states (i.e., “partially infectible groups” (8, p. 359)) shown in Figure 1. Each box in Figure 1 represents an immunity state, and the arrows represent flows between these states as a result of 3 possible processes (in addition to accumulation of unvaccinated infants as fully susceptibles): infection with a LPV (i.e., the model treats WPV, OPV, OPV-related virus, and VDPV similarly in terms of the resulting immunity to poliovirus transmission), vaccination with IPV, or waning. Entering immunity states requires “take,” (i.e., vaccination or LPV exposure that stimulates the immune system, as typically measured by increased antibody titers). The model(8) assumed that IPV vaccinated individuals and those with prior LPV infection(s) benefit from protection from paralytic disease, but that they remain “partially infectible,” because they may still participate to some degree in the asymptomatic poliovirus transmission. The model further assumed that LPV infection would move individuals to the “recent live” state (i.e., the highest level of immunity to poliovirus transmission) regardless of their prior immunity state. Later variations of the model that considered longer time horizons used an average waning time of 2 years to go from a “recent live” to a “historic live” immunity state.(30, 31) Thus, the “historic live” state represents the average level of immunity to poliovirus transmission for all individuals who recovered from their most recent live poliovirus at least approximately 2 years ago (i.e., individuals with waned immunity). The outbreak model also characterized a “removed” immunity state (not shown in Figure 1) for individuals infected during an outbreak, because it assumed that the “removed” individuals would not become infected again with the same LPV during the same outbreak. The model shown in Figure 1 essentially ignores the effect of maternal immunity, such that successfully vaccinated infants who receive immunization before their maternal immunity wanes flow directly into the “recent live” or “IPV only” state, while unvaccinated or unsuccessfully vaccinated infants enter the model as fully susceptibles.
Figure 1: Immunity states used by Duintjer Tebbens et al. (2005)(3) to represent immunity to poliovirus transmission from an “average” poliovirus serotype.*.

Acronyms: IPV = inactivated poliovirus vaccine; LPV = live poliovirus
Notes:
* Arrows conditioned on “take” (i.e., successful IPV vaccinations or actual LPV infections).
** We scale the level of immunity to poliovirus transmission from low (fully susceptible) to high (fully immune to poliovirus transmission), with the level of immunity to poliovirus transmission calculated for this figure as the product of relative susceptibility, relative infectiousness, and relative duration of infectiousness compared to fully susceptibles.(8) The heights of boxes reflect the assumed uncertainty about the average level of immunity to poliovirus transmission and the centers correspond approximately to the assumed base case levels of immunity to poliovirus transmission.
Although these assumptions represented important simplifications, the structure in Figure 1 supported the development of models for some policies. However, many issues related to vaccination choices during the pre-eradication and transition periods require more detailed immunity states. For example, we now need to consider serotype differences given widespread use of different types of OPV products (mOPV, bOPV, and tOPV) and the potential policy option of OPV2 cessation.(6) The immunity states in Figure 1 also do not distinguish different numbers of doses or infections, allow for waning from all of the states, characterize combined exposure histories of IPV and LPV, account for maternal immunity, or consider the effect of immunity on different modes of transmission (i.e., fecal-oral vs. oropharyngeal).
For this review, we define immunity states by readily identifiable immunological event histories, including a given number of LPV infections and/or successful IPV vaccinations (i.e., vaccinations that stimulate the immune system), and a given time since the last immunological event. Newborns may receive significant, passive maternal antibodies at birth or shortly thereafter in colostrum, with very limited and probably insignificant transfer of passive antibodies through breast milk later during infancy.(32) Therefore, we include transfer of maternal antibodies at and after birth as a distinct exposure event. For each immunity state, we seek to review the evidence related to the immunity to poliovirus transmission, which includes the probability of becoming infected upon subsequent exposure to a LPV, and the duration and concentration of virus excreted if infected. Given that poliovirus transmissions in different settings may occur both as a result of fecal and/or oropharyngeal virus excretion,(27) immunity to both types of excretion could impact transmission. Thus, in addition to the probability, duration, and concentration of poliovirus excretion in different immunity states, immunity to poliovirus transmission also depends on the effect of different levels of excretion on transmission, which in turn depends on the setting and may differ for fecal and oropharyngeal excretion.
Determination of immunity states
We recognize that immunity to poliovirus transmission of individuals within a given immunity state may vary along a continuum due to a large number of factors (e.g., genetics, environment, dose and timing of previous infections/vaccinations, interference from other enteroviruses, immunity level of mother), such that each immunity state represents a distribution. For example, for an immunity state that includes a history of 2 successful OPV vaccinations (i.e., OPV infections) during childhood followed by 1 WPV infection dating back 3 years, not all individuals in that immunity state would respond in the same way to an identical subsequent exposure to a LPV. However, for modeling purposes we typically divide the continuum into discrete states and focus on determining the average level of immunity to poliovirus transmission of each immunity state to understand the overall behavior of the system, recognizing uncertainty about these averages and variability within immunity states. We emphasize that similar to the previous model,(8) entering an immunity state requires actual infections or successful vaccinations (i.e., we condition immunity states on prior “take”). To streamline the model and extract meaningful data from the literature, we define a “recent” immunity state as the state of immunity immediately after the complete immune response to a LPV infection or successful IPV dose. However, we recognize that waning of immunity occurs from the maximum level in the recent state, and that the kinetics of waning represents an important and uncertain process to model in order to characterize how the level of immunity to poliovirus transmission changes with time.
To explore the full set of potential immunity states, we first consider the possible immunity states for a simplified situation with a only one serotype and only LPVs (i.e., no IPV) shown in Figure 2. Boxes represent immunity states and arrows represent LPV infections (i.e., they only include vaccinations that take). We emphasize that immunity to poliovirus transmission of all three serotypes requires consideration of separate diagrams for all three serotypes, and the heights and positions of the boxes may vary by serotype. Newborn children enter the population with maternal immunity in the box “maternally immunes,” which depends on the levels of serum antibodies in their mothers. These antibodies disappear in the absence of LPV infections, leading to full susceptibility, represented by the box of “fully susceptibles.” The first infection with LPV leads “fully susceptibles” or “maternally immunes” into the “1 LPV infection” immunity state. The probability of becoming infected if exposed to an LPV, and possibly also the resulting level of immunity to poliovirus transmission, depend on the specific LPV (i.e., WPV strain, VDPV strain, tOPV, bOPV, mOPV), serotype, and the amount of virus received (i.e., the immunity state is a function of exposure). Thus, the box “1 LPV infection” in Figure 2 represents a distribution of levels of immunity to poliovirus transmission associated with each possible exposure, and we assume all individuals with a single LPV infection of one serotype fit in that box. In addition, after recovery and in the absence of subsequent infections, immunity to poliovirus transmission will wane as a result of decreasing antibody levels. Thus, with each possible exposure we could associate a continuum of immunity states (boxes) representing the extent of waning of immunity as a function of time since the arrival in the “1 LPV infection” box. In Figure 2, we indicate this by representing the immunity state “historic 1 LPV” as a function of time, with a large vertical range to reflect the notion that waning of immunity may eventually lead to substantially lower levels of immunity to poliovirus transmission. At any time after the first infection, a second LPV infection with the same serotype could occur, (possibly) leading to a higher level of immunity to poliovirus transmission (again, with dependence on strain and amount of virus in the exposure). The level of immunity to poliovirus transmission resulting from the second infection may also depend on the pre-existing level of immunity to poliovirus transmission, which wanes over time, and thus on the time since the first infection, as indicated. The same structure occurs for additional (n) LPV infections, although arguably the increase in immunity to poliovirus transmission associated with additional infections becomes smaller with each subsequent infection. We use dashed edges for infection n to indicate its potential subdivision into any number of LPV infections.
Figure 2:
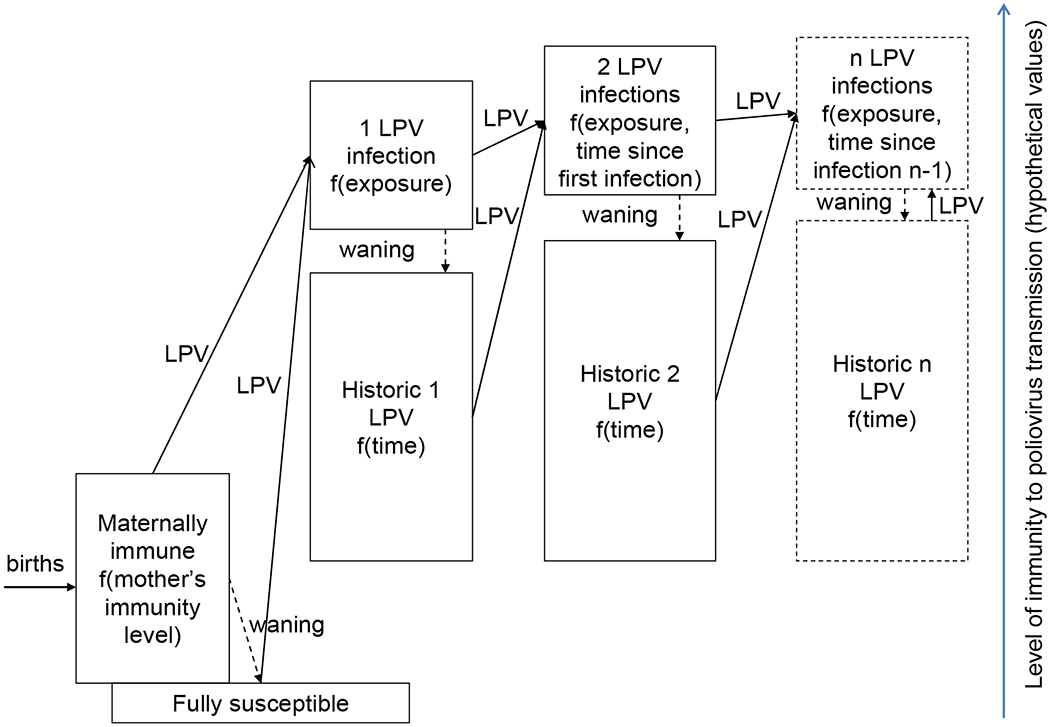
Full set of immunity states in a world with only live polioviruses (LPVs) for one serotype with the LPV arrows conditioned on “take” (i.e., actual infections, including successful OPV vaccinations).
Figure 3 presents a simplified situation in which only IPV exists, again providing the structure for immunity to a single serotype. The “maternally immunes” and “fully susceptibles” remain the same as in Figure 2, and if individuals in these groups receive a single IPV dose that effectively stimulates the immune system, then they move to the immunity state “1 successful IPV dose.” The success of the first dose may or may not manifest itself in detectable antibodies, but it leads to a “primed” state of the immune system resulting in a high seroconversion rate for the second dose, implying that a first successful dose may not equal the more narrow definition of a “take” as a dose that leads to seroconversion.(33) The immunity to poliovirus transmission of the “1 successful IPV dose” immunity state remains uncertain due to lack of evidence. For any IPV dose, the probability of “take” and possibly also the resulting level of immunity to poliovirus transmission depend on the vaccine formulation/delivery (e.g., enhanced vs. original IPV, adjuvants, fractional dosing, vaccination route of administration) and timing of IPV administration,(15) as indicated. The immunity state “historic 1 IPV” indicates waning of the “1 successful IPV dose” state as a function of time. Subsequent successful IPV doses move individuals to higher immunity states, with the level of immunity to poliovirus transmission potentially depending on the time between the doses. For example, a “booster” effect for IPV doses given a minimum amount of time after the previous dose may lead individuals to a different level of immunity to poliovirus transmission than “primary” IPV doses given within the minimum time frame. The time frame between “booster” and “primary” doses clearly affects antibody titers,(15) but its effect on immunity to poliovirus transmission remains uncertain. Consequently, we focus on the more clear-cut distinction between different numbers of successful doses, while indicating the dependence on time since the previous dose as an extra dimension of the boxes “2 successful IPV doses” and “n successful IPV doses.”
Figure 3:
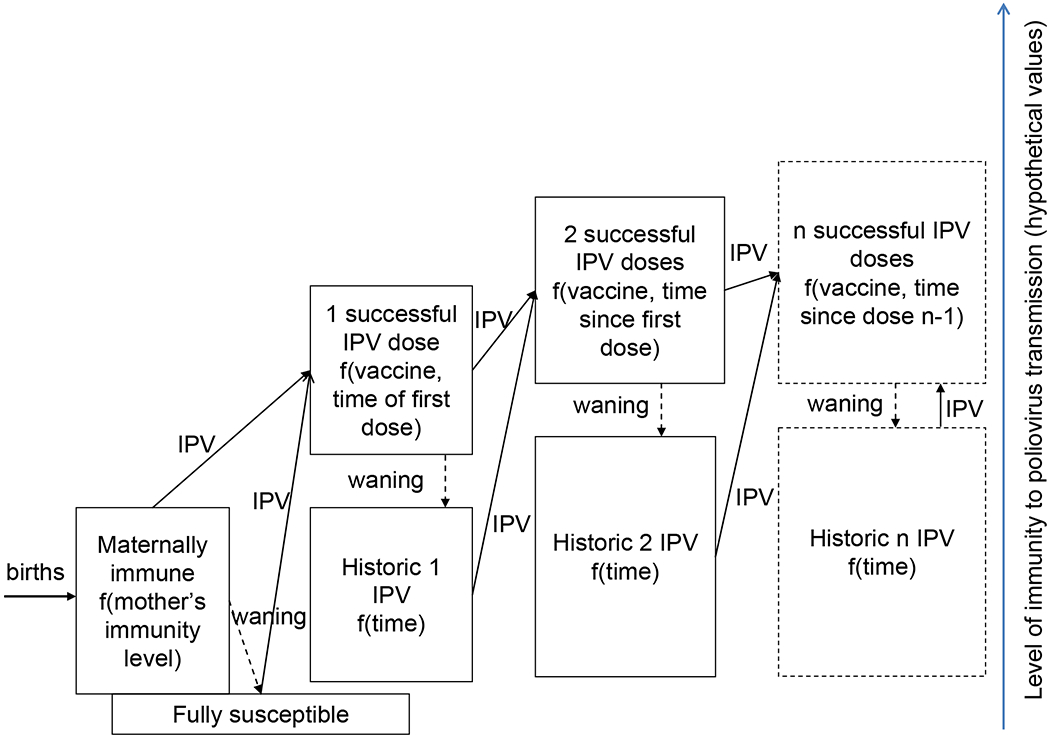
Full set of immunity states in a world with only inactivated poliovirus vaccine (IPV) for one serotype with IPV arrows conditioned on “take” (i.e., successful vaccinations).
Clearly, even considered separately, immunity to poliovirus transmission induced by exposure to LPV or IPV represents a complex concept, and in reality any combination of immunity states derived from the immunity states in Figures 2 and 3 can occur. We attempt to represent the complexity by presenting a narrowed-down set of immunity states, with the understanding that each state represents a distribution of possible levels of immunity to poliovirus transmission. To characterize the immunity states, we use the following simplifying assumptions:
The interval between successful IPV doses does not impact the resulting level of immunity to poliovirus transmission if IPV takes
Three or more successful IPV doses all lead to same level of immunity to poliovirus transmission
Two or more LPV infections of any strain all lead to the same level of immunity to poliovirus transmission as long as sufficient time elapses between exposure for subsequent infections to represent “new” infections
All mixtures of LPV infections and successful IPV doses lead to the same level of immunity to poliovirus transmission
The variability of levels of immunity to poliovirus transmission resulting from exposure to different strains and amounts of LPV is negligible compared to the variability across the 8 immunity states or across serotypes
The last assumption means that we do not distinguish different states of immunity to poliovirus transmission resulting from different strains or amounts of exposure, although we recognize that these factors probably impact the probability of entering immunity states (i.e., “take”). With the above assumptions, we define the following minimum set of recent immunity states required for each serotype to model poliovirus transmission in sufficient detail to address outstanding current and future policy questions (Figure 4):
Maternally immune: Individuals born with maternal antibodies that wane rapidly with age (if not infected with LPV or successfully vaccinated with IPV)
Fully susceptible: Individuals never infected with LPV or successfully vaccinated with IPV and maternal antibodies effectively waned to 0
1 successful IPV dose: Individuals with 1 IPV dose that reached and stimulated the immune system and no history of LPV infection, including those “primed” and without measureable serum antibody
2 successful IPV doses: Individuals with 2 IPV doses that reached and stimulated the immune system and no history of LPV infection
≥3 successful IPV doses: Individuals with at least 3 IPV doses that reached and stimulated the immune system and no history of LPV infection
IPV and LPV: Individuals infected at least once with an LPV and successfully vaccinated at least once with IPV, in any order
1 LPV infection: Individuals with a history of a single LPV infection and no history of successful IPV vaccinations
≥2 LPV infections: Individuals with a history of multiple LPV infections and no history of successful IPV vaccinations
Figure 4:

Diagram of immunity states with waning, showing variability within groups as a function of time since last exposure (but ignoring variability due to other factors) and with inactivated poliovirus vaccine (IPV) and live poliovirus (LPV) arrows conditioned on “take” (i.e., successful IPV vaccinations or actual LPV infections).
Waning can occur from any immunity state (except fully susceptible), and the term “recent” immunity states refers to immunity states prior to the occurrence of any waning. Our review of the literature focuses on characterizing susceptibility and the concentration and duration of virus excretion for these recent states, and we review waning separately. Figure 4 depicts the 8 recent immunity states and shows the potential for waning within most of these immunity states, which depends on the time since the last immunological event. Some immunological events move individuals between waning states within a given immunity state (e.g., the LPV arrow in the “≥ 2 LPV infections” immunity state), while other immunological events move individuals from one immunity state to another. The incoming arrows from one state to another in Figure 4 always go to the “recent” level within the receiving immunity state, while the outgoing arrows typically go from all levels within an immunity state, meaning that the new immunological event represented by the arrow produces the same effect regardless of the time since last prior immunological event (i.e., provided that sufficient time elapsed for the new immunological event to take). However, given the known effect of time between doses on antibody titers,(14, 15) we address the possible variability within each box by reviewing data on the relationship between antibody titers and immunity to poliovirus transmission.
Literature included and grading
We recognized that different types of studies provide evidence related to the immunity states shown in Figure 4. The conventional way to measure probability, duration, and concentration of poliovirus excretion involves challenging a study population with OPV, determining the percentage of subjects excreting the virus as a function of time after challenge, and assessing the concentration of virus isolated, which are typically measured in (log) cell- or tissue-culture infective doses (CID50) per gram of feces or ml of oropharyngeal excreta. We focused on reviewing the OPV challenge because they use relatively well-controlled designs as opposed to results from case reports or cross-sectional excretion studies.(34) We searched the PubMed database in March 2010 with keywords “OPV” and “excretion” and “OPV” and “challenge”. This yielded 65 hits and 15 distinct OPV challenge studies that measured virus excretion. In addition, we identified 42 OPV challenge studies previously known by the authors, published after March 2010, or cited in other OPV challenge studies or reviews on poliovirus immunity.(14, 15, 34) In addition to the OPV challenge studies, numerous studies exist that provide results from stool sampling in the context of small and large vaccine trials and outbreaks over time throughout the world, including many results published only in the non-peer-reviewed literature. Our review does not include all challenge data recorded in every context, but we believe that it covers the relevant data and that inclusion of further OPV challenge studies from the non-peer reviewed literature would not alter the insights with respect to quantifying immunity to poliovirus transmission. In the context of filling some data gaps in our review, we also considered the available evidence from studies that measured seroconversion or seroimmunity, antibody kinetics, WPV excretion, secondary attack rates, and epidemiological observations. We identified these other types of studies in the references from OPV challenge studies and reviews or through discussion among the authors.
The studies included in our review primarily sought to answer different questions than those we focused on for our review. Consequently, even studies designed and executed perfectly for the intended questions imply limitations with respect to interpretation for our review. We identified the limitations of each study and summarized these in our first pass. In the context of our discussions, we then categorized the limitations and reviewed every study again to assign the limitations from the list to each study. Finally, we discussed and iterated on the list until we felt we captured the complete set of limitations relevant to grading this body of evidence to support modeling.(35) The lead author reviewed every study at each round to ensure consistent application of the limitation criteria and other authors reviewed a subset of the studies as a means of verification and participated in multiple discussions and iteration of drafts of the paper to discuss the studies and review the tables.
Table 1 identifies the list of limitations for each study relevant to our potential use of its data for modeling poliovirus transmission for 4 specific attributes of the studies. The design attribute characterizes the nature of the study (i.e., observational or randomized controlled) and the appropriateness of the study for estimating the specific model input, which we capture in limitations A through F. With respect to limitation A, the assignment to immunity states always remains beyond the control of the investigator due to unknown history of immunological events (e.g., the inability to assign who gets naturally infected with LPVs, who experiences a successful take to assigned vaccinations, or who received maternal antibodies at birth). While this makes all results potentially biased (e.g., subjects who experienced a pre-challenge LPV infection may represent inherently more biologically-vulnerable subjects for unknown reasons), we do not believe this represents an important source of bias. Consequently, we only assign limitation A to studies in which the pre-challenge vaccination history (i.e., not immunity state, but actual history of vaccinations) remains uncontrolled by the investigator. For example, in a convenience sample of children with various vaccination histories, the number of doses may negatively correlate with the likelihood of natural LPV infections, introducing a sufficiently important bias to consider a limitation when comparing the effect of different numbers of doses. With respect to limitation B, we consider all relevant factors (e.g., vaccination status, pre-challenge serology, age, likelihood of natural LPV infections) on a case-by-case basis to decide if a susceptible control arm exists. Absence of pre-challenge serology (limitation C) affects our ability to establish the proportion of subjects who experienced takes of prior doses or natural LPV infections, or who possess maternal antibodies and therefore affect our ability to assign study arms to immunity states. With respect to limitation D, we indicate the arms we consider to contain fewer than 10 subjects, and we emphasize that the limitation may not apply to all specific topics for which we considered the study. Given that excretion rates typically peak during the first one or two weeks following a challenge, later stool specimen collection times reduce the sensitivity to detect excretion (limitation E). We apply limitation F only for studies that challenge with tOPV or bOPV, and not for studies that sequentially challenge with different mOPV types (typically at monthly intervals) even though this may lead to limited interference as well.
Table 1.
Limitations related to our potential use of study data for modeling immunity to poliovirus transmission
| Attribute | Limitations (“critical” limitations bolded)a | Grading criteria |
|---|---|---|
| Design | A. Assignment of subjects to different vaccination arms beyond control of the investigator B. Absence of reported results for a plausible susceptible control armb C. Pre-challenge serology not performed or reported D. Fewer than 10 subjects in all or some relevant study arms E. Stool sample collection starting later than 2 weeks after challenge F. Simultaneous challenge with 2 or more serotypes (i.e., bOPV or tOPV challenge) |
High: At least 1 study without any of the limitations A-F Moderate: 1 or more studies with only limitations A and/or C Low: Only studies with at least one of the limitations B, D, E, or F |
| Relevance | G. Pre-challenge serology reported, but excretion results not stratified by pre-challenge serum antibody levelsc H. Cumulative proportion of subjects excreting over sampling interval not reported or fewer than 2 stool specimen collection times I. Instantaneous homotypic isolation rates (as opposed to cumulative rates over a period of time) of 10% or more prior to the challenge (not including contacts of challenged subjects) due to natural LPV infections J. Indirect evidence (i.e., other than isolation rates in unchallenged subjects) suggesting that natural LPV exposure substantially interferes with study results K. Ambiguity about natural LPV exposure L. Use of non-Sabin vaccine strains for challenge M. Use of Salk IPV vaccine N. Study arms clearly not belonging to a “recent” immunity state given challenge administered at least one year after recorded vaccination or immunological event O. Reported excretion results not disaggregated by vaccination historiesd P. Exposure different than that leading to natural infection with LPV (true for all OPV challenge studies) Q. Serology indicates that study arms contain more than 25% homotypic non-responderse to prior doses (excl. first IPV dose, which may “prime” the immune system without leading to detectable seroresponse) or that at least 25% of presumed fully susceptibles have residual homotypic maternal immunity f,g R. Indirect evidence (other than serology) suggesting poor take of prior doses or residual maternal immunity |
High: At least 1 study without any of the limitations G-R Moderate: 1 or more studies with only limitations G, H, K, M, and/or P Low: Only studies with at least one of the limitations I, J, L, N, O, Q, R |
| Quality |
S. Laboratory methods not reported, incompletely reported, or reported in unattainable referencesg,i T. Laboratory methods have unknown or reduced sensitivity for detection or quantification of virus U. Seropositivity not defined as antibody titers of 1:8 or more or 1:10 or morei V. Serology method uses wild poliovirus strainsi W. Serology method not standardized or comparability to other assays unknowni |
High: At least 1 study without any of the limitations S-X Moderate: 1 or more studies with only limitations U, V, and/or W Low: Only studies with at least one of the limitations S, T |
| Consistency | X. Outcomes inconsistent with the majority of studies | High: 3 or more studies without limitation X Moderate: 2 studies without limitation X Low: Fewer than 2 studies without limitation X |
Acronyms: bOPV = bivalent oral poliovirus vaccine; IPV = inactivated poliovirus vaccine; LPV = live poliovirus; tOPV = trivalent oral poliovirus vaccine
Notes:
Refer to the literature and grading subsection of the methods section for additional discussion of limitations
This includes studies that report no challenge results among unvaccinated subjects, only results for unvaccinated children challenged at birth dose, or different conditions for susceptibles than for other arms (e.g., different challenge dose or sampling times)
If in addition serology indicates poor seroconversion of prior doses, then this complicates assignment to immunity states and limitation Q applies in addition to this limitation
For example, some studies combined results for unvaccinated and IPV-vaccinated subjects or different numbers of doses
Defined by less than 4-fold rise in antibody (corrected for maternal antibody decay)
Defined as reciprocal titers of 1:8 or more
This limitation may only apply for some study arms or serotypes and only applies if limitation G applies (i.e., if excretion results stratified by pre-challenge antibody titers, then we can separate responders from non-responders and maternally immunes from fully susceptibles)
In many cases of unreported or unattainable method descriptions from other sources, one or more of the authors of this review could provide sufficient details to assess whether limitations T-W apply, in which cases we did not apply limitation S
Limitations related to the serological methods do not affect grading if limitation G applies
The relevance attribute characterizes the extent to which the population and outcome measures provide information relevant to those of interest, which we capture in limitations G through R. These limitations all affect our ability to assign study arms to immunity states (limitations G, H, I, J, K, N, O, Q, and R), provide data directly relevant to current vaccines (limitations L and M), or assess immunity states with respect to realistic routes of exposure (limitation P, which applies to all OPV challenge studies). Limitation J applies when a study mentions a high level of natural exposure to LPV in the study setting and limitation K applies when we know from the context of the study (e.g., country, year, and age of subjects) that subjects possibly experienced undocumented LPV infections. One of limitations I-K applies in all situations except in settings free of LPVs, like IPV-using countries or countries with documented absence of LPV transmission between OPV campaigns (e.g., Cuba).(36, 37)
The quality attribute characterizes details about the methods and execution, for which limitations S through W apply. Limitation S refers to both virus isolation and serological methods, and does not apply if one or more of the authors of this review could assess the methods in sufficient detail to assess limitations T-W. For the virus isolation method, we apply limitation T if virus detection does not involve the MK, HeLa, L20b, RD, HEp-2, or Vero cell lines, or if the investigators collected rectal swabs instead of stool specimens. Inadequate suspensions or inoculum could also affect limitation T, but we found no evidence of such inadequacies in any of the studies. For limitation V, we assume that color tests, metabolic inhibition tests, and plaque reduction tests used WPV reference strains (unless otherwise noted). We also apply limitation V for studies that reported use of neutralization tests with WPV strains, given that the current standard recommends the use of Sabin strains.(38) Limitation W applies for assays with unknown sensitivity or known reduced sensitivity compared to current WHO standards.(38) Finally, the consistency attribute characterizes the similarity of estimates across studies, for which we use limitation X. We note that some studies provide results that look like “outliers,” but for which we typically can identify one or more explanations for the observed differences. We only assign limitation X to any individual study if no apparent explanation exists for atypical observations compared to two or more studies.
We use the limitations in Table 1 to evaluate the evidence for each specific topic related to immunity to poliovirus transmission by grading the evidence for the 4 attributes based on the corresponding limitations. We evaluate the overall weight of the evidence by summarizing an overall grade that depends on the grades of studies containing relevant data with respect to each attribute and immunity state, according to the criteria provided in the far right column of Table 1, and we consider limitations only as they apply to the specific topic for which we assess the evidence (e.g., if a study does not allow stratification by pre-challenge seroimmunity status for a given topic, then we consider limitation G, but not any of the limitations related to serological methods (S, U, V, or W) to assess the weight of the evidence). We assign a high grade with respect to a given attribute for a topic if at least one study does not include any limitations captured by the attribute. We deemed limitations critical if they significantly affected our ability to make inferences from study results to inform the development of model inputs, as identified with bold text in Table 1. We assign a moderate grade if we find one or more studies free of any critical limitations identified with bold text in Table 1, but including at least one of the non-critical limitations. We assign a low grade otherwise (i.e., if all studies include one or more of the critical limitations). For the consistency attribute, we differentiate availability of fewer than 2 consistent studies (low grade), 2 consistent studies (moderate grade), and 3 or more consistent studies (high grade). We use the grades for the four attributes to assign the overall grade for the evidence. To receive a high overall grade, we require a high grade for each attribute. A low grade for any of the attributes automatically leads to an overall low grade, and the absence of any data pertaining to the given topic leads to a very low grade. We assign a moderate grade otherwise. Given that OPV challenge studies involve exposure routes that differ from natural exposure, we find that the highest possible relevance grade remains moderate, which automatically implies a maximum overall grade of moderate. While OPV challenge study results exist that reflect natural exposure to contacts (i.e., attack rates), given the many other variables that affect contact infections and the uncontrolled nature of secondary spread we focus on the direct challenge data for the characterization of immunity states. We use the secondary attack rate results only for our discussion of the difference in transmissibility between OPV and WPV.
In the absence of serological data before and after each dose and the challenge, assignment of study arms to immunity states comes with uncertainty. Unless serological evidence indicates otherwise, we assign study arms based on the number of doses, even if we remain uncertain that all doses took. To distinguish fully susceptibles from maternally immunes in the absence of serological data, we consider previously unvaccinated infants challenged before 2 months of age as maternally immune and previously unvaccinated infants challenged at 2 months or more as fully susceptible. To further facilitate the interpretation of results within the appropriate context, we provide information about the setting. We classify settings by the extent to which the study conditions favor enterovirus transmission ranging from low to medium to high transmissibility (i.e., roughly corresponding to low-, middle-, and high-income country settings).(8, 28) For ease of presentation, we identify studies in the tables and figures only by the first author and year. In some cases, we include more than one reference for a study, because some studies yielded more than one published paper.
RESULTS
Table 2 summarizes key attributes of the 66 OPV challenge studies that we identified in the published literature. Table 2 includes key information from each challenge study about the location, challenge vaccine(s) used, study arms challenged, methods for virus isolation, stool sampling intervals, and reporting of isolated virus titers. Table A1 details the assignment to immunity states of all study arms for which we included results in the topical summary tables. The last column provides limitations using the symbols from Table 1, and any notes relevant to the interpretation of results or additional information provided and not captured under the other columns (e.g., studies that reported oropharyngeal excretion).
Table 2:
Summary of OPV challenge studies
| Location First author (year)(ref) |
Challenge dose (10log CID50) | Challenged study arms [age at time of challenge] (number tested for post-challenge excretion) Recent immunity state(s) for which study provides data |
Virus isolation cell line or method | Sample collection times (days after challenge)a | Excreted virus titers reported? |
Limitations (see Table 1) Notes |
|---|---|---|---|---|---|---|
| Netherlands Abbink (2005)(89) and Buisman (2008)(95) |
mOPV1 (5.8); mOPV3 (4) | Unvaccinated homotypic seronegative adults [54-74 yrs.] (103 fed mOPV1; 115 fed mOPV3); unvaccinated triple seropositive adults [54-74 yrs.] (46 fed mOPV1; 44 fed mOPV3); triple seropositive adults w full IPV history [49-54 yrs.] (29 fed mOPV1; 39 fed mOPV3) Immunity state: No “recent” immunity states |
L20b | 3, 7, 14, 21, 28, 35, 42, 49, and 56 | Yes | A, B, H, J, K, N, P Abbink (2005)(89) provides excretion data stratified by rapidity of Ab response, Buisman (2008)(95) by pre-challenge plasma IgA for a subsample of subjects |
| 3 US cities Abraham (1993)(56) and Ogra (1991)(58) |
tOPV1 (5.4-6.4); tOPV2 (4.5-5.5); tOPV3 (5.2-6.2) | Children with no prior vaccination [2 months] (13b); children with 1 or 2 prior eIPV [12 months] (26b); children with ≥ 3 prior eIPV [24 months] (26b); children with 1 prior tOPV [4 months] (6b); children with ≥ 2 prior tOPV [12-24 months] (6b) Immunity states: FS, LPV1, LPV2, IPV1, IPV2, IPV3 |
HEp-2, primaVry rhesus MK, W1-38 | 1-10, 11-30, 31-60 | No | C, D, F, G, O (1 or 2 IPV arm only), P Study reporting rates of both revertant and total poliovirus shedding following challenge |
| Guatemala Asturias (2007)(61) |
tOPV (NRc) | Children with 1 prior tOPV [4 months] (51); children with 2 prior eIPV [7 months] (36); unvaccinated children and children with 2 prior tOPV [2-7 months] (excretion rates NR) Immunity states: LPV1, IPV2 |
Multiplex RT-PCR | 30 or 60 days depending on arm | No (but copy numbers reported) | B, E, F, G, H, K, P, T, V |
| USA (Minnesota) Barr (1959)(131) |
Cox attenuated strains PV1 (4.8-4.9); PV2 (5); PV2 (5.3) | Families with varying WPV and IPV histories Immunity states: Cannot be determined for reported excretion results |
HeLa | NR | No | A, B, G, H, L, M, K, O, P, V Stool samples taken but only used to verify spread of OPV virus and therefore excretion after challenge not reported in detail |
| UK Beale (1965)(132) |
tOPV1 (5.7); tOPV2 (5.0); tOPV3 (5.5) | Children with 3 prior IPV before 12 months of age [4-5 years] (21 capsule + 25 liquid) Immunity states: No “recent” immunity states |
NR | Twice weekly for 3-4 weeks | No | B, D, F, J, M, N, P, V |
| Mexico Benyesh-Melnick (1959)(126) |
mOPV1 (NR); mOPV2 (NR); mOPV3(NR); | Youngest child in 81 families [0-12] (81) Immunity states: Cannot be determined for reported excretion results |
MK | 0, 7, 14, 21 | No | A, J, O, P (except for contacts), S (for serology), T Includes excretion results family and community contacts |
| USA (Texas) Benyesh-Melnick (1967)(19) |
mOPV1,2,3 (5.5); tOPV1,2,3 (5.5) | Children with 0, 1, 2, or ≥ 3 prior IPV challenged with mOPV1,2, or 3, or tOPV [2-18 months] (354) and siblings (not challenged) Immunity states: Cannot be determined for reported excretion results |
Primary rhesus MK | 0, 7, 14, 21, 28, 35 | No | A, B, F (in some arms), G, I, M, O, P(except for contacts), V Excretion data lumped over exposure histories given that “prior Salk vaccination clearly had no effect on virus excretion in any of the groups” (p. 114); Excretion among family and community contacts, reversion, and neurovirulence also studied |
| USA (Tennessee) Cohen-Abbo (1995)(70) |
tOPV1 (6.5 after storage) other types NRd | Children with 0 prior tOPV [2 months] (84); children with 1 prior tOPV [3-4 months] (62); children with 2 prior tOPV [4-6 months] (68) Immunity states: FS, LPV1, LPV2 |
HEp-2 and RD | 30 | No | E, F, G, H, P, Q (PV1 and PV3 after 1st dose) |
| Cuba Cuba IPV Study Group (2007)(62) |
tOPV1 (≥6); tOPV2 (≥5); tOPV3 (≥5.8) | Children with 3 prior eIPV [4-8 months] (52); polio-unvaccinated children [4-8 months] (54); children with 2 prior eIPV [4-8 months] (72) Immunity states: FS, IPV2, IPV3 |
RD and L20b | 0, 7 | Yes | F, G, H, P Lack of exposure to OPV viruses due to complete absence of OPV use between campaign confirmed by lack of isolated virus before the challenge |
| UK Dane (1961)(123) |
mOPV2 (4.4); | Siblings with unreported vaccination history [1-3 years] (2) Immunity states: Cannot be determined for reported excretion results |
Second-passage MK and HeLa | 1-14, 21, 28 | Yes | A, B, D, G, K, O, P, R, V Study also fed first human passage mOPV2 virus to 27 children 5-17 months of age |
| UK Dick (1961)(41) |
mOPV2 (5.6); mOPV1 (6) | Children with 2 prior IPV fed mOPV2 2 weeks after last IPV dose [5-15 months] (16); children with history of IPV fed mOPV2 [6-17 months] (16); children with 3 prior high-potency IPV fed mOPV1 [6-18 months] (7); children with 2 prior IPV fed mOPV1 [6-18 months] (3); unvaccinated children fed mOPV1 [6-18 months] (9) Immunity states: FS, IPV2, IPV3 |
Second-passage MK and HeLa | 0, 1, 2, …, 21, and 28, 35 in some arms | Yes | A, D, K, G (some results), M, O (some arms), P, Q (some results), V Virus isolation from throat over time also reported |
| Hungary Dömök (1961)(133, 134) |
tOPV (5 for each type) | Children fed tOPV twice during campaigns [3 months to 15 years] (160) Immunity states: Cannot be determined for reported excretion results |
MK and suckling mice | 0, 3, 5, 12, 22, 24 | No | A, B, C, F, G, I, J, M, O, P Most children had 3 or 4 prior IPV doses and/or history of WPV exposure during outbreaks |
| China Dong (1986)(50) |
tOPV1 (6); tOPV2 (5); tOPV3 (5.5) | Unvaccinated children [3 days] (107); unvaccinated children [60 days] (109); children with 1 prior tOPV at birth [60 days] (108) Immunity states: MI, FS, LPV1 |
“Methods recommended by WHO” (p. 854) | 7, 14, 21, 25, 30, 32, and/or 57, depending on arm | No | F, G (for second challenge), H, P, V unknown Excretion after first challenge broken down by cord blood maternal Ab levels |
| Former Soviet Union (Estonia) Drosdov (1960)(84) |
mOPV1 (~5); mOPV2 (~5); mOPV3 (~5) | Seronegative children with or without prior IPV [< 3 years] (33 PV1-; 10 PV2-; 22 PV3-seronegative); Seropositive children with or without prior IPV (13 PV1-; 9 PV2-; 12 PV3-seronegative) Immunity states: FS |
Rhesus MK | 0, twice weekly for 5-7 weeks | Yes | A, B, D, K, M, O (for seropositives), P (except for contacts), V Includes excretion results among institutional contacts |
| Egypt El-Sayed (2008)(51) and van der Sanden (2009)(83) |
mOPV1 (6.7) tOPV1 (6.6); tOPV2 (5.4); tOPV3 (6.1) | Children fed mOPV1 at birth [0 days] (231); children fed tOPV at birth [0 days] (190); children with 1 prior mOPV1 at birth fed mOPV1 [30 days] (228); children with 1 prior tOPV at birth fed mOPV1 [30 days] (188) Immunity states: MI, LPV1 |
L20b | 30 after birth challenge; 7, 14, 21, 28 after 30-day challenge | No | B, E (for birth challenge), F (tOPV arms only); G, H (for birth challenge) P, Q |
| USA Faden (1990)(60) |
tOPV1 (5.5-6.4); tOPV2 (4.5-5.5); tOPV3 (5.2-6.2) | Unvaccinated children [2 months] (24); children with 1 prior tOPV [4 month] (21); children with 1 prior eIPV [4 months] (21); children with 2 prior tOPV [12 months] (23); children with 1 prior eIPV then 1 tOPV [12 months] (21); children with 2 prior eIPV [12 months] (20) Immunity states: FS, LPV1, ≥ 2LPV, IPV1, IPV2, IPV+LPV |
HEp-2 and primary rhesus MK | 1 or 2 months | No | D, E, F, G, H, K, P, V “Poliovirus […] recovered only once from 560 NSP [nasopharyngeal] samples” (p. 1295) |
| USA (Louisiana) Gelfand (1959)(46, 47) |
mOPV1 (3.6-7.3); mOPV2 (5.1-7.1); mOPV3 (3.6-7.1) | Children with 3 prior IPV [1-8 years] (55); adults without natural infection in previous 4 years of observation [NR] (11, including 1 refed twice with higher dose after failure to become infected); naturally immunes [NR] (8) Immunity states: Mixture of “recent” and “historic” immunity states |
Rhesus MK | Variable | No | B, D, G, M, N, P, Q, V unknown Results include pharyngeal excretion, stratification by challenge dose; excretion among intra- and extrafamilial contacts; virus isolation from fomites |
| Former Soviet Union Ghendon (1961)(24) |
mOPV1 (6); mOPV2 (5 or 6) and mOPV3 (NR) in some experiments | Triple seronegative children [1-3 years] (30); triple seropositive children [1-3 years] (32); children recovered from paralytic polio [7-15 years] (12); adults recovered from paralytic polio [NR] (6); healthy children with PVI excretion history [1-3 years] (19); children seroconverted after 2 prior IPV [1-3 years] (31); children seroconverted after 1 prior mOPV1 [1-3 years] (33) Immunity states: FS, LPV1, LPV2, IPV2 |
MK | 2, 4, 6, …, 28 | Yes (as average over time) | K, M, P, V Only estimated mean durations of excretion reported, not excretion rates over time |
| Former Soviet Union (Latvia) Ginter (1961)(88) |
mOPV1 (NR); mOPV2 (NR); mOPV3 (NR) | Presumably previously unvaccinated young children [age NR] (102) Immunity states: FS |
Monolayer fibroblasts of human embryonic tissue | 0, 3, 7, 14, 28, 45 | Yes | A, G, H, K, P, S (for serology), T Possible to establish “recent” immunity state only for titer results; includes excretion results among institutional contacts |
| USA (Missouri) Glezen (1966)(39) |
mOPV1 (5.5) | Children with 0-3 prior IPV [6-9 years] (30); children with 4 prior IPV [6-9 years] (29); children with 5-6 prior IPV [6-9 years] (33) Immunity states: Cannot be determined for reported excretion results |
Rhesus MK | 0, 3, 7, 14, 21, 28 | Yes | A, B, K, M, O, P, V Relationship pre-vaccine Ab titer and excretion rates clearly documented; pharyngeal excretion also reported |
| USA (Missouri) Glezen (1969)(42) |
tOPV1 (6.5); tOPV2 (5.0); tOPV3 (5.3) | Children with recorded history of IPV vaccination and no OPV vaccination [6-9 years] (193); children with recorded history of IPV vaccination and 1 prior challenge with OPV [6-9 years] (180) Immunity states: Cannot be determined for reported excretion results except recent IPV+LPV for refed arm |
Rhesus MK | 0, 4, 11, 18, 25, 39 (or 32 after 2nd challenge) | Yes | A, B, F, K, M, O, P, V Relationship pre-vaccine Ab titer and excretion rates clearly documented; pharyngeal excretion also reported |
| UK Goffe (1961)(101) |
mOPV1 (5e); mOPV2 (5e); mOPV3 (5e) | Adults with IPV history challenged with mOPV1, then mOPV2, then mOPV3 [21-56 years] (21); adults with no IPV history challenged with mOPV1, then mOPV2, then mOPV3 [21-56 years] (14) Immunity states: Cannot be determined for reported excretion results |
MK | Twice weekly for 3-4 weeks | No | A, B, G, J, M, N, O, P, V Excretion data not broken down by exposure history or Ab status |
| India Grassly (2009)(135) |
tOPV (NR); mOPV1 (NR); mOPV3 (NR) | Acute flaccid paralysis cases challenged during campaigns [0-15 years] (8,499 with tOPV; 8,499 with mOPV1 (17,031); 1,809 mOPV3) Immunity states: Cannot be determined for reported excretion results |
NR | 2 samples between 4 and 28 days | No | A, B, C, F (in one arm), J, O, P, R Challenge history determined retrospectively |
| UK Henry (1966)(25) |
mOPV1 (1.7,2.7,…,5.7) | Children with 3 prior IPV [6 months] (49); polio-unvaccinated children [6 months] (48); children with 3 prior primary IPV and a booster IPV [16 months] (43); children with 3 prior tOPV (50) Immunity states: FS, IPV3, LPV2 |
Secondary MK and HeLa or HEp-2, and unweaned mice | 0, twice weekly for 3 weeks | Yes | G, M, P, V unknown, W Results also stratified by challenge dose; children with evidence of natural infection observed between 2 months of age and challenge excluded from excretion results |
| USA (Conn.) Horstmann (1959)(74) |
mOPV1 (2.4, 3.4, 5.4, 7.4) | Children and young adults with at least 2 prior IPV [4-24 years] (10, incl. 6 subsequently fed mOPV1 again); naturally immune children and young adults [4-24 years] (9, incl. 5 subsequently fed mOPV1 again); IPV-vaccinated, naturally immune, and previously challenged children and young adults fed different mOPV1 doses [4-24 years] (25 total) Immunity states: LPV2, IPV+LPV |
Trypsinized MK | Variable for 56 to 70 days | Yes | A, B, D, G, K, M, N (some arms), O, P (except for contacts), U, V Positive throat swabs in 6 of 7 infected children given vaccine in liquid form but in none of the 3 infected children given vaccine in capsule form; includes excretion results from institutional contacts |
| USA (Arizona) Horstmann (1959b)(118) |
mOPV1 (5) | Preschool children with 2 prior IPV [1-4 years] (5); preschool child with 3 prior IPV [4 years] (1) Immunity states: IPV2, IPV3, IPV+LPV |
Rhesus MK | 0, twice weekly for 3 weeks, weekly for 3 weeks | No | A, B, D, J, M, P, T, U unknown, V Includes excretion results from family and community contacts and virus isolations from privies and flies |
| USA Horstmann (Conn.) (1961)(85) |
mOPV1 (5); mOPV2 (5); mOPV3 (5); bOPV2 (5); bOPV3 (5); tOPV1 (6); tOPV2 (6); tOPV3 (6) | Triple seronegative children with 1-4 prior IPV doses [0.5-5 years] (20 fed mOPV1,3,2; 27 fed mOPV1, bOPV, 29 fed tOPV twice); seropositive children with 1-4 prior IPV doses [0.5-5yearsl (76 total) Immunity states: FS, IPV1, IPV2, IPV3, IPV+LPV |
MK and HEp-2 | 0, weekly for 6-14 weeks | No | A, F (some arms), H, K, M, P, T, U, V unknown, W |
| Romania Ion-Nedelcu (1997)(63) |
tOPV (NR) | Unvaccinated children [2-5 months] (67); children with 2 prior eIPV [infants] (78) Immunity states: FS, IPV2 |
Vero | 2, 4, 7, 14, 21, 28, 60 | No | A, C, F, H, K, P Study arms from urban (unvaccinated) vs. rural (IPV vaccinated) settings; fluctuating excretion rates through day 60 |
| India (Tamil Nadu) John (1975)(136–138) |
tOPV1 (6.0); tOPV2 (5.0); tOPV3 (5.5) | Unvaccinated children challenged twice 8 weeks apart [3 months to 5 years] (191) Immunity states: FS |
Primary bonnet MK and HeLa, suckling mice | 0, 7, 14 | No | F, K, P, V Excretion results reported for children with selected pre-challenge status (e.g., triple seronegative, homotypic seronegatve) |
| India John (2011)(87) |
mOPV1 (>6); tOPV1 (6); tOPV2 (5); tOPV3 (5.8) | Unvaccinated newborns fed mOPV1 twice [0, 30 days] (360 at birth, 358 at 30 days); unvaccinated newborns fed tOPV twice [0, 30 days] (179 at birth, 177 at 30 days); Immunity states: MI, LPV1 |
L20b | 30 (after birth dose); 7 (after 2nd dose) | No | B, E (after birth dose), F (tOPV arm), G, H, J, P, Q |
| USA (New York) Kogon (1965)(109) |
mOPV1 (5.5); bOPV2 (5); bOPV3 (5.7) | Family members with < 3 prior IPV [all ages] (37); family members with ≥ 3 prior IPV [all ages] (200) Immunity states: No “recent” immunity states | Primary rhesus MK cell culture | 0, 7 after 1st dose; 7, 14, 21, …, 56 after 2nd dose | No | A, B, F (for PV2 and PV3 results), K, M, N, O (< 3 prior IPV arm), P, R, U, W Proportions excreting over time not reported, but only cumulative proportions excreting |
| Kenya Kok (1992)(45) |
mOPV1 (3.5-3.8); tOPV1 (5); tOPV2 (5.5); tOPV3 (5.5) | Unvaccinated children fed tOPV [2-3 months] (60); children with one prior tOPV fed tOPV [4-5 months] (60); children with 2 prior tOPV fed tOPV [6-7 months] (60); children with 3 prior tOPV fed mOPV1 [8-9 months] (60); children with 2 prior eIPV fed mOPV1 [8-9 months] (41); children with 3 prior eIPV fed mOPV1 [8-9 months] (43); unvaccinated children fed mOPV1 [2-4 months] (24) Immunity states: FS, LPV2, IPV2, IPV3 |
“Published methods” (p. 95) | 0, 7, 14, 21, 28 days after mOPV, 1-3 months after tOPV | No | E (following tOPV only), F (following tOPV only), G, H, K, P, V WPV of all 3 types also isolated; “no poliovirus was obtained from nasopharyngeal washings’ (p. 97) |
| Former Soviet Union (Greater Moscow) Koroleva (1960)(139) and Zhevandrova (1960)(140) |
tOPV(NR) | Children with mixed exposure histories [0-7] (255) Immunity states: FS, LPV1, LPV2 | Trysinized MK | 5-9 samples during 2-3 months following contact | No | NA (no excretion measured for challenged subjects, only contacts) Includes excretion results among institutional contacts |
| Former Czechoslowakia Kucharskaá (1985)(86) |
mOPV1 (5e); bOPV1 (5.3e); bOPV3 (5.3e) | Unvaccinated infants [age NR] (36); infants with history of 1 mOPV1 and 1 bOPV23 1 year prior to challenge [age NR] (6) Immunity states: FS, LPV1 |
NR | 0, weekly for 7-9 weeks | Yes | C, D (revaccinated arm), F (bOPV arm), K, P, R |
| USA (Missouri and Maryland) Laassri (2005)(64) |
tOPV (NRd) | Unvaccinated children [2 month] (48); children with 2 prior tOPV [6 months] (42); children with 2 prior eIPV [6 months] (42) Immunity states: FS, LPV2, IPV2 |
Full-length PCR amplification | 7, 21 | No (but copy numbers reported) | C, F, H, K, P |
| Israel Levine (1961)(141) |
tOPV1 (5.7); tOPV2 (4.2); tOPV3 (6.2) | Unvaccinated newborn [3-5 days] (53); newborn with 1 prior tOPV [2 months] (53) Immunity states: MI, LPV1 |
Rhesus MK | 0, 7, 14, 21, 28 | No | B, F, G, K, P, T, U, V unknown |
| Taiwan Lu (2001)(77) |
tOPV (NRf) | Children with 2 prior eIPV then 1 tOPV [18 month] (18) Immunity states: IPV+LPV |
RD, HEp-2, MK-2, Vero | 7, 28 | No | B, F, G, H, K, P |
| Mexico Maldonado (1997)(73) and Buonagurio (1999)(142) |
tOPV1 (6); tOPV2 (5); tOPV3 (5.6) | Unvaccinated children [1.5-6 months] (181); children with 1 prior tOPV [1.5-6 months] (181) Immunity states: FS, LPV1 |
Primary MK, Buffalo green MK, RD, MRC-5 | 0, 7, 21, 35, 56 | No | F, G, I, P, Q |
| France Mallet (1997)(71) |
tOPV (NR) | Children with no prior tOPV [6-8 months], with 1 prior tOPV [7-9 months], and with 2 prior tOPV [8-10 months] (12 each in Vero-grown OPV + 9 each in monkey kidney-grown OPV group) Immunity states: FS, LPV1, LPV2 |
HEp-2 and Vero and type-specific nested PCR | 0, 1, 2, 3, 4, 6, 10, 20, 30, 40, 50, 60 (last 3 only after 3rd dose) | No | D, F, G, H, K, P, U Reversion of excreted viruses measured |
| UK Minor (2005)(57) and Ramsay (1994)(59) |
tOPV1 (6); tOPV2 (5); tOPV3 (5.5) | Unvaccinated children [2 months] (57); children with 1 prior tOPV [3 months] (57); children with 1 prior eIPV [3 months] (51); children with 1 prior eIPV then tOPV [4 months] (51) Immunity states: FS, LPV1, IPV1, IPV+LPV |
Fetal rhesus MK4 | 0,7,14,21,28 | No | C (for 2nd and 3rd challenge), F, G, K, P, Q, U, V unknown Differences in excretion results from 2 laboratories “remain unexplained” (p. 157) |
| USA (Maryland) Modlin (1997)(65) |
tOPV1 (6.5); tOPV2 (5.4); tOPV3 (6.3) | Children with 2 prior eIPV then 1 tOPV (79); children with 2 prior eIPV then 2 tOPV (80); children with 1 prior eIPV, then eIPV and tOPV, then 2 more tOPV (70); children with 3 prior eIPV [74]; children with 3 prior tOPV (73) [challenged at 18 months in each arm] Immunity states: LPV2, IPV2, IPV+LPV |
Vero | 0,3,7,21 | No | B, F, G, K, P, U, V unknown “Eleven subjects who excreted polioviruses on day 0 are excluded [from excretion results]” (p. S232) |
| Oman Mohammed (2010)(67) |
mOPV1 (6) | Children with 3 prior eIPV [7 months] (157); children with 3 prior fractional IPV [7 months] (155) Immunity states: IPV3 | “According to WHO guidelines” (p. 2353) | 0, 7 | No | B, G, H, K, P, Q (for fractional IPV arm) Excretion results significantly different for fractional IPV dose arm compared to full eIPV arm; 100% cumulative seroconversion in full IPV arm |
| Japan Nishio (1984)(100) |
tOPV (5.5 for each type) | Children with diverse history of at least 1 primary tOPV or bOPV(1+2) between 2 and 9 years before challenge [3-10 years] (32) Immunity states: No “recent” immunity states |
HeLa and primary MK | 3, 8, 23, 80, 170 (last 2 only for positives) | No | B, D, F, J, N, P, R, V Excretion results reported in tabulated form by child and serotype, with pre-challenge titers and time since primary vaccination |
| USA (Maryland) Onorato (1991)(26) and Modlin (1991)(66) |
mOPV1 (5.7-5.8 or 2.7-2.9) | Children with 3 prior tOPV [~ 2 years] (79); children with 3 prior eIPV [~ 2 years] (93) Immunity states: IPV3, LPV2 |
Vero | 0, 1, 3, 7, 14, 21, 42 | Yes | Ag, B, G (but all subjects seropositive at time of challenge), K, P, V Pharyngeal excretion also reported |
| Sweden Pagano (1964)(107) |
CHAT(5.2) | Children with 3 prior IPV [8-13 years] (123h) Immunity states: No “recent” immunity states | Primary MK | Weekly for 9 weeks | No | A, B, K, L, M, N, P, U (but tabulated also at 1:10), V unknown Pre/post challenge in unchallenged control group suggest no spread of challenge virus |
| Pakistan Parent du Châtelet (2003)(75) |
mOPV3(≥5.8) | Children with 4 prior tOPV (233); children with 4 prior tOPV and 3 prior eIPV (209); children with 4 prior tOPV doses and 1 prior eIPV dose (213) [challenged at 24 weeks in each arm] Immunity states: FS (seronegatives in each arm), LPV2, IPV+LPV |
HEp-2 and L20B | 0, 7, 14, 21, 28 | No | K, P, V “Two NIDs against polio were conducted during the data collection period” (p. 1712); ”Two children who completed the challenge were excluded from this analysis because both pre-challenge and post-challenge stools yielded type 3 poliovirus” (p. 1714) |
| UK PHLS (1965)(68) |
mOPV1(4.7) | Children with 3 prior IPV (51 (combination) + 18 (standalone)); children with 3 prior tOPV (53); unvaccinated children receiving only non-polio vaccines (23) [challenged at 12-30 months in each arm] Immunity states: FS, IPV3, LPV2 |
MK and HeLa, suckling mice | 0, then twice weekly for 6 weeks | No | C, K, M, P Only estimated mean durations of excretion reported, not excretion rates over time |
| Finland Piirainen (1999)(69) and Valtanen (2000)(82) |
mOPV3(5.7) | Children with 3 prior regular eIPV [17.5-19 months] (45); 3 prior modified trypsin-inactivated IPV [17.5-19 months] (41) Immunity states: IPV3 |
L20B and green MK | 0, 2, 5, 8, 12, 16, 21, 28, 35, 42 | Yes | B, G, P Only virus isolation from L20B cells reported |
| USA (New Jersey) Plotkin (1959)(55) |
CHAT (3.7-7.5), Wistar (4.7-6.7), Jackson (4-6), P-712 (5.2-7.2), Fox (1.5-6.5) | Newborns with maternal Ab [0-137 days] (total 58); newborns without maternal Ab [6-220 days] (total 44) Immunity states: FS, MI |
HeLa and MK | Twice weekly for 4 or more weeks | No | D (type 2 arm w/o Jackson), L, K, P, V |
| USA Plotkin (1960)(43) |
Various schedules and doses with CHAT, P712, W-Fox | Newborns Immunity states: FS, MI |
NR | Variable | No | K, L, P, V Age at first vaccination, challenge dosage, and serotype sequence varied; influence of virus dosage on pharyngeal excretions also examined. |
| USA (New Jersey) Plotkin (1960b)(113) |
CHAT (5.7); P-712 (5.2); W-Fox (5.2) | Unvaccinated seronegative children [1-5 months] (6); children with 2 prior IPV [6-15 months] (12); children with 1 prior mOPV of each type [5-9 months] (6); children with 2 prior IPV and 1 prior mOPV of each type [10-19 months] (12) Immunity states: FS, IPV2, LPV1, IPV+LPV |
MK | Twice weekly | Yes | A, D, G (for duration of excretion results), J, L, M, O (for duration of excretion results), P (except for contacts), Q, U, V Oropharyngeal excretion also reported; includes excretion results among family contacts |
| Costa Rica Roca-Garcia (1964)(143) |
tOPV (NR) | Unvaccinated children [0-13] (407); unvaccinated contacts of tOPV recipients [0-13] (385); children with 1 prior tOPV [0-13] (407) Immunity states: FS, LPV1 |
MK | 0, 2-3 weeks, 10-11 weeks | No | E, F, I (WPV3 in some age groups, OPV in contact arm), P (except for contacts), T, V unknown Includes excretion results among community contacts |
| Mexico Sabin (1960)(144) |
tOPV1,2,3 (5.2-5.6) | Unvaccinated children reached during campaign [7 months – 10 years] (274) Immunity states: Cannot be determined for reported excretion results |
MK, HEp-2, newborn mice | 0, 1, 2, 3, 4, 6, 8, 12 | No | B, F, G, H, I, O, K, P, T, V Study designed to measure community effect of OPV campaigns |
| USA (Ohio) Sabin (1961)(127) |
mOPV1 (5.3e); mOPV3 (5.5e); mOPV2 (5e) | Children and adults with various numbers of prior IPV fed mOPV1, then mOPV3, then mOPV2 during successive campaign rounds at 1-month intervals [3 months-48 years] (587) Immunity states: Cannot be determined for reported excretion results |
Rhesus MK and HEp-2 | 1 month after 3rd mOPV dose | No | A, B, E, G, H, K, M, O, P, T, V Study designed to measure community effect of OPV campaigns |
| USA Sabin (1963)(52) |
mOPV1 (5.9) | Children with 1-3 prior IPV and no OPV history (6); children with 1-3 prior IPV and no evidence of response to mOPV1 at birth (10); children with 0-3 prior IPV and evidence of response to mOPV1 at birth (11) [challenged at 6 months in all arms] Immunity states: IPV1, IPV2, IPV3, IPV+LPV, LPV1 | MK and Hep-2 | 0, 3, 5, 7, 10, 15, 20, 30, 35 | Yes | B, D, K, M, P, U, V Results fully tabulated by child, including IPV doses, Ab status, and virus titers by day of collection; serological response to subsequent IPV also examined. |
| Belarus Samoilovich (2003)(72) |
tOPV1 (6); tOPV2 (5); tOPV3 (5.5) | Unvaccinated children [2-22 months] (28); children with 1 prior tOPV [4-24 months] (32); children with 2 prior tOPV [6-26 months] (31) Immunity states: FS, LPV1, LPV2 |
RD and Hep2, then L20B | Weekly for 9 weeks (incl. day 0) after each dose | No | F, G, H, I, P |
| Germany Siegert (1963)(44) |
mOPV1 (5.5) | Individuals with no prior IPV [6 months-59 years] (total 66); individuals with 2 or 3 prior IPV [6 months-59 years] (22); paralytic polio patients with onset 8 months prior to study [19-36 years] (7) Immunity states: Cannot be determined for reported excretion results | Primary MK cells | 0, 2, 4, 6, 14, 24, 28, 41 | Yes | A, B, D, K, M, N, O, P (except for contacts), U, V Oropharyngeal excretion also reported; Includes oropharyngeal and fecal excretion results among institutional contacts |
| UK Smith (1976)(102) |
tOPV1 (6); tOPV2 (5); tOPV3 (5.5) | Young adults with last IPV 4-6 years before challenge (36); young adults with last OPV ≥ 12 years before challenge (45); young adults with unconfirmed vaccination history (84) [challenged at 16-18 years in all arms] Immunity states: No “recent” immunity states |
Secondary MK cells | Weekly for 3 weeks | No | A, B, F, K, M, N, O, P, V Relationship pre-vaccine Ab titer and excretion rates clearly documented |
| Former Soviet Union (St. Petersburg) Smorodintsev (1959)(112) |
mOPV1 (5); mOPV2 (5); mOPV3 (5); | Unvaccinated children [0.5-3 years] (fed mOPV1,2,3 or only mOPV1) Immunity states: Cannot be determined for reported excretion results |
MK and human embryo fibroblasts | 1, 4, then weekly for 9-10 weeks | Yes | B, G, H, K, P (except for contacts), U, V Includes excretion results among institutional contacts; Includes separate trials with different dosages and tOPV |
| Oman Sutter (2000)(76) |
mOPV3 (6.1) | Children with 6 prior tOPV (198+177)i,j; children with 5 prior tOPV then 1 eIPV (205)j; children with 5 prior tOPV then 1 mOPV3 (205)j [challenged at 15 months in all arms] Immunity states: LPV2, IPV+LPV |
“standard procedures established by the WHO” (p. 768) | 0, 7 | No | B, D unknown, H, K, P “Children who excreted poliovirus just before the challenge were excluded from the post-challenge analysis” (p. 770) |
| India Sutter (2010)(53) |
mOPV1 (≥5.9); mOPV2 (≥5); mOPV3 (≥5.8); bOPVl (≥6); bOPV3 (≥5.8); tOPV1 (≥6); tOPV2 (≥5); tOPV3 (≥5.8) | Unvaccinated children [0 days] (≤ 168 fed mOPV1; ≤ 170 fed mOPV2; ≤ 165 fed mOPV3; ≤ 168 fed tOPV; ≤ 169 fed bOPV); children with 1 prior mOPV1, 2, 3, bOPV, or tOPV fed same vaccine [30 days] (≤ 168 fed mOPV1; ≤ 170 fed mOPV2; ≤ 165 fed mOPV3; ≤ 168 fed tOPV; ≤ 169 fed bOPV) Immunity states: MI, LPV1 |
“According to WHO guidelines” (p. 1685) | 7, 30 (0 for second challenge) | No | B, F (some arms), G, H, K, P, Q |
| Israel Swartz (1972)(54) |
tOPV1 (6); tOPV2 (5); tOPV3 (5.5) | Children with 1 prior tOPV [2 months] (226); children with 2 prior tOPV [3.5 month] (226); children with 3 prior tOPV [5 months] (226) Immunity states: FS, LPV1, LPV2 |
African green MK | 0, 7 | No | F, G, H, K, P, Q, V Results stratified by social group and summer vs. winter |
| Israel Swartz (2008)(78) |
tOPV1 (6); tOPV2 (5); tOPV3 (5.8) | Children with 3 prior eIPV and 3 tOPV [15-17 months] (75k); children with 2 prior eIPV and 2 tOPV [9-11 months] (82 low SES + 52 middle-high SESk) Immunity states: IPV+LPV | L20B | 0, 7, 14, 21, 28 | Yes | A, B, F, H, K, P (except for contacts), X (for virus titers), V 100% seropositivity before and after challenge; Includes excretion results from family contacts |
| Japan Vaccine Adm. Subcom. (1966)(81) |
mOPV1 (7.4); mOPV2 (7.5); mOPV3 (8.0) | Homotypic seronegative children with or without prior IPV fed mOPV [≤ 5 months - ≥ 11 years] (1226 (PV1) + 325 (PV2) + 1202 (PV3))k;homotypic seropositive children with or without prior IPV fed mOPV [≤ 5 months - ≥ 11 years] (392 (PV1) + 185 (PV2) + 269 (PV3))k Immunity states: FS (seronegative young children); cannot be determined for older children |
Cynomolgus MK | 0, 7, 14, 21, 28, 35, 42, 49, 56 | No | A, H, K, M, O (except young children), P, U, V Excretion among family and nursery contacts also studied |
| Netherlands Verlinde (1959)(108) |
mOPV1 (5-6); mOPV3 (5-6); mOPV2 (5-6) | Homotypic seronegative unvaccinated children and adults [all ages] (128); homotypic seropositive mostly unvaccinated children and adults [all ages] (96 unvaccinated + 2 with 2 prior IPV) Immunity states: Cannot be determined for reported excretion results |
NR | 0, 7, 14, 21, 28, 35, 42 and beyond | Yes | B, D, K, M (only 2 subjects), O, P, V unknown Neurovirulence of excreted viruses also reported |
| Gambia, Oman, and Thailand WHO (1996)(20) and WHO (1997)(22) |
mOPV1 (6) | Children with 4 prior tOPV; children with 4 prior tOPV and 3 prior eIPV; children with 3 prior eIPV; [challenged at 24 weeks in all arms](only total children in all arms reported for Gambia(334), Oman(562), and Thailand (398)) Immunity states: LPV2, IPV3, IPV+LPV |
HEp-2 cells | 0, 7 | No | B, G, H, J (Oman), K (Gambia and Thailand), P, Q, T (Thailand) Study also reports effect of secondary exposure to mass campaigns in Oman on serology at 6 and 10 weeks of age |
Acronyms (excluding cell lines): Ab = antibody; bOPV = bivalent oral poliovirus vaccine; CID50 = cell- or tissue-culture infectious doses; eIPV = enhanced-potency inactivated poliovirus vaccine; FS = fully susceptible; IgA = immuno-globulin A; IPV = inactivated poliovirus vaccine; IPV1= 1 successful IPV dose; IPV2= 2 successful IPV doses (immunity state); IPV3= ≥ 3 successful IPV doses; IPV+LPV = ≥ 1 successful IPV and ≥ 1 LPV infections; LPV = live poliovirus; LPV1 = 1 LPV infection; LPV2 = ≥ 2 LPV infections; MI = maternally immune; MK = monkey kidney; mOPV(1,2,3) = monovalent oral poliovirus vaccine (type 1, 2, 3, respectively); NID = national immunization day; NR = not reported OPV = oral poliovirus vaccine; pfu = plaque-forming unit; SES = socio-economic status; tOPV = trivalent oral poliovirus vaccine; UK = United Kingdom; USA = United States of America; WHO = World Health Organization
Notes:
Unless noted otherwise. 0 indicates pre-challenge sample
Sample size not explicitly reported but assumed equal to highest number of children tested over time in Table 1, p. 1108
OPV from Sanofi-Pasteur used
Orimune from Wyeth-Lederle used
In log pfu
OPV from Pasteur Merieux used
However, assignment to low-dose vs. high-dose challenge group was random
Excretion results include 1 child with only 2 prior IPV doses
Includes groups receiving last tOPV dose from a USA (n=198) and a European (n=177) manufacturer
Number of included in excretion results not reported, numbers in table reflect children in each arm tested for seroprevalence
Study does not report cumulative number of children tested over the sampling interval, numbers in table reflect maximum numbers tested at any sampling point
The OPV challenge studies in Table 2 form the basis for quantifying the susceptibility, duration, and concentration of virus excreted, and waning of immunity; although we supplement our assessments using other types of data as well. Some OPV challenge studies report different types of antibody responses to the challenge in addition to measuring virus excretion, which we in some cases consider as complimentary information on topics for which data gaps from OPV challenge studies alone exist (e.g waning of immunity).
Immunity to poliovirus transmission depends first on the susceptibility to poliovirus infection, which we review in the next subsection. The following subsections review the duration and concentration of excreted virus, both in feces and from the oropharynx, which together determine the total virus output and infectivity of infected individuals. Probability, duration, and concentration of virus excretion combined allow characterization of the recent immunity states. We then review data on waning of host immunity to poliovirus transmission needed to characterize the increase in susceptibility and total virus output as a function of time since entering a recent immunity state. The last subsection reviews data on factors that might affect susceptibility, excretion, and transmission, including the relationship between pre-existing antibody levels and excretion, serotype differences, the role of the anamnestic response, minimum infectious doses, the relative importance of fecal-oral versus oropharyngeal transmission in different settings, the relationship between virus excretion and the probability of infecting others, and the differences in transmissibility between OPV and WPV.
Susceptibility to poliovirus excretion
Definitions and criteria
We review the data on the extent to which different immunity states reduce the probability of poliovirus excretion. We define relative susceptibility (to poliovirus excretion) for a given immunity state as the probability of infection (i.e., replication of virus in the host) for an individual in the immunity state, divided by the probability of infection for fully susceptibles given identical exposure. Both fecal and oropharyngeal excretion may occur after exposure and may contribute to poliovirus transmission).(14, 27, 39, 40) Available data from the set of OPV challenge studies suggest occasional oropharyngeal excretion among susceptibles or seronegatives (range 0-87% among 5 studies),(39, 41–44) and rare oropharyngeal excretion among seropositive subjects with any history of LPV infections or successful IPV doses (range 0-18% among 6 studies),(26, 39, 41, 42, 44–47) unless measured after unusually high challenge doses of 107 CID50 or more (i.e., up to 67%).(46, 47) It remains unclear from these studies whether oropharyngeal excretion can occur in the absence of fecal excretion, but data from studies on WPV and OPV spread suggest that it remains rare at best.(48, 49) Given the limited data and generally low rates of oropharyngeal excretion compared to fecal excretion (see below), we focus on fecal excretion results as the most appropriate information to determine susceptibility to poliovirus excretion.
For this analysis, we exclude studies that do not report results for a plausible susceptible control arm (limitation B) required by the definition of relative susceptibility, include fewer than 10 subjects in relevant study arms (limitation D), provide no information about “recent” immunity states (limitation N), or provide only results lumped across exposure histories (limitation O). Table 3 provides the evidence grading and Table 4 summarizes the results from the included studies. Table A1 provides details about the assignment of study arms to immunity states and our estimation of the probability of infection from the data.
Table 3.
Grading table of the evidence for the relative susceptibility to poliovirus excretion from OPV challenge studies.
| Recent immunity state | Number of included studies(refs) a | Design | Relevance | Quality | Consistency | Overall grade |
|---|---|---|---|---|---|---|
| Maternally immune | 3(43, 50, 55) | High | Moderate | Moderate | High | Moderate |
| 1 successful IPV dose | 1(57, 59) | Low | Moderate | Moderate | Low | Low |
| 2 successful IPV doses | 5(24, 45, 62–64) | High | Moderate | High | High | Moderate |
| ≥ 3 successful IPV doses | 5(25, 45, 56, 58, 62, 68) | High | Moderate | High | High | Moderate |
| 1 LPV infection | 8(24, 50, 54, 57, 59, 70–73) | High | Moderate | High | High | Moderate |
| ≥ 2 LPV infections | 10(24, 25, 45, 54, 64, 68, 70–72, 75) | High | Moderate | High | High | Moderate |
| ≥ 1 successful IPV dose and ≥ 1 LPV infections | 2(57, 59, 75) | High | Moderate | Moderate | Moderate | Moderate |
Acronyms: IPV = inactivated poliovirus vaccine; LPV = live poliovirus; OPV = oral poliovirus vaccine
Notes:
We excluded studies with limitations B, D (either in arm of given immunity state or fully susceptible control arm), N, and/or O (see Table 1)
Table 4:
Summary of crude relative susceptibility estimates derived from included OPV challenge studies (Table 3), by recent immunity state and serotype.a
| Recent immunity state First author (year)ref |
Poliovirus transmissibility setting | Applicable limitationsb | Excretors/total tested in immunity states | Excretors/total tested in fully susceptible arm | Relative susceptibility estimate | |||||||||
|---|---|---|---|---|---|---|---|---|---|---|---|---|---|---|
| PV1 | PV2 | PV3 | Any PV | PV1 | PV2 | PV3 | Any PV | PV1 | PV2 | PV3 | Any PV | |||
| Maternally immune | ||||||||||||||
| Dong (1986)(50) | Medium | FHPv | 12/22 | 39/66 | 39/55 | 77/125 | 39/55 | 64/75 | 0.89 | 0.83 | 0.83 | |||
| Plotkin (1959)(55) | Low | LKPV | 26/31 | 15/21 | 13/15 | 13/13 | 0.97 | 0.71 | ||||||
| Plotkin (1960)(43) | Low | KLPV | 45/55 | 40/48 | 0.98 | |||||||||
| 1 successful IPV dose | ||||||||||||||
| Minor (2005)(57) and Ramsay (1994)(59)c | Low | FGKP | 39/51 | 43/51 | 16/51 | 35/57 | 44/57 | 14/57 | > 1 | > 1 | > 1 | |||
| 2 successful IPV doses | ||||||||||||||
| Cuba IPV Study Group (2007)(62) | Medium | FGHP | 13/72 | 67/72 | 10/72 | 9/54 | 48/54 | 3/54 | > 1 | > 1 | > 1 | |||
| Ghendon (1961)(24) | Medium | KMPV | 23/31 | 24/30 | 0.93 | |||||||||
| Ion-Nedelcu (1997)(63) | Medium | ACFHKP | 62/78 | 62/78 | 61/78 | 66/67 | 59/67 | 52/67 | 0.81 | 0.90 | 1.0 | |||
| Kok (1992)(45) | High | GHKP | 4/41 | 2/24 | > 1 | |||||||||
| Laassri (2005)(64) | Low | CFHKP | 23/42 | 32/42 | 21/42 | 20/48 | 42/48 | 28/48 | > 1 | 0.87 | 0.86 | |||
| ≥ 3 successful IPV doses | ||||||||||||||
| Abraham (1993)(56) and Ogra (1991)(58) | Low | CFGP | 8/26 | 8/26 | 18/26 | 10/13 | 5/13 | 2/13 | 0.40 | 0.80 | > 1 | |||
| Cuba IPV Study (2007)(62) | Medium | FGHP | 10/52 | 45/52 | 5/52 | 9/54 | 48/54 | 3/54 | > 1 | 0.97 | > 1 | |||
| Henry (1966)(25) | Low | GMP | 70/92 | 40/48 | 0.91 | |||||||||
| Kok (1992)(45) | High | GHKP | 2/43 | 2/24 | 0.56 | |||||||||
| PHLS (1965)(68) | Low | CKMP | 55/69 | 19/23 | 0.96 | |||||||||
| 1 LPV infection | ||||||||||||||
| Cohen-Abbo (1995)(70) | Low | EFGHPQ | 8/62 | 5/62 | 33/62 | 26/84 | 38/84 | 17/84 | 0.42 | 0.18 | > 1 | |||
| Dong (1986)(50) | Medium | FGHP | 17/108 | 14/108 | 49/108 | 77/125 | 39/55 | 64/75 | 0.26 | 0.18 | 0.53 | |||
| Ghendon (1961)(24) | Medium | KPV | 12/33 | 24/30 | 0.45 | |||||||||
| Maldonado (1997)(73) | Medium | FGIPQ | 45/181 | 11/181 | 45/181 | 132/181 | 125/181 | 62/181 | 0.34 | 0.09 | 0.73 | |||
| Mallet (1997)(71) | Low | FGHKP | 7/19 | 10/20 | 8/20 | 17/21 | 19/21 | 8/20 | 0.45 | 0.55 | 1.0 | |||
| Minor (2005)(57) and Ramsay (1994)(59)c | Low | CFKP | 24/57 | 9/57 | 37/57 | 35/57 | 44/57 | 14/57 | 0.69 | 0.20 | > 1 | |||
| Samoilovich (2003)(72)d | Medium | FGHIP | 14/32 | 5/32 | 9/32 | 21/28 | 22/28 | 12/28 | 0.58 | 0.20 | 0.66 | |||
| Swartz (1972)(54) | Medium | FGHKPQ | 93/226 | 27/226 | 84/226 | 105/226 | 174/226 | 94/226 | 0.33 | 0.07 | 0.58 | |||
| ≥ 2 LPV infections | ||||||||||||||
| Cohen-Abbo (1995)(70) | Low | EFGHPQ | 7/68 | 2/68 | 8/68 | 26/84 | 38/84 | 17/84 | 0.33 | 0.07 | 0.58 | |||
| Ghendon (1961)(24) | Medium | KPV | 18/51 | 24/30 | 0.44 | |||||||||
| Henry (1966)(25) | Low | GP | 16/50 | 40/48 | 0.38 | |||||||||
| Kok (1992)(45) | High | GHKP | 2/60 | 2/24 | 0.40 | |||||||||
| Laassri (2005)(64) | Low | CFHKP | 3/41 | 4/41 | 7/41 | 20/48 | 42/48 | 28/48 | 0.18 | 0.11 | 0.29 | |||
| Mallet (1997)(71) | Low | FGHKP | 7/17 | 4/16 | 4/16 | 17/21 | 19/21 | 8/20 | 0.51 | 0.28 | 0.63 | |||
| Parent du Châtelet (2003)(75) | High | KPV | 14/216 | 11/32 | 0.19 | |||||||||
| PHLS (1965)(68) | Low | CKP | 18/53 | 19/23 | 0.41 | |||||||||
| Samoilovich (2003)(72)d | Medium | FGHIP | 13/31 | 3/31 | 10/31 | 21/28 | 22/28 | 12/28 | 0.56 | 0.12 | 0.75 | |||
| Swartz (1972)(54) | Medium | FGHKP | 27/226 | 16/226 | 31/226 | 105/226 | 174/226 | 94/226 | 0.26 | 0.09 | 0.33 | |||
| ≥ 1 successful IPV doses and ≥ 1 LPV infections | ||||||||||||||
| Minor (2005)(57) and Ramsay (1994)(59)c | Low | FGKP | 7/51 | 6/51 | 23/51 | 35/57 | 44/57 | 14/57 | 0.22 | 0.15 | > 1 | |||
| Parent du Châtelet (2003)(75) | High | KPV | 25/407 | 11/32 | 0.18 | |||||||||
Acronyms: IPV = inactivated poliovirus vaccine; LPV = live poliovirus; OPV = oral poliovirus vaccine; PV(1,2,3) = poliovirus type (1, 2, 3, respectively)
Notes:
See Table A1 for details on the assignment of study arms to immunity states
See Table 1 for limitation symbols; “critical” limitations shown in bold font; small “v” indicates our inability to assess the study with respect to limitation V
Numbers based original results (i.e., HPA, not NIBSC) in Table VI of Minor (2005)(57)
Only proportions provided at each sample collection time, denominators reflect numbers of children tested at any time during sampling period and may overestimate number of children tested at collection time of peak excretion
Fully susceptibles and maternally immunes
In Table 4, studies showing estimates for any or all serotypes involve a tOPV challenge, while studies that provide estimates for only a single serotype involve an mOPV challenge. By definition the relative susceptibility equals 1 for fully susceptibles, because they represent the comparator group. Only 7(43, 50–55) of 66 OPV challenge studies in Table 2 include a maternally immune arm, and only 3(43, 50, 55) of those studies meet the inclusion criteria. Despite the small number of studies, at least one has no limitations with respect to design(55) and no apparent inconsistencies exist, leading to high grades for those two attributes. With moderate grades for relevance and quality due to the ubiquitous limitations of a non-natural exposure route and common laboratory issues, this leads to a moderate overall grade for maternally immunes (Table 3). The estimates of relative susceptibility for maternally immunes result from comparing subjects challenged soon after birth with at least 16(50) or 8(43, 55) reciprocal maternal antibody titers to subjects with lower maternal antibody levels. We find relative susceptibility estimates near 1 for all 3 studies.
1 successful IPV, 2 successful IPV, and 3 or more successful IPV
Only 4(52, 56–60) of 66 OPV challenge studies in Table 2 include an arm of single IPV dose recipients, and only 1(57, 59) of those studies meets the inclusion criteria. The results suggest no effect of the first IPV dose on susceptibility given that excretion occurred less frequently among previously unvaccinated subjects for all 3 serotypes than among recipients of a single IPV dose. However, the study provides no serological results for the single IPV dose recipients, making it impossible to determine the proportion of subjects that seroconverted to the IPV dose. The limited evidence leads to an overall low grade(Table 3). The possibility of a primed state after one dose, even without seroconversion, means that designing a study to assess virus excretion for the single IPV dose immunity state remains challenging. The only ways to determine individual “priming” in the absence of seroconversion include administering a second IPV dose before the challenge, which would change the immunity state to “2 successful IPV,” or assessing carefully the speed with which the challenged individual with 1 prior IPV dose mounts an immune response, which may or may not provide a clear-cut differentiation between primed and non-primed individuals. Thus, even with studies that report extensive serological results, it remains very challenging to determine the effect of the possible seronegative primed state with high confidence, although we need such studies to establish the effect of a seroconverted single-dose recipient.
A total of 17 OPV challenge studies(20, 22, 24–26, 41, 45, 52, 56, 58, 60–69) include an arm of multiple IPV dose recipients, including 5 that meet the inclusion criteria for the assessment of relative susceptibility with 2(24, 45, 62–64) and ≥ 3(25, 45, 56, 58, 62, 68) successful IPV doses (Tables 3 and 4, respectively). We see highly variable crude ratios of relative susceptibility (i.e., as high as 4.5 and as low as 0.40), which occur due to low numbers of excretors, either as a result of a low challenge dose and/or other factors,(45) or small sample size.(56, 58) With larger numbers of excretors, the estimates typically equal approximately 1, with some variation as a result of chance. Among the studies with moderate to large numbers of excretors, only the study by Ghendon and Sanakoyeva (1961)(24) involving nursery children restricted the IPV arm to only seroconverters to the IPV doses. However, seroconversion in the IPV group does not preclude infections to an LPV prior to the challenge (i.e., wild or secondary OPV), while those in the seronegative group of susceptibles most likely did not experience any LPV infection, which suggests that the study may underestimate relative susceptibility. In contrast, the results from 4 other studies with moderate to large numbers of excretors(25, 62, 63, 68) may overestimate relative susceptibility because their IPV arms include subjects who did not respond to some or all IPV doses. All of the other limitations among the set of included studies (i.e., challenge with tOPV, absence of cumulative excretion rates or infrequent sample collection times, possible secondary LPV exposure, and laboratory limitations) affect the IPV groups as much as the susceptible groups, and thus introduce errors but no apparent bias in relative susceptibility estimates. Based on the criteria outlined in the methods section, we assess the overall weight of the evidence for relative susceptibility for the 2 and ≥ 3 successful IPV immunity states as moderate. The overall evidence suggests no significant effect of IPV on the susceptibility to infection (Table 3).
1 LPV infection, 2 or more LPV infections, IPV and LPV
14 OPV challenge studies(24, 43, 50, 51, 53, 54, 56–61, 70–73) report excretion results for single OPV dose recipients, with 8 studies(24, 50, 54, 57, 59, 70–73) meeting the inclusion criteria. Given the low take of the first OPV dose (especially the type 1 and 3 components of tOPV),(53, 73) lack of stratification of proportions excreting by responders vs. non-responders represents a particularly serious limitation for relative susceptibility estimation based on single-dose recipients. Thus, we focus on results that stratify by seroimmunity status or reported high seropositivity after the first dose. The type 1 data from Ghendon and Sanakoyeva (1961)(24), and type 2 data from Mallet et al. (1997)(71) and Samoilovich et al. (2003)(72) include only seropositive subjects at the time of challenge after receipt of a single OPV dose, with relative susceptibility estimates ranging from 0.20 to 0.55. Other estimates based mostly on results from responders to the first dose include type 2 results from Cohen-Abbo et al. (1995)(70) (95% seroconverted), Dong et al. (1986)(50) (96% seropositive at time of challenge), Maldonado et al. (1997)(73) (90% seroconverted), and type 1 results from Mallet et al. (1997)(71) (94% seropositive), which yield relative susceptibility estimates ranging from 0.09 to 0.45. Relative susceptibility estimates exceeding 1 occur for type 3 in some studies,(57, 59, 70) because the second dose of tOPV typically yields a better type 3 response than the first tOPV dose due to interference between serotypes for the first tOPV dose.(14) We assess the weight of the evidence for 1 LPV infection as high with respect to design, quality, and consistency, but moderate with respect to relevance, because no study measures virus exposure as it would occur in a natural setting (Table 3).
18 OPV challenge studies(20, 22, 24–26, 45, 54, 56, 58, 60, 61, 64–66, 68, 70–72, 74–76) report excretion results for multiple OPV dose recipients, with 10 studies(24, 25, 45, 54, 64, 68, 70–72, 75) meeting the inclusion criteria. High type 3 and type 1 estimates(57, 59, 70, 72) most likely represent an artifact of poor take of the first two tOPV doses or low sample size.(71) The lowest estimate of 0.07 from Cohen-Abbo et al. (1994)(70) may partially reflect an artifact of the low sensitivity of poliovirus detection at 30 days after the challenge, although the study achieved higher isolation rates for the other serotypes. The remaining estimates provide the best data for relative susceptibility after 2 or more LPV infections and range from 0.09 to 0.44. Similar to the 1 LPV infection immunity state, we grade the weight of the evidence as high on most attributes, but the overall grade remains moderate (Table 3).
We find 10 OPV challenge studies(20, 22, 52, 57, 59, 60, 65, 74–78) that report excretion results for recipients of both IPV and OPV vaccinations, but only two studies(57, 59–75) meet the inclusion criteria. The subjects in the study reported by Minor et al. (2005)(57) and Ramsay et al. (1994)(59) received a single enhanced-potency IPV (eIPV) dose followed by a single tOPV dose prior to challenge with a second tOPV dose. The high type 3 estimate may reflect poor take of both the eIPV and the subsequent tOPV dose. The similarity of the relative susceptibility estimates for types 2 and 3 based on single tOPV recipients from the same study(57, 59) suggests that the initial eIPV dose produced little effect on relative susceptibility, but we see a substantially lower type 1 estimate with eIPV than without. The study by Parent du Châtelet et al. (2003)(75) involved subjects who received 4 tOPV and either 0, 1, or 3 eIPV doses prior to the challenge, with no significant differences in the proportions excreting between the three groups. Based on these limited data, a mixed history of successful IPV doses and LPV infections appears at least as effective at reducing susceptibility as a history of only LPV infections, although no evidence exists to suggest that IPV enhances the protection from re-infection in subjects already immune from recent LPV infections. Due the small number of studies, we find a moderate quality and consistency grades for the IPV and LPV immunity states but otherwise similar grades as the LPV only states (Table 3).
Based on the data from the included studies (Table 4), we derive the following general insights about relative susceptibility: 1) maternal immunity and a history of only IPV (regardless of number of doses) provides little or no protection from re-infection compared to fully susceptibles, and 2) any history of LPV infection (with or without IPV) reduces the probability of infection by approximately 50% or more. While some studies show little difference in mucosal immunity between OPV and IPV vaccinees,(20, 22, 45) those results probably reflect frequent natural LPV infections among IPV vaccinees.(62) Data obtained in the absence of much opportunity for LPV exposure (i.e., young age at challenge and high hygiene setting) show a marked difference in relative susceptibility between IPV and OPV.(24–26, 57, 59, 64, 66, 68) Other studies from similar settings that do not compare IPV and OPV directly show no effect of only IPV vaccination on susceptibility compared to unvaccinated subjects,(19, 62, 79, 80) and various studies that compare OPV and IPV directly without including a susceptible arm confirm the difference between IPV and OPV.(26, 65, 66)
The limited data in Table 4 suggest little difference between LPV only and IPV and LPV, but do not address the impact of different orders of LPV infections and successful IPV vaccinations. The data from Modlin et al. (1997)(65) show a decrease in the proportion excreting according to the number of doses of tOPV in a vaccination schedule that started with two eIPV doses, although based on very few excretors with 2 or 3 prior tOPV doses. While two eIPV doses in addition to 3 tOPV doses led to somewhat higher seropositivity and antibody titers compared to only 3 tOPV doses, they did not lead to a reduced proportion excreting.(65) Studies in The Gambia, Oman, and Thailand also report no significant differences when comparing schedules with or without IPV and a fixed number of tOPV doses.(20, 22) Other studies found no significant differences in the proportion excreting between various sequential schedules of eIPV followed by tOPV(60, 78) or tOPV followed by eIPV.(75) No study provides a direct comparison of IPV followed by LPV versus LPV followed by IPV. Given the lack of an effect of IPV in addition to LPV, the order of LPV infections and successful IPV doses probably does not impact relative susceptibility for the recent immunity state, although the order of doses may affect take. However, IPV can boost antibody titers of previously LPV-infected individuals,(15) and consequently it could reduce relative susceptibility in individuals with waned LPV immunity. Within the recent immunity state of IPV and LPV, we suspect that the number of LPV infections may represent the most important source of variability.
Duration of fecal excretion over time
Definitions and criteria
In our review of the data on the length of excretion following infection for different immunity states, we find that most studies report excretion proportions over time rather than actual durations of excretion among infected subjects. Consequently, we first present data on the probability of fecal excretion over time, defined as the proportion of infected individuals excreting detectable homotypic virus in stools as a function of time since exposure to LPV for a given recent immunity state. We also summarize the available data on average time between the challenge and the last positive stool sample.
We focus on studies with at least 2 stool specimen collection times. Given the potential interference between concurrently administered strains affecting both take and the excretion kinetics, we restrict the review to monovalent OPV challenge studies (i.e., we exclude studies with limitation E). As with relative susceptibility, we further exclude studies with fewer than 10 subjects in the relevant study arms (limitation D), and those studies that provide no information about recent immunity states (limitation N) or show results only combined across exposure histories (limitation O). However, in contrast to estimation of relative susceptibility, we do not require the presence of a susceptible control arm (limitation B), although it still represents a critical limitation with respect to interpretation of study results. Table 5 provides the results of the evidence grading.
Table 5.
Grading table of the evidence for average time until the last positive stool specimen and proportions with fecal excretion over time from monovalent OPV challenge studies with at least two stool specimen collection times.
| Recent immunity state | Number of included studies (refs) a from which we could extract | Design | Relevance | Quality | Consistency | Overall grade | |
|---|---|---|---|---|---|---|---|
| Proportion excreting as a function of time | Average time until last positive stool specimen | ||||||
| Fully susceptible | 6(25, 41, 81, 84–86) | 5(24, 25, 55, 68, 84) | High | Moderate | High | High | Moderate |
| Maternally immune | 1(53) | 1(55) | Low | Moderateb | High | Moderate | Low |
| 1 successful IPV dose | No data | No data | Very Low | ||||
| 2 successful IPV doses | No datab | 1(24) | High | Moderate | Moderate | Low | Low |
| ≥ 3 successful IPV doses | 3(25, 26, 66, 69, 82)b | 4(25, 26, 68, 69) | High | Moderate | High | High | Moderate |
| 1 LPV infection | 2(51, 53, 83) | 1(24) | High | Moderate | High | Moderate | Moderate |
| ≥ 2 LPV infections | 4(25, 26, 45, 66, 75) | 5(24–26, 68, 75) | High | Moderate | High | High | Moderate |
| ≥ 1 successful IPV dose and ≥ 1 LPV infections | 2(52, 75) | 2(52, 75) | High | Moderate | Moderate | Moderate | Moderate |
Acronyms: IPV = inactivated poliovirus vaccine; LPV = live poliovirus; OPV = oral poliovirus vaccine
Notes:
We excluded studies with limitations D, E, N, and/or O (see Table 1), and studies that only report results for one sample collection time
Grade is low for PV3 due to low prevalence of maternal antibodies (limitation Q)
Kok et al. (1992)(45) provides monovalent OPV type 1 excretion rates over time for 2 and 3 IPV dose recipients combined
Out of 39 OPV challenge studies with at least 2 stool specimen collection times (Table 2), a total of 15 studies(24–26, 41, 45, 51–53, 66, 68, 69, 75, 81–86) meet our inclusion criteria for estimating the probability of fecal excretion over time or average time until the last positive stool specimen (Table 5). No data exist for recipients of 1 successful IPV dose. We find only one study with a low overall grade for maternally immunes(53) and only one study with a moderate grade for 2 successful IPV doses,(24) although we note that one study combined results for 2 and 3 IPV doses(45). The weight of the evidence for fully susceptibles and fully immunized individuals (i.e., 3 or more successful IPV doses, 2 or more LPV infections, or IPV and LPV) classifies as high with respect to design and consistency, moderate to high with respect to quality and moderate with respect to relevance, leading to moderate overall grades.
Probability of fecal excretion over time
Figure 5 summarizes the available data for fecal excretion over time for the 8 recent immunity states. For this figure (and other figures that report data by immunity state), we use black lines for the fully susceptible and maternally immune states, blue lines for IPV-only states, red lines for LPV-only states, and purple lines for the IPV and LPV state. We emphasize that the absolute proportions excreting between studies depend on many factors, including the challenge dose and setting (e.g., cumulative excretion rates vary by study or location, as shown in Table 4). To assess the duration of excretion by infected subjects from fecal excretion rates over time, we assume that the decrease in the proportion excreting relative to the peak excretion rate represents the most relevant information.
Figure 5: Summary of data from monovalent oral poliovirus vaccine (mOPV) challenge studies that report rates of fecal excretion for at least two points in time after challenge, by assigned recent immunity state.(25, 26, 41, 45, 51–53, 66, 69, 75, 81–85).
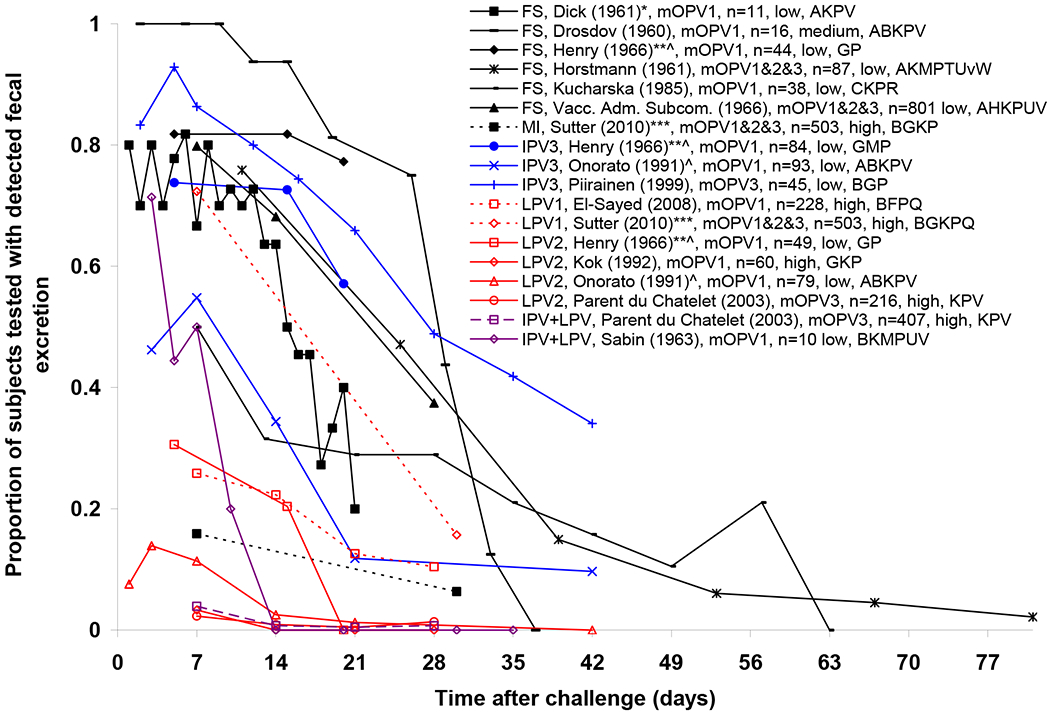
Acronyms: CID50/g = cell- or tissue-culture infectious doses; FS = fully susceptible; IPV3 = ≥ 3 successful IPV doses; LPV1 = 1 LPV infection; LPV2 = ≥ 2 LPV infections; IPV+LPV = ≥ 1 successful IPV doses and ≥ 1 LPV infections; MI = maternally immune
Notes:
Legend indicates assigned immunity state, first author (year) with any applicable footnotes, challenge vaccine, maximum number of subjects tested for excretion at any given specimen collection time, poliovirus transmissibility setting, limitations applying to study results (see Table 1 for limitation symbols)
* Study reports proportion of subjects excreting at 102 CID50/g or more
^ Combined results for different titers of challenge dose
** Proportion of subjects with positive sample at given day or later
*** Results from mOPV1, mOPV2, and mOPV3 arms combined
Figure 5 shows that over 50% of fully susceptible subjects excrete poliovirus fecally for at least 2 weeks and approximately 40% or more excrete for at least 4 weeks after the challenge. The only study that reports fecal excretion rates for maternally immunes shows very low rates, consistent with the known poor take of OPV given as a birth dose in India.(53, 87) However, the decrease of 40% in the excretion rate between 7 and 30 days remains similar to that observed for fully susceptibles.(81) The subjects probably represent a mix of maternally immunes and fully susceptibles (Table A1), with no breakdown by maternal antibody status provided to determine any difference in excretion rates over time between the two immunity states.(53) Likewise, the available data for single OPV dose recipients include a large fraction of subjects (i.e., 45%-88%) who did not respond to the first dose.(51, 53) This leads to overestimation of the probability of longer excretion. In contrast, the data on subjects with a probable history of multiple LPV infections suggest much lower excretion rates, with almost no subjects excreting beyond 21 days. The same observation holds for subjects with a history of IPV and LPV. For subjects with 3 or more successful IPV doses (and no LPV infections), two studies(25, 69) show that over 50% excrete approximately 3 weeks after the challenge, while another(26) showed generally lower excretion rates and a notable decrease between 7 and 21 days after the challenge. None of the studies with direct comparisons between IPV-only vaccinees and fully susceptibles following either mOPV or tOPV challenge show longer excretion for IPV vaccinees,(19, 24, 25, 56, 60, 63, 64) and one explicitly reports a clear lack of significant differences.(19)
Average time until the last positive stool specimen
Table 6 summarizes data from studies that allow the estimation of the average time until the last positive stool specimen among excretors, instead of the proportions fecally excreting over time (shown in Figure 5) that include both excretors and non-excretors. These data provide a more direct measure of the duration of excretion, although they lack information about the kinetics of excretion. However, the estimated averages depend on the: 1) frequency of stool specimen collection (e.g., more frequent collection means longer duration estimates given greater sensitivity of detecting excretion and shorter intervals between the last positive and first negative specimen), 2) time of first specimen collection (e.g., earlier implies detection of a higher proportion of short-duration excretors, leading to shorter duration estimates), 3) time of last specimen collection (e.g., collecting specimens further out in time leads to a longer average time of the last positive specimen), 4) duration estimates for the latent period before excretion starts (e.g., presumably no studies account for this, although not all studies report these details), and 5) whether averages include durations of 0 for non-infected subjects. Focus on the time until the last positive stool specimen ignores the latent period before the first positive specimen and the period of excretion after the last positive specimen. Despite these limitations, Table 6 clearly shows the longest average durations among fully susceptibles, similar or shorter average durations among recipients of 2 or 3 IPV doses, and the shortest average durations among previously LPV-infected excretors. The data from Parent du Chatelet et al. (2003)(75) include only seropositive subjects, but this study represents an outlier (i.e., among previously LPV-infected subjects), possibly because the late day of first specimen collection (i.e., day 7) may have missed a number of short duration excretors. The 3 studies that include both fully susceptible and IPV-only arms suggest a somewhat shorter average duration of excretion for IPV-only vaccinees than for fully susceptibles.(24, 25, 68) Among those, the study by Ghendon and Sanakoyeva (1961)(24) reports the largest difference, but as discussed previously for relative susceptibility, the focus on seropositive IPV recipients at time of challenge compared to seronegatives in the susceptible arm introduces a possible bias towards inclusion of more individuals with previous secondary OPV infection(s) in the IPV-only group. Tabulated data from Plotkin et al. (1959)(55) suggest a somewhat shorter duration of excretion for maternally immunes compared to fully susceptible despite the 10-fold larger average dose administered to maternally immunes. However, this study challenged subjects sequentially with different serotypes of OPV candidate strains, which could have truncated excretion disproportionately between the two immunity states.
Table 6:
Summary of data from monovalent OPV challenge studies that report or allow estimation of the average time until the last positive stool specimen.a
| Recent immunity state | Poliovirus transmissibility setting | Applicable limitationsb | Number of excretors | Average interval between post-challenge specimen collection times (days) | Day of first; last post-challenge specimen collection | Average time until the last positive stool specimen (days) | |
|---|---|---|---|---|---|---|---|
| First author (year)ref | |||||||
| Fully susceptible | |||||||
| Drosdov (1960)(84) | Medium | ABKPV | 16 | 3.9 | 2; 37 | 25 | |
| Ghendon (1961)(24) | Medium | KPV | 24 | 2 | 2; 28 | 20.4 | |
| Henry (1966)(25) | Low | GP | 34 | 5 | 5; 20 | 19.6 | |
| PHLS (1965)(68) | Low | CKP | 19 | 3.5 | 3.5; 42 | 29 | |
| Plotkin (1959)(55) | Low | KLPV | 26 | 3.5 | 1-4; 92c | 31.7d | |
| Maternally immune | |||||||
| Plotkin (1959)(55) | Low | KLPV | 58 | 3.5 | 1-4; 92c | 26.5d | |
| 2 successful IPV doses | |||||||
| Ghendon (1961)(24) | Medium | KMPV | 12 | 2 | 2; 28 | 12.3 | |
| ≥ 3 successful IPV doses | |||||||
| Henry (1966)(25) | Low | GMP | 62 | 5 | 5; 20 | 16.7 | |
| Onorato (1991)(26) | Low | ABKPV | 59 | 8.2 | 1; 42 | 15.5 | |
| PHLS (1965)(68) | Low | CKMP | 55 | 3.5 | 3.5; 42 | 23.2 | |
| Piirainen (1999)(69) | Low | BGP | 41e | 5 | 2; 42 | 29 | |
| 1 LPV infection | |||||||
| Ghendon (1961)(24) | Low | KPV | 23 | 2 | 2; 28 | 4.6 | |
| ≥ 2 LPV infections | |||||||
| Ghendon (1961)(24) | Medium | KPV | 18 | 2 | 2; 28 | 5.2 | |
| Henry (1966)(25) | Low | GP | 15 | 5 | 5; 20 | 10 | |
| Onorato (1991)(26) | Low | ABKPV | 20 | 8.2 | 1; 42 | 6.4 | |
| Parent du Châtelet (2003)(75) | High | KPV | 11 | 7 | 7; 28 | 15.3 | |
| PHLS (1965)(68) | Low | CKP | 18 | 3.5 | 3.5; 42 | 13 | |
| ≥ 1 successful IPV doses and ≥ 1 LPV infections | |||||||
| Parent du Châtelet (2003)(75) | High | KPV | 24 | 7 | 7; 28 | 11.7 | |
| Sabin (1963)(52) | Low | BKMPUV | 5 | 4.6 | 3; 30 | 8.2 | |
Acronyms: IPV = inactivated poliovirus vaccine; LPV = live poliovirus; OPV = oral poliovirus vaccine; PV = poliovirus
Notes:
See Table A1 for details on the assignment of study arms to immunity states
See Table 1 for limitation symbols; “critical” limitations shown in bold font
Possibly differed by subject; in some cases, excretion stopped after challenge with another type, or started while excretion from a previous challenge was ongoing
Maternally immunes (defined as antibody titers of 1:8 or more) challenged with 1 log larger dose on average than fully susceptibles (defined at antibody titers < 1:8)
Excludes 1 excretor who was positive only in monkey kidney but not in L20b cell cultures
Some results not meeting the inclusion criteria nevertheless provide complimentary data. For example, Gelfand et al. (1959)(46, 47) (excluded due to limitations N and Q) estimated average time until the last positive stool specimen of 20.5, 20.6, and 38.6 days following challenge with mOPV1 (n=24), mOPV2 (n=17), and mOPV3 (n=20), respectively, among subjects with varying antibody levels (including many with < 1:10), which resulted from 3 IPV doses administered between 1 and 2 years before the challenge in the documented absence of natural immunity.
They also report average times of 4.5, 4.6, and 3.5 days between the last positive and first negative stool for PV1, PV2, and PV3, respectively, and an average time between challenge and first positive stool of approximately 1.5 days for all serotypes combined, with no apparent differences between serotypes. Challenge studies typically isolate the virus from the highest proportion of subjects approximately one week after the challenge, with a substantial fraction of isolations occurring before day 7 (Figure 5). However, early isolations may represent viruses that merely passed through the alimentary tract without replication, while excretion of larger amounts of virus following replication in the alimentary tract typically begins three or more days after the challenge.(32) Thus, using the time until the first positive stool as an indicator of the latent period may lead to an underestimate of the actual latent period between ingestion of virus and infectiousness to others. Similarly, the period of infectiousness to others may not equal the detected duration of fecal excretion (see further discussion of infectiousness below).
Concentration of virus excreted in feces
Definitions and criteria for concentrations of virus in feces
We review the data on the concentrations of fecally excreted virus for different immunity states. Quantification of the concentration of virus typically involves titration of fecal samples, reported in CID50 or plaque forming units (pfu) per gram (g, equivalent to a cm3) of stool, or in some cases copy numbers derived from reverse transcriptase polymerase chain reaction (RT-PCR).(61, 64) The conversion between these measures depends on specific laboratory methods and therefore we note any measurements not provided in the most commonly used measure of CID50/g. As with the length of excretion, we distinguish data on the average concentration of virus (geometric mean titers, equivalent to mean of log titers) over all positive samples reported at each specimen collection time, or data on the cumulative average concentration of virus over the entire sampling period.
Given the paucity of data, we include studies that covered only one specimen collection time or challenged subjects with tOPV, and we exclude only studies with fewer than 10 subjects in relevant study arms (limitation D), no information about recent immunity states (limitation N), and those with results lumped across exposure histories (limitation O).
A total of 9 studies(24–26, 41, 52, 62, 69, 78, 88) meet the inclusion criteria for the concentration of fecal excretion over time or as a cumulative average, with no data for maternally immunes or 1 successful IPV dose (Table 7). Given a number of studies with relatively few limitations that report titers for multiple recent immunity states,(24, 25, 62) the evidence for fully susceptibles and fully immunized LPV or IPV recipients remains high with respect to design and consistency and moderate with respect to relevance, with an overall grade of moderate. These studies do not cover the IPV and LPV immunity state, which receives a low overall grade.
Table 7.
Grading table of the evidence for the concentration of fecal excretion over time (or as an average) from OPV challenge studies.
| Recent immunity state | Number of included studies(refs) a providing mean titers | Design | Relevance | Quality | Consistency | Overall grade | |
|---|---|---|---|---|---|---|---|
| As a function of time | As cumulative mean | ||||||
| Fully susceptible | 3(41, 84, 88) | 4(24, 25, 62, 88) | High | Moderate | High | High | Moderate |
| Maternally immune | No data | No data | Very low | ||||
| 1 successful IPV dose | No data | No data | Very low | ||||
| 2 successful IPV doses | 1(41) | 2(24, 62) | High | Moderate | High | High | Moderate |
| ≥ 3 successful IPV doses | 1(69) | 4(25, 26, 62, 69) | High | Moderate | High | High | Moderate |
| 1 LPV infection | No data | 1(24) | High | Moderate | Moderate | Low | Low |
| ≥ 2 LPV infections | No data | 3(24–26) | High | Moderate | Moderate | High | Moderate |
| ≥ 1 successful IPV dose and ≥ 1 LPV infections | 2(52, 78) | 1(52) | Low | Moderate | Moderate | Low | Low |
Acronyms: IPV = inactivated poliovirus vaccine; LPV = live poliovirus; OPV = oral poliovirus vaccine
Notes:
We excluded studies with limitations D, N, and/or O (see Table 1)
Fecal virus titers over time
Figure 6 shows data from the 6 studies(41, 52, 69, 78, 84, 88) that report virus titers over time, all based on mOPV challenges. One potentially important limitation not captured in Table 2 and the grading process relates to the calculation of geometric mean titers and whether they include results from negative specimens, which studies typically do not report. Mathematically, the geometric mean becomes 0 if at least one element equals zero. Thus, investigators may either 1) exclude negative specimens from their geometric mean titer calculation, 2) include negative results as equal to the lowest dilution tested (i.e., typically 102 CID50), 3) include negative results as 0 log CID50 = 1 CID50. Given that in many instances investigators do not report how they handled negative specimens in their calculations, we face uncertainty about the interpretation of reported geometric mean titers. For 3 studies,(52, 69, 88) we calculated mean titers from tabulated data and we did not include negative results. For 3 other studies,(41, 78, 84) we could not determine whether the apparent decrease in titers represents an artifact of inclusion of negative results in the calculation of mean titers. For 1 study(84) with a rapid decline in titers over time and relatively very low values, we suspect that the averages may include subjects not excreting at a given time point as a 0 log value, although based on excretion curves for individual subjects some decline occurred out in time even among positive isolates. For the study by Piirainen et al. (1999),(69) when we exclude negative results we find no significant decrease in mean titers after day 14, consistent with the observed titers over time in a study of elderly subjects with various immunological event histories.(89) The study by Sabin et al. (1963)(52) includes only 2 of 10 challenged subjects excreting at the last time point (10 days). Peak geometric mean titers in Figure 6 range from 103 to almost 107 CID50/g, with low titers observed initially and peak titers between approximately 5-15 days. The low initial titers may reflect viruses that merely pass through the alimentary tract without establishing infection. The data from Swartz et al. (2008)(78) show unusually high concentrations of excreted viruses, with maximum reported titers of 107.7 CID50/g for one subject despite receipt of 2 or 3 tOPV doses prior to the challenge in addition to 2 or 3 eIPV doses. In general, the large variation between studies with similar immunity states in titer values in Figure 7 suggests substantial measurement errors, variability in laboratory methods, and/or variability in the calculation of geometric means. One study comparing IPV-only vaccinees and fully susceptibles finds no important difference between the groups, even when only considering IPV vaccinees with high pre-challenge serum antibody titers.(41) Nevertheless, Figure 6 does not include enough data to establish a lack of effect of IPV on excreted virus titers.
Figure 6: Reported concentrations of virus excreted over time from 7 included OPV challenge studies(41, 52, 69, 78, 84, 88) demonstrating large variability in measurement methods and resulting measurement errors.
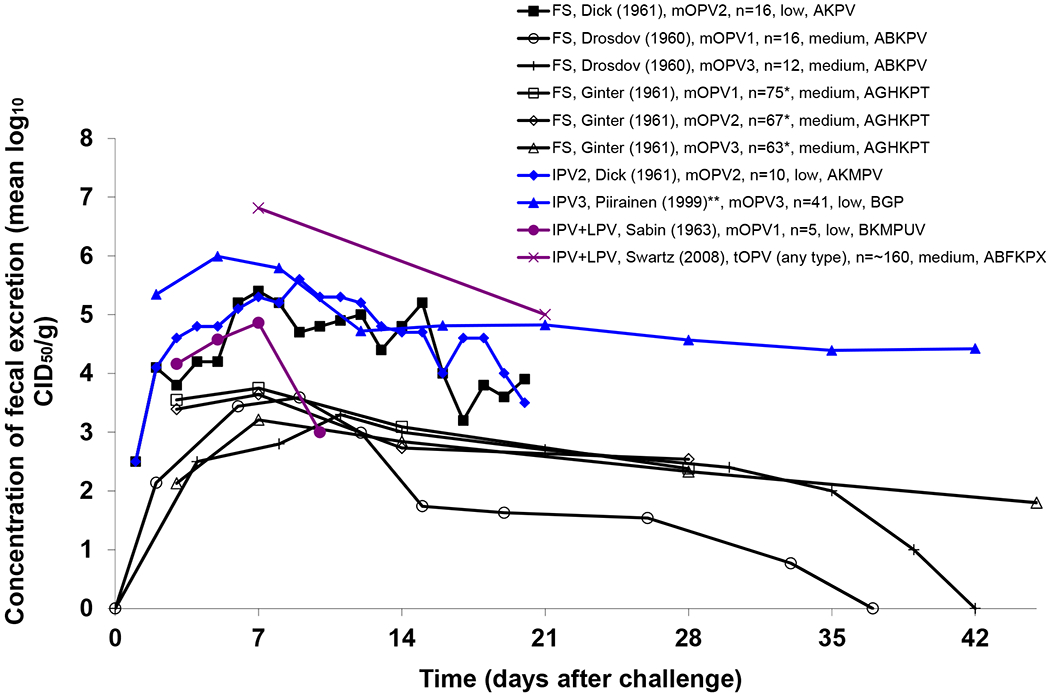
Acronyms: CID50/g = cell- or tissue-culture infectious doses per gram of stool; FS = fully susceptible; IPV3 = ≥ 3 successful IPV doses; IPV+LPV = ≥ 1 successful IPV doses and ≥ 1 LPV infections; mOPV(1,2,3) = monovalent oral poliovirus vaccine (type 1, 2, 3, respectively);
Notes:
Legend indicates assigned immunity state, first author (year) with any applicable footnotes, challenge vaccine, cumulative number of excretors, poliovirus transmissibility setting, limitations applying to study results (see Table 1 for limitation symbols)
* Cumulative number of excretors unknown, n reflects peak proportion excreting; Excretors include children with pre-challenge antibody titers 1:4 and under as well as 2 type 2 excretors and 1 type 3 excretor with pre-challenge antibody titers of 1:16
** Data differ from Figure 1 in Piirainen et al. (1999)(69, p. 1088) because we included only positive specimens in calculation of geometric mean titers
Figure 7: Summary of data from 6 OPV challenge studies that report proportions excreting for different challenge doses.(25, 26, 46, 47, 55, 74).

Acronyms: CID50 = cell- or tissue-culture infectious dose; FS = fully susceptible; IPV3 = ≥ 3 successful IPV doses; LPV2 = ≥ 2 LPV infections; IPV+LPV = ≥ 1 successful IPV doses and ≥ 1 LPV infections; MI = maternally immune; mOPV1 = type 1 monovalent oral poliovirus vaccine; Notes: Legend indicates assigned immunity state, first author (year), challenge vaccine, approximate number of challenged subjects per dose, poliovirus transmissibility setting, limitations applying to study results (see Table 1 for limitation symbols)
Cumulative mean fecal virus titers
Table 8 summarizes results from 7 studies(24–26, 52, 62, 69, 88) that report cumulative mean virus titers of isolates obtained over the sampling period, all including only positive samples. Looking across immunity states, the collective data on a log scale suggest little or no difference in titers between fully susceptibles and individuals with IPV-induced immunity. However, studies that directly compared these found approximately 0.5 logs (i.e., 3-fold),(62) a little over 1 log (11-fold),(24) and approximately 1.2 log (16-fold)(25) lower titers for IPV-only vaccinees compared to fully susceptibles. Another study using RT-PCR found geometric mean copy numbers of 627 and 155 for fully susceptibles and IPV vaccinees, respectively.(64) Subjects with a history of LPV exposure clearly show lower average fecally-excreted poliovirus titers, with roughly 3 log (1000-fold)(24) and 2.3 log (200-fold)(25) lower values for previously LPV-infected than fully susceptible individuals in studies that provide direct comparisons. Consistent with the greater effect of OPV on titers, Onorato et al. (1991)(26) reported a 0.7 log (i.e., 5-fold) difference between subjects fully vaccinated with OPV compared to IPV.
Table 8:
Results of studies reporting the concentrations of fecal excretion as an average over time or at a single point in time after challenge.a
| Recent Immunity state | Poliovirus transmissibility setting | Applicable limitationsb | Challenge (# subjects in assigned immunity state) | Concentration of virus in log10 CID50/g unless otherwise noted (#positive isolates) |
||||
|---|---|---|---|---|---|---|---|---|
| Study | ||||||||
| PV1 | PV2 | PV3 | Any Type | |||||
| Fully susceptible | ||||||||
| Ghendon (1961)(24) | Medium | KPV | mOPV1 (30) | 5.15 (NRc) | ||||
| Cuba IPV Study (2008)(62) | Medium | FGHP | tOPV (54) | 3.89 (49) | ||||
| Ginter (1961)(88) | Low | AGHKPT | mOPV1, 3, then 2 (102d) | 3.31 (194) | 3.13 (212) | 2.81 (161) | ||
| Henry (1966)(25) | Medium | GP | mOPV1 (48) | ~ 4.9e (38) | ||||
| 2 successful IPV doses | ||||||||
| Ghendon (1961)(24) | Medium | KMPV | mOPV1 (31) | 4.11 (NRf) | ||||
| Cuba IPV Study (2008)(62) | Medium | FGHP | tOPV (72) | 3.37 (70) | ||||
| ≥ 3 successful IPV doses | ||||||||
| Cuba IPV Study (2008)(62) | Medium | FGHP | tOPV (52) | 3.46 (49) | ||||
| Henry (1966)(25) | Low | GMP | mOPV1 (92) | ~ 3.7g (54) | ||||
| Onorato (1991)(26) | Low | ABKP | mOPV1 (45) | 3.24h (158) | ||||
| Piirainen (1999)(69)i | Low | BGP | mOPV3 (45) | 5.12 (264) | ||||
| 1 LPV infection | ||||||||
| Ghendon (1961)(24) | Medium | KPV | mOPV1 (33) | 2.18 (NRj) | ||||
| ≥ 2 LPV infections | ||||||||
| Ghendon (1961)(24) | Medium | KPV | mOPV1 (51) | ~ 2.1 (NRk) | ||||
| Henry (1966)(25) | Low | GP | mOPV1 (50) | ~ 2.6g (14) | ||||
| Onorato (1991)(26) | Low | ABKP | mOPV1 (45) | 2.54h (29) | ||||
| ≥ 2 successful IPV doses and ≥ 1 LPV infections | ||||||||
| Sabin (1963)(52) | Low | BKMPUV | mOPV1 (10) | 4.3 (16) | ||||
Acronyms: CID50/g = cell- or tissue-culture infectious doses per gram of stool; IPV = inactivated poliovirus vaccine; LPV = live poliovirus; pfu/g = plaque-forming units per gram of stool; PV(1,2,3) = poliovirus (type 1, 2, 3, respectively)
Notes:
See Table A1 for details on the assignment of study arms to immunity states
See Table 1 for limitation symbols; “critical” limitations shown in bold font
Isolates from 24 excretors over time (for 28 days)
Excretors include children with pre-challenge antibody titers 1:4 and under as well as 2 type 2 and 1 type 3 excretors with pre-challenge antibody titers of 1:16
Isolates from 23 excretors over time (for 28 days)
Estimated from stratified data for 6-15 days after challenge, assuming mean log10 CID50 titers of 2.5 for the “<3.0” results, 3.5 for “3.1-4”, 4.5 for “4.1-5” and 5.5 for “>5.0”(25, Table 9, p. 114)
Reported results in log10 pfu/g
Data not reported as cumulative average in published paper(69)
Isolates from 12 excretors over time (for 28 days)
Isolates from 18 excretors over time (for 28 days); mean log titers for combined group of 11 triple seropositive children (mean 2.03 log10 CID50/g) and 7 children with documented recent excretion (mean 2.15 log10 CID50/g) not reported
In addition to the data from Figure 6 and Table 8, Henry et al. (1966)(25) and Dick et al. (1961)(41) report the proportion excreting at high titers (i.e, 104 CID50 or more) as a function of time. These data reflect the combined effect of both reduced excretion proportions and lower titers over time and indicate increasingly important differences in overall virus output between groups of susceptibles and immunes as a function of time.
Duration and concentration of oropharyngeal excretion
We review the data on the total oropharyngeal virus output for recent immunity states by considering studies that report oropharyngeal excretion at 2 or more throat specimen collection times, average duration of oropharyngeal excretion, or mean titers of positive isolates. Given the paucity of data, we exclude only studies that provide no information about recent immunity states (limitation N) or provide only results lumped across exposure histories (limitation O). although we continue to let these critical limitations affect evidence grading (Table 1).
Table 9 lists the available studies for each recent immunity state, which includes only 3 studies.(26, 41, 74) Given the limitations of these studies, the weight of the evidence remains low for fully susceptibles, 3 or more successful IPV doses, and 2 or more LPV infections, and very low for all other immunity states. However, the evidence suggests very low probability of oropharyngeal excretion for any type of recent immunes, which implies less importance of the distinction between IPV and LPV immunity states relative to the distinction between seropositive and seronegative. Several studies that do not qualify for characterization of our narrowly-defined recent immunity states nevertheless provide informative data on oropharyngeal excretion by seroimmunity status(39, 42, 44) or otherwise.(46, 47)
Table 9.
Grading table of the evidence for the oropharyngeal virus output from OPV challenge studies.
| Recent immunity state | Included studies(refs) a providing oropharyngeal excretion data | Design | Relevance | Quality | Consistency | Overall grade | |
|---|---|---|---|---|---|---|---|
| Duration | Concentration | ||||||
| Fully susceptible | 1(41) | No data | Low | Moderate | Moderate | High | Low |
| Maternally immune | No data | No data | Very low | ||||
| 1 successful IPV dose | No data | No data | Very low | ||||
| 2 successful IPV doses | No data | No data | Very low | ||||
| ≥ 3 successful IPV doses | 2(26, 74) | 1(74) | Low | Moderate | Moderate | Moderate | Low |
| 1 LPV infection | No data | No data | Very low | ||||
| ≥ 2 LPV infections | 2(26, 74) | 1(74) | Low | Moderate | Moderate | Moderate | Low |
| ≥ 1 successful IPV dose and ≥ 1 LPV infections | No data | No data | Very low | ||||
Acronyms: IPV = inactivated poliovirus vaccine; LPV = live poliovirus; OPV = oral poliovirus vaccine; NR = not reported
Notes:
Dick et al. (1961)(41) detected 104 CID50 or more poliovirus from throat specimens 10 days after the challenge in all 3 oropharyngeal excretors among a group of 11 susceptibles, which continued for one individual for over 14 days (the last specimen collection time). Based on these few excretors, the average duration of detectable oropharyngeal excretion may exceed 10 days for fully susceptibles. In contrast, they found no poliovirus in the throat swabs from any of the seropositives with either IPV vaccination or natural LPV infection.(41) Onorato et al. (1991)(26) isolated poliovirus from pharyngeal swabs in only one of 93 IPV vaccinees (including 0 among 48 challenged with a low dose of 102.7-102.9 CID50) until 7 days after the challenge. They isolated poliovirus from pharyngeal swabs from 2 of 79 OPV vaccinees (including 0 among 34 challenged with a low dose of 102.7-102.9 CID50) until 7 days after the challenge and from an OPV vaccinee only on day 42. Horstmann et al. (1959)(74) present examples of oropharyngeal excretion patterns from a subject with only IPV-induced immunity (2 or more doses) and a subject with a recent LPV infection after a likely history of more LPV infections, which suggested that the recently LPV infected subjects in this study did not excrete from the oropharynx. In contrast, the recently IPV-vaccinated subject excreted for 10 days at titers between 102 and 104 CID50/ml.
Plotkin et al. (1960)(43) isolated poliovirus from the oropharynx much more frequently following challenge doses of 106 CID50 or more compared to lower challenge doses among maternally immune or fully susceptible infants. Gelfand et al. (1959)(46, 47) similarly found an important impact of the challenge dose on oropharyngeal excretion among children with a history of IPV and most likely no LPV infection. While only 17% (5/29) of the subjects receiving 103.6-105.8 log CID50 excreted virus detected in pharyngeal specimens, 67% (20/30) of the subjects receiving 107.1-107.3 log CID50 excreted virus detected in pharyngeal specimens. For all subjects combined, the estimated average time until cessation of oropharyngeal excretion ranged from 5.7 days after mOPV2 challenge to 10 days after mOPV3 challenge. In a study involving older children, Glezen et al. (1966)(39) isolated poliovirus from 21% (6/29) of children aged 5-9 years with pre-challenge antibody titers of 1:8 or less at 3 or 7 days following an mOPV1 challenge. Only 5% (3/63) of children with antibody titers exceeding 1:8 excreted from the oropharynx. A similar study found that 59% (35/59) of children aged 5-9 years with pre-challenge antibody titers less than 1:8 excreted PV1 from the oropharynx following tOPV challenge, but only 2% (2/98) excreted PV2 or PV3. Only 2% (26/1349) of children aged 5-9 years with antibody titers of 1:8 or more excreted any type of poliovirus from the oropharynx. Siegert et al. (1963)(44) isolated poliovirus from oropharyngeal samples of 87% (13/15) of seronegative children until on average 12.8 days after mOPV1 challenge, with 62% (8/13) of children still excreting at the time of the last throat specimen collection 18 days after the challenge. In addition, 77% (13/17) of seronegative adults excreted on average until 7.6 days after the challenge, with 23% (3/13) still excreting at 18 days. The study also reports a rapid increase in titers of oropharyngeally excreted viruses by all seronegatives from 102.3 CID50/ml in oropharyngeal swabs obtained 2 days after challenge to 104.3 CID50/ml in throat washings obtained 6 days after challenge. Among subjects of all ages with antibody titers of 1:4 of more, 28% (14/50) excreted from the oropharynx until an average of 3 days after the challenge. The high rates and long duration of oropharyngeal excretion may reflect secondary spread of the virus given that 71% (12/17) of contacts of challenged subjects excreted virus from the oropharynx at 18 days after challenge, including only one who also excreted fecally at that time.
Waning of host immunity to poliovirus transmission
Relatively weak data exist to characterize the magnitude and dynamics of waning with respect to mucosal and oropharyngeal immunity and excretion. Nonetheless, models must characterize changes that occur in susceptibility and total virus output given infection over time due to waning in the absence of successful vaccinations or LPV infections. Much of the literature assesses waning of systemic immunity, and consequently we start by summarizing key studies on poliovirus antibody kinetics. We then review OPV challenge studies that provide excretion data for subjects historically infected with an LPV or successfully vaccinated with IPV.
Antibody kinetics
Ogra and colleagues studied the kinetics of poliovirus antibodies extensively in a series of papers,(90–93) including the reconstruction of various short-term antibody kinetics after a (single) primary infection or vaccination.(93) Briefly, IgM appears in the sera within days after infection and disappears again in 2 to 3 months. IgG appears equally quickly in sera but persists longer, possibly for life. Serum IgA appears somewhat later and resides in blood at somewhat lower titers compared to IgG. While the serum antibody response remains similar for IPV and OPV, only OPV induces significant duodenal and nasal IgA, which presumably provide mucosal immunity. Data from Nishio et al. (1990)(94) suggest a much shorter immunological memory of fecal IgA compared to serum IgG. Buisman et al. (2008)(95) showed that the presence of serum IgA in otherwise seropositive elderly subjects with a history of IPV or natural infections strongly reduces the probability, duration, and titers of fecal excretion. A related study based on the same trial found clear evidence of memory immunity (i.e., an anamnestic response) in a fraction of seronegatives, although it did not significantly affect fecal excretion.(89) While IPV by itself does not stimulate production of duodenal or mucosal IgA, data from Herremans et al. (1999)(96) suggest that boosting with IPV in previously LPV-infected subjects can lead to a strong mucosal IgA response.
Most studies on long-term antibody kinetics focus on antibodies in the sera. Böttiger (1990)(97) investigated the long-term persistence of serum antibodies longitudinally in IPV-vaccinated Swedish subjects who most likely lacked LPV exposure. They found that following a booster IPV dose, geometric mean serum antibody log titers (using a reciprocal value of 2 for seronegative results) decrease approximately linearly with time by approximately 0.5-1 logs over a period of 11 years. In a setting of routine OPV use, the longitudinal study by Faden et al. (1993)(98) shows that geometric mean serum antibody titers (using a reciprocal value of 10 for seronegative results) typically decrease by 0.7-1.3 logs over a period of 5 years in subjects with primary OPV only, primary eIPV only, or two mixed primary OPV-eIPV schedules. The observed occasional increases in mean titers presumably represent the effect of secondary OPV infections. They also report that the antibody titers return to high levels following administration of a booster OPV dose to all subjects at 5 years after the previous dose. Several of the OPV challenge studies (Table 2) and serological surveys provide cross-sectional data on the persistence of antibodies after vaccination, which show that antibody levels can drop below detectable levels in previously LPV-infected or IPV-vaccinated subjects.(39, 89, 94, 95, 99–103) Other cross-sectional serological data confirm the decrease both in the proportion of seropositive subjects and mean antibody titers as a function of time since the last vaccination.(103–106)
OPV challenge studies involving subjects with partially waned immunity to poliovirus transmission
While the antibody kinetics and persistence remain relatively well-documented and data exist on the relationship between antibody titers and excretion (see next section), direct data on excretion as a function of time since the last exposure event remain very limited. The ideal study designed to establish this relationship would follow subjects longitudinally in an LPV-free setting and challenge different arms of subjects at different times following documented successful vaccination and infection. The only OPV challenge study that provides results of challenge for different times after primary vaccination in a longitudinal design unfortunately includes too few subjects to draw direct conclusions about the relationship between excretion and time since entering immunity states (see Figure A2).(100) The limitations to address waning from OPV challenge studies differ from those listed in Table 1 related to characterizing recent immunity states, particularly related to the design and assignment of study arms to immunity states (i.e., relevance). However, given the lack of studies that provide direct evidence of the impact of waning on excretion, the weight of the evidence from OPV challenge studies remains low to very low for waning. Nevertheless, data on excretion by age and serologic status among older children and adults provide some insights into the effect of waning on excretion.
Table 10 summarizes the evidence from OPV challenge studies for characterizing waning of immunity. Clearly, subjects of all ages with histories of either IPV or LPV regularly become infected and can excrete large concentrations of virus in feces for extended periods of time, as do subjects in recent immunity states. Seropositivity, defined according to different thresholds across studies, affects the probability and duration of excretion,(44, 89, 107, 108) although its effect on virus titers emerges clearly from only one study,(44) while others reported no clear-cut effect.(39, 42, 89, 108) We emphasize that given the age of subjects and study settings, all results reported in Table 10 may involve subjects with a history of natural LPV infection(s) in addition to recorded vaccination and some may have experienced recent LPV infection(s). The seronegative or low antibody titer groups may include both fully susceptible subjects and subjects with an IPV and/or LPV history whose antibody titers declined to very low levels. Seronegative subjects with memory immunity exhibit an anamnestic response if infected, which could reduce excretion compared to true susceptibles. In this context, two studies(44, 108) that stratified by age report less excretion among seronegative adults compared to seronegative children. The difference emerges particularly clearly in terms of duration of excretion. This may reflect the fact that seronegative children included relatively more truly susceptible subjects, while the seronegative adults included relatively more historically LPV-infected subjects with waned antibodies. Another study(109) not included in Table 10 because of the low numbers of subjects per arm, also shows a notable decrease in duration of excretion by age despite controlling for pre-challenge serum antibody titers.
Table 10.
Summary of findings from OPV challenge studies that assess fecal excretion among historically infected or vaccinated subjects
| First author (year)ref [challenge] | Pre-existing immunity [age at time of challenge in years]a | Fecal excretors/number tested (proportion) | Approximate average duration of fecal excretion in days | Cumulative mean fecal virus titers [log10 CID50/g] | Notes |
|---|---|---|---|---|---|
| Abbink (2005)(89) [mOPV1;mOPV3] | Serum Ab titers less than 1:8 [54-74] | PV1: 83/103 (0.80)b PV3: (0.74)b |
PV1: ~ 14-21c PV3: ~ 28-35c |
~ 4 | |
| Abbink (2005)(89) [mOPV1;mOPV3] | Seropositive with history of IPV and possible LPV [49-54] | PV1: 5/29 (0.17)b PV3: 7/39 (0.18)b |
“short (maximum, 28 days) compared to that in the seronegative groups” (p. 997) | ~ 3.5-4 | |
| Abbink (2005)(89) [mOPV1;mOPV3] | Seropositive with history of only LPV [54-74] | PV1: 10/46 (0.22)b PV3: 13/44 (0.30)b |
“relatively short” (p. 997) | ~ 3.5-4 | |
| Beale (1965)(132) [tOPV] | Serum Ab titers less than 0.6 international units [4-5] | PV1: 19/23 (0.83) PV2: 9/11 (0.82) PV3: 19/24 (0.79) |
NR | NR | Results combined for capsule and liquid form tOPV given lack of significant difference |
| Beale (1965)(132) [tOPV] | Seropositive with history of 3 IPV [4-5] | PV1: 8/19 (0.42) PV2: 11/20 (0.35) PV3: 13/20 (0.65) |
NR | NR | Results combined for capsule and liquid form tOPV given lack of significant difference |
| Glezen (1966)(39) [mOPV1] | Serum Ab titers of 1:8 or less [5-9] | PV1: 51/57 (0.89)b | ~ 7-14c | 3.2d | |
| Glezen (1966)(39) [mOPV1] | Seropositive with probably both IPV and LPV history [5-9] | PV1: 82/124 (0.66)b | ~ 7-14c | 3.0d | More rapid decrease in excretion rates than among seronegatives |
| Glezen (1969)(42) [tOPV] | Serum Ab titers of 1:4 or less [5-9] | PV1: 50/57 (0.88) PV2: 6/7 (0.86) PV3: 74/90 (0.82) |
PV1: ~ 11-18c PV2: ~ 11-18c PV3: ~25-39c |
~ 3.5-4 | Mean titers overestimate since “the system probably did not regularly detect the presence of a single virus at a concentration of less than 102.6 [CID50/g]” (p. 152) |
| Glezen (1969)(42) [tOPV] | Seropositive with IPV and probable LPV history [5-9] | PV1: 71/136 (0.52) PV2: 161/186 (0.87) PV3: 84/103 (0.82) |
PV1: ~ 4-11c PV2: ~ 11-18c PV3: ~25-39c |
~ 3.5-4 | |
| Goffe (1961)(101) [tOPV] | Serum Ab titers less than 1:4 [21-56] | PV1: 4/5 (0.80) PV2: 2/7 (0.29) PV3: 4/4 (1.00) |
Cannot be determined from reported results | NR | |
| Goffe (1961)(101) [tOPV] | Seropositive with possible history of IPV and LPV [21-56] | PV1: 3/28 (0.11) PV2: 7/26 (0.27) PV3: 6/31 (0.19) |
Cannot be determined from reported results | NR | |
| Nishio (1984)(100) [tOPV] | Serum Ab titers of 1:4 or less with history of OPV [3-101 | PV1,2&3 combined: 17/28 (0.61) | Short | NR | 1 positive isolate on day 23 |
| Nishio (1984)(100) [tOPV] | Seropositive with history of only LPV [3-10] | PV1,2&3 combined: 11/68 (0.16) | Short | NR | 1 positive isolate on day 23 (subject had Ab titer 1:8) |
| Pagano (1964)(107) [CHAT1] | Serum Ab titers less than 1:10 [8-13] | PV1: 28/29 (0.97) | PV1: 47 | NR | Duration estimates based on subset of subjects followed for 8 weeks in one study group |
| Pagano (1964)(107) [CHAT1] | Seropositive with IPV and probable LPV history [8-13] | PV1: 79/89 (0.89) | PV1: 21 | NR | |
| Siegert (1963)(44) [mOPV1] | Serum Ab titers less than 1:4 [0.5-11] | PV1: 15/15 (1.00) | PV1: 30 | PVL: ~ 3.4 | Results for seronegative children and adults combined |
| Siegert (1963)(44) [mOPV1] | Serum Ab titers less than 1:4 [19-59] | PV1: NR (0.88) | PV1: 17 | PVL: ~ 3.4 | Results for seronegative children and adults combined |
| Siegert (1963)(44) [mOPV1] | Seropositive with possible history of IPV and LPV [0.5-59] | PV1: NR (~0.55) | PV1: 5 | PV1: < 2.1 | Geometric mean titers 2.1 in 25 stools from subjects with Ab titers 1:4-1:16, too low to quantify in stools from subjects with Ab titers > 1:16 |
| Smith (1976)(102) [tOPV] | Serum Ab titers of 0.1 international units/ml or less [16-181 | PV1: 20/21 (0.95) PV2: 13/14 (0.93) PV3: 23/31 (0.74) |
NR | NR | |
| Smith (1976)(102) [tOPV] | Seropositive with history of IPV and/or LPV [16-18] | PV1: 43/133 (0.30) PV2: 68/151 (0.45) PV3: 45/134 (0.34) | NR | NR | |
| Vaccine Adm. Subcom. (1966)(81) [mOPV1] | Serum Ab titers less than 1:4 [0.5-11] | PV1: 102/112(0.91) | ~ 13-28 | NR | Results incomplete for this age group after mOPV3 and mOPV2 challenge |
| Verlinde (1959)(108) | PH test-seronegative [0-14] | PV1: 29/38 (0.77) PV2: 28/36 (0.78) PV3: 43/45 (0.96) |
PV1: 19 PV2: 19 PV3: 26 |
PVL: ~ 4.5 PV2: ~ 3.5 PV3: ~ 4 |
|
| Verlinde (1959)(108) | PH test-seronegative [> 14] | PV1: 2/4 (0.50) PV2: 1/4 (0.25) PV3:1/1 (1.00) |
PV1: 11 PV2: 8 PV3: 11 |
Cannot be determined | |
| Verlinde (1959)(108) | PH test-seropositive with history of LPV [0-14] | PV1: 8/26 (0.31) PV2: 9/24 (0.37) PV3: 8/15 (0.43) |
PV1: 12 PV2: 16 PV3: 9 |
PVL: ~ 3.5 PV2: ~ 3 PV3: ~ 3 |
|
| Verlinde (1959)(108) | PH test-seropositive with history of LPV [> 14] | PV1: 2/10 (0.20) PV2: 1/10 (0.10) PV3: 3/13 (0.23) |
PV1: 10 PV2: 10 PV3: 15 |
Cannot be determined |
Acronyms: Ab = antibody; CID50/g = cell- or tissue-culture infectious doses per gram of stool; IPV = inactivated poliovirus vaccine; LPV = live poliovirus; mOPV1,2,3 = monovalent OPV type 1,2,3, respectively; NR = not reported; OPV = oral poliovirus vaccine PV(1,2,3) = poliovirus (type 1, 2, 3, respectively); tOPV = trivalent OPV
Notes:
We use broader categories than the 8 immunity states because for most study arms narrower immunity states cannot be determined (see Table 2 for details)
Maximum proportion excreting over sampling period
Time interval during which proportion excreting dropped below 50% relative to the peak excretion proportion or, if available, cumulative excretion proportion
Based on mean log10 pfu on days 3 and 7 after challenge, with negative stools excluded from mean
One study(44) reports a similar difference by age among seronegatives with respect to oropharyngeal excretion, suggesting that memory immunity reduces oropharyngeal excretion. Two other studies(39, 42) reporting the results of oropharyngeal excretion among IPV-vaccinated children aged 5-9 years and likely exposed secondarily to OPV suggest that historic immunity significantly reduces the probability of oropharyngeal excretion. Unfortunately, no studies address excretion among subjects with a history of IPV vaccination but without a probable history of LPV infection(s). Thus, no data exist to support or reject hypotheses about whether the limited mucosal immunity provided by IPV further decreases with time in the absence of booster vaccinations or LPV infections and whether waning of IPV-induced immunity affects oropharyngeal excretion.
Factors affecting susceptibility, excretion, and transmission
Numerous factors impact susceptibility, excretion, and transmission, and our ability to characterize them for the recent immunity states. Given the scarcity of data from studies that meet the inclusion criteria in Tables 3, 5, 7, and 9, we also consider evidence from excluded studies that nevertheless provide relevant data on the specific issues discussed in this section.
Effect of serum antibody titers and multiple infections or successful vaccinations on excretion pattern
The data on the probability, concentration, and duration of excretion remain inconclusive about whether an inherent effect exists of the second LPV infection or third successful IPV dose. Numerous OPV challenge studies provide direct comparisons between different numbers of doses,(24, 25, 45, 60, 62, 71, 72) but none of them present results stratified by responders to each individual dose. Therefore, we cannot conclusively establish whether differences between groups reflect inherent differences in immunity to poliovirus transmission derived from the additional dose, or merely reflect the effect of the known better cumulative “take” with more doses.(14, 15) Given the known effect of additional doses on serum antibody titers,(14, 33, 100) the correlation between antibody titer and excretion represents a key relationship that affects characterization of differences within the IPV and the LPV immunity states. As discussed in the previous section, the relationship also potentially helps characterize the difference between recent and historic immunity states. Table 11 summarizes findings from multiple OPV challenge studies that provide some evidence about the relationship between serum antibody titers and excretion.
Table 11.
Summary of findings from OPV challenge studies that address relationship between serum antibody titers and excretion
| First author (year)ref [challenge] | Pre-existing immunitya | Effect of serum antibody titers on | Notes | ||
|---|---|---|---|---|---|
| Proportion with fecal excretion | Duration of fecal excretion | Concentration of virus excreted in feces | |||
| Dong (1986)(50)[tOPV] | Maternal Ab | Some effect for PV1 and PV3 but not for PV2 | NR | NR | Observed type-specific effect could be results of interference in tOPV challenge |
| Ramsay (1994)(59) [tOPV] | Probably maternal Ab | No significant effect | NAb | NR | |
| Cuba IPV Study Group (2007)(62) [tOPV] | Only IPV | No effect | NR | No effect | Based on lack of difference between 2 and 3 IPV dose groups (see text); direct correlation between Ab titers and excretion not reported |
| Henry (1966)(25) [mOPV1] | Probably only IPV | Some effect of boosted titers at low challenge dose but not at high challenge dose | Effect confounded by effect of challenge dose | High-titer excretion slightly more frequent among children without booster compared to children with booster | Children with booster were challenged at later age than those without (16 vs. 6 months) and thus had more opportunity for LPV exposure |
| Onorato (1991)(26) [mOPV1] | Probably only IPV | Effect observed but not significant | No effect | NR | Includes excretion results following low and high-dose challenges |
| Piirainen (1999)(69) [mOPV3] | Probably only IPV | NR | Small effect | Very weak | |
| Benyesh-Melnick (1967)(19) [mOPV1,2, or 3] | IPV or maternally immune and possibly LPV | No significant effect | No significant effect | NR | |
| Mohammed (2010)(67) [mOPV1] | IPV and possibly LPV | Small but significant | NR | NR | Based on observed difference among recipients of fractional IPV (116/155 excreted, 228 median PV1 Ab titers) compared to eIPV (99/157 excreted, 724 median PV1 Ab titers) |
| Glezen (1966)(39) [mOPV1] | Probably both IPV and LPV | Clear effect | Sharper decline in proportions excreting over time with higher pre-challenge titers | ≤ 1:8 : 3:24c 1:16-1:64: 2.97b ≥1:128: 2:95c |
Probably includes subjects not in a “recent” immunity state |
| Glezen (1969)(42) [tOPV] | Probably both IPV and LPV | Clear effect | NAb | No effect | Probably includes subjects not in a “recent” immunity state |
| Kogon (1965)(109)[mOPV1, tOPV, bOPV23] | Probably both IPV and LPV | Clear effect for PV1 and PV3 but not for PV2 | Clear effect for young children, less pronounced for older children and adults | NR | Probably includes subjects not in a “recent” immunity state; data not reported by challenge dose (effect of interference unclear) |
| Kok (1992)(45) [low-dose mOPV1] | Probably both IPV and LPV | No significant effect | NR | NR | Finding not reported separately for OPV and IPV arms, but most excretors were IPV only vaccinees; frequent WPV isolations during study |
| Pagano (1964)(107) [CHAT1] | Probably both IPV and LPV | Clear effect | Very clear effect | NR | Provides relationship between Ab titer and mean duration among excretors |
| Siegert (1963)(44) [mOPV1] | Probably both IPV and LPV | Clear effect | Clear effect | Clear effect | |
| Lu (2001)(77) [tOPV] | Both IPV and LPV | No significant effect | NR | NR | |
| Swartz (2008)(78) [tOPV] | Both IPV and LPV | Significant effect for PV1 and PV3, but not for PV2 | NR | NR | Excretion on day 28 occurred only for PV1 and PV3 and among subjects with high pre-challenge titers |
| Smith (1976)(102) [tOPV] | Either only LPV, or IPV and probably LPV | Clear effect | NR | NR | Relationship Ab titers and excretion combines OPV-vaccinated and IPV-vaccinated subjects |
| Henry (1966)(25) [mOPV1] | Only LPV | NR | No effect | NR | |
| Onorato (1991)(26) [mOPV1] | Only LPV | Effect observed but not significant | No effect | NR | |
| Verlinde (1959)(108) [mOPV1,2, or 3] | Only LPV | Some effect at very high titers | No clear effect | No clear effect | 2 of 98 seropositive subjects had 2 prior IPV, others were unvaccinated; sample size too small to establish significant relationships |
Acronyms: Ab = antibody; CID50/g = cell- or tissue-culture infectious doses per gram of stool; IPV = inactivated poliovirus vaccine; LPV = live poliovirus; mOPV1,2,3 = monovalent OPV type 1,2,3, respectively; NA = not applicable; NR = not reported; OPV = oral poliovirus vaccine PV(1,2,3) = poliovirus (type 1, 2, 3, respectively); tOPV = trivalent OPV
Notes:
We use different categories than the 8 immunity states because for some study arms immunity state not “recent” or cannot be determined (see Table 2 for details)
Not applicable because interference in tOPV challenge affects duration estimation
Mean positive stool specimen (in log10 CID50/g), by pre-challenge Ab titer
While maternal antibodies may affect seroconversion,(32, 43, 110) the role of maternal antibody levels on excretion remains unclear. One study(50) reported some effect of maternal antibody titers on excretion of types 1 and 3, which could imply that the greatest interference between tOPV types occurs in the absence of maternal antibodies. Another study found no effect of maternal antibodies on virus excretion following a tOPV challenge.(59)
We identified 8 studies that report a significant effect of the antibody titer following IPV vaccination on the probability of fecal excretion,(25, 39, 42, 44, 67, 78, 107, 109) However, 6 of these studies(39, 42, 44, 78, 107, 109) probably involved subjects with a history of LPV infections in addition to IPV vaccinations, based on the age of subjects and timing and setting of the study. One study among subjects probably not exposed to LPV suggests a small, significant effect, with 74.8% (i.e., 116/155) of fractional dose IPV recipients excreting mOPV1 compared to 63.1% (i.e., 99/157) of eIPV recipients excreting and median reciprocal PV1 antibody titers of 228 vs. 724 for the two groups, respectively.(67) Another study(25) among likely IPV-only vaccinees (i.e., based on exclusion of children who excreted between 2 months of age and the challenge) given 103.7 CID50 of virus or less reports 80% (i.e., 24/30) of subjects with only a primary course of IPV excreting compared to 42% (i.e., 11/26) of subjects that received a primary IPV course followed by an IPV booster. The study reports significantly higher antibody titers among subjects who received boosters, but we note the relatively greater opportunity for subjects in the booster group for undetected LPV infection, because its subjects received the challenge at 16 months compared to 6 months for the primary course group. Moreover, the primary course group included seronegatives (proportion unknown for those who received low-dose challenge) while the booster group did not. No difference in the proportion excreting occurred between the two groups for challenge doses exceeding 103.7 CID50. Within the groups of primary and booster IPV doses, the study reported that children with “higher antibody titers tended to excrete poliovirus for a limited period only,” (25, p. 8) although this finding did not control for potential differences in the challenge dose given to children with different pre-challenge antibody titers. Two other studies(26, 45) found no significant effect of antibodies on the proportion excreting despite challenging some or all subjects at doses of 103.8 CID50 or less when one might expect a greater ability of neutralizing antibodies to prevent excretion. However, one of these studies only reported the lack of effect for the low and high challenge dose combined,(26) while the other study did not report enough excretors to detect any significant effects.(45) One study among subjects with maternal immunity or IPV-induced immunity and relatively limited opportunity for natural LPV infection given young age found no effect of antibody titer on the proportion excreting following mOPV challenge.(19) The only study among IPV-only vaccinees conducted in a completely LPV-free setting found a slightly higher proportion of subjects excreting type 2 and type 3 among 52 recipients of 2 eIPV doses than among 72 recipients of 3 eIPV doses, with higher median antibody titers in the 3-dose group (304 vs. 197 for type 2, 858 vs. 723 for type 3, equal median titers for type 1).(62) Studies designed to test the relationship between antibody levels and the probability of excretion among subjects with a probable LPV infection history typically found a clear effect.(39, 42, 44, 102, 107, 109) although interestingly some more recent studies do not confirm this observation.(26, 78)
Studies that report an effect of pre-challenge titers on the duration of fecal excretion typically involved subjects with a probable LPV history,(39, 44, 107, 109) although two studies among subjects with confirmed LPV history failed to detect a significant relationship.(25, 26) For example, Pagano et al. (1964)(107) report a gradual decrease in estimated average duration of fecal excretion of CHAT1 virus from 6.7 weeks (for 13 children with pre-challenge titers of 1:10 or less) to 1.2 weeks (for 2 infected children with pre-challenge antibody titers of 1:1,250). More uncertainty exists related to the impact of exclusively IPV-induced antibody titers on duration of excretion. Piirainen et al. (1999) observed a “low degree (r = 0.17±0.45) of negative correlation … between the prechallenge antibody levels and the length of excretion.”(69, p. 1088) Onorato et al. (1991) report “no relation between pre-challenge [geometric mean titer] and duration of shedding”(26, p. 3) in either OPV or IPV vaccinees.
A few studies address the relationship between pre-challenge serum antibody titers and virus titers in feces. Glezen et al. (1969) found “no relationship of the preexisting homotypic antibody titers to the quantity of virus in a positive stool” (42, p. 152) in subjects with probable IPV- and LPV-induced immunity, although they reported poor sensitivity of their laboratory procedure to quantify low-titer viruses. An earlier study by Glezen et al. (1966),(39) however, showed a possible weak relationship, and a study by Siegert et al. (1963)(44) showed a notable reduction in fecal virus titers with increasing pre-challenge antibody titers among subjects with a likely LPV infection history. The only study that directly addresses the relationship between pre-challenge antibody titers and excretion for exclusively IPV-induced immunity reports an “even weaker, negative correlation … between the prechallenge antibody levels and the peak titres of excreted virus” than the already weak correlation between pre-challenge titers and duration of excretion.(69, p. 1088) Results from Henry et al. (1966)(25) suggest that high-titer excretion might occur slightly less frequently among subjects who received a primary course of IPV with a booster than among subjects who receive only the primary course of IPV.
Summarizing the data from Table 11, for a history of LPV exposure it appears that higher antibody titers correlate with a lower (relative) susceptibility and shorter durations of excretion. The studies remain inconsistent with respect to the impact of LPV-induced antibody titers on the concentration excreted. For people with exclusively IPV-induced immunity, most likely no effect exists of pre-challenge antibody titers on (relative) susceptibility or concentration of virus excreted, while a small effect on the duration of excretion could exist. Better quantification of the effect for both LPV and IPV-induced antibodies would help characterize differences in relative susceptibility between and within immunity states, as well as waning of immunity to poliovirus transmission.
Serotype differences in excretion patterns
The data in Table 4 from studies that used tOPV challenges show clear differences in relative susceptibility between the serotypes, but due to the effect of strain interference in the vaccine we cannot attribute the observed differences to inherent serotype differences. All but one of the mOPV challenge studies included for relative susceptibility used mOPV1, with only Parent du Chatelet et al. (2003)(75) providing data for mOPV3, which makes it impossible to compare serotypes. However, all of the data from excluded studies from Tables 3 and 4 that included arms with different monovalent challenges suggest comparable absolute susceptibility for each serotype across a range of broad pre-existing immunity categories (Table 12). The only studies that show notable differences in susceptibility and fecal excretion involve sequential administration of mOPV1, followed by mOPV3, then mOPV2 at 3- or 4-week intervals, when serotype interference remains possible.(81, 84, 108)
Table 12:
Available data on absolute susceptibility by serotype from OPV challenge studies
| Study (first author, year(ref #)) | Pre-existing immunitya | Fecal excretors/total tested (proportion) | Notes | ||
|---|---|---|---|---|---|
| PV1 | PV2 | PV3 | |||
| Abbink (2005)(89) | Serum Ab titers less than 1:8 with possible historic LPV exposure | 83/103 (0.81) | 86/115 (0.75) | Proportions excreting on peak excretion day | |
| Seropositive due to historic LPV exposure | 10/46 (0.22) | 13/44 (0.30) | |||
| Seropositive due to historic IPV vaccination and possible LPV exposure | 5/29 (0.17) | 7/39 (0.18) | |||
| Benyesh-Melnick (1967)(19) | Children up to 6 months of age with or without prior IPVb | 47/64 (0.73) | 49/56 (0.88) | 27/36 (0.75) | Proportions excreting on peak excretion day; somewhat lower excretion rates of each serotype in children 7-18 months of age |
| Drosdov (1960)(84) | PH-test seronegative children < 3 years of age | 33/33 (1) | 9/10 (0.90) | 22/22 (1) | |
| PH-test seropositive children < 3 years of age | 13/13 (1) | 6/9 (0.67) | 12/12 (1) | Most seropositives had prior LPV infection and no IPV | |
| Gelfand (1959)(46, 47) | Children aged 2-8 years with 3 IPV doses 1-2 years before challenge and likely no prior LPV infection | 18/21 (0.86) | 16/16 (1) | 18/18 (1) | Includes results from various challenge doses ranging from 3.6-7.3, 5.1-7.1, and 3.6-7.1 log CID50 of mOPV1, mOPV2, and mOPV3, respectively |
| Plotkin (1960)(43) | Previously unvaccinated infants | 92/111 (0.83) | 16/17 (0.94) | 31/38 (0.82) | |
| Sutter (2010)(53) | Unvaccinated children challenged at birth | NR (~0.21) | NR (~0.13) | NR (~0.14) | Approximately 165 children vaccinated in each arm; excretion rates at 7 days after challenge; many subjects did not respond to first dose (see Table A1) |
| Recipients of 1 prior mOPV dose | NR (~0.67) | NR (~0.76) | NR (~0.74) | ||
| Vaccine Adm. Subcom. (1966)(81) | Triple seronegative children (titers less than 1:4) less than 2 years of age | 95/103 (0.92) | 35/67 (0.52) | 83/202 (0.87) | Children fed mOPV1, then 3 then 2 at 4-week intervals; proportions excreting on peak excretion day; somewhat lower excretion rates among older children |
| Verlinde (1959)(108) | Unvaccinated homotypic PH test-seronegative children aged 0-14 years | 29/38 (0.77) | 28/36 (0.78) | 43/45 (96) | Children fed mOPV1, then 3 then 2 at 3-week intervals |
| Unvaccinated homotypic PH test-seropositive children and adults | 10/36 (0.28) | 10/34 (0.29) | 11/28 (0.39) | ||
Acronyms: CID50 = cell- or tissue-culture infectious doses; IPV = inactivated poliovirus vaccine; LPV = live poliovirus; mOPV(1,2,3) = monovalent oral poliovirus vaccine (type 1,2,3, respectively); NR = not reported; PV(1,2,3) = poliovirus (type 1, 2, 3, respectively)
Notes:
We use different categories than the 8 immunity states because for some study arms immunity state not “recent” or cannot be determined (see Tables 2 and A1 for details)
The authors combined results for unvaccinated and IPV-vaccinated subjects and noted that “prior Salk vaccination clearly had no effect on virus excretion in any of the groups”(19, p. 114)
None of the studies listed in Table 6 that allow estimation of the average time until the last positive stool specimen provide comparisons for different mOPV serotype challenges. One study among subjects with a history of IPV and likely no LPV infection found clearly higher average durations until the last positive stool specimen after mOPV3 challenge (38.6 days) compared to mOPV1 (20.5) or mOPV2 (20.6) challenges.(46, 47) However, the study found a different pattern among family contacts with similar immunological event histories, with an average of 17.5 days for type 1, 25.7 days for type 2, and 24.9 days for type 3. Two studies(19, 53) that include separate challenge arms for each serotype found no notable difference in the probability of excretion over time (Figure A1). Virus titers looked somewhat higher for type 1 compared to type 3 in one study,(84) but very similar for all three serotypes in another (Figure 6),(88) Glezen et al. (1969)(42) reported a markedly higher frequency of virus isolation from the throat for type 1 compared to types 2 and 3 following a tOPV challenge despite controlling for pre-challenge antibody titers, perhaps due to the high type 1 OPV content (106.5 CID50).
Effect of challenge dose on excretion pattern
All OPV challenge studies share the limitation that they expose subjects artificially using an orally ingested attenuated virus (limitation P). Natural exposures may involve different amounts of ingested virus (probably on the order of 103 CID50)(111) and different media (i.e., contaminated food, aerosol droplets). Five of the 66 OPV challenge studies provide data on the proportion excreting (i.e., absolute susceptibility) as a function of challenge dose, and they show a positive correlation in each immunity state (Figure 7a),(25, 26, 46, 47, 74) except for one study that does not reveal a consistent trend.(55) One other study among previously unvaccinated young infants did not find a significant trend in the range of 104 to 106 CID50 (data not shown in Figure 7a because actual titers not reported).(43) A closer look at the data from Henry et al. (1966)(25) shows that relative susceptibility increases as a function of the dose for the immunity state “2 or more LPV infections,” but not for the immunity state “3 or more successful IPV doses” (Figure 7b). Based on small numbers of subjects for each challenge dose, these data suggest that the lack of effect of IPV on susceptibility remains valid for low doses of exposure, while LPV-induced immunity provides better relative susceptibility to low exposures compared to high exposures.
The study from Onorato et al. (1991)(26) suggests a significant decrease in duration of excretion with decreasing mOPV1 challenge dose, but found “no relation between challenge dose and titer of virus shed in stool.” (26, p. 3) Tabulated data from Plotkin et al. (1959)(55) suggest a slightly longer average time until the last positive stool specimen for 35 subjects (71% with maternal antibodies > 1:8) receiving a dose of 106.2-107.5 CID50 (mean log of 6.9) compared to 44 subjects (66% with maternal antibodies > 1:8) receiving a dose of 101.5-5.8 CID50 (mean log of 4.3). Hortsmann et al. (1959)(74) isolated viruses from stool through day 13 after challenge of 8 subjects immune from LPV infection(s) challenged with 105.4 or 107.4 CID50 of mOPV1. However, they isolated no virus beyond day 7 after challenge for a similar group of 8 subjects given 102.4 or 103.4 CID50 of mOPV1, and none of these subjects exhibited a rise in antibody titers. Henry et al. (1966)(25) also challenged subjects with different doses, but we could not reconstruct excretion patterns over time for the different doses from the reported results. Gelfland et al. (1960) reported that “there appeared to be no relationship between duration and … the size of the infecting dose”(47, p. 2042) Smorodintsev et al. (1959)(112) noted no apparent relationship between excreted virus titers and vaccine dose over 104 CID50, but a notable decline at lower doses. Overall, it appears that the dose of the exposure represents an important determinant of the probability of infection, and that it may have some effect on duration and concentration of fecal excretion. Plotkin et al. (1960)(43) and Gelfand et al. (1959)(46, 47) demonstrated a clear effect of the challenge dose on the probability of oropharyngeal excretion, but the OPV challenge studies provide no clear evidence of a relationship between dose and duration or concentration of oropharyngeally excreted virus.
Anamnestic response
The presence of an anamnestic response may affect how rapidly previously infected or vaccinated individuals can clear the virus upon subsequent exposure. Evidence of an anamnestic response for poliovirus infection explains the shorter duration of excretion among infected individuals in the LPV immunity states compared to subjects in other immunity states (Table 6) and could affect the duration or concentration of immunity for seronegative individuals primed with IPV or with memory immunity (Table 10). Further study of the conditions that lead to the ability of immunes to exhibit the anamnestic response would improve our ability to characterize differences in immunity to poliovirus transmission between immunity states and its precise effect on duration and concentration of excretion.
Cut-off level of infectiousness
Estimates of the duration of fecal excretion depend on the ability of laboratory methods to isolate virus from stool specimens and these varied across studies and improved over time (Table 2). However, the cut-off level of excretion that determines individual infectiousness to others may differ from laboratory detection levels. Therefore, the duration of actual infectiousness may differ from the measured duration of excretion. The OPV challenge studies we reviewed typically use laboratory procedures capable of detecting 102 CID50 of virus per g stool.(59) Based on limited data from developed countries, the virus exposure necessary to infect a significant proportion of susceptible contacts remains below 105 CID50, but the relationship between excreted virus and actual exposure of contacts depend on total fecal and oropharyngeal output (i.e., (milli)grams of stool, milliliters of oropharyngeal excreta) and the environmental fate of excreta.(111) Frequent isolation of very low titers of virus may imply that the duration of fecal excretion overestimates the duration of infectiousness. The distinction between measured excretion and infectiousness to others extends beyond estimation of the inherent individual states of immunity to excretion. We further discuss the transmission aspects of immunity in the following subsections.
Relationship between concentration of virus excreted and infectiousness to others
The concentration of virus excreted probably affects infectiousness to others. Directly measuring the relationship between the concentrations of virus excreted and infectiousness represents a challenge given that we cannot control excretion concentrations or easily trace person-to-person transmission. However, this relationship represents a key factor that determines the dynamics of poliovirus spread and the impact of vaccination. Consequently estimates of the relationship between titers and infectiousness tend to rely on inference from experience.
Relative susceptibility, duration, and concentration of virus excretion for recent immunity states, and waning in each of the immunity states together fully characterize the level of immunity to excretion. However, the extent to which infected individuals in different immunity states participate in transmission depends not only on the extent of excretion, but also on behavioral and environmental factors, such as contact patterns, personal hygiene, and ability of poliovirus to survive in different media (e.g., fomites, food, aerosol droplets). Thus, to characterize the infectiousness of individuals excreting at different titers, we must also consider the environmental conditions.
Dowdle et al. (2006)(111) report substantial variation in human infectious doses (ID50, “defined as the concentration of virus producing infection in at least one-half of test subjects”) across studies with Sabin OPV strains and other attenuated candidate OPV strains. Some other studies reported excretion rates using a specific threshold (e.g., 102 or 104 log10 CID50 per gram of stool) that the authors hypothesized as relevant to infectiousness to others.(25, 41) Plotkin et al. (1960b)(113) report that index children excreting more than 104 CID50/g (based on a single stool) infected43% (12/28) of susceptible family contacts, while index children excreting less than 103 CID50/g infect 16% (2/12) of susceptible family contacts. While this suggest a correlation between excreted virus titers and infectiousness, significant uncertainty exists with respect to the shape of the relationship and our understanding of what constitutes “infectiousness” for different routes of transmission.
Relative contribution of fecal-oral versus oropharyngeal transmission in different settings
Characterizing the infectiousness of different titers of excreted virus becomes even more complicated when we consider different routes of transmission, and the route may matter given the differential immunity to fecal versus oropharyngeal excretion provided by IPV. Fecal-oral transmission may occur person-to-person via hands, water/food, and/or fomites, while oropharyngeal transmission may occur directly from person-to-person or via fomites. Thus, sanitation, water quality, and personal hygiene play a relatively greater role in fecal-oral transmission, while personal interactions may represent a more important factor for oropharyngeal transmission. Studies from the pre-vaccine era and Virus Watch Program shed some light on transmission routes.(46, 47, 80, 114–117) While we did not comprehensively review this literature, the uncertain consensus from reviews(14, 27, 111) appears to suggest primarily fecal-oral transmission in high-transmissibility settings, with a relatively greater role of oropharyngeal transmission in low-transmissibility settings. As described above, the duration of fecal excretion appears much longer than that of oropharyngeal excretion, which implies a potentially relatively longer exposure period for the fecal-oral compared to the oropharyngeal route. Various studies document the presence of WPV or OPV viruses following a challenge in sewage, privies, floors, external body parts of infected subjects including hands, and flies.(46, 47, 118, 119) Gelfland et al. (1959)(46, 47) documented infections of family contacts of index children fed mOPV both in the presence and absence of oropharyngeal excretion by the index child, with a slightly higher rate of secondary infections when the index child excreted detectable virus from the oropharynx. They documented 6 infections among 15 extra-household contacts with a history of IPV and no LPV when the index infection excreted from the oropharynx, but 0 infections among 3 similar extra-household contacts when the index infection did not excrete from the oropharynx. However, due to the absence of data on excreted virus titers, we cannot establish whether a possible correlation between fecal virus titers and oropharyngeal excretion explains the greater spread from oropharyngeal excretors, or whether the occurrence of oropharyngeal excretion by itself explains the greater spread. Gelfand et al. (1959)(80) and others(117) hypothesize oropharyngeal transmission as a predominant mode for interfamilial spread given the reduced occurrence of interfamilial transmission following the introduction of IPV in the US and very limited effect of IPV on intrafamilial transmission.(79) Using candidate OPV strains, Plotkin et al. (1960b)(113) found viral spread within 5 of 7 (71%) New Jersey families when the index child excreted from the oropharynx and viral spread in 20 of 38 (53%) families when the index child did not excrete from the oropharynx. To test whether oropharyngeal excretors coincided with subjects excreting more virus from feces, they titrated one stool from each type 1 excretor during the second week of excretion. 3 of 5 (80%) oropharyngeal excretors excreted fecal virus at titers of over 104 CID50/g compared to 6 of 12 (50%) subjects who did not excrete from the oropharynx. Due to the low numbers of titrated stools and the compounding effect of oropharyngeal excretion and fecal virus titers, the role of oropharyngeal excretion remains uncertain even in relatively low poliovirus transmissibility settings. The experience in the US and other countries suggests that the IPV-induced combined reduction in susceptibility and concentration of virus excreted from the oropharynx led to some level of herd immunity given that unvaccinated people also benefitted from the introduction of IPV in 1955.(15, 117, 120–122)
Effect of strain differences on excretion and transmission
Relative susceptibility and excretion patterns could also differ between attenuated and non-attenuated (i.e., wild or vaccine-derived) polioviruses. Given that no practical or ethical feasible study design exists to directly compare exposure to OPV and WPV, we can only rely on limited evidence from in vitro studies on virus properties(19, 56, 57, 83, 123) and observations from field studies. Studies reporting WPV excretion among both susceptibles and IPV-vaccinated and/or previously LPV-infected contacts of index infections yield relative susceptibility estimates comparable to those based on OPV challenge studies (Table 13).(79, 114–116, 124) However, these comparisons remain inconclusive, because the serotype, dose, timing, and/or fraction of subjects exposed differs between WPV excretion and OPV challenge studies. Studies examining excretion patterns for OPV and OPV-derived viruses (i.e., after one or more human passages) found no evidence of differences in duration and concentration of virus excretion between fully attenuated and some partially reverted OPV viruses.(46, 47, 123) Thus, we did not identify any direct evidence to reject or confirm differences in relative susceptibility and excretion patterns with respect to strains.
Table 13:
Summary of findings from selected studies on wild poliovirus excretion
| First author (year)ref[location, serotype(s)] | Pre-existing immunitya | Number infected/number exposed (proportion) | Relative susceptibility | Average duration of fecal excretion in days | Cumulative mean fecal virus titers [log10 CID50/g] (#positive isolates) | Notes |
|---|---|---|---|---|---|---|
| Gelfand (1959)(80) [Louisiana, all types] | Fully susceptible | 273/302 (0.90) | 1 | Cannot be reliably determined | 4.2 (111)c | Number of “exposed” contacts include the index infection, who is infected by definition (bias towards higher proportions excreting, applies to all groups in this study) |
| Gelfand (1959)(80) [Louisiana, all types] | 2 successful IPV doses | 96/111 (0.86) | 0.96b | Cannot be reliably determined | 4.9 (85)c | Observed duration somewhat shorter than for fully susceptibles, but more frequent specimen collection |
| Gelfand (1959)(80) [Louisiana, all types] | ≥ 3 successful IPV doses | 17/19 (0.89) | 0.99b | Cannot be reliably determined | 4.7 (17)c | Observed duration somewhat shorter than for 2 IPV withslightly more frequent specimen collection |
| Gelfand (1959)(80) [Louisiana, all types] | 1 or more LPV infections | 70/329 (0.21) | 0.24b | Cannot be reliably determined | 3.5 (20)c | Titers for naturally immunes with or without IPV combined |
| Gelfand (1959)(80) [Louisiana, all types] | IPV and LPV | 28/165 (0.17) | 0.19b | Cannot be reliably determined | 3.5 (20)c | Titers for naturally immunes with or without IPV combined |
| Gelfand (1957)(116) [Louisiana, all types] | Fully susceptible (contacts for proportion infected; index infections for duration) | Positive stool: 17/20 (0.85) Seroconversions: 21/25 (0.84) |
1 | 24 | NR | Average time between first and last positive stool among 110 index infections; does not include average of 27 days each between last negative and first positive and last positive and first negative; includes 36/110 (33%) with only 1 positive stool (i.e., duration 1 day). |
| Gelfand (1957)(116) [Louisiana, all types] | Adult or older sibling with serum Ab titers less than 1:2 | Positive stool: 115/123 (0.93) Seroconversions: 40/84 (0.84) | ~ 1 | NR | NR | Number |
| Gelfand (1957)(116) [Louisiana, all types] | 1 or more LPV infections | Positive stool: 7/205 (0.03) Seroconversions: 61/304 (0.20) |
<0.24 | NR | NR | Seropositives |
| Wehrle (1958)(145) [USA, all types] | Unvaccinated (ages 0-14) | 16/23 (0.70) | 1 | NR | ~ 2.8 | Only 9 children in 0-4 bracket |
| Wehrle (1958)(145) [USA, all types] | 2 or more prior IPV (ages 0-14) | 8/14 (0.57) | 0.82 | NR | ~ 2.25 | Only 3 children in 0-4 bracket; includes 1 child with only 1 prior IPV dose |
| Wehrle (1961)(48) [NY state, all types] | Unvaccinated (ages 0-9) | 10/13 (0.77) | 1 | Includes some with 1 prior IPV | ||
| Wehrle (1961)(48) [NY state, all types] | 2 or more prior IPV doses | 10/21 (0.48) | 0.62 |
Acronyms: CID50/g = cell- or tissue-culture infectious doses per gram of stool; IPV = inactivated poliovirus vaccine; LPV = live poliovirus; NR = not reported; NY = New York
Notes:
We use different categories than the 8 immunity states because for some study arms immunity state not “recent” or cannot be determined (see Table 2 and A1 for details)
Uncontrolled comparisons: detection of infection relied more on serology before, and more on virus isolation after, IPV introduction
Titers for first positive specimen from excretors
Transmissibility of OPV vs. WPV
Fine and Carneiro (1999)(28, 125) reviewed studies of attack rates following documented infection of index patients. Table 14 summarizes some results from selected studies. Infection rates among contacts of an index infection depend heavily on the immunity state of the contacts, which complicates comparison across studies. To control for the immunity state of contacts, we focus on those studies that report infection rates among likely fully susceptible or only IPV-vaccinated contacts of index infections (i.e., secondary attack rates). Comparing estimates across studies nevertheless remains problematic given the widely varying settings (e.g., family, institution, community), methods, and assumptions. The general pattern that emerges from Table 14 suggests somewhat lower proportions of susceptible contacts infected from index OPV infections compared to WPV infections. Although Table 14 focuses on secondary attack rates, some studies reporting overall attack rates yield relevant insights. For example, Benyesh-Melnick et al. (1959)(126) gave OPV to index family members and found that 7% of 227 family contacts of all ages and 47% of 72 contacts aged 5 years or less excreted the vaccine virus and thus showed evidence of intrafamilial transmission, but none of 38 community contacts (i.e., subjects without a family contact to an OPV recipient, including 16 children aged 5 years or less) excreted vaccine virus. Sabin et al. (1961)(127) detected polioviruses among community contacts in various immunity states with and without vaccinated family members, with a somewhat higher isolation rate among contacts of vaccinated family members after widespread use of OPV. Thus, transmission of OPV occurs (almost) as efficiently as WPV in close contact settings, but a greater difference may exist for community spread, although to our knowledge no suitable WPV comparison exists.
Table 14:
Selected results from studies measuring contact spread among a minimum of 10 susceptible contacts or contacts with a history of IPV and little or no LPV (noted in last column).
| Virus, type of contact | Presumed susceptible contacts infected | Number of presumed susceptible contacts | Estimated secondary attack rate | Notes | |
|---|---|---|---|---|---|
| Study and details | |||||
| WPV, close contact | |||||
| Bhatt (1955)(124), Louisiana, PV1&2 | Susceptible household contacts defined as neither PV1- nor PV2-seropositive | ||||
| - 0-4 years | 13 | 14 | 1.00 | ||
| - All ages | 21 | 25 | 0.84 | ||
| Bodian (1954)(146), Baltimore and Rochester | Lower bounds based on 10-fold increase in serum Ab (virus isolation only 55%) | ||||
| PV1&2 | 33 | 51 | 0.65 | ||
| Gelfand (1957)(116), Louisiana, not typed | 136 | 148 | 0.92 | ||
| Marine (1962)(79), Rhode Island, PV1 | |||||
| - 0-4 years (seronegative) | 17 | 19 | 0.89 | ||
| - 5-14 years (seronegative) | 14 | 18 | 0.78 | ||
| - No IPV (0-4 years) | 20 | 21 | 0.95 | ||
| - IPV (0-4 years) | 30 | 36 | 0.83 | ||
| Isacson (1967)(147), Phoenix, all types | Based on seroconversion of susceptible family contacts | ||||
| - Lower SES | 36 | 48 | 0.75 | ||
| - Higher SES | 22 | 36 | 0.61 | ||
| OPV candidate strains, close contact | |||||
| Plotkin (1960b)(113), New Jersey | Contacts were family members and the majority was IPV-vaccinated; susceptible defined by evidence of excretion after contacts were family members and the majority was IPV-vaccinated; susceptible defined by evidence of excretion after contact or subsequent challenge with LPV; 10 of 33 sibling contact infections occurred after infection of a first contact of the index child (i.e., possible “tertiary” infections) | ||||
| - PV1 (all ages) | 16 | 46 | 0.35 | ||
| - PV2 (all ages) | 8 | 29 | 0.28 | ||
| - PV3 (all ages) | 14 | 51 | 0.27 | ||
| - Children (all types) | 33 | 79 | 0.42 | ||
| - Adults (all types) | 5 | 47 | 0.11 | ||
| OPV, close contact | |||||
| Benyesh-Melnick (1967)(19), Houston | Based on peak rather than cumulative excretion rate; family contacts had IPV but no OPV; numbers restricted to contacts < 3 years of age to minimize probability of previous LPV infection; attack rates for tOPV index infections excluded | ||||
| - PV1 | 16 | 34 | 0.47 | ||
| - PV2 | 23 | 36 | 0.64 | ||
| - PV3 | 12 | 35 | 0.34 | ||
| Drosdov (1961)(84), Estonia, PV1 | 10 | 10 | 1.00 | ||
| Gelfand (1959)(46, 47) | |||||
| - PV1 (all SES) | 11 | 51 | 0.22 | ||
| - PV2 (all SES) | 14 | 45 | 0.31 | ||
| - PV3 (all SES) | 25 | 56 | 0.45 | Index infections and susceptible family contacts had history of 3 IPV doses but no LPV infections in past 4 years (“natural-susceptible”) | |
| - Upper SES (all serotypes) | 5 | 63 | 0.08 | ||
| - Lower SES (all serotypes) | 45 | 89 | 0.51 | ||
| Horstmann (1959)(74), Connecticut, PV1 | 12 | 13 | 0.92 | IPV-vaccinated institutional contacts | |
| Koroleva (1960)(139), Moscow | |||||
| - PV1 | 7 | 17 | 0.41 | ||
| - PV2 | 11 | 13 | 0.85 | ||
| - PV3 | 8 | 15 | 0.53 | Spread to unvaccinated, seronegatives in children’s homes as a result of vaccinating 71 of 92 children (i.e., multiple index infections per contact) | |
| - Smorodintsev (1959)(112), St. Petersburg | |||||
| - PV1 | NR | < 70 | 0.53 | ||
| - PV2 | NR | < 70 | 0.80 | ||
| - PV3 | NR | < 70 | 0.73 | Spread to unvaccinated, mostly seronegative (70%) contacts in children’s homes in 19 weeks following vaccination of 30-50% children (i.e., multiple index infections per contact); based on peak rather than cumulative excretion rates; number and percentage of index infections per unit unclear | |
| Vaccine Admin. Subcomm. (1966)(81), Japana | |||||
| - PV1 (family or nursery) | 27 | 78 | 0.35 | ||
| - PV2 (family or nursery) | 22 | 85 | 0.26 | ||
| - PV3 (family or nursery) | 14 | 72 | 0.19 | ||
| - Family (all serotypes) | 28 | 155 | 0.18 | ||
| - Nursery (all serotypes) | 35 | 80 | 0.44 | ||
| OPV, community contact | |||||
| Benyesh-Melnick (1967)(19), Houston | Based on peak rather than cumulative excretion rates; extrafamilial contacts had IPV but no OPV; includes only mOPV index infections | ||||
| - PV1 | 6 | 136 | 0.02 | ||
| - PV2 | 12 | 69 | 0.17 | ||
| - PV3 | 20 | 101 | 0.20 | ||
| Gelfand (1959)(46, 47), Lousiana PV1&3 | 6 | 18 | 0.33 | Infections among “natural-susceptible” (i.e., with 3 IPV and no LPV) extra-household contacts who had played with OPV-challenged index children in lower SES households | |
| Roca-Garcia (1964)(143), Costa Rica | Alternate houses received tOPV; 28.3, 15.9, 8.7 % of subjects seronegative for PV1,2, and 3, respectively, before vaccination started | ||||
| - PV1 | 61 | 106 | 0.58 | ||
| - PV2 | 2 | 63 | 0.03 | ||
| - PV3 | 12 | 42 | 0.29 | ||
Acronyms: Ab = antibody; IPV = inactivated poliovirus vaccine; LPV = live poliovirus; NR = not reported; OPV = oral poliovirus vaccine; PV(1,2,3) = poliovirus (type 1, 2, 3, respectively); SES = socio-economic status; tOPV = trivalent oral poliovirus vaccine
DISCUSSION
This expert review provides an overview of the data available to characterize immunity to poliovirus transmission in different immunity states in the context of developing inputs for dynamic models of poliovirus transmission required to support risk and policy analyses. Based on 66 OPV challenge studies, supplemented with other evidence, we summarized a large amount of data related to poliovirus transmission and excretion. Despite the large number of studies, we find one or more limitations in each study, which leads to only moderate overall grades for the evidence for some topics and low and very low grades for other topics. Thus, limited data exist to support quantification of some model inputs.
Among the topics we reviewed, we find the greatest weight of the evidence for relative susceptibility, followed by the duration and concentration of fecal excretion. The available data strongly suggest that LPV infection provides better protection from fecal excretion than exclusive IPV-induced immunity provides. While LPV infections clearly reduce the susceptibility, duration, and concentration of excretion in the feces upon subsequent exposure, IPV shows a very limited effect, if any, on susceptibility, and a moderate effect at best on duration and concentration of excretion. Very few OPV challenge studies address oropharyngeal excretion in much detail, although relatively strong evidence suggests that good protection from oropharyngeal excretion exists both for recently LPV-infected and IPV-vaccinated individuals.
The effect of waning of immunity on excretion remains very poorly represented in OPV challenge studies, with no study adequately addressing the relationship between the time since the last immunological event and excretion probability, duration, and/or concentration. Nevertheless, the known decrease in antibody titers with time and the data available on the effect of antibodies on excretion provide strong evidence that the time since the last immunological event affects re-infection and excretion. Unfortunately, gaps remain in our knowledge about whether antibody titers induced from IPV alone correlate significantly with fecal excretion and about the relationship between antibody titers and oropharyngeal excretion. All OPV challenge studies share the limitation of failing to provide a model of natural exposure, and in this context the effect of challenge dose on excretion represents an important consideration that clearly affects the probability of infection and possibly also affects the duration of excretion and titers. No inherent substantial differences between serotypes appear to exist with respect to excretion, although definitive data do not exist. Differences in excretion and transmission of infection following WPV versus OPV exposure may exist, but they remain difficult to study given the ethical and practical impossibility of comparing both in the same study. Further study of the nature and likelihood of an anamnestic response for different exposure histories and its quantitative effect on susceptibility and excretion would help characterize the variability in excretion patterns within immunity states.
Based on the data reviewed, the set of 8 immunity states appears to cover the most important inherent differences in immunity, variability within immunity states notwithstanding. Some of these immunity states might behave similarly with respect to one or more aspects of immunity to poliovirus transmission (e.g., fully susceptibles and maternally immunes, all IPV-only states, all states involving LPV). However, the relationship between antibody titers and immunity to poliovirus transmission suggest some difference between the states of 1 and 2 or more LPV infections given that more infections lead to higher antibody levels. Similarly, the effect of multiple IPV doses on serum antibody titers may also lead to differences between the IPV-only states, although the existence of a relationship between exclusively IPV-induced antibody titers and immunity to poliovirus transmission remains inconclusive. If no such relationship exists, then recent 2 IPV and 3 or more IPV states would behave similarly, although addition of the third successful IPV dose could affect antibody persistence and oropharyngeal immunity. Given the limited effect of IPV on fecal excretion, the mixed IPV and LPV state may behave similarly to the LPV-only states in terms of fecal excretion. If one assumes no effect of IPV added to LPV, than logically the IPV and LPV state becomes redundant and individuals with a mixed history would reside either in the 1 LPV or 2 or more LPV immunity states, which violates our assumptions that all mixed IPV and LPV states remains essentially the same. However, it appears that IPV can boost mucosal immunity in previously LPV-infected individuals(96) so that IPV and LPV become equivalent to 2 or more LPV in terms of mucosal immunity. Moreover, the addition of successful IPV affects serum antibody titers and possibly also persistence and oropharyngeal excretion. Therefore, we believe that models should at a minimum include an IPV and LPV state when appropriate to test the sensitivity to assumptions about the effect of adding IPV.
The relationship between excretion and infectiousness to others remains a major area of uncertainty. The relative contribution of oropharyngeal excretion in various developing country settings may drive the ability of IPV to stop or reduce transmission in those settings. With new technologies that reduce the costs of IPV under development,(128, 129) IPV represents an important option because it offers relatively higher seroconversion rates in poor hygiene settings compared to OPV.(14, 15, 23, 130) Even if fecal excretion dominates, the possible small reduction that IPV produces in excreted (log) virus titers in feces could affect transmission at the population level. However, this depends entirely on the highly uncertain relationship between excreted virus titers and the probability of infecting others. The best data to inform IPV decisions could derive from relatively large, controlled studies, although small scale studies of excretion and transmission might help reduce uncertainty as well.
Despite the sufficient evidence to draw qualitative inferences in some areas of this review, the limitations that we identified complicate derivation of quantitative estimates for model inputs. Besides the fact that OPV challenge study results differ from natural exposure, the most important and common limitations across the studies include: 1) the absence of serological data to confirm the immunological event, 2) the possibility of undocumented natural LPV infections, 3) interference between serotypes following simultaneous challenge with 2 or more serotypes, 4) poor sensitivity of study design or laboratory methods with respect to detecting excretion, and 5) lack of statistical power. Thus, even quantification of model inputs for which data exist requires assessing the effect of these serious limitations on the results, and this involves some amount of judgment. Dealing with these limitations motivates the use of expert judgment to provide quantitative assessments of model inputs and represent the scientific consensus.(16) Our use of an iterative process for identifying the limitations of the studies included in the review may have missed some limitations and despite our efforts to ensure completeness and consistency, some inconsistencies may exist, particularly due to the wide range of methods used over several decades. In addition, our search may have missed some studies, and new evidence will continue to emerge.
We hope that this expert review will help the development of future risk models designed to inform important policy questions and to better reflect the state of the scientific evidence. Moreover, inclusion in the models of the uncertainty revealed during this process will help policy makers appreciate the overall uncertainty involved in decisions. Finally, we expect that by facilitating the identification of key sources of uncertainty, this expert review will help guide research to reduce these uncertainties.(16)
Supplementary Material
LIST OF ABBREVIATIONS
We provide the following list of abbreviations for reference.
- Ab
antibody (generic term)
- bOPV
bivalent oral poliovirus vaccine
- CID50
cell- or tissue-culture infectious doses
- CDC
US Centers for Disease Control and Prevention
- cVDPV
circulating vaccine-derived poliovirus
- eIPV
enhanced-potency inactivated poliovirus vaccine
- IgA
immunoglobulin A
- IgG
immunoglobulin G
- IgM
immunoglobulin M
- IPV
inactivated poliovirus vaccine
- iVDPV
immunodeficient vaccine-derived poliovirus
- IU
international units
- LPV
live poliovirus (i.e., WPV, OPV, OPV-related, or VDPV)
- MK
monkey kidney tissue culture
- mOPV
monovalent oral poliovirus vaccine (generic term)
- mOPV1,2,3
monovalent oral poliovirus vaccine types 1,2,3, respectively
- NID
national immunization day
- NA
not applicable
- NR
not reported
- OPV
oral poliovirus vaccine (generic term)
- PCR
polymerase chain reaction
- pfu
plaque-forming unit
- PV
poliovirus (generic term)
- PV1,2,3
poliovirus type 1,2,3, respectively (generic term)
- RT-PCR
reverse transcriptase PCR
- SES
socio-economic status
- SIR
susceptible-infected-removed
- tOPV
trivalent oral poliovirus vaccine
- UK
United Kingdom
- USA
United States of America
- VDPV
vaccine-derived poliovirus (generic term)
- WHO
World Health Organization
- WPV
wild poliovirus (generic term)
- WPV1,2,3
wild poliovirus type 1,2,3, respectively
References:
- 1.World Health Assembly. Global eradication of poliomyelitis by the year 2000 (resolution 41.28) Geneva: World Health Organization; 1988. http://www.who.int/csr/ihr/polioresolution4128en.pdf [Google Scholar]
- 2.World Health Organization. Global Polio Eradication Initiative - Strategic Plan 2010-2012. Geneva; 2010. Report No.: WHO/Polio/10.01. [Google Scholar]
- 3.World Health Assembly. Poliomyelitis: Mechanism for management of potential risks to eradication (resolution 61.1). Geneva: World Health Organization; 2008. http://apps.who.int/gb/ebwha/pdf_files/WHA61-REC1/A61_Rec1-part2-en.pdf [Google Scholar]
- 4.Thompson KM, Pallansch MA, Duintjer Tebbens RJ, Wassilak SG, Kim J-H, Cochi SL. Pre-eradication vaccine policy options for poliovirus infection and disease control. Risk Analysis: Submitted. [DOI] [PMC free article] [PubMed] [Google Scholar]
- 5.Sangrujee N, Duintjer Tebbens RJ, Cáceres VM, Thompson KM. Policy decision options during the first 5 years following certification of polio eradication. Medscape General Medicine 2003;5(4):35. [PubMed] [Google Scholar]
- 6.Thompson KM, Duintjer Tebbens RJ. Current polio global eradication and control policy options: Perspectives from modeling and prerequisites for OPV cessation. Expert Reviews of Vaccines 2012;11(4):449–459. [DOI] [PubMed] [Google Scholar]
- 7.Anderson RM, May RM. Infectious diseases of humans: Dynamics and control. New York: Oxford University Press; 1991. [Google Scholar]
- 8.Duintjer Tebbens RJ, Pallansch MA, Kew OM, Cáceres VM, Sutter RW, Thompson KM. A dynamic model of poliomyelitis outbreaks: Learning from the past to help inform the future. American Journal of Epidemiology 2005;162(4):358–372. [DOI] [PubMed] [Google Scholar]
- 9.Duintjer Tebbens RJ, Pallansch MA, Kew OM, Cáceres VM, Jafari H, Cochi SL, Aylward RB, Thompson KM. Risks of paralytic disease due to wild or vaccine-derived poliovirus after eradication. Risk Analysis 2006;26(6):1471–1505. [DOI] [PubMed] [Google Scholar]
- 10.Duintjer Tebbens RJ, Pallansch MA, Kew OM, Sutter RW, Aylward RB, Watkins M, Gary HE Jr., Alexander JP Jr., Jafari H, Cochi SL, Thompson KM. Uncertainty and sensitivity analyses of a decision analytic model for post-eradication polio risk management. Risk Analysis 2008;28(4):855–876. [DOI] [PubMed] [Google Scholar]
- 11.Edmunds WJ, Medley GF, Nokes DJ. Evaluating the cost-effectiveness of vaccination programmes: A dynamic perspective. Statistics in Medicine 1999;18(23):3263–82. [DOI] [PubMed] [Google Scholar]
- 12.Thompson KM, Duintjer Tebbens RJ, Pallansch MA, Kew OM, Sutter RW, Aylward RB, Watkins M, Gary HE Jr., Alexander JP Jr., Jafari H, Cochi SL. The risks, costs, and benefits of possible future global policies for managing polioviruses. American Journal of Public Health 2008;98(7):1322–1330. [DOI] [PMC free article] [PubMed] [Google Scholar]
- 13.Duintjer Tebbens RJ, Thompson KM, Hunink M, Mazzuchi TM, Lewandowski D, Kurowicka D, Cooke RM. Uncertainty and sensitivity analyses of a dynamic economic evaluation model for vaccination programs. Medical Decision Making 2008;28(2):182–200. [DOI] [PubMed] [Google Scholar]
- 14.Sutter RW, Kew OM, Cochi SL. Poliovirus vaccine-live In: Plotkin SA, Orenstein WA, Offit PA, editors. Vaccines. Fifth ed: Saunders Elsevier; 2008. p. 631–686. [Google Scholar]
- 15.Plotkin SA, Vidor E. Poliovirus vaccine -- inactivated In: Plotkin SA, Orenstein WA, Offit PA, editors. Vaccines. Fifth ed: Saunders Elsevier; 2008. [Google Scholar]
- 16.Duintjer Tebbens RJ, Pallansch MA, Chumakov KM, Halsey NA, Hovi T, Minor PD, Modlin JF, Patriarca PA, Sutter RW, Wright PF, Wassilak SGF, Cochi SL, Kim J-H, Thompson KM. Review and assessment of poliovirus immunity and transmission: Synthesis of knowledge gaps and identification of research needs. Risk Analysis:Submitted. [DOI] [PMC free article] [PubMed] [Google Scholar]
- 17.Thompson KM, Pallansch MA, Duintjer Tebbens RJ, Wassilak SGF, Cochi SL. Modeling population immunity to support efforts to end the transmission of live polioviruses. Risk Analysis:In Press. [DOI] [PMC free article] [PubMed] [Google Scholar]
- 18.Chen RT, Hausinger S, Dajani AS, Hanfling M, Baughman AL, Pallansch MA, Patriarca PA. Seroprevalence of antibody against poliovirus in inner-city preschool children. Journal of the American Medical Association 1996;275(21):1639–1645. [PubMed] [Google Scholar]
- 19.Benyesh-Melnick M, Melnick JL, Rawls WE, Wimberly I, Barrera Ora J, Ben-Porath E, Rennick V. Studies of the immunogenicity, communicability and genetic stability of oral poliovaccine administered during the winter. American Journal of Epidemiology 1967;86(1):112–136. [DOI] [PubMed] [Google Scholar]
- 20.WHO Collaborative Study Group on Oral and Inactivated Poliovirus Vaccines. Combined immunization of infants with oral and inactivated poliovirus vaccines: Results of a randomized trial in the Gambia, Oman, and Thailand. WHO collaborative study group on oral and inactivated poliovirus vaccines. Bulletin of the World Health Organization 1996;74(3):253–268. [PMC free article] [PubMed] [Google Scholar]
- 21.Más Lago P, Bravo JR, Andrus JK, Comellas MM, Galindo MA, de Quadros CA, Bell E. Lesson from Cuba: Mass campaign administration of trivalent oral poliovirus vaccine and seroprevalence of poliovirus neutralizing antibodies. Bulletin of the World Health Organization 1994;72(2):221–5. [PMC free article] [PubMed] [Google Scholar]
- 22.WHO Collaborative Study Group on Oral and Inactivated Poliovirus Vaccines. Combined immunization of infants with oral and inactivated poliovirus vaccines: Results of a randomized trial in the Gambia, Oman, and Thailand. WHO collaborative study group on oral and inactivated poliovirus vaccines. Journal of Infectious Diseases 1997;175 Suppl 1:S215–S227. [DOI] [PubMed] [Google Scholar]
- 23.Patriarca PA, Wright PF, John TJ. Factors affecting the immunogenicity of oral poliovirus vaccine in developing countries: Review. Reviews of Infectious Diseases 1991;13:926–39. [DOI] [PubMed] [Google Scholar]
- 24.Ghendon YZ, Sanakoyeva II. Comparison of the resistance of the intestinal tract to poliomyelitis virus (Sabin’s strains) in persons after naturally and experimentally acquired immunity. Acta Virologica 1961;5:265–73. [Google Scholar]
- 25.Henry JL, Jaikaran ES, Mason PJ, Barnes JM, Beale AJ. A study of polio vaccination in infancy: Excretion following challenge with live virus by children given killed or living poliovaccine. Journal of Hygiene Cambridge 1966;64:105–120. [DOI] [PMC free article] [PubMed] [Google Scholar]
- 26.Onorato IM, Modlin JF, McBean MA, Thoms ML, Losonsky GA, Bernier RH. Mucosal immunity induced by enhanced-potency inactivated and oral polio vaccines. Journal of Infectious Diseases 1991;163:1–6. [DOI] [PubMed] [Google Scholar]
- 27.Melnick JL. Poliovirus and other enteroviruses In: Evans AS, Kaslow RA, editors. Viral infections of humans: Epidemiology and control. 4th ed. New York: Plenum Medical; 1997. p.583–663. [Google Scholar]
- 28.Fine PEM, Carneiro IAM. Transmissibility and persistence of oral poliovirus vaccine viruses: Implications for the global poliomyelitis eradication initiative. London: Infectious Disease Epidemiology Unit, Department of Infectious and Tropical Diseases, London School of Hygiene; 1998. May. [Google Scholar]
- 29.Rahmandad H, Hu K, Duintjer Tebbens RJ, Thompson KM. Development of an individual-based model for polioviruses: Implications of the selection of network type and outcome metrics. Epidemiology and Infection 2010;139(6):836–848. [DOI] [PubMed] [Google Scholar]
- 30.Thompson KM, Duintjer Tebbens RJ. Retrospective cost-effectiveness analyses for polio vaccination in the United States. Risk Analysis 2006;26(6):1423–1440. [DOI] [PubMed] [Google Scholar]
- 31.Thompson KM, Duintjer Tebbens RJ. Eradication versus control for poliomyelitis: An economic analysis. Lancet 2007;369(9570):1363–1371. [DOI] [PubMed] [Google Scholar]
- 32.Halsey N, Galazka A. The efficacy of DPT and oral poliomyelitis immunization schedules initiated from birth to 12 weeks of age. Bulletin of the World Health Organization 1985;63(6):1151–69. [PMC free article] [PubMed] [Google Scholar]
- 33.Murdin AD, Barreto L, Plotkin SA. Inactivated poliovirus vaccine: Past and present experience. Vaccine 1996;14(8):735–746. [DOI] [PubMed] [Google Scholar]
- 34.Alexander JP Jr., Gary HE Jr., Pallansch MA. Duration of poliovirus excretion and its implications for acute flaccid paralysis surveillance: A review of the literature. Journal of Infectious Diseases 1997;175(Suppl. 1):S176–82. [DOI] [PubMed] [Google Scholar]
- 35.Guyatt GH, Oxman AD, Vist GE, Kunz R, Falck-Ytter Y, Alonso-Coello P, Schünemann HJ. GRADE: An emerging consensus on rating quality of evidence and strength of recommendations. British Medical Journal 2008;336:924–926. [DOI] [PMC free article] [PubMed] [Google Scholar]
- 36.Más Lago P Eradication of poliomyelitis in Cuba: A historical perspective. Bulletin of the World Health Organization 1999;77(8):681–7. [PMC free article] [PubMed] [Google Scholar]
- 37.Más Lago P, Gary HE Jr., Pérez LS, Cáceres VM, Olivera JB, Puentes RP, Corredor MB, Jimenez P, Pallansch MA, González Cruz R. Poliovirus detection in wastewater and stools following an immunization campaign in Havana, Cuba. International Journal of Epidemiology 2003;32:772–777. [DOI] [PubMed] [Google Scholar]
- 38.World Health Organization. Polio laboratory manual. Geneva; 2004. November Report No.: WHO/IVB/04.10. [Google Scholar]
- 39.Glezen WP, Lamb GA, Belden EA, Chin TD. Quantitative relationship of preexisting homotypic antibodies to the excretion of attenuated poliovirus type 1. American Journal of Epidemiology 1966;83 (2) :224–237. [DOI] [PubMed] [Google Scholar]
- 40.John TJ. Role of injectable and oral polio vaccines in polio eradication. Expert Reviews of Vaccines 2009;8(1):5–8. [DOI] [PubMed] [Google Scholar]
- 41.Dick GWA, Dane DS, McAlister J, Briggs M, Nelson R. Effect of previous Salk vaccination on excretion. British Medical Journal 1961:266–269. [DOI] [PMC free article] [PubMed] [Google Scholar]
- 42.Glezen PW, McCollough RH, Lamb GA, Chin TDY. Quantitative relationship of preexisting homotypic antibodies to excretion of poliovirus types 1, 2, and 3 following the feeding of trivalent attenuated poliovirus vaccine. American Journal of Epidemiology 1969;90(2):146–156. [DOI] [PubMed] [Google Scholar]
- 43.Plotkin SA, Pagano JS, Koprowski H. Vaccination of full-term infants with attenuated polioviruses 2nd International Conference on Live Poliomyelitis Vaccines. Washington, D.C.: Pan American Health Organization; 1960. p. 294–301. [Google Scholar]
- 44.Siegert R, Enders-Ruckle G, Oehme J, Waller D. Der einfluß der prävakzinalen immunität auf die virusausscheidung und antikörperproduktion nach polioschluckimpfung mit typ i (Sabin) [the effect of prevaccinal immunity on virus excretion and antibody production after polio immunization with type i (Sabin)]. Deutsche medizinische Wochenschrift 1963;88(33):1586–1594. [DOI] [PubMed] [Google Scholar]
- 45.Kok PW, Leeuwenburg J, Tukei P, van Wezel AL, Kapsenberg JG, van Steenis G, Galazka A, Robertson SE, Robinson D. Serological and virological assessment of oral and inactivated poliovirus vaccines in a rural population in Kenya. Bulletin of the World Health Organization 1992;70(1):93–103. [PMC free article] [PubMed] [Google Scholar]
- 46.Gelfand HM, Potash L, LeBlanc DR, Fox JP. Revised preliminary report on the Louisiana observations of the natural spread within families of living vaccine strains of poliovirus. 1st International Conference on Live Poliovirus Vaccines; 1959. p. 203–17. [Google Scholar]
- 47.Gelfand HM, Potash L, Leblanc DR, Fox JP. Intrafamilial and interfamilial spread of living vaccine strains of polioviruses. Journal of the American Medical Association 1959;170(17):2039–2048. [DOI] [PubMed] [Google Scholar]
- 48.Wehrle PF, Carbonaro O, Day PA, Whalen JP, Reichert R, Portnoy B. Transmission of polioviruses. III. Prevalence of polioviruses in pharyngeal secretions of infected household contacts of patients with clinical disease. Pediatrics 1961;27:762–4. [PubMed] [Google Scholar]
- 49.Wehrle PF, Hagen F, Carbonaro O. Transmission of polioviruses. II. Spread of attenuated poliovirus type III in a partially immunized school population. Pediatrics 1961;27:755–61. [PubMed] [Google Scholar]
- 50.Dong DX, Hu XM, Liu WJ, Li JS, Jin YC, Tan SG, Chen TQ, Fu JZ, Niu BY, Yu HM, et al. Immunization of neonates with trivalent oral poliomyelitis vaccine (Sabin). Bulletin of the World Health Organization 1986;64(6):853–860. [PMC free article] [PubMed] [Google Scholar]
- 51.El-Sayed N, El-Gamal Y, Abbassy AA, Seoud I, Salama M, Kandeel A, Hossny E, Shawky A, Hussein HA, Pallansch MA, van der Avoort HG, Burton AH, Sreevatsava M, Malankar P, Wahdan MH, Sutter RW. Monovalent type 1 oral poliovirus vaccine in newborns. New England Journal of Medicine 2008;359(16):1655–1665. [DOI] [PubMed] [Google Scholar]
- 52.Sabin AB, Michaels RH, Ziring P, Krugman S, Warren J. Effect of oral poliovirus vaccine in newborn children. II. Intestinal resistance and antibody response at 6 months in children fed type 1 vaccine at birth. Pediatrics 1963;31(4):641–650. [PubMed] [Google Scholar]
- 53.Sutter RW, John TJ, Jain H, Agarkhedkar S, Ramanan PV, Verma H, Deshpande JM, Singh AP, Sreevatsava M, Malankar P, Burton A, Chatterjee A, Jafari H, Aylward RB. Immunogenicity of bivalent types 1 and 3 oral poliovirus vaccine: A randomised, double-blind, controlled trial. The Lancet 2010;376(9753):1682–1688. [DOI] [PubMed] [Google Scholar]
- 54.Swartz TA, Skalska P, Gerichte Cg, Cockburn WC. Routine administration of oral polio vaccine in a subtropical area. Factors possibly influencing sero-conversion rates. Journal of Hygiene 1972;70(4):719–726. [DOI] [PMC free article] [PubMed] [Google Scholar]
- 55.Plotkin S, Koprowski H, Stokes J Jr. Clinical trials in infants of orally administered attenuated poliomyelitis viruses. Pediatrics 1959;23(6):1041–1062. [PubMed] [Google Scholar]
- 56.Abraham R, Minor P, Dunn G, Modlin JF, Ogra PL. Shedding of virulent poliovirus revertants during immunization with oral poliovirus vaccine after prior immunization with inactivated polio vaccine. Journal of Infectious Diseases 1993;168(5):1105–1109. [DOI] [PubMed] [Google Scholar]
- 57.Minor PD, Dunn G, Ramsay ME, Brown D. Effect of different immunisation schedules on the excretion and reversion of oral poliovaccine strains. Journal of Medical Virology 2005;75(1):153–160. [DOI] [PubMed] [Google Scholar]
- 58.Ogra PL, Faden HS, Abraham R, Duffy LC, Sun M, Minor PD. Effect of prior immunity on the shedding of virulent revertant virus in feces after oral immunization with live attenuated poliovirus vaccines. Journal of Infectious Diseases 1991;164(1):191–194. [DOI] [PubMed] [Google Scholar]
- 59.Ramsay ME, Begg NT, Gandhi J, Brown D. Antibody response and viral excretion after live polio vaccine or a combined schedule of live and inactivated polio vaccines. Pediatric Infectious Diseases Journal 1994;13(12):1117–1121. [DOI] [PubMed] [Google Scholar]
- 60.Faden H, Modlin J, Thoms M, McBean A, Ferdon M, Ogra P. Comparative evaluation of immunization with live attenuated and enhanced-potency inactivated trivalent poliovirus vaccines in childhood: Systemic and local immune responses. The Journal of Infectious Diseases 1990;162(6):1291–1297. [DOI] [PubMed] [Google Scholar]
- 61.Asturias EJ, Dueger EL, Omer SB, Melville A, Nates SV, Laassri M, Chumakov K, Halsey NA. Randomized trial of inactivated and live polio vaccine schedules in Guatemalan infants. Journal of Infectious Diseases 2007;196(5):692–698. [DOI] [PubMed] [Google Scholar]
- 62.The Cuba IPV Study Collaborative Group. Randomized, placebo-controlled trial of inactivated poliovirus vaccine in Cuba. New England Journal of Medicine 2007;356(15):1536–1544. [DOI] [PubMed] [Google Scholar]
- 63.Ion-Nedelcu N, Strebel PM, Toma F, Biberi-Moroeanu S, Combiescu M, Persu A, Aubert-Combiescu A, Plotkin SA, Sutter RW. Sequential and combined use of inactivated and oral poliovirus vaccines: Dolj district, Romania, 1992–1994. Journal of Infectious Diseases 1997;175 Suppl 1:S241–S246. [DOI] [PubMed] [Google Scholar]
- 64.Laassri M, Lottenbach K, Belshe R, Wolff M, Rennels M, Plotkin S, Chumakov KM. Effect of different vaccination schedules on excretion of oral poliovirus vaccine strains. Journal of Infectious Diseases 2005;192:2092–2098. [DOI] [PubMed] [Google Scholar]
- 65.Modlin JF, Halsey NA, Thoms ML, Meschievitz CK, Patriarca PA. Humoral and mucosal immunity in infants induced by three sequential inactivated poliovirus vaccine-live attenuated oral poliovirus vaccine immunization schedules. Baltimore area polio vaccine study group. Journal of Infectious Diseases 1997;175(Suppl 1):s228–34. [DOI] [PubMed] [Google Scholar]
- 66.Modlin JF. Mucosal immunity following oral poliovirus vaccine and enhanced potency inactivated poliovirus vaccine immunization. Pediatric Infectious Diseases Journal 1991;10(12):976–978. [DOI] [PubMed] [Google Scholar]
- 67.Mohammed AJ, Al Awaidy S, Bawikar S, Kurup PJ, Elamir E, Shaban MM, Sharif SM, van der Avoort HG, Pallansch MA, Malankar P, Burton A, Sreevatsava M, Sutter RW. Fractional doses of inactivated poliovirus vaccine in Oman. New England Journal of Medicine 2010;362(25):2351–2359. [DOI] [PubMed] [Google Scholar]
- 68.Public Health Laboratory Service. The excretion of type 1 poliovirus after challenge following primary immunization with quadruple, Salk, and Sabin vaccines. Monthly Bulletin of the Ministry of Health and Public Health Laboratory Service 1965;24:365–369. [PubMed] [Google Scholar]
- 69.Piirainen L, Stenvik M, Roivainen M, Eskola J, Beuvery EC, Hovi T. Randomised, controlled trial with the trypsin-modified inactivated poliovirus vaccine: Assessment of intestinal immunity with live challenge virus. Vaccine 1999;17(9–10):1084–1090. [DOI] [PubMed] [Google Scholar]
- 70.Cohen-Abbo A, Culley BS, Reed GW, Sannella EC, Mace RL, Robertson SE, Wright PF. Seroresponse to trivalent oral poliovirus vaccine as a function of dosage interval. Pediatric Infectious Diseases Journal 1994;14(2):100–106. [DOI] [PubMed] [Google Scholar]
- 71.Mallet L, Pelloquin F, Brigaud M, Caudrelier P, Bandet R, Xueref C, Fuchs F, Gibelin N, Goldman C, Moulin JC, de Fraipont F, Montagnon B, Peyron L, Aymard M. Comparative study of poliovirus excretion after vaccination of infants with two oral polio vaccines prepared on vero cells or on primary monkey kidney cells. Journal of Medical Virology 1997;52(1):50–60. [PubMed] [Google Scholar]
- 72.Samoilovich E, Roivainen M, Titov LP, Hovi T. Serotype-specific mucosal immune response and subsequent poliovirus replication in vaccinated children. Journal of Medical Virology 2003;71(2):274–280. [DOI] [PubMed] [Google Scholar]
- 73.Maldonado YA, Peña-Cruz V, Sanchez MD, Logan L, Blandón S, Cantwell MF, Matsui SM, MillanVelasco F, Valdespino JL, Sepulveda J. Host and viral factors affecting the decreased immunogenicity of Sabin type 3 vaccine after administration of trivalent oral polio vaccine to rural Mayan children. Journal of Infectious Diseases 1997;175(3):545–553. [DOI] [PMC free article] [PubMed] [Google Scholar]
- 74.Horstmann DM, Niederman JC, Paul JR. Attenuated type 1 poliovirus vaccine: Its capacity to infect and to spread from vaccinees within an institutional population. Journal of the American Medical Association 1959;170(1):65–72. [DOI] [PubMed] [Google Scholar]
- 75.Parent du Châtelet I, Merchant AT, Fisher-Hoch S, Luby SP, Plotkin SA, Moatter T, Agboatwalla M, McCormick JB. Serological response and poliovirus excretion following different combined oral and inactivated poliovirus vaccines immunization schedules. Vaccine 2003;21(15):1710–8. [DOI] [PubMed] [Google Scholar]
- 76.Sutter RW, Suleiman AJ, Malankar P, Al-Khusaiby S, Mehta F, Clements GB, Pallansch MA, Robertson SE. Trial of a supplemental dose of four poliovirus vaccines. New England Journal of Medicine 2000;343(11):767–73. [DOI] [PubMed] [Google Scholar]
- 77.Lu CY, Kao CL, Lee CY, Lee PI, Huang LM. Immunogenicity and fecal poliovirus excretion in sequential use of inactivated and oral poliovirus vaccines. Journal of the Formosan Medical Association 2001;100(8):513–518. [PubMed] [Google Scholar]
- 78.Swartz TA, Green MS, Handscher R, Sofer D, Cohen-Dar M, Shohat T, Habib S, Barak E, Dror Z, Somekh E, Peled-Leviathan T, Yulzari R, Libling A, Mendelson E, Shulman LM. Intestinal immunity following a combined enhanced inactivated polio vaccine/oral polio vaccine programme in Israel. Vaccine 2008;26(8):1083–90. [DOI] [PubMed] [Google Scholar]
- 79.Marine WM, Chin TD, Gravelle CR. Limitation of fecal and pharyngeal poliovirus excretion in Salk-vaccinated children. A family study during a type 1 poliomyelitis epidemic. American Journal of Hygiene 1962;76:173–195. [DOI] [PubMed] [Google Scholar]
- 80.Gelfand HM, LeBlanc D, Fox JP, Potash L. Studies on the development of natural immunity to poliomyelitis in Louisiana. IV. Natural infections with polioviruses following immunization with a formalin-inactivated vaccine. American Journal of Hygiene 1959;70(3):312–327. [DOI] [PubMed] [Google Scholar]
- 81.Vaccine Administration Subcommittee. Evaluation of Sabin live poliovirus vaccine in Japan. II. Clinical, virologic and immunologic effects of vaccine in children. Japanese Journal of Medical Science and Biology 1966;19(6):277–291. [DOI] [PubMed] [Google Scholar]
- 82.Valtanen S, Roivainen M, Piirainen L, Stenvik M, Hovi T. Poliovirus-specific intestinal antibody responses coincide with decline of poliovirus excretion. Journal of Infectious Diseases 2000;182(1):1–5. [DOI] [PubMed] [Google Scholar]
- 83.van der Sanden S, Pallansch MA, van de Kassteele J, El-Sayed N, Sutter RW, Koopmans M, van der Avoort HGAM. Shedding of vaccine viruses with increased antigenic and genetic divergence after vaccination of newborns with monovalent type 1 oral poliovirus vaccine. Journal of Virology 2009;83(17):8693–8704. [DOI] [PMC free article] [PubMed] [Google Scholar]
- 84.Drosdov SG, Shirman GA, Ashmarine EE. Dynamics of excretion of the three types of vaccine virus in vaccinated children and their contacts. Investigation of properties of virus isolates. Presented at the IVth Scientific Conference of the Institute of Poliomyelitis and Virus Encephalitis and the International Symposium on Live Poliovirus Vaccine the International Symposium on Live Poliovirus Vaccine; 1961. p. 165–173. [Google Scholar]
- 85.Horstmann DM, Paul JR, Godenne-McCrea M, Green RH, Opton EM, Holtzai, Niederman JC. Immunization of preschool children with oral poliovirus vaccine (Sabin). Journal of the American Medical Association 1961;178:693–701. [DOI] [PubMed] [Google Scholar]
- 86.Kucharska Z Excretion of live attenuated polioviruses in the faeces of orally vaccinated children. Comparison of two immunization schedules. Journal of Hygiene, Epidemiology, Microbiology and Immunology 1985;29(2):211–218. [PubMed] [Google Scholar]
- 87.John TJ, Jain H, Ravishankar K, Amaresh A, Verma H, Deshpande J, Pallansch MA, Singh AP, Sreevatsava M, Burton A, Malankar P, Chatteijee A, Sutter RW. Monovalent type 1 oral poliovirus vaccine among infants in India: Report of two randomized double-blind controlled clinical trials. Vaccine 2011;29(34):5793–5801. [DOI] [PubMed] [Google Scholar]
- 88.Ginter V, Indulen M, Kanel I. Spread of vaccine virus in boarding children’s institutions and households during immunization with live poliovirus vaccine. Presented at the IVth Scientific Conference of the Institute of Poliomyelitis and Virus Encephalitis and the International Symposium on Live Poliovirus Vaccine; 1961. p. 558–590. [Google Scholar]
- 89.Abbink F, Buisman AM, Doornbos G, Woldman J, Kimman TG, Conyn-van Spaendonck MAE. Poliovirus-specific memory immunity in seronegative elderly people does not protect against virus excretion. Journal of Infectious Diseases 2005;191(6):990–999. [DOI] [PubMed] [Google Scholar]
- 90.Ogra PL. Mucosal immune response to poliovirus vaccines in childhood. Reviews of Infectious Diseases 1984;6 Suppl 2:S361–S368. [DOI] [PubMed] [Google Scholar]
- 91.Ogra PL, Karzon DT. Formation and function of poliovirus antibody in different tissues. Progress in Medical Virology 1971;13:156–193. [Google Scholar]
- 92.Ogra PL, Ogra SS, al-Nakeeb S, Coppola PR. Local antibody response to experimental poliovirus infection in the central nervous system of rhesus monkeys. Infection and Immunity 1973;8(6):931–7. [DOI] [PMC free article] [PubMed] [Google Scholar]
- 93.Ogra PL, Fishaut M, Gallagher MR. Viral vaccination via the mucosal routes. Reviews of Infectious Diseases 1980;2:352–369. [DOI] [PubMed] [Google Scholar]
- 94.Nishio O, Sumi J, Sakae K, Ishihara Y, Isomura S, Inouye S. Fecal IgA antibody responses after oral poliovirus vaccination in infants and elder children. Microbiology and Immunology 1990;34(8):683–689. [DOI] [PubMed] [Google Scholar]
- 95.Buisman AM, Abbink F, Schepp RM, Sonsma JA, Herremans T, Kimman TG. Preexisting poliovirus-specific IgA in the circulation correlates with protection against virus excretion in the elderly. Journal of Infectious Diseases 2008;197(5):698–706. [DOI] [PubMed] [Google Scholar]
- 96.Herremans TMPT, Reimerink JH, Buisman AM, Kimman TG, Koopmans MP. Induction of mucosal immunity by inactivated poliovirus vaccine is dependent on previous mucosal contact with live virus. Journal of Immunology 1999;162:5011–5018. [PubMed] [Google Scholar]
- 97.Böttiger M Polio immunity to killed vaccine: An 18-year follow-up. Vaccine 1990;8(5):443–445. [DOI] [PubMed] [Google Scholar]
- 98.Faden H, Duffy L, Sun M, Shuff C. Long-term immunity to poliovirus in children immunized with live attenuated and enhanced-potency inactivated trivalent poliovirus vaccines. Journal of Infectious Diseases 1993;168(2):452–454. [DOI] [PubMed] [Google Scholar]
- 99.Kelley PW, Petruccelli BP, Stehr-Green P, Erickson RL, Mason CJ. The susceptibility of young adult Americans to vaccine-preventable infections. A national serosurvey of US army recruits. Journal of the American Medical Association 1991;266(19):2724–9. [PubMed] [Google Scholar]
- 100.Nishio O, Ishihara Y, Sakae K, Nonomura Y, Kuno A, Yasukawa S, Inoue H, Miyamura K, Kono R. The trend of acquired immunity with live poliovirus vaccine and the effect of revaccination: Follow-up of vaccinees for ten years. Journal of Biological Standardization 1984;12(1):1–10. [DOI] [PubMed] [Google Scholar]
- 101.Goffe A, Pollock TM, Shand FL. Vaccination of adults with a British oral poliomyelitis vaccine prepared from Sabin strains. British Medical Journal 1961;2(5247):272–274. [DOI] [PMC free article] [PubMed] [Google Scholar]
- 102.Smith JWG, Lee JA, Fletcher WB, Yetts R, Magrath DI, Perkins FT. The response to oral poliovaccine in persons aged 16–18 years. Journal of Hygiene Cambridge 1976;76:235–247. [DOI] [PMC free article] [PubMed] [Google Scholar]
- 103.Pirez MC, Olivera I, Diabarboure H, Montano A, Baranano R, Badia F, Bonnet MC. Seroprevalence of anti-polio antibodies in a population 7 months to 39 years of age in Uruguay: Implications for future polio vaccination strategies. Vaccine 2009;27(20):2689–2694. [DOI] [PubMed] [Google Scholar]
- 104.Lamy ME, Cornu C, Desmyter J. Poliovirus antibodies in age groups: An assessment of obligatory vaccination in Belgium. Dev Biol Stand 1979;43:207–13. [PubMed] [Google Scholar]
- 105.Trivello R, Renzulli G, Farisano G, Bonello C, Moschen M, Gasparini V, Benussi G. Persistence of poliovirus-neutralizing antibodies 2-16 years after immunization with live attenuated vaccine. A seroepidemiologic survey in the mainland of Venice. Epidemiol Infect 1988;101(3):605–9. [DOI] [PMC free article] [PubMed] [Google Scholar]
- 106.Schoub BD, Blackburn NK, McAnerney JM. Seroprevalence to polio in personnel at a virology institute. J Infect 2001;43(2):128–31. [DOI] [PubMed] [Google Scholar]
- 107.Pagano JS, Böttiger M, Bonnevier JO, Gard S. The response and the lack of spread in Swedish school children given an attenuated poliovirus vaccine prepared in human diploid cell strain. American Journal of Hygiene 1964;79:74–85. [DOI] [PubMed] [Google Scholar]
- 108.Verlinde JD, Wilterdink JB. A small-scale trial on vaccination and revaccination with live attenuated polioviruses in the Netherlands. Presented at the First International Conference of Live Poliovirus Vaccine; Washington, D.C.: Pan American Sanitary Bureau; 1959. p. 355–366. [Google Scholar]
- 109.Kogon A, Sigland I, Elveback LR, Fox JP. Oral poliovirus vaccination in middle income families. American Journal of Epidemiology 1965;82(1):14–26. [Google Scholar]
- 110.Weckx LY, Schmidt BJ, Herrmann AA, Miyasaki CH, Novo NF. Early immunization of neonates with trivalent oral poliovirus vaccine. Bulletin of the World Health Organization 1992;70(1):85–91. [PMC free article] [PubMed] [Google Scholar]
- 111.Dowdle WR, van der Avoort HGAM, de Gourville EM, Delpeyroux F, Deshpande JM, Hovi T, Martín J, Pallansch MA, Kew OM, Wolff C. Containment of polioviruses after eradication: Characterizing risk to improve management. Risk Analysis 2006;26(6):1449–1469. [DOI] [PubMed] [Google Scholar]
- 112.Smorodintsev A, Ilyenko V, Kurnosova M. Virological and immunological characteristics of vaccinal infection in children inoculated per os with a live poliomyelitis vaccine made from the Sabin strains. Presented at the 1st International Conference on Live Poliovirus Vaccines; 1959. p. 312–23. [Google Scholar]
- 113.Plotkin SA, Koprowski H, Richardson SN, Stokes J Jr. Vaccination of families against poliomyelitis by feeding and by contact spread of living attenuated virus including studies of virus properties after human intestinal passage. Acta Paediatrica 1960;49:551–71. [DOI] [PubMed] [Google Scholar]
- 114.Fox JP, Gelfand HM, LeBlanc DR, Rowan DF. The influence of natural and artificially induced immunity on alimentary infections with polioviruses. American Journal of Public Health 1958;48(9):1181–1192. [DOI] [PMC free article] [PubMed] [Google Scholar]
- 115.Fox JP, Gelfand HM, Leblanc DR, Conwell DP. Studies on the development of natural immunity to poliomyelitis in Louisiana: I. Over-all plan, methods and observations as to patterns of seroimmunity in the study group. American Journal of Hygiene 1957;65(3):344–366. [DOI] [PubMed] [Google Scholar]
- 116.Gelfand HM, LeBlanc DR, Fox JP, Conwell DP. Studies on the development of natural immunity to poliomyelitis in Louisiana. II. Description and analysis of episodes of infection observed in study group households. American Journal of Hygiene 1957;65(3):367–385. [DOI] [PubMed] [Google Scholar]
- 117.Chin TD, Marine WM, Hall EC, Gravelle CR, Speers JF. Poliomyelitis in Des Moines, Iowa, 1959. The influence of Salk vaccination on the epidemic pattern and the spread of the virus in the community. American Journal of Hygiene 1961;74:67–94. [DOI] [PubMed] [Google Scholar]
- 118.Horstmann DM, Niederman JC, Riordan JT, Paul JR. The trial use of Sabin’s attenuated type 1 poliovirus vaccine in a village in southern Arizona. American Journal of Hygiene 1959;70:169–184. [DOI] [PubMed] [Google Scholar]
- 119.Melnick JL, Walton M, Isacson P, Cardwell W. Environmental studies of endemic enteric virus infections. I. Community seroimmune patterns and poliovirus infection rates. Am J Hyg 1957;65(1):1–28. [DOI] [PubMed] [Google Scholar]
- 120.Stickle G. Observed and expected poliomyelitis in the United States, 1958-1961. American Journal of Public Health 1964;54:1222–1229. [DOI] [PMC free article] [PubMed] [Google Scholar]
- 121.Böttiger M The elimination of polio in the Scandinavian countries. Public Health Reviews 1993;21(1-2):27–33. [PubMed] [Google Scholar]
- 122.Lapinleimu K Elimination of poliomyelitis in Finland. Reviews of Infectious Diseases 1984;6(Suppl 2):S457–S460. [DOI] [PubMed] [Google Scholar]
- 123.Dane DS, Dick GW A, Briggs M, Nelson R, McAlister J, Conolly JH, Haire M, McKeown CMB. Vaccination against poliomyelitis with live virus vaccines: 6. Changes in Sabin type II oral vaccine virus after human passage British Medical Journal 1961;2(5247):259–265. [DOI] [PMC free article] [PubMed] [Google Scholar]
- 124.Bhatt PN, Brooks M, Fox JP. Extent of infection with poliomyelitis virus in household associates of clinical cases as determined serologically and by virus isolation using tissue culture methods. Am J Hyg 1955;61(3):287–301. [DOI] [PubMed] [Google Scholar]
- 125.Fine PE, Carneiro IA. Transmissibility and persistence of oral polio vaccine viruses: Implications for the global poliomyelitis eradication initiative. American Journal of Epidemiology 1999;150(10):1001 −1021. [DOI] [PubMed] [Google Scholar]
- 126.Benyesh-Melnick M, Melnick JL, Ramos-Alvarez M. Poliomyelitis infection rate among Mexican children fed attenuated poliovirus vaccines. Presented at the 1st International Conference on Live Poliovirus Vaccines; 1959. p. 272–285. [Google Scholar]
- 127.Sabin AB, Michaels RH, Spigland I, Pelon W, Rhim JS, Wehr RE. Community-wide use of oral poliovirus vaccine. Effectiveness of the Cincinnati program. American Journal of Diseases of Children 1961;101:546–567. [DOI] [PubMed] [Google Scholar]
- 128.Oliver Wyman. The supply landscape and economics of IPV-containing vaccines: Key findings; 2010. May. [Google Scholar]
- 129.PATH. Improving the affordability of inactivated poliovirus vaccines (IPV) for use in low- and middle-income countries: An economic analysis of strategies to reduce the cost of routine IPV immunization. Seattle: PATH; 2010. April 20. [Google Scholar]
- 130.Sutter RW, Cáceres VM, Más Lago P. The role of routine immunization in the post-certification era. Bulletin of the World Health Organization 2004;82(1):31–8. [PMC free article] [PubMed] [Google Scholar]
- 131.Barr RN, Bauer H, Kleinman H, Johnson EA, Martins da Silva M, Kimball AC. Use of orally administered live attenuated polioviruses as a vaccine in a community setting. Journal of the American Medical Association 1959;170(8):893–905. [DOI] [PubMed] [Google Scholar]
- 132.Beale AJ, Davies JR, Thrower AL. Response to one dose of trivalent oral poliovaccine in children previously immunised with Salk vaccine: A comparison of liquid vaccine and a capsule presentation. The Lancet 1965;l(7391):879–881. [DOI] [PubMed] [Google Scholar]
- 133.Dömök I, Molnár E, Jancso A. Virus excretion after mass vaccination with attenuated polioviruses in Hungary. British Medical Journal 1961:1410–1417. [DOI] [PMC free article] [PubMed] [Google Scholar]
- 134.Dömök I, Molnár E, Jancso A. Enterovirus isolation studies in connection with the polio vaccination programmer in Hungary 1959–60 In: Weisfeiler J, editor. The control of poliomyelitis by live poliovirus vaccine. Budapest: Akademiai Kiadó; 1961. p. 85–104. [Google Scholar]
- 135.Grassly NC, Jafari H, Bahl S, Durrani S, Wenger J, Sutter RW, Aylward RB. Mucosal immunity after vaccination with monovalent and trivalent oral poliovirus vaccine in India. Journal of Infectious Diseases 2009;200(5):794–801. [DOI] [PubMed] [Google Scholar]
- 136.John TJ, Christopher S. Oral polio vaccination of children in the tropics. III. Intercurrent enterovirus infections, vaccine virus take and antibody response. American Journal of Epidemiology 1975;102(5) :422–428. [DOI] [PubMed] [Google Scholar]
- 137.John TJ. Oral polio vaccination of children in the tropics. II. Antibody response in relation to vaccine virus infection. American Journal of Epidemiology 1975;102(5):414–421. [DOI] [PubMed] [Google Scholar]
- 138.John TJ, Jayabal P. Oral polio vaccination of children in the tropics. I. The poor seroconversion rates and the absence of viral interference. American Journal of Epidemiology 1972;96(4):263–269. [DOI] [PubMed] [Google Scholar]
- 139.Koroleva G, Zhevandrova V, Voroshilova M, Taranova G, Chumakov M. Virologic and serologic survey of children in contact with those immunized with live poliovirus vaccine. Presented at the IVth Scientific Conference of the Institute of Poliomyelitis and Virus Encephalitis and the International Symposium on Live Poliovirus Vaccine; 1960. p. 584–587. [Google Scholar]
- 140.Zhevandrova V, Koroleva G, Voroshilova M. The dynamics of vaccine strain excretion in oral immunization with trivalent live poliomyelitis vaccine. Presented at the IVth Scientific Conference of the Institute of Poliomyelitis and Virus Encephalitis and the International Symposium on Live Poliovirus Vaccine; 1960. p. 174–180. [Google Scholar]
- 141.Levine S, Goldblum N, Friedman E. Virologic findings and antibody response of newborns fed multiple type oral poliomyelitis vaccine. American Journal of Hygiene 1961;74:95–103. [DOI] [PubMed] [Google Scholar]
- 142.Buonagurio DA, Coleman JW, Patibandla SA, Prabhakar BS, Tatem JM. Direct detection of Sabin poliovirus vaccine strains in stool specimens of first-dose vaccinees by a sensitive reverse transcription-pcr method. Journal of Clinical Microbiology 1999;37(2):283–289. [DOI] [PMC free article] [PubMed] [Google Scholar]
- 143.Roca-Garcia M, Markham FS, Cox HR, Vargas-Mendez O, Guevara EC, Montoya JA. Poliovirus shedding and seroconversion Journal of the American Medical Association 1964;188(7):639–646. [PubMed] [Google Scholar]
- 144.Sabin AB, Ramos-Alvarez M, Alvarez-Amezquita J, Pelon W, Michaels RH, Spigland I, Koch MA, Barnes JM, J.S. R. Live, orally given poliovirus vaccine: Effects of rapid mass immunization on population under conditions of massive enteric infection with other viruses. Journal of the American Medical Association 1960;173(14):1521–1526. [DOI] [PubMed] [Google Scholar]
- 145.Wehrle PF, Reichert R, Carbonaro O, Portnoy B. Influence of prior active immunization on the presence of poliomyelitis virus in the pharynx and stools of family contacts of patients with paralytic poliomyelitis. Pediatrics 1958;21(3):353–61. [PubMed] [Google Scholar]
- 146.Bodian D, Paffenbarger RS Jr. Poliomyelitis infection in households; frequency of viremia and specific antibody response. Am J Hyg 1954;60(1):83–98. [PubMed] [Google Scholar]
- 147.Isacson P, Melnick JL, Walton M. Environmental studies of endemic enteric virus infections. II. Poliovirus infections in household units. Am J Hyg 1957;65(1):29–42. [DOI] [PubMed] [Google Scholar]
Associated Data
This section collects any data citations, data availability statements, or supplementary materials included in this article.