


Abstract
Chromatin immunoprecipitation (IP) followed by sequencing (ChIP-seq) is the gold standard to detect transcription-factor (TF) binding sites in the genome. Its success depends on appropriate controls removing systematic biases. The predominantly used controls, i.e. DNA input, correct for uneven sonication, but not for nonspecific interactions of the IP antibody. Another type of controls, ‘mock’ IP, corrects for both of the issues, but is not widely used because it is considered susceptible to technical noise. The tradeoff between the two control types has not been investigated systematically. Therefore, we generated comparable DNA input and mock IP experiments. Because mock IPs contain only nonspecific interactions, the sites predicted from them using DNA input indicate the spurious-site abundance. This abundance is highly correlated with the ‘genomic activity’ (e.g. chromatin openness). In particular, compared to cell lines, complex samples such as whole organisms have more spurious sites—probably because they contain multiple cell types, resulting in more expressed genes and more open chromatin. Consequently, DNA input and mock IP controls performed similarly for cell lines, whereas for complex samples, mock IP substantially reduced the number of spurious sites. However, DNA input is still informative; thus, we developed a simple framework integrating both controls, improving binding site detection.
INTRODUCTION
ChIP-seq was developed to profile in vivo protein–DNA binding and histone modifications on a genomic scale (1–4). Compared to its predecessors, ChIP-seq has less noise and higher resolution (5,6), and thus is currently the standard technique to identify the binding sites of a transcription factor in the genome. ChIP-seq protocols typically begin with cross-linking DNA and its adjacent proteins using formaldehyde, followed by shearing DNA into small fragments by sonication. Next, in the IP step, an antibody that binds specifically to the transcription factor (TF) of interest is used to enrich for the TF-DNA complexes. Finally, the precipitated DNA fragments are sequenced and mapped back to a reference genome for binding site detection. The genomic regions with significantly more reads than controls are likely to be TF binding sites. Here, we refer to the binding sites of a TF as the ∼200 base pair (bp) genomic regions detected by ChIP-seq with statistical significance, rather than the short DNA sequences bound directly by the TF.
As with many high-throughput techniques, ChIP-seq is also susceptible to technical and biological biases (7,8). In ChIP-seq, one bias arises during genome sonication, in which open chromatin regions are more easily sheared than other regions, and thus these open regions yield more protein-DNA complexes. Consequently, the IP step precipitates more complexes from the open chromatin regions, resulting in more sequencing reads. To correct this sonication bias, the fragmented genomes are divided into two portions. One portion goes through the IP step and then the sequencing step, whereas the other portion is sequenced directly to serve as an input control. This direct sequencing result contains the shearing bias of sonication, and thus can be used to normalize the sequencing results from the IP protocol (9).
In addition to sonication, uneven regulatory binding in the genome may result in bias during the IP step. For example, even without sonication bias, genomic regions with abundant DNA binding proteins tend to have more protein–DNA complexes. Although the antibody in IP is designed to bind specifically to its antigens, i.e., the target TFs, it can also bind nonspecifically to other proteins. Consequently, the antibody captures more protein–DNA complexes from genomic regions with abundant regulatory proteins. To control for this bias, a mock IP can be generated using the IP protocol, with the mock IP lacking specific antibody-antigen interactions. To this end, the mock IP either uses an antibody that cannot recognize the TF of interest or the TF is not tagged with the epitope for the antibody used in the IP, e.g. the green fluorescent protein (GFP) tag. Consequently, the mock IP control mimics only the nonspecific interactions in the IP. In addition to the nonspecific interactions, the mock IP also controls for sonication bias (7,8,10). However, mock IP usually yields much less DNA material than DNA input and is thus more susceptible to technical noise (8,10). Therefore, DNA input is recommended and used primarily in ChIP-seq (7,11). For example, in the ENCODE portal (12), almost all of the thousands of ChIP-seq data sets use DNA input as a control.
Increasing evidence suggests that spurious sites in ChIP-seq data may be substantial. Teytelman et al. and Park et al. found that TFs often appear to bind genomic regions that are counterintuitive to their function (13,14). For example, TUP1 is recognized as a repressor of gene expression, but ChIP-seq still identifies its binding sites in the promoters of expressed genes (14). Moreover, Jain et al., observed that when ChIP-seq was performed in a knockout background for a targeted TF, ∼3000 binding sites from the mutant embryos of fruit fly (Drosophila melanogaster) were still detected (15). The unexpected sites from these studies suggest the existence of abundant spurious sites. These potentially spurious sites tend to appear in highly transcribed genomic regions (13,15). Since DNA input controls are used in these examples, the potentially spurious sites are likely due to nonspecific interactions between the antibodies and other DNA-binding proteins or DNA fragments.
While these studies suggest the existence of spurious sites, interpretations of these results remain indefinite for the following reasons. First, the complete functionality of a TF is often unknown. Again, considering the TUP1 example – although generally considered as a repressor, TUP1 is also observed to activate genes (16,17). Second, TF binding may not necessarily indicate biological function. Therefore, even though TUP1 usually acts as a repressor, when found in the promoters of transcribed genes, it may not be exerting any repressive function. As a result, the binding of TUP1 detected around expressed genes may not be spurious. Finally, the large number of spurious binding sites in the aforementioned results were not predicted using standard and robust computational pipelines (10), and thus these spurious sites might be due to the parameter settings.
Determining the abundance of spurious sites in ChIP-seq data is extremely important as the data are being widely used in numerous biological and medical studies. To this end, we generated and collected a large number of ChIP-seq datasets that have both mock IP and DNA input controls. We designed computational experiments that use these controls to estimate the abundance of spurious sites across different samples. Moreover, we proposed and validated that many spurious binding sites are potentially due to the intrinsic properties of samples. Such potential spurious sites can be removed using mock IP controls, but not using DNA input controls. Despite this result, our analyses indicate that DNA input controls are still informative for ChIP-seq. Therefore, we developed a method to utilize both mock IP and DNA input controls for improved binding site detection. This new tool can be used to tease apart biological binding sites from spurious ones to capture more accurate binding profiles of TFs.
MATERIALS AND METHODS
ENCODE pipeline for peak calling and binding site detection
The ChIP-seq data for each TF includes at least two IP replicates and a control. The high-quality reads of each set are uniquely aligned to a reference genome using BWA (v0.7.15) (18). The genome versions of the three species are hg19 (human), dm6 (fly, D. melanogaster), and ws245 (worm, Caenorhabditis elegans). The mapped reads of the IP replicates are pooled together, and then randomly divided into two sets as pseudo-replicates. The replicates, pseudo-replicates, and the control experiment are used by the established ENCODE pipeline for peak calling and then binding site prediction (10). In the pipeline, SPP (v1.14) is used to detect TF binding peaks by comparing a replicate or pseudo-replicate of IP to the control experiment (9), resulting a list of TF binding peaks ranked by the SPP score.
For this work, we used the top 30 000 and 120 000 peaks, respectively, for worm/fly and human. These lists of top ranked binding peaks from multiple replicates were passed to the irreproducible discovery rate (IDR) tool (v.1.2) to determine binding sites using the standard optimal protocol (19). Note that each peak is usually a ∼200 bp genomic region with a potential binding summit detected by SPP. We refer to the peaks that pass the statistical protocol as binding sites. To estimate spurious sites, we replaced IP experiments with mock IP experiments, in which there were no specific interactions between the antibodies and target TFs. For this detection of spurious sites, we used the top 30 000 peaks ranked by SPP for all the species.
ChIP-seq data of human, worm, and fly from ENCODE and modERN
ChIP-seq data of human cell lines, tissues and organs from ENCODE
We acquired ChIP-seq data of human TFs from the ENCODE portal (12) and focused on six cell lines, namely GM12878, K562, HepG2, A549, HeLa-S3 and MCF-7 because both mock IPs and DNA input controls are available for each of these cell lines (Supplementary Table S1). Each pair of the mock IP and DNA input experiments is assigned as controls to an IP experiment of the corresponding cell line, resulting in 113 ChIP-seq datasets (Supplementary Table S2). We excluded the ChIP-seq data for histone marks, polymerases, and CTCF from our analyses. In addition, we found seven human TFs with ChIP-seq data (using DNA input controls) from both cell lines or primary cells and tissue or organ samples (Supplementary Table S3). These ChIP-seq data were used to compare the spurious-site abundances between simple and complex samples.
ChIP-seq data of worm and fly from modERN
We used 317 and 182 ChIP-seq datasets generated by our modERN consortium for the whole organisms of fly and worm, respectively (Supplementary Tables S4&5). The worm ChIP-seq data are from developmental stages of embryo, L4 and young adult. For fly, the ChIP-seq data are from embryo, L3 and prepupae developmental stages. The modERN ChIP-seq protocol tags a target TF with GFP, generating a transgenic fly or worm. The same anti-GFP antibody is used in both organisms during the IP process. A detailed protocol for strain generation and ChIP-seq is described in (20). The ChIP-seq data for each TF consists of multiple IP replicates along with a DNA input control. For each of the developmental stages, we generated mock IPs and their DNA input controls. The mock IP was performed using the GFP antibody in wild-type animals without GFP tags to avoid specific interactions (Supplementary Table S1).
Transcriptome activity of human, worm, and fly samples
The gene expression levels of the six human cell lines were measured by RNA-seq in the ENCODE portal (Supplementary Table S6) (12). Regarding the developmental stages of worm and fly, the RNA-seq data were generated by (21). The gene expression levels were measured across many time points within each developmental stage. Therefore, we averaged the gene expression levels over the time points. We then focused on the coding genes of each species, because their annotations are accurate across the three species. To compare the transcription activity across the samples (i.e. the six cell lines and six developmental stages), we multiplied the gene expression values of each sample by a constant so that the top five highly expressed coding genes of all the samples had the same average. For each sample, the median of the scaled expressions was used to indicate its transcriptome activity.
Genome accessibility of human and worm samples
We used DNase-seq data and ATAC-seq data, respectively, to measure the accessibility of human and worm chromatin. The DNase-seq data of the six cell lines were collected from the ENCODE portal (12). These data were generated by the ENCODE consortium and processed uniformly by its DNase-seq pipeline (Supplementary Table S7). The total length of the accessible regions was used to indicate the genome accessibility of a human sample. For worm, we used ATAC-seq data generated and processed uniformly by Daugherty et al. (22), who assayed worm samples at embryo, L3 and young adult stages. These stages match our ChIP-seq stages, except for the L4 stage. Therefore, we used the L3 ATAC-seq for the L4 stage ChIP-seq. This slight mismatch renders our hypothesis testing more conservative for any observed statistical significance. Similar to the DNase-seq data, we used the total length of accessible regions to indicate the genome accessibility of a worm sample. We totally acquired 60 DNase-seq datasets from human tissues and organs and 150 from all human cell lines and primary cells (Supplementary Table S7). From their genome accessibility, we predicted the numbers of spurious binding sites in the samples.
Binding site detection using posterior probability as a scoring metric
For a given TF, we focused on the IP (i), DNA input (d), and mock IP (m) experiments. These experiments were all scaled to the same sequencing depth. For the DNA input control (d) and its IP (i), we used the SPP in the ENCODE pipeline to identify the binding peak regions in the genome. For each peak region,  and
and  are the numbers of reads in the respective experiments mapped to the region. The likelihood of the region being a binding site is indicated by
  , where
  for estimation purposes. Under the Bayesian framework, we assume
  , where
  is the prior and
  is the number of total reads from the region in i and d. Thus, the posterior distribution of
  is
is  . Instead of the DNA input (d), we also used the mock IP as a control (m). The same model setting results in
  , where
  is the number of total reads from the region in i and m.
Motif enrichment in TF binding regions
From the Cis-bp database (23), we collected the position weight matrix files (PWMs) of motifs determined by in vitro methods such as systematic evolution of ligands by exponential enrichment (SELEX) (24), protein-binding microarray (PBM) (25,26) and bacterial one-hybrid (B1H) (27). Occasionally, some TFs have multiple PWMs, which are often determined in different research publications. For such a TF, we randomly selected one of the multiple motifs, as required by certain analyses. We also used all the motifs to test the robustness of our results. For the 317 fly ChIP-seq datasets, 127 of them have the TFs with known motifs (Supplementary Table S8). For human and worm, respectively, the numbers are 29 and 44 (Supplementary Table S8).
We used FIMO (MEME Suite v4.11.2) to search for motif hits (P < 10−4) in the reference genomes (28). For a binding site detected by the ChIP-seq pipeline, we define its core region as 100 bp around the summit as determined by SPP, and thus each binding site is considered as a 200 bp region. For the binding sites of a TF, its motif enrichment is defined as the fraction of the binding sites containing the known TF motifs. Using this fraction avoids the potential bias caused by the binding sites that have extreme numbers of motifs. To generate a control for GC content, we divide a reference genome into 10 bp bins, and then shuffled the sequence within each bin. Such shuffling breaks the motifs, if any, in a binding site, while preserving the GC contents of the site.
Motif entropy calculation
The entropy of a motif is calculated from its PWM. Each element in the matrix is denoted as Pk,j, which is the frequency of the nucleotide k at the jth position of the motif. The k represents one of the four nucleotides. Therefore, the entropy of a motif is calculated as in Equation 1,
 |
(1) |
where L is the length of the motif.
RESULTS
ChIP-seq with multiple controls illustrates the formation of spurious sites
Experimental settings of ChIP-seq data used
We acquired human ChIP-seq data from the ENCODE portal (12,29). The data were generated from six different cell line samples. Each sample has both DNA input (d) and mock IP (m) controls for the IP experiments (i), as shown in Figure 1A. In IP experiments, an antibody specific to the target TF is used, whereas mock IP uses an antibody that does not specifically interact with any DNA binding proteins. In contrast, ChIP-seq data from worm and fly were generated from whole organisms at the embryo, L4, and young adult stages in worm and embryo, L3 larva, and prepupae stages in fly. As shown in Figure 1A, each of the worm and fly TFs has IP replicates (i) and a DNA input control (d) generated by our modERN consortium (20). In addition, for each stage, we produced a mock IP control (m’) as shown in Figure 1B. We also generated DNA input controls (d’) corresponding to these mock IP controls (Figure 1B and Materials and Methods; Supplementary Table S1).
Figure 1.

Illustration of the ChIP-seq protocols in use and the generation of spurious sites. The ChIP-seq protocol (A) can consist of IP, DNA input and mock IP experiments. For simplicity, the three open chromatin regions are assumed to be equally sensitive to sonication. In IP, the peak of reads at region 1 is mainly due to the specific interactions between the antibodies (1) and the antigens (triangle) of the target TFs (in red). The peaks at region 2 and 3 are due to nonspecific interactions between the antibody and regulatory proteins at the regions. In mock IP, to avoid the specific antigen-antibody reactions, we use another antibody (2), which does not bind specifically to any DNA binding proteins in the sample. Therefore, the resultant three peaks of reads are due to nonspecific interactions between antibody 2 and other DNA binding proteins. In this hypothetical example, a peak caller compares the three peaks from the IP to those from the DNA input, resulting in binding peaks at region 1 and 2. Since there is no target TF binding at region 2, the detected binding peak is spurious due to strong nonspecific interactions at region 2. Using the mock IP as a control, the peak caller identifies only the genuine binding peak at region 1. For worm and fly samples, due to the use of a GFP tag, we can remove the antigen to avoid antibody-antigen reactions (B). Therefore, the mock IP for a worm or fly sample uses the same GFP antibody as its IP. Because there is no antigen present in the sample for mock IP, the peaks of reads observed are also due to nonspecific interactions. A DNA input control is also generated for the worm or fly sample. The peaks identified from the mock IP using the DNA input as a control are all spurious due to lack of specific interactions.
Potential mechanism of spurious site generation due to nonspecific interactions
We propose a potential mechanism on how the nonspecific interactions between an antibody and regulatory proteins cause spurious sites when DNA input controls are used. This mechanism is illustrated using a hypothetical example in Figure 1. For this purpose, we created three open chromatin regions and let them be equally sensitive to sonication. As a result, these regions have peaks of sequencing reads with similar heights in the DNA input control (d, Figure 1A). We let region 1 contain regulatory proteins as well as the target TF of the antibody. Regions 2 and 3 have no target TFs but only other regulatory proteins (Figure 1A). Therefore, in the IP experiment (i, Figure 1A), the peak of reads at region 1 is mainly due to the specific binding of the antibody to the target TF, whereas the peaks at regions 2 and 3 are purely due to nonspecific binding. Because we let region 2 have many more regulatory proteins than region 3 (Figure 1A), more complexes of regulatory proteins and DNA are generated from region 2. Therefore, even with nonspecific binding to the complexes, the antibody enriches for more DNA fragments from region 2 than from region 3.
With sufficient regulatory protein binding, the peak of reads at region 2 in the IP (i) can be higher than its counterpart in the DNA input (d), as we specified in Figure 1. We postulate that this event may be further enhanced by physical and chemical factors at the molecular level. For example, the antibody used in the IP likely prefers to interact with the regulatory protein-DNA complexes from open chromatin rather than the histone-DNA complexes from closed chromatin. This preference may be due to the fact that regulatory proteins more likely resemble the target of the antibody than histones. Moreover, the histone-DNA complexes tend to carry no charge, which may further reduce binding to the antibody. Consequently, the antibody likely enriches for more DNA fragments from open chromatin than from closed chromatin. This preference renders the peak of reads at region 2 in the IP even higher than that in the DNA input, taking the respective closed chromatin regions as reference. Due to the higher peak of reads at region 2 in IP than in DNA input, using the DNA input as a control for the IP results in a spurious binding peak at region 2.
This proposed mechanism of generating spurious sites predicts that between genomes, the one with more abundant open chromatin and/or more highly expressed genes has a larger number of spurious binding sites. Moreover, this proposed mechanism also indicates that within a genome, the spurious sites tend to be associated with highly expressed genes, which recruit many regulatory proteins for transcription. This prediction is consistent with other recent observations (13–15). However, spurious sites due to nonspecific interactions are expected to be removed when mock IP controls are used. As illustrated in Figure 1, because the mock IP control (m) captures the nonspecific binding between the antibody and other regulatory proteins (10,30), the resultant peak of reads at region 2 in the mock IP is as high as the corresponding peak in the IP. In Figure 1, region 3 has only a few regulatory binding proteins, and thus using either DNA input or mock IP control results in no spurious binding peaks. This hypothetical example also demonstrates the operational definition of a potential binding peak used here, which is a genomic region (200bp) corresponding to a binding summit. The statistically significant peaks are defined as binding sites.
Spurious binding sites across various samples
The abundance of spurious sites from nonspecific interactions between antibodies and regulatory proteins can be estimated by the sites detected from mock IP experiments compared to DNA input as a control because mock IP experiments capture no specific interactions but only nonspecific ones (Figure 1B). Therefore, we used the standard ENCODE ChIP-seq pipeline to analyze the six pairs of mock IP (m) and DNA input (d) from the human cell lines, and the six pairs (m’ and d’) from the worm and fly developmental stages. As a result, we observed that human cell lines on average had nine spurious sites per 100 million base pairs (Mb) in genome, whereas this average number increased to 551 and 3931, respectively, for worm and fly samples. According to the mechanism we proposed, these numbers of spurious sites are expected to correlate with the transcriptome activity and the genome accessibility of the samples. Both high activity and accessibility approximately indicate a large number of protein–DNA complexes in the samples. Having many different types of DNA binding proteins expressed also increases the likelihood of nonspecific interactions with the antibodies.
In order to measure transcriptome activity, we used RNA-seq data from the ENCODE portal (12) and our published data (21). However, the RPKMs from RNA-seq indicate the relative transcription levels of the genes within a sample, rendering across-sample comparisons impossible. For example, a cell type with all genes highly expressed has the same RPKMs as another cell type with all genes lowly expressed. To this end, we assume that the most highly transcribed genes of different eukaryote cell types have similar transcription activity, which are the limit of the transcription machinery. In a sample containing multiple cell types, the genes with the highest RPKMs are very likely the most transcribed genes in the majority cells. Taken together, we normalized the RPKMs of coding genes in each sample so that the five most highly expressed genes from the different samples had the same average, and then used the median of the normalized coding gene expression to indicate the transcriptome activity of the sample.
Note that for a sample with multiple cell types, the high median after normalization may be also because the many cell types express quite different genes from each other in the genome, indicating that on average a large fraction of the genome in the sample are actively transcribed. We also expect many spurious sites from such genomes. As a result, we used the medians of the normalized transcriptomes to roughly suggest their activity. Although it is a rough approximation, the activity of the different samples is indeed highly correlated with the numbers of spurious sites per 100 Mb identified from the samples (Spearman's ρ = 0.89, P < 9.2e–5). With linear regression, the transcriptome activity accounts for a large fraction of the variance in spurious site abundance (r2 = 0.92, P < 6.5e–7; Figure 2A), supporting our proposed mechanism of generating spurious sites.
Figure 2.
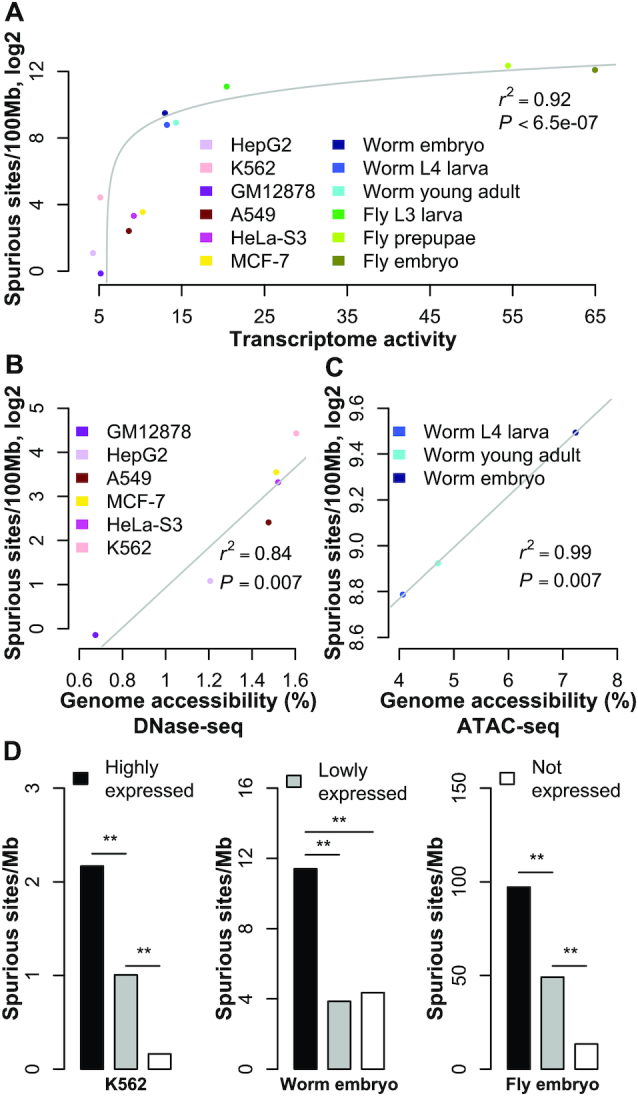
Associations between spurious site abundance and genome activity. The number of spurious sites per 100 million base pairs (Mb) in the genome is linearly regressed with the transcriptome activity. For display purposes, the number of spurious sites is transformed into log space (A). The number of spurious binding sites is linearly regressed with genomic accessibility for human samples (B) and worm samples (C). The number of spurious sites per 1 Mb is calculated for promoter regions of highly expressed, lowly expressed, and unexpressed genes in K562, worm embryo, and fly embryo (D). ‘**’ indicates P-value < 0.01, based on the Binomial test.
In addition, we tested the correlation between genome accessibility and spurious-site abundance. The genome accessibilities of the six human cell lines were calculated from the DNase-seq data generated by the ENCODE consortium and processed uniformly by the ENCODE pipeline (12). The genome accessibility also explained a substantial fraction of the variance in spurious site abundance (r2 = 0.84, P = 0.007; Figure 2B). As expected, given their high growth rates, the five cancer cell lines had higher genome accessibility than the GM12878 cell line, and thus had more spurious binding sites (Figure 2B). For worm samples, Daugherty et al. generated ATAC-seq data and determined accessible regions from the data (22). The linear regression of these data again confirmed the strong association between genome accessibility and spurious-site abundance (r2 = 0.99, P = 0.007; Figure 2C). Note that we paired the genome accessibility of L3 with the spurious site abundance of L4, due to lack of ATAC-seq data at the L4 stage. This mismatch renders the observed strong correlation more conservative.
Our proposed mechanism of spurious site generation predicts that highly expressed genes are likely associated with more spurious sites than lowly expressed genes. To test this, we first classified coding genes as expressed and unexpressed (<1 RPKM). The expressed genes were further split evenly into highly and lowly expressed genes. Gene-associated genomic regions were defined as 2 kb regions both upstream and downstream of the transcription starting site(s). Within each of the three groups, overlapping regions were merged to avoid redundancy. Genomic regions that fell into multiple groups were reclassified into the highest expression group. For each of the three expression groups, the number of spurious sites whose summits lay within its genomic region was normalized by the total length of the regions. For all the samples, we consistently observed that the regions associated with the highly expressed genes contained more spurious sites than other regions (Figure 2D & Supplementary Figure S1). The GM12878, HepG2, and HeLa-S3 samples were excluded from this analysis due to insufficient spurious sites.
The human mock IPs utilized IgG antibodies respectively from rabbit, mouse and goat, while the fly and worm mock IPs used anti-GFP antibodies. If the GFP antibodies have more nonspecific interactions than the other antibodies, this would result in the more spurious sites in the fly and worm samples. To test this, from the ENCODE portal, we collected two sets of GFP mock IPs for K562 and paired the sets respectively with multiple DNA input controls to predict spurious sites (Supplementary Table S9). As a result, the average number of spurious sites (573) is similar to the one (666) from using the rabbit IgG antibodies (Figure 2A and B). Moreover, we used goat IgG antibodies to generate mock IPs for the fly embryos. This set of IgG mock IPs has 6059 spurious sites, and this number is similar to that (6110) of the GFP mock IPs (Figure 2A). Our embryo samples are a mix of fly embryos between zero to 24 h. Rieder et al. produced a set of mock IPs using rabbit IgG antibodies for the 2–4hr embryos (Supplementary Table S1) (31). From this set, we detected 3844 spurious sites, which is larger than that (2785) extrapolated from the regression between spurious-site abundance using GFP antibodies and fly transcriptome activity (Supplementary Figure S2).
In addition, we found six human TFs in the ENCODE portal, and each has its IPs generated respectively using the GFP antibodies and other antibodies for the same cell line sample (Supplementary Table S10). Moreover, these TFs also have their binding motifs determined by in vitro experiments (23). For these TFs, using the GFP antibodies resulted in a slightly higher motif enrichment in the detected binding peaks than using those other antibodies (Supplementary Figure S3). Taken together, these results suggest that the GFP antibodies are comparable to the other antibodies used in the current ChIP-seq practice. Therefore, the difference in spurious site abundance among human cell lines, worm, and fly is likely sample-specific rather than due to different antibody quality.
The ENCODE ChIP-seq pipeline requires at least two IP replicates to predict the number of sites. We tested the robustness of spurious-site abundance to the number of replicates used. For the fly embryos and prepupae, respectively, we used two out of the three mock IP replicates to predict spurious sites. The spurious-site abundance was reduced by only 15% on average to 5086 and 6143, respectively, presumably due to reduced detection power with fewer replicates (Supplementary methods; Supplementary Figure S4). This small reduction indicates that using two replicates is likely sufficient for ChIP-seq. This reduction does not change the result that fly samples have substantially more spurious sites than the other samples (Figure 2; Supplementary Table S11). In addition, this observation that using more replicates do not reduce spurious sites indicates that systematic biases rather than technical noises likely result in the spurious sites.
In addition, the spurious-site abundance is not correlated with the sequencing depth, indicating that the spurious sites are unlikely due to insufficient sequencing depths (Supplementary methods; Supplementary Table S11). Moreover, we predicted spurious sites from the mock IPs produced by Jain et al. This set of mock IPs has two replicates from fly embryos and was generated using a very different experimental protocol from ours, including a different antibody (Supplementary Table S1) (15). However, the spurious-site abundance (5586) was very close to the average (5086) predicted by our GFP mock IPs using two replicates (Supplementary Figure S4), suggesting the spurious sites robust to experimental protocols. Considering computational protocols, using another popular peak caller (HOMER) also resulted in large numbers of spurious sites (Supplementary Table S12) (32). Moreover, using a very conservative statistical protocol of the ENCODE computational pipeline resulted in only a 15% reduction in spurious sites (Supplementary Table S12).
Removing spurious binding sites from ChIP-seq using mock IP
Presumably due to the nonspecific interactions, many spurious sites have been identified from mock IPs using DNA input as a control, and such spurious sites likely persist in IP experiments when DNA input controls are used. The use of mock IP controls is expected to remove these spurious sites from the IPs. To test this, we used the IPs of 113 ChIP-seq datasets across six human cell lines and 499 ChIP-seq datasets from the three stages each in worm and fly. These ChIP-seq data have matched mock IP and DNA input controls. Consistent with our prediction, using mock IP controls for binding site prediction resulted in fewer binding sites than using DNA input controls (Figure 3A). The reduction was marginal for human cell lines, but was substantial for worm and fly samples. As expected, this reduction was highly correlated with the ratio between the numbers of the spurious sites detected from mock IP and the total sites detected from IP, respectively, using DNA input as a control (Supplementary Figure S5A). As expected, compared to the sites detected using the mock IP control, the sites obtained with the DNA input control are indeed more similar to the spurious sites (Supplementary Figure S5B).
Figure 3.

Reducing spurious sites from IP experiments using mock IP as controls. Compared to DNA input controls, the mock IP controls lead to fewer binding sites detected from IP experiments (A). The Wilcoxon signed-rank test was used. The numbers of ChIP-seq datasets were 113, 182 and 317 respectively for human, worm, and fly. To compare the motif enrichments of binding sites predicted by different approaches, we focused on the ChIP-seq data with known TF binding motifs. The sample sizes for fly (B), worm (C) and human (D) were 127, 44, 29, respectively. The whiskers in panels B, C and D indicate the standard errors of the means of motif fractions. From these ChIP-seq data, the motifs of unique TFs were used to calculate motif entropies (E). The samples sizes were 122, 23 and 41 TFs for fly, human, and worm. The Wilcoxon rank sum test was used.
Motif enrichment in binding sites predicted using mock IP
Compared to using DNA input control, the mock IP control removes many potentially spurious sites, and thus the resultant peaks are expected to enrich for more TF binding motifs. To test this prediction, we focused on the TFs with their binding motifs discovered by in vitro experiments such as PBM (23). Indeed, the mock IP controls substantially outperformed the DNA input controls in motif enrichment for fly and worm binding peaks (Figure 3B and C). The improvements in average motif enrichment were 37% (Sign test, P < 6.4e–4) and 18% (P = 0.007), respectively, for the top 50 peaks ranked by the SPP signal (9). For all the predicted binding sites, such improvements were 66% (P < 9.3e–7; Supplementary Figure S6A) and 25% (P < 5.3e–6; Supplementary Figure S6B). We also provided an example that mock IP controls can prevent both false-positive and false-negative predictions (Supplementary Figure S7).
The improvements we observed for fly and worm TFs were robust to different parameters (Supplementary methods; Supplementary Figure S8) and peak callers (Supplementary Figure S9) (32). For human cell lines, the spurious site abundances were quite low, and thus for the top predicted sites, the improvement in motif enrichment using mock IP controls was also small (Sign test, P = 0.06; Figure 3D). In addition, we tested whether the improvement in motif enrichment might be due to different GC content. To this end, we shuffled the nucleotides of the predicted binding peaks to scramble motifs, but maintained the GC content of the peaks. We observed no difference in motif enrichment between using mock IP and DNA input controls (Figure 3B–D). Therefore, the observed improvements are not due to potential GC content difference between the binding peaks in comparison.
Even with mock IP controls, the predicted binding peaks of worm and fly TFs still have lower motif enrichments than those of human TFs (Figure 3B–D). However, we postulate that this comparison between different TFs is not informative for two reasons. First, the human, fly, and worm motifs are generated using different techniques such as B1H, SELEX and PBM (24–27). These high-throughput experiments may have quite different accuracies. Obviously, low accuracy diminishes the actual motif enrichment in binding peaks. Second, it may be that some TFs are more permissive than others and bind to a larger number of various DNA sequences, and thus even spurious sites tend to have such motifs by chance. Note that the existence of a motif does not necessarily indicate a TF binding event; for example, the DNA with the motif needs to be accessible to the TF.
The high entropy of a motif indicates that the DNA sequences of the motif are very diverse. The high entropy can be attributed to relaxed evolutionary constraints (e.g. permissive TFs) and/or inevitable technical noise in the in vitro experiments that determines the motif. The noise entropies are difficult to estimate directly; however, reduced constraints are expected in species with small effective population sizes (33). We calculated the motif entropies of fly, human and worm (Figure 3E; see Methods). The human motifs have higher entropies (Figure 3E) and higher enrichments in the binding peaks than the fly motifs (Figure 3D). Because high entropy due to technical noise is expected to artificially reduce motif enrichment, the high entropy of the human data may be partially due to the small effective population size (∼104) of human (34–38) compared to that of fly (39). As for worm, its effective population size is comparable to that of human (40,41). However, the worm motifs have higher entropies and lower enrichments than the human motifs (Figure 3), likely suggesting more technical noise in the worm motifs.
Predicting potentially spurious site abundance in human tissues
We observed that spurious site abundance increases with genome accessibility. The human tissue/organ samples in the ENCODE portal have substantially more accessible chromatin than human cell lines/primary cells (Figure 4A). Unfortunately, there is a lack of comparable DNA input and mock IP controls for human tissues in the ENCODE portal, rendering direct estimation of spurious-site abundance impossible. Instead, we used genome accessibility of human tissues/organs to estimate their spurious site numbers. Extrapolating from the regression (Figure 2B), the median of spurious sites in human tissues and organs is 9819, which is much larger than that estimated from the human cell lines (Figure 4B). This estimation is very rough, but suggests the necessity of extra examinations for the ChIP-seq data from human organs and tissues, which are being widely used for studying human diseases.
Figure 4.

Inferring spurious site abundance in human tissues and organs. The human tissues and organs have much higher genome accessibilities than the human cell lines and primary cells (A). The Wilcoxon rank sum test was used, and sample sizes of the cells and tissues are 150 and 60 respectively. From the regression between genome accessibility and the number of spurious sites, the spurious site abundances were predicted from the genome accessibilities of the cell lines/primary cells and tissues/organs (B). Note that the number of spurious sites is defined as the sites detected from mock IP using DNA input as the control. Only a fraction of such spurious sites persists in the binding peaks predicted from the IPs with DNA input controls. More spurious sites remained results in lower motif enrichment in the predicted binding peaks. The binding peaks detected from organs/tissues contained fewer motifs than those from cell lines and primary cells (C). The whiskers in panel C indicate the standard errors of the means of motif fractions for the seven TFs.
The high spurious-site abundance predicted in tissues/organs indicates low motif enrichment. However, as discussed above, the motifs of different TFs are likely not comparable. Therefore, we focused on seven human TFs, RXRA, EGR1, SP1, MAX, GABPA, YY1 and HNF4A, in the ENCODE portal. Each of the TFs has ChIP-seq data generated in both a human cell line/primary cell and a human tissue. These TFs also have binding motifs determined by in vitro experiments in the Cis-bp database. With DNA input as the control, the binding sites of these TFs in tissues indeed enriched for fewer motifs than those in the cell lines (Figure 4C). This reduction in average motif enrichment was 17% for the top 50 binding peaks ranked by SPP binding signal, which was much larger than that (1%) between the sites predicted from cell lines with mock IP and DNA controls, respectively (Figure 3D). For all the predicted sites, the average reduction was 28% (Sign test, P = 0.06). Note that we used only genome accessibility for spurious site prediction because adding transcriptome activity did not significantly improve the regression in Figure 2B.
Prevalence of potentially spurious sites in ChIP-seq using DNA input as a control
Spurious sites are defined as the sites detected from mock IP experiments with DNA input controls. These sites are spurious due to the lack of specific interactions in the mock IPs (i.e. the antibodies and their target TFs). Therefore, nonspecific interactions are presumably the main factor causing these sites. Different from mock IPs, IP experiments contain specific interactions, which may deplete the nonspecific interactions, and in turn reduce spurious sites for the IPs. Estimating the prevalence of persisting spurious sites in the IPs is extremely difficult, if not impossible, simply because bona fide sites are largely unknown. As a rough estimation, for each TF we first detected binding sites from its IP experiment, with DNA input and mock IP as controls. The sites predicted using mock IP controls were then considered bona fide sites. In the sites detected using DNA input controls, the ones not overlapped with the approximate bona fide sites are likely the spurious sites that remain.
This rough estimation suggests that in worm and fly samples on average ∼60% and ∼80% sites predicted from IPs with DNA input controls are potentially spurious, whereas this number is ∼10% in human cell lines (Figure 5A). The prevalence of spurious sites is expected to be TF specific. For example, a genomic region predicted as a spurious site from the mock IPs may actually have the target TF binding, and thus is bona fide in the IPs. The spurious sites detected from mock IPs are enriched in actively transcribed regions, and thus tend to overlap with the bona fide binding sites of activating TFs. To test the influence of TF functionality on spurious site prevalence, we classified the TFs into activating and repressing groups according to the Gene Ontology (GO) database (42). For the fly TFs in embryos, the activating TFs indeed had lower spurious site prevalence than the repressing TFs using DNA input controls (Wilcoxon test, P = 0.04; Figure 5B). No significance was observed for other samples that had much smaller sample sizes. As expected, using mock IP controls, the activating TFs had more binding sites than the repressing TFs (Figure 5C).
Figure 5.
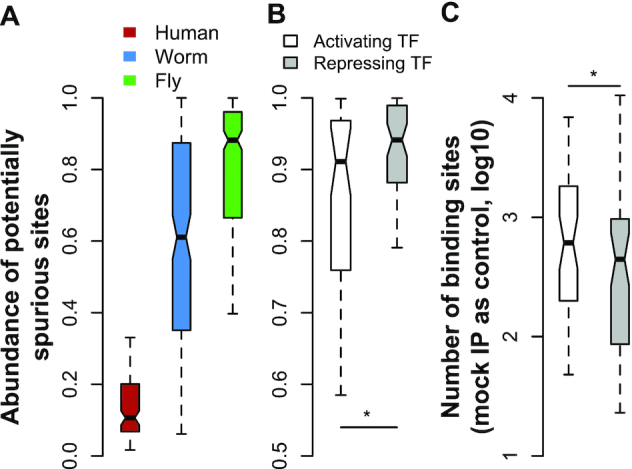
Sample and TF specificities of spurious site prevalence. A large fraction of binding sites detected using DNA input controls are potentially spurious in worm and fly samples, and the fraction is relatively small in the human cell lines (A). The sample sizes are 113, 182 and 317 ChIP-seq datasets, respectively, for human, worm, and fly. The fly TFs that tend to activate gene expression have smaller fractions of potentially spurious sites, compared to the repressive TFs (B). The numbers of activating and repressing fly TFs with ChIP-seq data from embryo stage are 48 and 56. When mock IP controls are used, the activating TFs tend to have more binding sites than the repressive TFs (C). ‘*’ indicates P-value < 0.05, based on the Wilcoxon rank sum test.
We showed that for worm and fly TFs, most of the sites predicted from IP experiments using DNA input controls did not overlap with the sites predicted using mock IP controls, suggesting a high prevalence of potentially spurious sites. In contrast, most of the sites (∼80%) predicted by mock IP controls overlapped with the sites by DNA input controls (Supplementary Figure S6C and D). Although the top binding sites predicted by DNA input controls enriched for binding sites by mock IP controls, the enrichment was not much higher than that of the lower ranked sites (Supplementary Figure S6E and F). Therefore, focusing only on the very top binding sites by DNA input controls may lose many bona fide binding sites.
Combining mock IP and DNA input to predict TF binding sites
Although the mock IP control removes spurious sites more efficiently than the DNA input control, the DNA input is still informative in binding site detection and may acquire more DNA material from a sample than the mock IP. In addition, different scoring metrics have been developed for binding site detection. For example, the signal score in SPP depends directly on the enrichment of sequencing reads in the IP, compared to its control. Another widely used metric is the statistical significance of the read enrichment (43). We developed a simple framework that takes advantage of using both mock IP and DNA input controls as well as multiple scoring metrics. We focused on the ChIP-seq data of worm and fly TFs. Each of the datasets has IP replicates (denoted as i) with a DNA input control (d) as shown in Figure 1A, and a mock IP (m’) control with a corresponding DNA input (d’) as shown in Figure 1B.
These experiments were scaled to the same sequencing depth. For each TF, we used SPP to identify the peak regions in the genome using the IP (i) and the mock IP (m’). For each peak region,  ,
,  ,
,  and
and  are the numbers of reads in the four experiments mapped to the region. The probability for the region being a binding site is indicated by
  , where
  and
and  for estimation purposes. We assume
  following a binomial distribution, i.e.,
  , where
  is the prior distribution and
  is the number of total reads from the region in i and d. Because
  is an uninformative conjugate prior, the posterior distribution of
  is
is  . With the same assumptions, we have
  , where
  is the number of total reads from the region in m’ and d’. With this setting,
  can be expressed as in Equation 2.
 |
(2) |
Due to lack of an analytical solution, we estimate the integral by simulation.
The higher probability indicates the genomic region is more likely to be a TF binding site. The genomic regions, as binding peaks, are ranked by this probability, and the ranked peaks of the multiple IP replicates then passed to the tool of IDR (19) in the ENCODE pipeline to determine binding sites. When DNA input is the only control, the probability is simply  . With the same derivation, the probability of using only mock IP as a control is also calculated as described in the Methods section. As expected, multiple controls substantially outperform respectively DNA input or mock IP alone (Supplementary Figure S10). However, the probability with both controls performs similar to, but not always better than, the SPP score using only mock IP as a control (Figure 3B&C). This observation is probably due to the fact that compared to the probability, the SPP score is more informative by considering not only the read enrichment but also the distribution of the reads at a genomic region.
To take advantage of the SPP score and the probability calculated from both the mock IP and DNA input controls, we rank the peaks of a TF with the two scoring metrics respectively, resulting in two rankings for the one set of peaks. For each of the peaks, we sum its ranks in the two rankings and sort all the peaks again according to their summed ranks. This new ranking is then subjected to IDR for binding site detection. This strategy is reasonable because IDR is a robust model that uses only the rank of each peak for binding site detection. This novel method increases motif enrichments by 21% (Sign test, P < 1.4e–4, Figure 3B) and 8% (P = 0.24, Figure 3C) for the top 50 binding sites of fly and worm TFs, compared to the SPP method with mock IP controls. The improvement for worm is small and not statistically significant presumably because the spurious site prevalence of worm is relatively low and the sample size is small. Currently, summing up the ranks of a peak implicitly assigns equal weights to the rankings by the two metrics. Using equal weights is appropriate in this case because the two metrics perform similarly in binding site detection (Figure 3B and C). This strategy we developed can be extended to incorporate more metrics and controls.
Comparing the respective spurious sites of different antibodies
We have shown that the GFP, IgG, and ACF1 antibodies have similarly large numbers of spurious sites in fly embryos, suggesting that these antibodies have similar levels of interactions with nonantigens. However, these antibodies may still prefer different nonantigens, resulting in different spurious sites. To test this, we generated another set of GFP mock IPs for fly embryos. The spurious-site overlap (i.e. the number of overlapping sites divided by the total sites) between the two sets of GPF mock IPs is 74% (Figure 6A). Between the IgG mock IPs (0–24 h embryos) and the GFP mock IPs (0–24 h embryos), the average overlap is only 36% (Figure 6A). Between the ACF1 mock IPs and the GFP mock IPs, the percentage remained similarly low at 38% (Figure 6A). The ACF1 mock IPs were generated by Jain et al. for the 0–12 h embryos of fly, which may contribute to the low overlap. However, these ACF1 mock IPs showed a moderate overlap (62%) with the IgG mock IPs we generated (Figure 6A). As expected, because our IPs were generated with the GFP antibodies, using the GFP mock IPs as controls excluded many spurious sites and resulted in fewer predicted sites compared to using the other mock IPs (Figure 6B). The predicted binding sites were also highly enriched with target motifs (Figure 6C).
Figure 6.

Comparing mock IP experiments generated by different antibodies from fly embryos. The spurious binding sites were detected from the IgG antibody mock IP, GFP antibody mock IP, and ACF1 antibody mock IP using their corresponding DNA input controls. The consistency between the two sets of spurious sites is indicated by the number of overlapped sites divided by the number of total sites (A). Compared to the DNA input, the IgG antibody mock IP, and ACF1 antibody mock IP, the GFP antibody mock IPs predicted much fewer binding sites from ChIP-seq (B), and the resulting binding sites contained more target motifs (C). The whiskers in panel C indicate the standard errors of the means of motif fractions. The samples sizes are 127 and 44 respectively for fly and worm.
DISCUSSION
Our results indicate that many spurious sites may be generated by ChIP-seq experiments when DNA input is used as the control. These spurious sites are likely due to the nonspecific interactions between the antibodies and nonantigens during IP, and the spurious-site abundance of a sample is highly correlated with its genome activity. The strong and positive correlation holds, regardless of whether the samples are collected from the same or different species. In addition, the spurious-site abundance is also TF specific. We found that the TFs that activate gene expression had much fewer spurious sites than the repressive TFs. The abundance of spurious sites is robust to different experimental and computational protocols. More importantly, we demonstrated that using mock IP controls removed spurious sites and thus substantially improved motif enrichment in the binding sites predicted from complex samples.
We showed that different antibodies resulted in similarly large numbers of spurious sites in fruit fly embryos. However, the spurious sites of different antibodies tend to not overlap, suggesting that the antibody-nonantigen interactions, though referred to as nonspecific interactions, may be antibody specific. In line with this, the mock IPs produced using the same antibodies as IPs outperformed other mock IPs in filtering out spurious sites. These results together suggest that mock IPs are more effective if generated using the same antibody, same protocol, and from the same sample as the IPs. Due to the experimental design, our mock IPs of a sample can be used as the controls for the many IPs targeting different TFs in the sample, rendering our mock IPs cost-efficient. With such mock IPs, the detected binding sites contained many more target motifs than those detected with DNA input controls.
We expect that the ChIP-seq bias removed by mock IP controls can be also removed by optimizing each of the many steps in the ChIP-seq process, such as antibodies, buffers, and cross-linking time (8,10,11,44,45). Nonetheless, our results suggest that different samples, TFs, or antibodies likely require different calibrations. Therefore, it is difficult to find all the optima for different TFs from different samples. For example, the specificity of a TF may be sufficient for a simple sample but not for a complex sample. In contrast, we showed that using the mock IPs substantially improved binding site prediction for many complex samples. This improvement required the mock IPs generated by the same protocol as the IPs. Therefore, we preferred mock IP controls for our project to produce ChIP-seq data for many TFs from many different samples. However, the protocols still need optimization for example to acquire sufficient DNA material.
With DNA input controls, the binding sites of many TFs have been predicted from cell lines, tissues, and organs. Our results suggest that different samples or different TFs may have very different spurious-site abundance, which may impair comparative analyses of those binding sites. For example, tissues may have gene regulatory networks artificially more connected than cell lines. In addition, the TF specificity of spurious sites further exacerbates the comparability. Our discoveries also provide potential insight into highly occupied targeted (HOT) regions (46,47). A HOT region is a genomic region with binding sites of more TFs than expected. The abundant spurious sites unlikely influence HOT regions qualitatively because the existence of spurious sites in a genomic region indicates abundant regulatory protein binding in that region, which by definition is likely a HOT region.
The three species, human, worm, and fly, have similar numbers of coding genes as potential targets of TFs. However, using mock IP controls, TFs in human cell lines tend to have substantially more binding sites than TFs assayed in whole worm or fly, and the fly TFs have slightly more binding sites than the worm TFs (Figure 3A). These numbers of binding sites across the three species are proportional to their genome sizes. This proportion to the genome size may be due to the fact that the larger genome contains more motifs for TF binding by chance. The more motifs in the larger genome may be favored by natural selection to attract TFs around the chromosomes, which increases the utility of TFs. Moreover, a larger genome may have more ‘TF reservoirs’, which are DNA sequences containing weak binding affinities to TFs and might be used to buffer the system and maintain an optimal amount of available TFs in the nucleus (48,49).
In summary, we provide evidence for a potential mechanism and a corrective approach to address the issue of spurious-site abundance in ChIP-seq data. The abundance in a sample is strongly associated with its genome accessibility. With low accessibility, the human cell lines have small numbers of spurious sites, and thus using DNA input and mock IP controls performed similarly for the ChIP-seq. This might have led to the notion that DNA input controls are sufficient for ChIP-seq. However, in complex samples, the abundance of spurious sites is substantial using DNA input controls, whereas using mock IP controls results in more accurate and comparable binding sites across samples. For further improvement, we developed a novel method that incorporates both DNA input and mock IP controls as well as different scoring metrics for binding site detection. This enhanced method will better capture the true binding sites of TFs to gain a better understanding of their roles in development and physiology.
DATA AVAILABILITY
All sequencing data generated in this study are deposited in the ENCODE portal. The accession numbers are listed in supplementary tables. The processed data and the software, Bay2Ctrls, we developed are downloadable at https://github.com/gersteinlab/Bay2Ctrls.
Supplementary Material
Contributor Information
Jinrui Xu, Program in Computational Biology and Bioinformatics, Yale University, New Haven, CT 06520, USA; Department of Molecular Biophysics and Biochemistry, Yale University, New Haven, CT 06520, USA.
Michelle M Kudron, Department of Genetics, Yale University, New Haven, CT 06520, USA.
Alec Victorsen, Institute for Genomics and Systems Biology, Department of Human Genetics, University of Chicago, IL 60637, USA.
Jiahao Gao, Program in Computational Biology and Bioinformatics, Yale University, New Haven, CT 06520, USA; Department of Molecular Biophysics and Biochemistry, Yale University, New Haven, CT 06520, USA.
Haneen N Ammouri, Institute for Genomics and Systems Biology, Department of Human Genetics, University of Chicago, IL 60637, USA.
Fabio C P Navarro, Program in Computational Biology and Bioinformatics, Yale University, New Haven, CT 06520, USA; Department of Molecular Biophysics and Biochemistry, Yale University, New Haven, CT 06520, USA.
Louis Gevirtzman, Department of Genome Sciences, University of Washington School of Medicine, Seattle, WA 98195, USA.
Robert H Waterston, Department of Genome Sciences, University of Washington School of Medicine, Seattle, WA 98195, USA.
Kevin P White, Institute for Genomics and Systems Biology, Department of Human Genetics, University of Chicago, IL 60637, USA.
Valerie Reinke, Department of Genetics, Yale University, New Haven, CT 06520, USA.
Mark Gerstein, Program in Computational Biology and Bioinformatics, Yale University, New Haven, CT 06520, USA; Department of Molecular Biophysics and Biochemistry, Yale University, New Haven, CT 06520, USA; Department of Computer Science, Yale University, New Haven, CT 06520, USA; Department of Statistics and Data Science, Yale University, New Haven, CT 06520, USA.
SUPPLEMENTARY DATA
Supplementary Data are available at NAR Online.
FUNDING
National Institutes of Health grant [U41HG007355]. Funding for open access charge: U41HG007355.
Conflict of interest statement. None declared.
REFERENCES
- 1. Johnson D.S., Mortazavi A., Myers R.M., Wold B.. Genome-wide mapping of in vivo protein-DNA interactions. Science. 2007; 316:1497–1502. [DOI] [PubMed] [Google Scholar]
- 2. Robertson G., Hirst M., Bainbridge M., Bilenky M., Zhao Y., Zeng T., Euskirchen G., Bernier B., Varhol R., Delaney A.et al.. Genome-wide profiles of STAT1 DNA association using chromatin immunoprecipitation and massively parallel sequencing. Nat. Methods. 2007; 4:651–657. [DOI] [PubMed] [Google Scholar]
- 3. Mikkelsen T.S., Ku M., Jaffe D.B., Issac B., Lieberman E., Giannoukos G., Alvarez P., Brockman W., Kim T.K., Koche R.P.et al.. Genome-wide maps of chromatin state in pluripotent and lineage-committed cells. Nature. 2007; 448:553–560. [DOI] [PMC free article] [PubMed] [Google Scholar]
- 4. Barski A., Cuddapah S., Cui K., Roh T.Y., Schones D.E., Wang Z., Wei G., Chepelev I., Zhao K.. High-resolution profiling of histone methylations in the human genome. Cell. 2007; 129:823–837. [DOI] [PubMed] [Google Scholar]
- 5. Ho J.W., Bishop E., Karchenko P.V., Negre N., White K.P., Park P.J.. ChIP-chip versus ChIP-seq: lessons for experimental design and data analysis. BMC Genomics. 2011; 12:134. [DOI] [PMC free article] [PubMed] [Google Scholar]
- 6. Schones D.E., Zhao K.. Genome-wide approaches to studying chromatin modifications. Nat. Rev. Genet. 2008; 9:179–191. [DOI] [PMC free article] [PubMed] [Google Scholar]
- 7. Park P.J. ChIP-seq: advantages and challenges of a maturing technology. Nat. Rev. Genet. 2009; 10:669–680. [DOI] [PMC free article] [PubMed] [Google Scholar]
- 8. Kidder B.L., Hu G., Zhao K.. ChIP-Seq: technical considerations for obtaining high-quality data. Nat. Immunol. 2011; 12:918–922. [DOI] [PMC free article] [PubMed] [Google Scholar]
- 9. Kharchenko P.V., Tolstorukov M.Y., Park P.J.. Design and analysis of ChIP-seq experiments for DNA-binding proteins. Nat. Biotechnol. 2008; 26:1351–1359. [DOI] [PMC free article] [PubMed] [Google Scholar]
- 10. Landt S.G., Marinov G.K., Kundaje A., Kheradpour P., Pauli F., Batzoglou S., Bernstein B.E., Bickel P., Brown J.B., Cayting P.et al.. ChIP-seq guidelines and practices of the ENCODE and modENCODE consortia. Genome Res. 2012; 22:1813–1831. [DOI] [PMC free article] [PubMed] [Google Scholar]
- 11. Meyer C.A., Liu X.S.. Identifying and mitigating bias in next-generation sequencing methods for chromatin biology. Nat. Rev. Genet. 2014; 15:709–721. [DOI] [PMC free article] [PubMed] [Google Scholar]
- 12. Davis C.A., Hitz B.C., Sloan C.A., Chan E.T., Davidson J.M., Gabdank I., Hilton J.A., Jain K., Baymuradov U.K., Narayanan A.K.et al.. The encyclopedia of DNA elements (ENCODE): data portal update. Nucleic Acids Res. 2018; 46:D794–D801. [DOI] [PMC free article] [PubMed] [Google Scholar]
- 13. Teytelman L., Thurtle D.M., Rine J., van Oudenaarden A.. Highly expressed loci are vulnerable to misleading ChIP localization of multiple unrelated proteins. Proc. Natl. Acad. Sci. U.S.A. 2013; 110:18602–18607. [DOI] [PMC free article] [PubMed] [Google Scholar]
- 14. Park D., Lee Y., Bhupindersingh G., Iyer V.R.. Widespread misinterpretable ChIP-seq bias in yeast. PLoS One. 2013; 8:e83506. [DOI] [PMC free article] [PubMed] [Google Scholar]
- 15. Jain D., Baldi S., Zabel A., Straub T., Becker P.B.. Active promoters give rise to false positive ‘Phantom Peaks’ in ChIP-seq experiments. Nucleic Acids Res. 2015; 43:6959–6968. [DOI] [PMC free article] [PubMed] [Google Scholar]
- 16. Conlan R.S., Gounalaki N., Hatzis P., Tzamarias D.. The Tup1-Cyc8 protein complex can shift from a transcriptional co-repressor to a transcriptional co-activator. J. Biol. Chem. 1999; 274:205–210. [DOI] [PubMed] [Google Scholar]
- 17. Zhang L., Guarente L.. Evidence that TUP1/SSN6 has a positive effect on the activity of the yeast activator HAP1. Genetics. 1994; 136:813–817. [DOI] [PMC free article] [PubMed] [Google Scholar]
- 18. Li H., Durbin R.. Fast and accurate short read alignment with Burrows-Wheeler transform. Bioinformatics. 2009; 25:1754–1760. [DOI] [PMC free article] [PubMed] [Google Scholar]
- 19. Li Q., Brown J.B., Huang H., Bickel P.J.. Measuring reproducibility of high-throughput experiments. Annals of Applied Statistics. 2011; 5:1752–1779. [Google Scholar]
- 20. Kudron M.M., Victorsen A., Gevirtzman L., Hillier L.W., Fisher W.W., Vafeados D., Kirkey M., Hammonds A.S., Gersch J., Ammouri H.et al.. The ModERN Resource: Genome-Wide binding profiles for hundreds of drosophila and caenorhabditis elegans transcription factors. Genetics. 2018; 208:937–949. [DOI] [PMC free article] [PubMed] [Google Scholar]
- 21. Gerstein M.B., Rozowsky J., Yan K.K., Wang D., Cheng C., Brown J.B., Davis C.A., Hillier L., Sisu C., Li J.J.et al.. Comparative analysis of the transcriptome across distant species. Nature. 2014; 512:445–448. [DOI] [PMC free article] [PubMed] [Google Scholar]
- 22. Daugherty A.C., Yeo R.W., Buenrostro J.D., Greenleaf W.J., Kundaje A., Brunet A.. Chromatin accessibility dynamics reveal novel functional enhancers in C. elegans. Genome Res. 2017; 27:2096–2107. [DOI] [PMC free article] [PubMed] [Google Scholar]
- 23. Weirauch M.T., Yang A., Albu M., Cote A.G., Montenegro-Montero A., Drewe P., Najafabadi H.S., Lambert S.A., Mann I., Cook K.et al.. Determination and inference of eukaryotic transcription factor sequence specificity. Cell. 2014; 158:1431–1443. [DOI] [PMC free article] [PubMed] [Google Scholar]
- 24. Tuerk C., Gold L.. Systematic evolution of ligands by exponential enrichment: RNA ligands to bacteriophage T4 DNA polymerase. Science. 1990; 249:505–510. [DOI] [PubMed] [Google Scholar]
- 25. Bulyk M.L., Gentalen E., Lockhart D.J., Church G.M.. Quantifying DNA-protein interactions by double-stranded DNA arrays. Nat. Biotechnol. 1999; 17:573–577. [DOI] [PubMed] [Google Scholar]
- 26. Mukherjee S., Berger M.F., Jona G., Wang X.S., Muzzey D., Snyder M., Young R.A., Bulyk M.L.. Rapid analysis of the DNA-binding specificities of transcription factors with DNA microarrays. Nat. Genet. 2004; 36:1331–1339. [DOI] [PMC free article] [PubMed] [Google Scholar]
- 27. Meng X., Brodsky M.H., Wolfe S.A.. A bacterial one-hybrid system for determining the DNA-binding specificity of transcription factors. Nat. Biotechnol. 2005; 23:988–994. [DOI] [PMC free article] [PubMed] [Google Scholar]
- 28. Grant C.E., Bailey T.L., Noble W.S.. FIMO: scanning for occurrences of a given motif. Bioinformatics. 2011; 27:1017–1018. [DOI] [PMC free article] [PubMed] [Google Scholar]
- 29. Consortium, E.P. An integrated encyclopedia of DNA elements in the human genome. Nature. 2012; 489:57–74. [DOI] [PMC free article] [PubMed] [Google Scholar]
- 30. Flensburg C., Kinkel S.A., Keniry A., Blewitt M.E., Oshlack A.. A comparison of control samples for ChIP-seq of histone modifications. Front Genet. 2014; 5:329. [DOI] [PMC free article] [PubMed] [Google Scholar]
- 31. Rieder L.E., Jordan W.T. 3rd, Larschan E.N.. Targeting of the dosage-compensated male X-chromosome during early Drosophila development. Cell Rep. 2019; 29:4268–4275. [DOI] [PMC free article] [PubMed] [Google Scholar]
- 32. Heinz S., Benner C., Spann N., Bertolino E., Lin Y.C., Laslo P., Cheng J.X., Murre C., Singh H., Glass C.K.. Simple combinations of lineage-determining transcription factors prime cis-regulatory elements required for macrophage and B cell identities. Mol. Cell. 2010; 38:576–589. [DOI] [PMC free article] [PubMed] [Google Scholar]
- 33. Lynch M. The origins of genome architecture. Hardcover. 2007; Sunderland: Sinauer Associates, Inc; 494. [Google Scholar]
- 34. Erlich H.A., Bergstrom T.F., Stoneking M., Gyllensten U.. HLA sequence polymorphism and the origin of humans. Science. 1996; 274:1552–1554. [PubMed] [Google Scholar]
- 35. Takahata N. Allelic genealogy and human evolution. Mol. Biol. Evol. 1993; 10:2–22. [DOI] [PubMed] [Google Scholar]
- 36. Tenesa A., Navarro P., Hayes B.J., Duffy D.L., Clarke G.M., Goddard M.E., Visscher P.M.. Recent human effective population size estimated from linkage disequilibrium. Genome Res. 2007; 17:520–526. [DOI] [PMC free article] [PubMed] [Google Scholar]
- 37. Sherry S.T., Rogers A.R., Harpending H., Soodyall H., Jenkins T., Stoneking M.. Mismatch distributions of mtDNA reveal recent human population expansions. Hum. Biol. 1994; 66:761–775. [PubMed] [Google Scholar]
- 38. Rogers A.R., Harpending H.. Population growth makes waves in the distribution of pairwise genetic differences. Mol. Biol. Evol. 1992; 9:552–569. [DOI] [PubMed] [Google Scholar]
- 39. Hawks J., Hunley K., Lee S.H., Wolpoff M.. Population bottlenecks and Pleistocene human evolution. Mol. Biol. Evol. 2000; 17:2–22. [DOI] [PubMed] [Google Scholar]
- 40. Sivasundar A., Hey J.. Population genetics of Caenorhabditis elegans: the paradox of low polymorphism in a widespread species. Genetics. 2003; 163:147–157. [DOI] [PMC free article] [PubMed] [Google Scholar]
- 41. Barriere A., Felix M.A.. High local genetic diversity and low outcrossing rate in Caenorhabditis elegans natural populations. Curr. Biol. 2005; 15:1176–1184. [DOI] [PubMed] [Google Scholar]
- 42. Carbon S., Ireland A., Mungall C.J., Shu S., Marshall B., Lewis S., Ami G.O.H.Web Presence Working, G. . AmiGO: online access to ontology and annotation data. Bioinformatics. 2009; 25:288–289. [DOI] [PMC free article] [PubMed] [Google Scholar]
- 43. Zhang Y., Liu T., Meyer C.A., Eeckhoute J., Johnson D.S., Bernstein B.E., Nusbaum C., Myers R.M., Brown M., Li W.et al.. Model-based analysis of ChIP-Seq (MACS). Genome Biol. 2008; 9:R137. [DOI] [PMC free article] [PubMed] [Google Scholar]
- 44. Baranello L., Kouzine F., Sanford S., Levens D.. ChIP bias as a function of cross-linking time. Chromosome Res. 2016; 24:175–181. [DOI] [PMC free article] [PubMed] [Google Scholar]
- 45. Gilfillan G.D., Hughes T., Sheng Y., Hjorthaug H.S., Straub T., Gervin K., Harris J.R., Undlien D.E., Lyle R.. Limitations and possibilities of low cell number ChIP-seq. BMC Genomics. 2012; 13:645. [DOI] [PMC free article] [PubMed] [Google Scholar]
- 46. Moorman C., Sun L.V., Wang J., de Wit E., Talhout W., Ward L.D., Greil F., Lu X.J., White K.P., Bussemaker H.J.et al.. Hotspots of transcription factor colocalization in the genome of Drosophila melanogaster. Proc. Natl. Acad. Sci. U.S.A. 2006; 103:12027–12032. [DOI] [PMC free article] [PubMed] [Google Scholar]
- 47. Gerstein M.B., Lu Z.J., Van Nostrand E.L., Cheng C., Arshinoff B.I., Liu T., Yip K.Y., Robilotto R., Rechtsteiner A., Ikegami K.et al.. Integrative analysis of the Caenorhabditis elegans genome by the modENCODE project. Science. 2010; 330:1775–1787. [DOI] [PMC free article] [PubMed] [Google Scholar]
- 48. Lin S., Riggs A.D.. The general affinity of lac repressor for E. coli DNA: implications for gene regulation in procaryotes and eucaryotes. Cell. 1975; 4:107–111. [DOI] [PubMed] [Google Scholar]
- 49. MacQuarrie K.L., Fong A.P., Morse R.H., Tapscott S.J.. Genome-wide transcription factor binding: beyond direct target regulation. Trends Genet. 2011; 27:141–148. [DOI] [PMC free article] [PubMed] [Google Scholar]
Associated Data
This section collects any data citations, data availability statements, or supplementary materials included in this article.
Supplementary Materials
Data Availability Statement
All sequencing data generated in this study are deposited in the ENCODE portal. The accession numbers are listed in supplementary tables. The processed data and the software, Bay2Ctrls, we developed are downloadable at https://github.com/gersteinlab/Bay2Ctrls.