Abstract
Chirality is essential in nature and often pivotal for biological information transfer, for example, via odor messenger molecules. While the human nose can distinguish the enantiomers of many chiral odors, the technical realization by an artificial sensor or an electronic nose, e‐nose, remains a challenge. Herein, we present an array of six sensors coated with nanoporous metal–organic framework (MOF) films of different homochiral and achiral structures, working as an enantioselective e‐nose. While the achiral‐MOF‐film sensors show identical responses for both isomers of one chiral odor molecule, the responses of the homochiral MOF films differ for different enantiomers. By machine learning algorithms, the combined array data allow the stereoselective identification of all compounds, here tested for five pairs of chiral odor molecules. We foresee the chiral‐MOF‐e‐nose, able to enantioselectively detect and discriminate chiral odors, to be a powerful approach towards advanced odor sensing.
Keywords: chirality, electronic nose, enantioselectivity, metal–organic frameworks, sensors
An enantioselective electronic nose based on an array of six sensors coated with nanoporous metal–organic framework films of different homochiral and achiral structures is presented. Each chiral film shows a different response for each enantiomer of the chiral odor molecules, allowing their discrimination. All tested odor molecules can be enantioselectively identified with high precision by using the combined data of the sensor array.
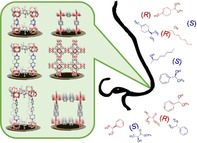
Chirality and enantioselectivity are fundamental in nature and crucial in various fields, ranging from DNA molecules to pharmaceuticals. [1] In addition, biological messenger molecules like pheromones are often chiral. [2] Typically the bioactivity is stereoselective and the different pheromone enantiomers have different, sometimes opposing, biological functions.[ 2 , 3 ] Equally, most chiral odor molecules have an enantioselective smell, meaning that the perception of the individual enantiomers by the human olfactory system differs significantly. Among the most popular examples is limonene: While the R‐isomer has an odor of an orange, the S‐isomer smells like lemons. [4] Another example is 1‐phenylethanol, the R‐isomer has a floral, earthy‐green odor, while the S‐isomer smells like mild hyacinth with strawberry nuances. [5] The odor of the R‐enantiomer of 2‐octanol is described as creamy, cucumber, fatty and sour, while the S‐enantiomer has more of a mushroom odor. [6] These odors and fragrances are characterized by a panel of judges with “trained noses”. [4] For quantification, the compositions of chiral odor samples are typically analyzed by enantioselective chromatography with homochiral columns.[ 6 , 7 ] When optimized, this method is very precise and sensitive; however, due to its complexity and setup size it is not suited for practical sensor applications.
Several efforts have been made to fabricate enantioselective sensors. Different chiral materials based on chiral polymers, [8] supramolecular chiral systems, [9] cyclodextrin, [10] carbon‐nanotubes, [11] or graphene [12] functionalized with chiral molecules were used to discriminate both enantiomers of one chiral molecule in a sensor setup. For example, in individual experiments, meaning one enantiomer pair at a time, the S‐ and R‐enantiomers of α‐pinene, β‐pinene, and limonene were distinguished by DNA‐functionalized carbon‐nanotubes. [11a]
A powerful technique for determining the molecular uptake is a quartz‐crystal microbalance (QCM), where the recorded frequency shift, corresponding to the mass change, is used as sensor signal. Although various chiral materials, like cyclodextrin,[ 10a , 13 ] chiral polymers, [14] and chiral molecular monolayers, [15] have demonstrated an enantioselective response in combination with a QCM, the enantioselective discrimination of many chiral molecules, for example, by a QCM‐based e‐nose, has not yet been demonstrated. For the simultaneous discrimination of many molecules, an array of sensors with different, ideally orthogonal, selectivities resulting in a multi‐dimensional response is required.
Films of nanoporous homochiral materials, such as homochiral metal–organic frameworks (MOFs), seem perfectly suited for sensing applications. In addition to their record specific surface area resulting in high sensitivities, a striking advantage of MOFs is their huge variety with roughly 100 000 published structures [16] and at least hundreds, presumably many thousands of homochiral MOF structures. [17] So far, numerous homochiral MOFs were used to discriminate the enantiomers of one chiral molecule. [18] There, R‐ and S‐enantiomers are typically distinguished by using chromatography or gravimetric techniques taking advantage of their enantioselective adsorption strength in the chiral MOF nanopores. [19] For example, using a lactate‐based MOF film in combination with a QCM allows the discrimination of the R‐ and S‐enantiomers of phenylethylamine and other molecules separately, one enantiomer pair at a time. [20]
A sensor array which detects and discriminates the enantiomers of various molecules (even in their pure form) simultaneously has not yet been presented. Such a sensor array should work like an electronic nose, e‐nose, [21] composed of different enantioselective sensors, allowing to distinguish various chiral molecules and their enantiomers. The application range of an enantioselective e‐nose is very wide, ranging from the sensing of bioactive chiral pheromones, e.g. to measure and inhibit the communication between infesting insects,[ 4 , 22 ] over examining product piracy, e.g. of chiral perfumes and aromas,[ 6 , 23 ] to quality control and adulteration of food. [24] E‐nose systems without enantioselectivity are already widely applied in many fields to detect odors, for instance to assess food authenticity and adulteration. [21] The active sensing materials in such e‐noses are typically based on polymers or inorganic materials with large surface areas. [21c] Recently, the potential of MOFs for e‐nose applications was demonstrated. [25] So far, enantioselective discrimination of many molecules is realized by the combination of the e‐nose with an enantioselective technique such as chiral chromatography or electrophoresis. [24a]
Herein, we present an enantioselective e‐nose, which is based on QCM sensors coated with six different nanoporous homochiral and achiral MOF thin films. The MOF thin films were directly prepared on the QCM sensors in a layer‐by‐layer fashion, resulting in surface‐mounted MOFs, SURMOFs. [26] The e‐nose was tested for five pairs of chiral odor molecules: (R)‐ and (S)‐limonene, (R)‐ and (S)‐2‐octanol, (R)‐ and (S)‐1‐phenylethanol (R)‐ and (S)‐1‐phenylethylamine and methyl (R/S) lactate, 10 volatile organic compounds (VOCs) in total. While the sensors with the achiral MOF structures show very similar responses for both isomers and can only distinguish the different molecules, the sensors coated with the homochiral MOF structures can enantioselectively distinguish the chiral molecules. By machine learning algorithms based on k‐nearest‐neighbor (kNN) analysis, [27] the sensor array can discriminate all molecules and their isomers with 96 % confidence.
The e‐nose is composed of six quartz‐crystal microbalance (QCM) sensors coated with SURMOFs of six different structures, comprising three homochiral and three achiral structures. The homochiral SURMOFs are Cu2(DCam)2(dabco), Cu2(DCam)2(BiPy), and Cu2(DCam)2(BiPyB), denoted as chirMOF1, chirMOF2, and chirMOF3. [28] DCam, which is d‐camphorate, is the homochiral layer linker in these pillared‐layer MOF structures. The pillar linkers are diazabicyclo[2.2.2]octane (dabco), 4,4′‐bipyridyl (BiPy), and 1,4‐bis(4‐pyridyl)benzene (BiPyB), respectively. The SURMOF synthesis is explained in the Supporting Information, SI. It was previously found that, although the chiral centers in these SURMOF films are identical, the enantioselective uptake can vary significantly. [28] The achiral MOF structures are HKUST‐1, [29] Cu(BDC), and Cu(BPDC), [30] denoted achirMOF1, achirMOF2, and achirMOF3, respectively, where BDC is benzene‐1,4‐dicarboxylate and BPDC is biphenyl‐4,4′‐dicarboxylate. The structures of the SURMOFs are shown in Figure 1 and S3. The X‐ray diffractograms (Figure S4) show that all samples are crystalline and have the targeted MOF structures. In addition, the diffraction patterns show that the samples are grown in an oriented way on the substrate. In detail, the chiral pillared‐layer SURMOFs are grown in (001) orientation [28] and the achiral SURMOFs are grown in (100) orientation[ 30 , 31 ] perpendicular to the substrate.
Figure 1.
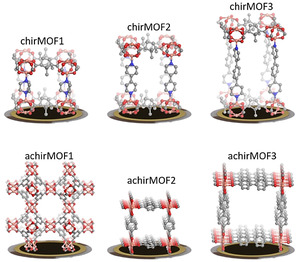
Chiral (top) and achiral (bottom) MOF structures coating the QCM sensors of the e‐nose. The term chirMOF1 denotes Cu2(DCam)2(dabco), chirMOF2 is Cu2(DCam)2(BiPy), chirMOF3 is Cu2(DCam)2(BiPyB), achirMOF1 is HKUST‐1, achirMOF2 is Cu(BDC), and achirMOF3 is Cu(BPDC).
The response of each QCM sensor, which is the frequency shift of the resonance frequency, is proportional to the mass change caused by the molecular uptake by the SURMOF films. [32] As reference, a blank QCM sensor (without SURMOF coating, Figure S10) shows essentially no response, verifying that the observed frequency shifts are caused by the uptake of the guest molecules in the MOF films. When the QCM‐SURMOF‐array is exposed to the different odor molecules, the frequency shifts of all sensors are recorded simultaneously. The sensor array response to limonene and phenylethanol, with various concentrations in the ppm range, is shown in Figure 2. The data of the response to the other molecules, which are 1‐phenylethylamine, 2‐octanol, and methyl lactate, are shown in Figure S6. Although the data for the different molecules appear qualitatively similar, some quantitative differences in the response can be found. For example, a detailed inspection shows that while the uptake of (S)‐limonene by chirMOF1 is more than three times as much as by chirMOF2, this ratio is only approximately 10 % for (R)‐limonene. Similarly, the uptake of (S)‐1‐phenylethanol by chirMOF3 is less than by achirMOF1, for (R)‐1‐phenylethanol it is opposite.
Figure 2.
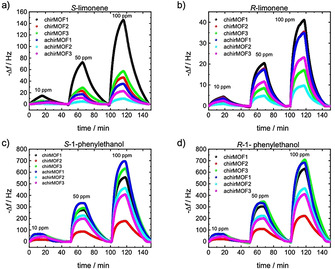
QCM response of the uptake of the enantiopure molecules as a function of time. The frequency shifts of the sensors with the different SURMOF coatings are shown in different colors with the color code given in the legend. The sensor array is exposed first to 10, then to 50 and to 100 ppm of the odors; in between, the sensors are purged in dry air. Panels (a) and (b) are for (S)‐ and (R)‐limonene, (c) and (d) for (S)‐ and (R)‐1‐phenylethanol.
Radar plots of the response to the different pure enantiomers at a concentration of 50 ppm are shown in Figure 3. The radar plots at 10 and 100 ppm, Figures S7, are qualitatively similar to the plot at 50 ppm, however with different scaling. The response of the achiral SURMOFs differs for different molecules but is essentially identical for both enantiomers, as found for all investigated molecules. This means that the molecules can be distinguished but, as expected, these sensors cannot distinguish the enantiomers. In detail, the achiral sensor responses for the R‐ and S‐enantiomers are within a range of a few percent, see Table S1, and the average difference is 3.0 %. On the other hand, the sensors coated with the homochiral MOF films show clear differences between the enantiomers of the same molecule. For instance, in addition to the limonene example discussed above, the response of 1‐phenylethylamine at the sensor chirMOF1 is 60 % larger for the R‐enantiomer in comparison to S. The chiral sensors show an average relative signal difference between both enantiomers of 40.4 %. In addition, while some molecules often show a stronger signal for the R‐isomers, like for methyl lacate and 1‐phenylethylamine, the signals of limonene in all three chiral sensors are stronger for the S‐isomer. For 2‐octanol, the signal of the R‐isomer is stronger than for S in sensors chirMOF1 and chirMOF3 but opposite in chirMOF2.
Figure 3.
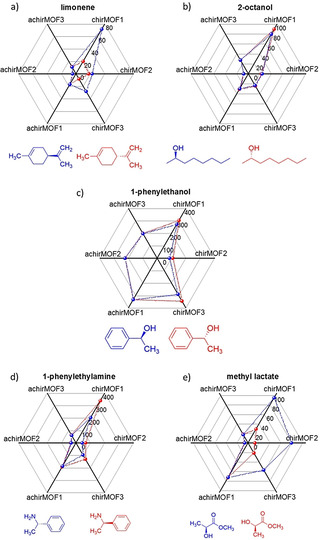
Radar plots of the sensor response to the exposure of a) (R)‐ and (S)‐limonene, b) (R)‐ and (S)‐2‐octanol, c) (R)‐ and (S)‐1‐phenylethanol, d) (R)‐ and (S)‐1‐phenylethylamine, and e) methyl (R)‐ and (S)‐lactate. The R‐enantiomers are plotted in red, S‐enantiomers are plotted in blue. The concentration is 50 ppm. The axes of the radar plots are the negative values of the recorded frequency shifts in Hz at the end of each uptake period, averaged over 40 points, see Table S1. These values correspond to the averaged maximum signals. The molecular structures of the R‐ and S‐enantiomers are shown below the radar plots.
Figure S8 shows the sensor response versus the odor concentration. The plots show essentially linear responses in the investigated range. Noteworthy, each sensor shows a different slope for the same molecule and, more importantly, different molecules show different slopes in the same sensor.
Since all isomers of the odor molecules have characteristic patterns on the radar plots, their identification is possible in principle. For a more detailed understanding and quantification of the sensor data and for a performance investigation of the enantioselective e‐nose, the data from the sensor array was analyzed by a machine learning algorithm. Here a kNN [27] algorithm was used, see SI.
The confusion matrices, summarizing the performance of the classification algorithm, are shown in Figure 4 and S11. The true classes are the rows and the predicted classes are the columns. The accuracy of classification of the data points by kNN is shown as percentage in the matrix. Correct classifications are on the main diagonal of the matrix; misclassifications are the other values. The confusion matrix (Figure 4 a) shows that all odors can be distinguished by their QCM‐array responses. Most enantiomers can be discriminated with perfect accuracy; only the discrimination of the 2‐octanol enantiomers shows an overlap of the R‐ and S‐isomers with about 80 % correct and 20 % false classifications. On average, the classification accuracy of distinguishing all 10 isomers is 96.1 %. This means a very high precision for detection and discrimination was realized.
Figure 4.
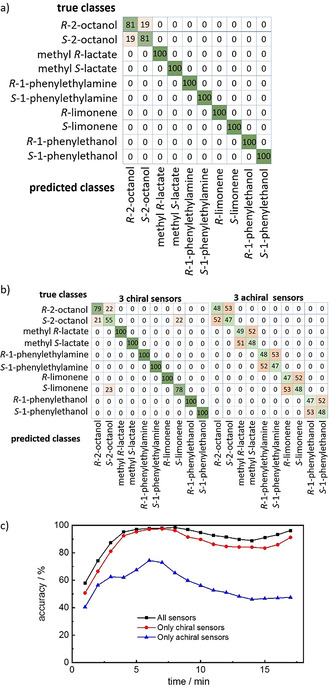
a) Confusion matrix of the discrimination of the isomers of the odor molecules based on the data of the entire sensor array, that is, all six sensors, see Figure 3 or Table S1. b) Confusion matrices of the discrimination of the isomers of the odor molecules only based on the data from all three chiral sensors (left) and all three achiral sensors (right). Green denotes correct classifications, red denotes false classifications. All numbers are given in %. c) The accuracy for the discrimination of the sensor data measured at different time intervals. Each value is determined from 40 consecutive data points, where the final points end at the values shown on the x‐axis. The data are for 50 ppm. The data for 10 and 100 ppm are shown in Figure S11.
For comparison, if the data from only the chiral sensors are used (Figure 4 b, left) the accuracy is slightly decreased to 91.2 %. In addition to the small misclassification of (R/S)‐octanol, (S)‐octanol is also misclassified as (S)‐limonene with 22 %. Using only the data from the three achiral sensors, Figure 4 b, right, shows that the molecules can be classified; however, the discrimination of the enantiomers is not possible. The chance of classifying the enantiomer correctly is about 1:1, i.e. 50 %. This is also expected, since the achiral MOFs possess no chiral moieties allowing an enantioselective response. Noteworthy, the molecules (not the enantiomers) are classified with 100 % accuracy.
The sensor responses during the exposure to the odor molecules can be described with mono‐exponential decay functions with time constants in the range of a few minutes, typically 3 to 10 min, see Table S2. In Figures 4 c and S11c, the transient behavior of the accuracies during the odor exposures is shown. The data show that the classification accuracy of the entire sensor array varies slightly in between about 90 and almost 100 %. Only at the beginning of the odor exposure (within the first 3 min) the accuracy is significantly smaller than the final value, which is caused by the initial large signal change per time and the accompanying large scattering of the data as well as the fact that all data curves, that is, all frequency shifts, start at 0 Hz. Nevertheless, the data of the sensor array allow already a decent classification of the chiral molecules right at the beginning, although the uptake curves are far from equilibrium. The classification accuracies based on only half the sensor array, either the three chiral or the three achiral sensors, also show slight changes with time and are always smaller than the accuracy from the entire array. While the chiral sensors allow a precise classification with only a few percent less than the entire sensor array, the accuracy based on only the achiral sensors is in the region of 50 %, in detail, in the range between 40 and 74 % for all concentrations and times. Please note that the kNN‐results of the data from 10, 50, and 100 ppm are very similar, with only minor changes of the classification accuracies, see Figure S11.
The sensor array also allows the analysis of the odor signals from different (pure) vapor concentrations simultaneously, Figure S12. Most signals can be unequivocally described to the isomer and the concentration, however, a few signals show cross‐sensitivities with different concentrations.
In addition to the kNN analysis, the results of linear discriminant analysis (LDA) and principal component analysis (PCA) are shown in Figures S13 and S14. The LDA scatterplots as well as the PCA score and loading plots also allow a straightforward visual enantioselective grouping and classification of the sensor responses.
In comparison to QCM‐based chiral recognition using cyclodextrin[ 10a , 13 ] or chiral polymers [14] as enantioselective sensor material, using chiral MOF films presents the advantage of sufficiently different selectivities enabled by the different MOF structures. Since the chemical space of MOFs is very large, the adsorption properties, and thus the sensor response, can be tuned. Ideally, a sensor array with very different or even orthogonal responses for all enantiomers should be realized. We like to stress that although the used chiral MOFs possess many structural similarities, the enantioselective response of these sensors are very different. Taking into account that roughly 100 000 MOF structures are currently known, including many chiral structures, the possibilities of using MOFs as sensor material seem unlimited.
In conclusion, a QCM sensor array coated with different homochiral and achiral MOF thin films is presented which works as an electronic nose for chiral odor molecules. While the achiral MOF sensors cannot distinguish the different isomers of the chiral odorants, each chiral MOF sensor shows a different response to the different enantiomers. As result, the combined data of the sensor array allow the enantioselective detection and discrimination of chiral odor molecules. The e‐nose was tested for five pairs of chiral odor molecules, where all ten enantiopure compounds were detected and distinguished with an average accuracy of 96 %.
In the future, the number of sensors in the array should be enlarged with MOF films with well‐chosen selectivities to increase the confidence of the sensing [33] and also to increase the range of detectable odors. In addition, the detection of chiral and achiral molecular mixtures by such a MOF‐e‐nose needs to be explored. While research in the last decades resulted in many chemically and thermally robust MOFs, [34] many chiral MOFs, including the structures used herein, show limited stability under long‐term exposure to humidity, which needs to be improved for real‐life chiral e‐noses. In addition, the e‐nose response to chiral molecules in (humid) air, which may significantly affect the QCM uptake data, has to be investigated as well, for instance by using large sensor arrays composed of (stable) hydrophilic and hydrophobic chiral MOF films. By using water‐stable chiral MOFs, we foresee that the application as an enantioselective electronic tongue is also feasible. [35] While the enantioselective interaction in other chiral materials, like cyclodextrin, is well understood, [36] the molecular enantioselective interaction in MOFs is only thoroughly explored for a few examples [37] and more research is required for a detailed understanding of the complex interaction. Due to the small size of MOF‐QCM sensors and the low sensor costs, we believe significant miniaturization to a handy sensor size suitable for practical and economic applications is possible.
Conflict of interest
The authors declare no conflict of interest.
Supporting information
As a service to our authors and readers, this journal provides supporting information supplied by the authors. Such materials are peer reviewed and may be re‐organized for online delivery, but are not copy‐edited or typeset. Technical support issues arising from supporting information (other than missing files) should be addressed to the authors.
Supplementary
Acknowledgements
We acknowledge funding through the Alexander von Humboldt Foundation (Philipp Schwartz Fellowship), the China Scholarship Council (CSC), and the Deutsche Forschungsgemeinschaft (DFG, German Research Foundation) under Germany's Excellence Strategy‐2082/1‐390761711 and DFG HE 7036/5. We also thank Stefan Bräse (KIT) for stimulating discussions. Open access funding enabled and organized by Projekt DEAL.
S. Okur, P. Qin, A. Chandresh, C. Li, Z. Zhang, U. Lemmer, L. Heinke, Angew. Chem. Int. Ed. 2021, 60, 3566.
References
- 1.
- 1a. Barron L. D., Space Sci. Rev. 2008, 135, 187–201; [Google Scholar]
- 1b. Salam A., J. Mol. Evol. 1991, 33, 105–113; [Google Scholar]
- 1c. Nguyen L. A., He H., Pham-Huy C., Int. J. Biomed. Sci. 2006, 2, 85–100. [PMC free article] [PubMed] [Google Scholar]
- 2. Mori K., Bioorg. Med. Chem. 2007, 15, 7505–7523. [DOI] [PubMed] [Google Scholar]
- 3. Tumlinson J. H., Klein M. G., Doolittle R. E., Ladd T. L., Proveaux A. T., Science 1977, 197, 789–792. [DOI] [PubMed] [Google Scholar]
- 4. Bentley R., Chem. Rev. 2006, 106, 4099–4112. [DOI] [PubMed] [Google Scholar]
- 5.
- 5a.M. I. Farbood, R. W. Blocker, J. Arvizzigno, R. Muralidhara, International Flavor and Fragrances Inc, 2007;
- 5b.J. C. Leffingwell, in http://www.leffingwell.com/chirality/chirality.htm.
- 6. Brenna E., Fuganti C., Serra S., Tetrahedron: Asymmetry 2003, 14, 1–42. [Google Scholar]
- 7. Berthod A., Chiral Recognition in Separation Methods: Mechanisms and Applications, Springer Berlin Heidelberg, Berlin, 2010. [Google Scholar]
- 8.
- 8a. Torsi L., Farinola G. M., Marinelli F., Tanese M. C., Omar O. H., Valli L., Babudri F., Palmisano F., Zambonin P. G., Naso F., Nat. Mater. 2008, 7, 412–417; [DOI] [PubMed] [Google Scholar]
- 8b. Maier N. M., Lindner W., Anal. Bioanal. Chem. 2007, 389, 377–397. [DOI] [PubMed] [Google Scholar]
- 9. Hembury G. A., Borovkov V. V., Inoue Y., Chem. Rev. 2008, 108, 1–73. [DOI] [PubMed] [Google Scholar]
- 10.
- 10a. Fietzek C., Hermle T., Rosenstiel W., Schurig V., Fresenius J. Anal. Chem. 2001, 371, 58–63; [DOI] [PubMed] [Google Scholar]
- 10b. Bodenhöfer K., Hierlemann A., Juza M., Schurig V., Göpel W., Anal. Chem. 1997, 69, 4017–4031; [DOI] [PubMed] [Google Scholar]
- 10c. Kurzawski P., Schurig V., Hierlemann A., Anal. Chem. 2009, 81, 9353–9364; [DOI] [PubMed] [Google Scholar]
- 10d. Xu C., Ng S. C., Chan H. S. O., Langmuir 2008, 24, 9118–9124. [DOI] [PubMed] [Google Scholar]
- 11.
- 11a. Kybert N. J., Lerner M. B., Yodh J. S., Preti G., Johnson A. T. C., ACS Nano 2013, 7, 2800–2807; [DOI] [PubMed] [Google Scholar]
- 11b. Khamis S. M., Jones R. A., Johnson A. T. C., Preti G., Kwak J., Gelperin A., AIP Adv. 2012, 2, 022110. [Google Scholar]
- 12. Zhang Y., Liu X., Qiu S., Zhang Q., Tang W., Liu H., Guo Y., Ma Y., Guo X., Liu Y., J. Am. Chem. Soc. 2019, 141, 14643–14649. [DOI] [PubMed] [Google Scholar]
- 13. Lu M. L., Zhang W. G., Zhang S., Fan J., Su W. C., Yin X., Chirality 2010, 22, 411–415. [DOI] [PubMed] [Google Scholar]
- 14. Haupt K., Noworyta K., Kutner W., Anal. Commun. 1999, 36, 391–393. [Google Scholar]
- 15.
- 15a. Guo H. S., Kim J. M., Chang S. M., Kim W. S., Biosens. Bioelectron. 2009, 24, 2931–2934; [DOI] [PubMed] [Google Scholar]
- 15b. Temel F., Erdemir S., Tabakci B., Akpinar M., Tabakci M., Anal. Bioanal. Chem. 2019, 411, 11. [DOI] [PubMed] [Google Scholar]
- 16. Moghadam P. Z., Li A., Wiggin S. B., Tao A., Maloney A. G. P., Wood P. A., Ward S. C., Fairen-Jimenez D., Chem. Mater. 2017, 29, 2618–2625. [Google Scholar]
- 17. Kaskel S., The Chemistry of Metal–Organic Frameworks: Synthesis Characterization, and Applications, Wiley, Hoboken, 2016. [Google Scholar]
- 18. Padmanaban M., Muller P., Lieder C., Gedrich K., Grunker R., Bon V., Senkovska I., Baumgartner S., Opelt S., Paasch S., Brunner E., Glorius F., Klemm E., Kaskel S., Chem. Commun. 2011, 47, 12089–12091. [DOI] [PubMed] [Google Scholar]
- 19.
- 19a. Duerinck T., Denayer J. F. M., Chem. Eng. Sci. 2015, 124, 179–187; [Google Scholar]
- 19b. Peluso P., Mamane V., Cossu S., J. Chromatogr. A 2014, 1363, 11–26; [DOI] [PubMed] [Google Scholar]
- 19c. Corella-Ochoa N., Tapia J. B., Rubin H. N., Lillo V., Gonzalez-Cobos J., Nunez-Rico J. L., Balestra S. R. G., Almora-Barrios N., Lledos M., Guell-Bara A., Cabezas-Gimenez J., Escudero-Adan E. C., Vidal-Ferran A., Calero S., Reynolds M., Marti-Gastaldo C., Galan-Mascaros J. R., J. Am. Chem. Soc. 2019, 141, 14306–14316; [DOI] [PubMed] [Google Scholar]
- 19d. Satska Y. A., Mikhalyova E. A., Chernenko Z. V., Kolotilov S. V., Zeller M., Komarov I. V., Tymtsunik A. V., Tolmachev A., Gavrilenko K. S., Addison A. W., RSC Adv. 2016, 6, 93707–93714. [Google Scholar]
- 20. Duan H. J., Yang C. X., Yan X. P., RSC Adv. 2015, 5, 30577–30582. [Google Scholar]
- 21.
- 21a. James D., Scott S. M., Ali Z., O'Hare W. T., Microchim. Acta 2005, 149, 1–17; [Google Scholar]
- 21b. Röck F., Barsan N., Weimar U., Chem. Rev. 2008, 108, 705–725; [DOI] [PubMed] [Google Scholar]
- 21c. Peris M., Escuder-Gilabert L., Trends Food Sci. Technol. 2016, 58, 40–54. [Google Scholar]
- 22. Mori K., Chirality 1998, 10, 578–586. [Google Scholar]
- 23. Ohloff G., Helv. Chim. Acta 1992, 75, 2041–2108. [Google Scholar]
- 24.
- 24a. Mirasoli M., Gotti R., Di Fusco M., Leoni A., Colliva C., Roda A., Talanta 2014, 129, 32–38; [DOI] [PubMed] [Google Scholar]
- 24b. Blanch G. P., Caja M. D., del Castillo M. L. R., Herraiz M., Eur. Food Res. Technol. 1999, 210, 139–143. [Google Scholar]
- 25.
- 25a. Gustafson J. A., Wilmer C. E., Sens. Actuators B 2018, 267, 483–493; [Google Scholar]
- 25b. Sturluson A., Sousa R., Zhang Y., Huynh M. T., Laird C., York A. H. P., Silsby C., Chang C.-H., Simon C. M., ACS Appl. Mater. Interfaces 2020, 12, 6546–6564; [DOI] [PubMed] [Google Scholar]
- 25c. Okur S., Zhang Z., Sarheed M., Nick P., Lemmer U., Heinke L., Sens. Actuators B 2020, 306, 127502. [Google Scholar]
- 26.
- 26a. Shekhah O., Wang H., Kowarik S., Schreiber F., Paulus M., Tolan M., Sternemann C., Evers F., Zacher D., Fischer R. A., Wöll C., J. Am. Chem. Soc. 2007, 129, 15118–15119; [DOI] [PubMed] [Google Scholar]
- 26b. Heinke L., Wöll C., Adv. Mater. 2019, 31, 1806324. [DOI] [PubMed] [Google Scholar]
- 27. Güney S., Atasoy A., Sens. Actuators B 2012, 166, 721–725. [Google Scholar]
- 28. Gu Z., Grosjean S., Bräse S., Wöll C., Heinke L., Chem. Commun. 2015, 51, 8998–9001. [DOI] [PubMed] [Google Scholar]
- 29. Chui S. S. Y., Lo S. M. F., Charmant J. P. H., Orpen A. G., Williams I. D., Science 1999, 283, 1148–1150. [DOI] [PubMed] [Google Scholar]
- 30. Liu J. X., Lukose B., Shekhah O., Arslan H. K., Weidler P., Gliemann H., Bräse S., Grosjean S., Godt A., Feng X. L., Mullen K., Magdau I. B., Heine T., Wöll C., Sci. Rep. 2012, 2, 921. [DOI] [PMC free article] [PubMed] [Google Scholar]
- 31. Gu Z., Heinke L., Wöll C., Neumann T., Wenzel W., Li Q., Fink K., Gordan O. D., Zahn D. R. T., Appl. Phys. Lett. 2015, 107, 183301. [Google Scholar]
- 32. Johannsmann D., The Quartz Crystal Microbalance in Soft Matter Research, Springer, Berlin: 2015. [Google Scholar]
- 33. Gustafson J. A., Wilmer C. E., ACS Sens. 2019, 4, 1586–1593. [DOI] [PubMed] [Google Scholar]
- 34. Kirchon A., Feng L., Drake H. F., Joseph E. A., Zhou H.-C., Chem. Soc. Rev. 2018, 47, 8611–8638. [DOI] [PubMed] [Google Scholar]
- 35. Phat C., Moon B., Lee C., Food Chem. 2016, 192, 1068–1077. [DOI] [PubMed] [Google Scholar]
- 36.
- 36a. Shahgaldian P., Pieles U., Sensors 2006, 6, 593–615; [Google Scholar]
- 36b. Jung M., Schmalzing D., Schurig V., J. Chromatogr. 1991, 552, 43–57; [Google Scholar]
- 36c. Schurig V., Molecules 2016, 21, 1535. [DOI] [PMC free article] [PubMed] [Google Scholar]
- 37.
- 37a. Bueno-Perez R., Martin-Calvo A., Gomez-Alvarez P., Gutierrez-Sevillano J. J., Merkling P. J., Vlugt T. J. H., van Erp T. S., Dubbeldam D., Calero S., Chem. Commun. 2014, 50, 10849–10852; [DOI] [PubMed] [Google Scholar]
- 37b. Bao X., Broadbelt L. J., Snurr R. Q., Phys. Chem. Chem. Phys. 2010, 12, 6466–6473; [DOI] [PubMed] [Google Scholar]
- 37c. Zhang S.-Y., Fairen-Jimenez D., Zaworotko M. J., Angew. Chem. Int. Ed. 2020, 59, 17600–17606; [DOI] [PMC free article] [PubMed] [Google Scholar]; Angew. Chem. 2020, 132, 17753–17759. [Google Scholar]
Associated Data
This section collects any data citations, data availability statements, or supplementary materials included in this article.
Supplementary Materials
As a service to our authors and readers, this journal provides supporting information supplied by the authors. Such materials are peer reviewed and may be re‐organized for online delivery, but are not copy‐edited or typeset. Technical support issues arising from supporting information (other than missing files) should be addressed to the authors.
Supplementary


