

Abstract
Ciliopathies caused by abnormal function of primary cilia include expanding spectrum of kidney, liver, and cardiovascular disorders. There is currently no treatment available for patients with cilia dysfunction. Therefore, we generated and compared two different (metal and polymer) cilia-targeted nanoparticle drug delivery systems (CTNDDS), CT-DAu-NPs and CT-PLGA-NPs, for the first time. These CTNDDS loaded with fenoldopam were further compared to fenoldopam-alone. Live-imaging of single-cell-single-cilium analysis confirmed that CTNDDS specifically targeted to primary cilia. While CTNDDS did not show any advantages over fenoldopam-alone in cultured cells in vitro, CTNDDS delivered fenoldopam more superior than fenoldopam-alone by eliminating the side effect of reflex tachycardia in murine models. Although slow infusion was required for fenoldopam-alone in mice, bolus injection was possible for CTNDDS. Though there were no significant therapeutic differences between CT-DAu-NPs and CT-PLGA-NPs, CT-PLGA-NPs tended to correct ciliopathy parameters closer to normal physiological levels, indicating CT-PLGA-NPs were better cargos than CT-DAu-NPs. Both CTNDDS showed no systemic adverse effect. In summary, our studies provided scientific evidence that existing pharmacological agent could be personalized with advanced nanomaterials to treat ciliopathy by targeting cilia without the need of generating new drugs.
Keywords: Cilia targeting, nanoparticles, drug delivery, calcium, nitric oxide, hypertension
Graphical Abstract
Nanotechnology promises to provide huge clinical impacts on advanced disease management and personalized medicine. Nanoparticles (NPs) have been used for targeted drug delivery at a desired site and a sustained release of a drug, which decrease the overall toxicity by delivering a smaller drug dosage.1,2 Polymeric NPs such as poly lactic-co-glycolic acid (PLGA) NPs are particularly attractive primarily due to their current use in clinical setting.3,4 Metal NPs including gold (Au) NPs have also gained attention because of their advantages in surface functionalization and their apparent low toxicity.5,6 Furthermore, the spherical shape of both PLGA and Au NPs is an attractive property in providing a colloidal stability. The spherical shape also provides a high surface area to volume ratio, which allows a suitability for targeting a molecular target in a physiological system.
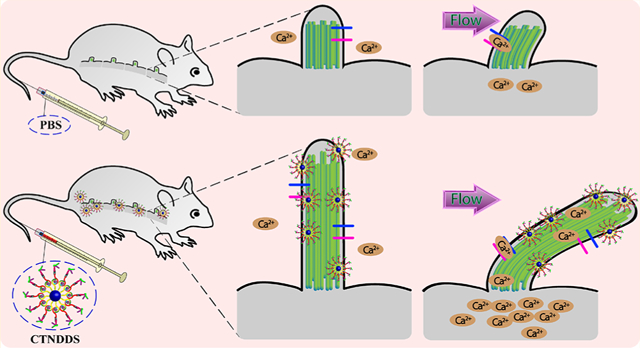
Primary cilia are cellular organelles that function as sensory compartments.7 Dysfunction in the chemosensory or mechanosensory of primary cilia results in a list of clinical diseases (ciliopathies) including cardiovascular disorders.8–10 As chemosensory organelles, cilia have various receptors that can be activated by small molecules and hormones. There are multiple G-protein-coupled receptors that have been localized to cilia including serotonin, somatostatin, melanin, and dopamine receptors.11–14 As mechanosensory organelles, cilia depend on many sensory proteins such as transient receptor potential channels and polycystins. Many agents have been shown to alter both cilia length and function.15–17 Unfortunately, there is no treatment for ciliopathy at present; it is primarily due to lacking of targeted or personalized therapy for ciliopathic patients. Because no study currently exists to target NPs to primary cilia, we tested the efficacies of both PLGA and dopamine-Au (DAu) NPs in targeting primary cilia for the first time (Scheme 1).
Scheme 1.
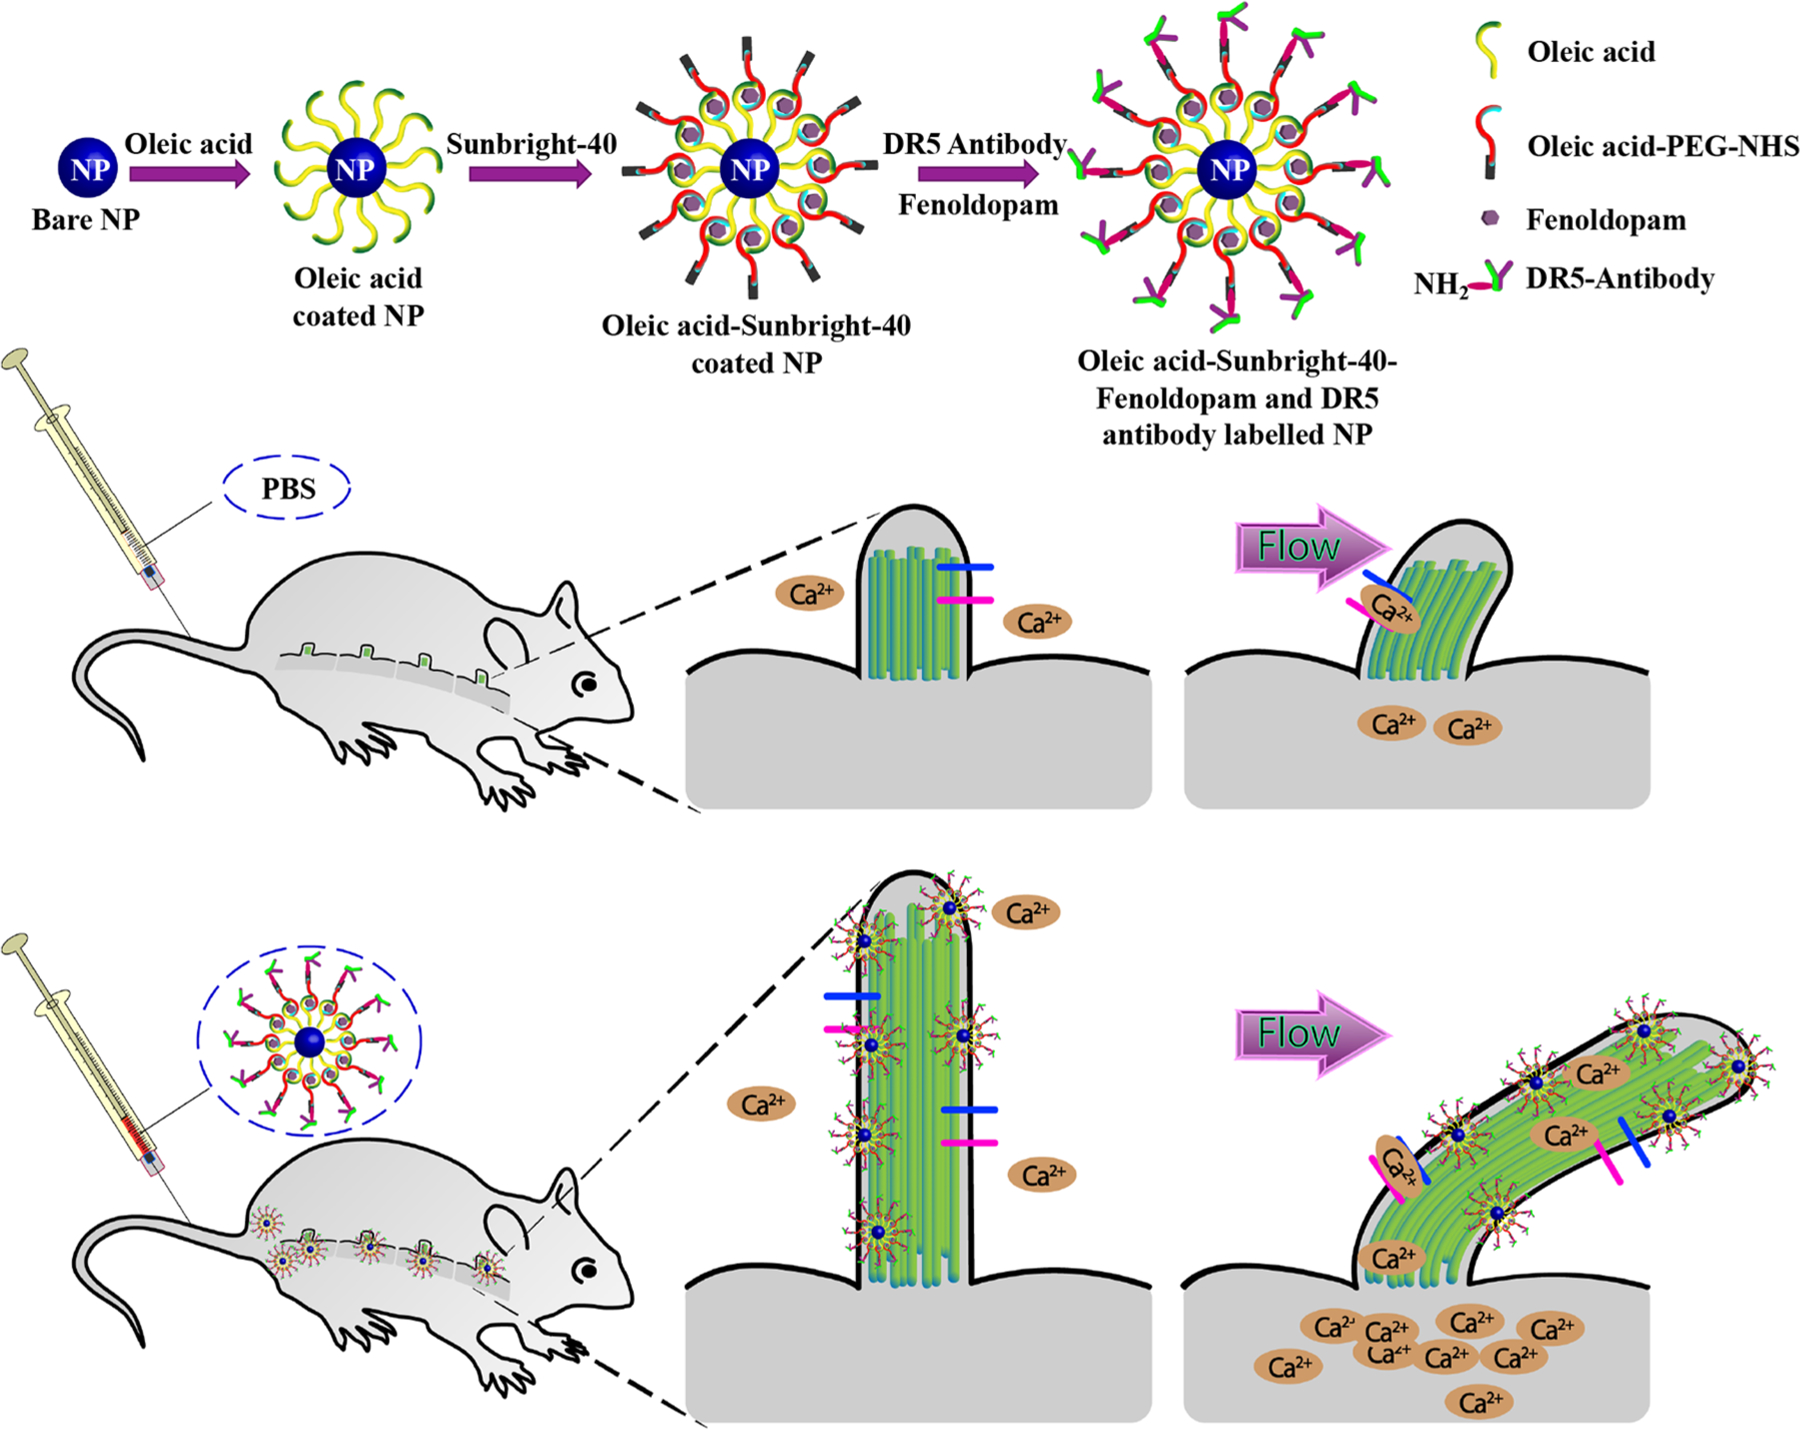
Schematic Illustration of Design and Functional Applications of CTNDDS
Dopamine-receptor type-5 (DR-5) is largely expressed in cilia (Figure 1a). We therefore generated NPs to target ciliary DR-5. We devised two cilia-targeted (CT) NPs to evaluate and compare their efficiencies, efficacies, potencies, and safety profiles. CT-DAu-NPs and CT-PLGA-NPs were loaded with the experimental drug fenoldopam. Fenoldopam was selected based on our prior screening, showing that it could improve mechanosensory function of cilia by increasing cilia length.16,18 These cilia-targeted nanoparticle drug delivery systems (CTNDDS) were also conjugated with AF594 dye to enable us to visualize and study the particle profiles. The UV-visible absorbance (Figure S1a), X-ray diffraction (Figure S1b), X-ray photoelectron spectroscopy (Figure S1c,d), and Fourier transform infrared (Figure S1e) spectra of CTNDDS were closely monitored to validate surface functionalization steps (see Materials and Methods).
Figure 1.
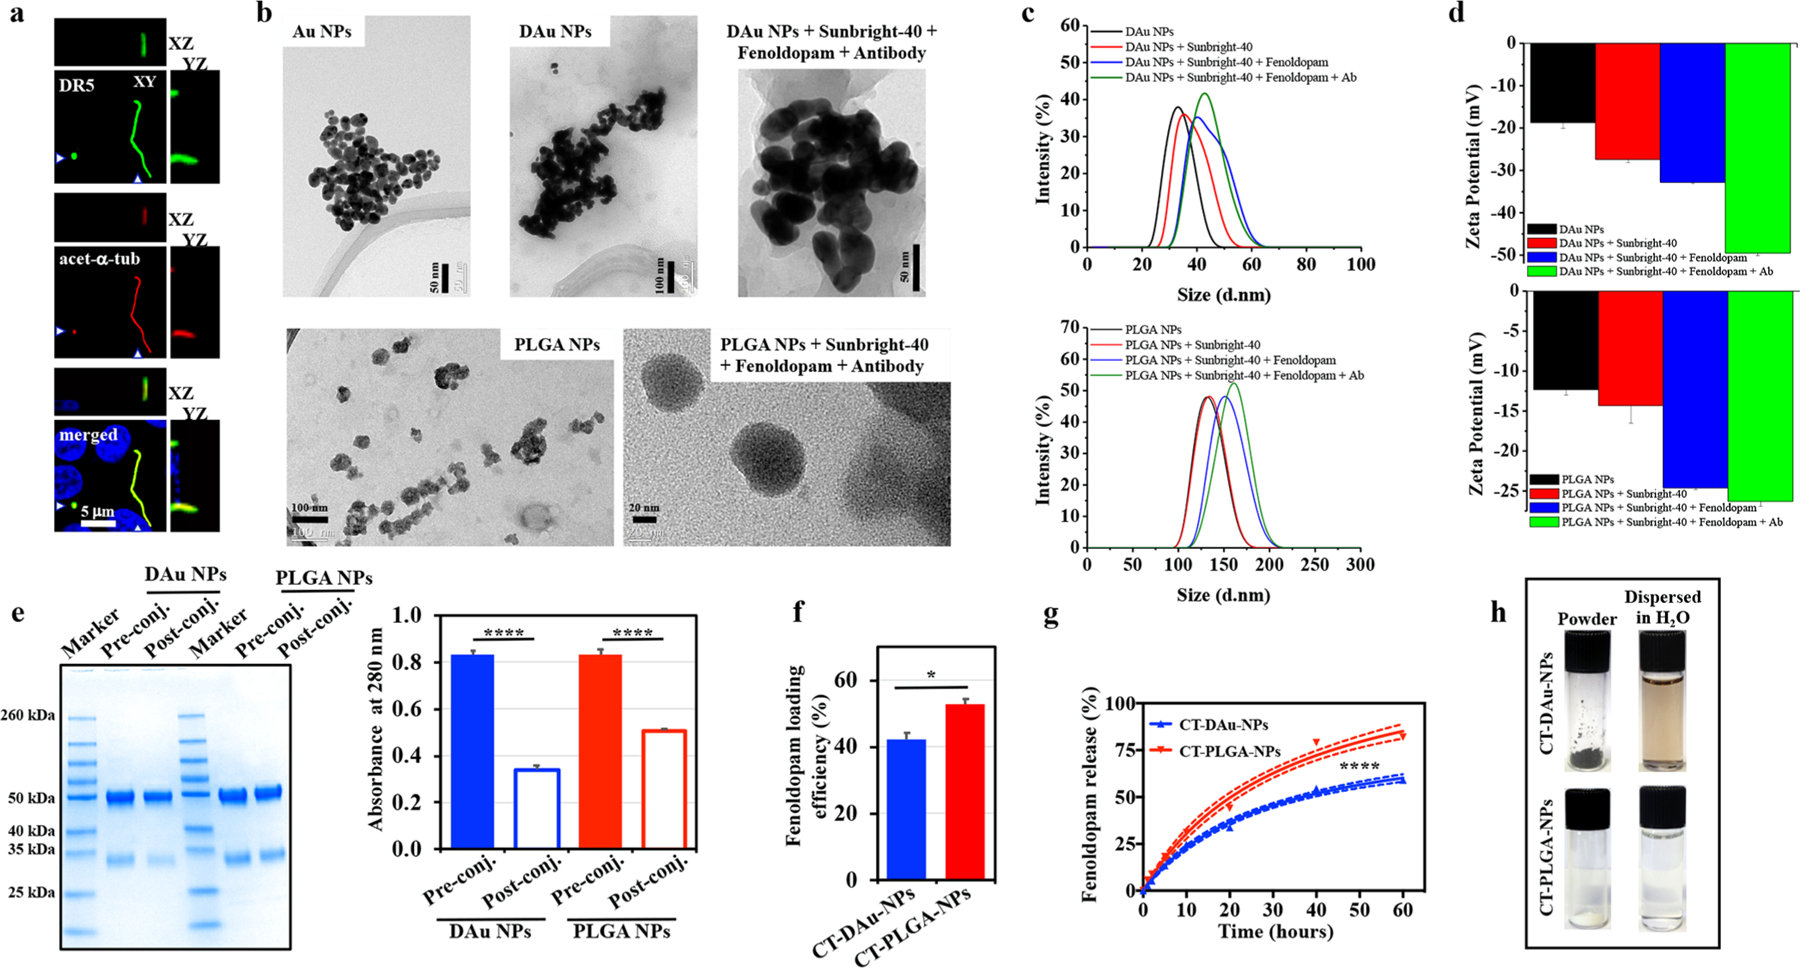
Synthesis and characterization of cilia-targeted nanoparticle drug delivery systems (CTNDDS). (a) Fluorescence microscopic imaging of DR-5 localization on primary cilia. Green, red, and blue colors represented acetylated-α-tubulin (ciliary marker), red fluorescence (DR-5), and DAPI (cell nuclei). (b) TEM images. (c) Hydrodynamic size distribution/DLS and (d) zeta-potential of DAu and PLGA NPs before and after different surface functionalizations. (e) SDS-PAGE image showing the incorporation of DR-5 antibody to the DAu and PLGA NPs. The bar graph shows the DR-5 antibody concentrations in the pre- and postconjugation solutions quantified by measuring the absorbance at 280 nm. (f) Fenoldopam-loading and (g) fenoldopam-releasing profiles of CT-DAu-NPs and CT-PLGA-NPs. (h) Photographs showing the synthesized powders of functional CT-DAu-NPs and CT-PLGA-NPs and their dispersion forms in distilled water. n = 3 for all experiments; DR-5 localization was performed in 3 independent experiments from three separate coverslips.*p < 0.05. Statistical analysis was performed using ANOVA followed by a Bonferroni post hoc test.
The structures and sizes of CTNDDS were visualized with electron micrographs (Figure 1b). The size of the CTNDDS was also confirmed with the dynamic light scattering (DLS; Figure 1c). The diameters of CT-DAu-NPs and CT-PLGA-NPs were approximately 40 ± 2.5 and 102 ± 4.8 nm, respectively. The surface charge of CT-DAu-NPs (−47.3 ± 1.2 mV) was significantly more negative than CT-PLGA-NPs (−25.9 ± 1.0 mV; Figure 1d). This is consistent with the corrected Debye-Hückel theory of surface charging, where a smaller particle size tends have a lower zeta-potential.19 Unlike CT-PLGA-NPs, CT-DAu-NPs were also dopaminergized resulting in a more negative charge surface. Fourier transform infrared spectroscopy (FTIR) also confirmed the conjugation of DR-5 antibody with both CTNDDS (Figure 1e); the DR-5 antibody was to target dopamine-receptor type-5 in the primary cilia. A standard HPLC curve for fenoldopam was prepared to standardize fenoldopam quantitation (Figure S1f). Fenoldopam was significantly more efficient to be loaded (Figure 1f) and released (Figure 1g) into/from CT-PLGA-NPs than CT-DAu-NPs. We therefore postulated that CT-PLGA-NPs could function as better cargos than CT-DAu-NPs at least for fenoldopam. Of note was that the functional CTNDDS were generated (Figure 1h), and they retained their fluorescence characteristics for microscopy imaging (Figure S1g).
A single cell was randomly selected to calculate the binding specificities of fluorescence CTNDDS to the cilium and cell membrane. While the binding kinetics of CT-DAu-NPs (0.21 ± 0.06 min−1) and CT-PLGA-NPs (0.26 ± 0.04 min−1) to cilia were not significantly different, both CTNDDS showed very minimal binding to the cell membrane (0.0012 ± 0.0004 min−1 and 0.0013 ± 0.0004 min−1, respectively; Figure 2a). Importantly, both CTNDDS showed maximum binding to cilia in less than 2 h. The time-dependent cilia length increase by CTNDDS was separately analyzed in various cell types including IFT88 cilia-less cells used as a negative control (Figures S2–S5). In these studies, we consistently observed that 16 h of treatment was an optimal effect of CTNDDS on primary cilia. After 16 h, the efficacies of CTNDDS were thus examined and compared to their respective negative fenoldopam-free controls (cCT-DAu-NPs and cCT-PLGA-NPs; Figure 2b). Fenoldopam-alone was also used as a positive control. Fenoldopam-loaded CTNDDS and fenoldopam-alone significantly increased cilia length compared to their corresponding controls, and there was no significant difference in cilia length between fenoldopam-alone and fenoldopam-loaded CTNDDS. Fluid flow-induced cilia bending can activate intracellular calcium (Ca2+) followed with nitric oxide (NO) biosynthesis, which are used as indices to measure cilia function.20 While fenoldopam-alone and fenoldopam-loaded CTNDDS significantly increased cytosolic Ca2+ (Figure 3a; Figure S6a) and NO biosynthesis (Figure 3b; Figure S6b) compared to their corresponding controls, there was no difference in cilia function among cell populations treated with fenoldopam-alone and fenoldopam-loaded CTNDDS.
Figure 2.
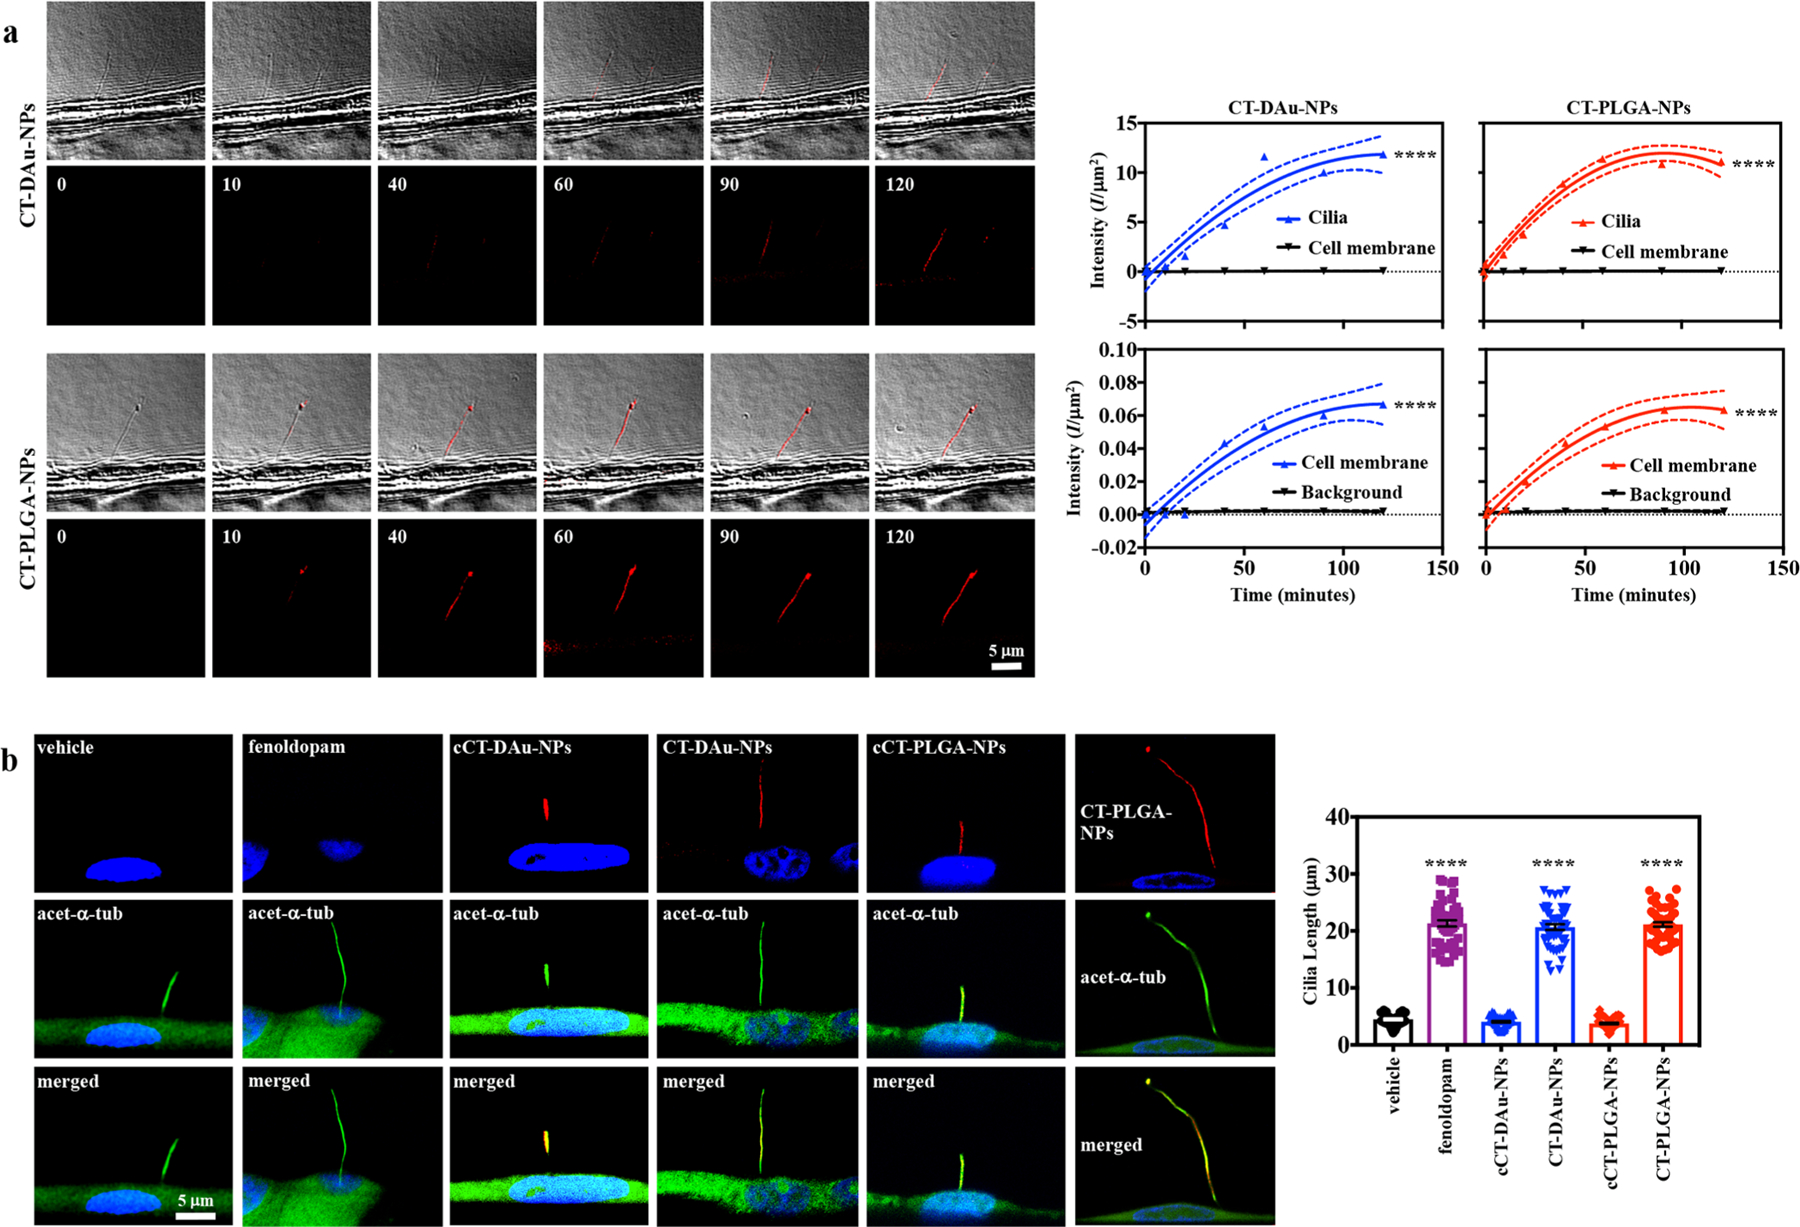
In vitro fluorescence imaging of cilia targeted nanoparticles. (a) DIC and fluorescence microscopic imaging of live cells perfused with CT-DAu-NPs (upper panel) and CT-PLGA-NPs (lower panel) for 2 h of time at a constant flow speed. Representative line graphs showing the binding capacity of CT-DAu-NPs (left panel) and CT-PLGA-NPs (right panel) to the cilia and cell membrane. Fluorescence NPs were measured in intensity per area (I/μm2). (b) Representative fluorescence imaging showing the cilia when treated with different treatments, and their length measurements were represented in the bar graph. Green, red, and blue colors represented acetylated-α-tubulin (ciliary marker), red fluorescence (cCT-DAu-NPs, CT-DAu-NPs, cCT-PLGA-NPs, or CT-PLGA-NPs), and DAPI (cell nuclei). n = 3 for all experiments if not represented in dot plot. ****p < 0.0001. Statistical analysis was performed using ANOVA followed by a Bonferroni post hoc test.
Figure 3.
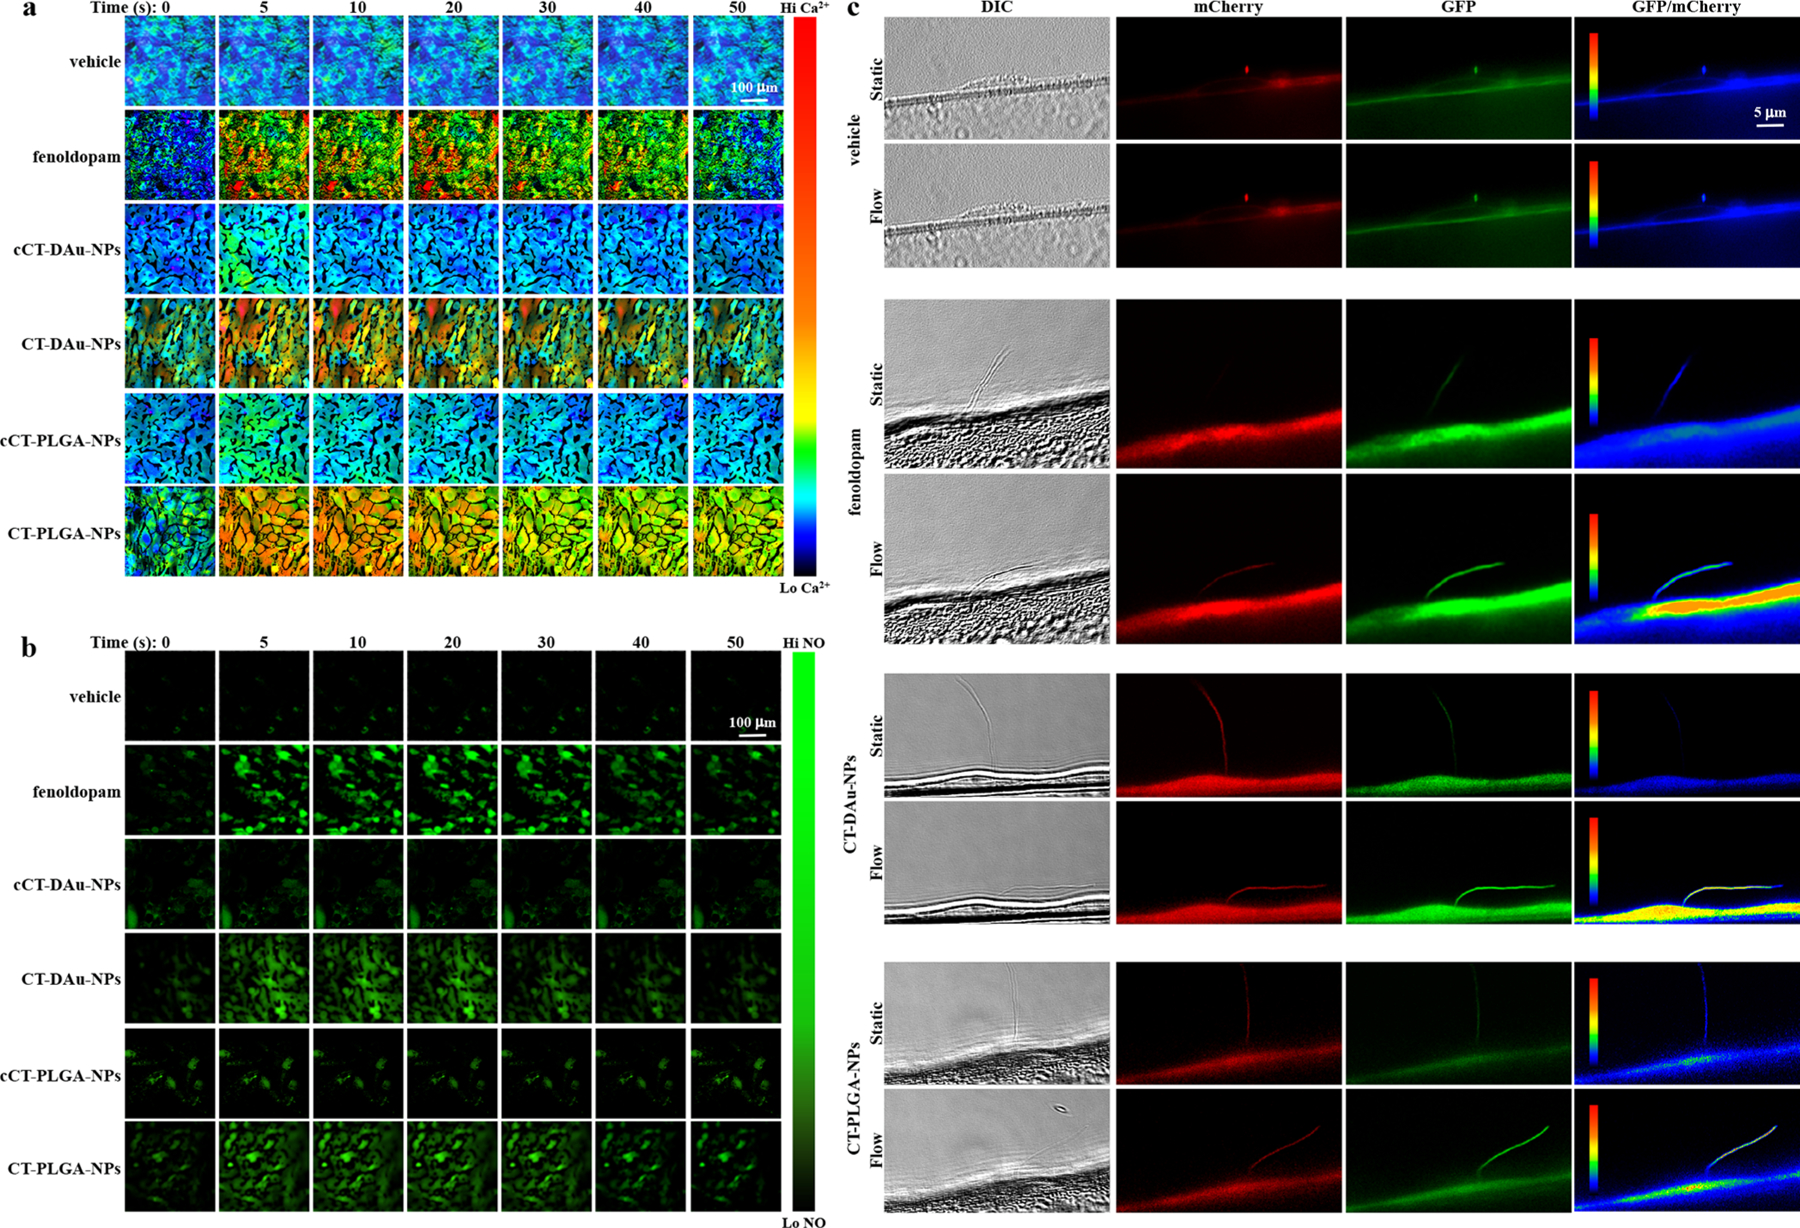
Cellular calcium (Ca2+) and nitric oxide (NO) measurements. (a) Fura-2AM ratiometric images showing the changes in the intracellular Ca2+ concentrations when cells treated with different treatments under a fluid-shear force of 0.5 dyn/cm2. The rainbow color bar indicates the levels of Ca2+. (b) DAF-AM ratiometric images showing the changes in the intracellular NO productions when cells treated with different treatments under a fluid-shear force of 0.5 dyn/cm2. The green color bar indicates the levels of NO. (c) Single-live cell imaging showing the responses to different treatments. DIC imaging used for tracking a cilium. The induction of flow causes bending of cilium and a subsequent influx of Ca2+. The GFP/mCherry ratio (pseudocolored) indicates normalized Ca2+ levels. The rainbow color bar indicates Ca2+ levels. n = 3 for all experiments.
We next performed single-cell mechanosensory functional studies in hope to tease out potential noises in cell population experiments (Figure 3c). The 5HT6-mCherry-G-GECO1.0 construct was used to measure both cilioplasmic and cytoplasmic Ca2+.21 Vehicle (PBS) and fenoldopam-alone (Figure S7a,b) were compared to fenoldopam-free and fenoldopam-loaded CTNDDS (Figures S8 and S9). Despite using single-cell analyses, no difference in functional cilia was observed with regard to cilioplasmic and cytoplasmic Ca2+ signaling between fenoldopam-alone and fenoldopam-loaded CTNDDS (Figure S10a). To ensure that no signal artifact was recorded in our studies, we plotted Ca2+ signaling in kymographs (Figure S10b). Changes in the patterns of Ca2+ speed and acceleration were corresponded to the changes in speed and mean signal intensity, indicating no signal artifact was recorded (Figure S10c). We next screened for potential toxicity of CTNDDS, showing no cytotoxicity (Figure S11). We also screened for cyclic guanosine monophosphate (cGMP) level as a potential downstream NO signaling. Fenoldopam-loaded CTNDDS showed significantly higher in intracellular cGMP levels compared to the control groups (Figure S12), indicating that CTNDDS were potentially different from fenoldopam-alone. We speculated that this might be due to a better specificity of CTNDDS action on primary cilia.
Our next attempt was to compare fenoldopam-alone and CTNDDS in zebrafish as our in vivo ciliopathy model. Unfortunately, we could not perform neither bolus injection nor infusion of fenoldopam in the fish. While bolus injection caused tachycardia-associated death, a slow fenoldopam perfusion into the fish remained a technical challenge with a high likelihood to injure young, 48 h-post fertilization fish. Regardless, we were encouraged that CTNDDS could significantly rescue the ciliopathic phenotypes, including improving tail curvature defects, preventing cystic kidney formation, vasodilating the blood vessels, and therefore improving blood flow and overall cardiac functions (Figure S13). Importantly, CTNDDS increased length of primary cilia in the fish artery and heart (Figure S14). This supported the idea that CTNDDS were functionally viable for use in in vivo without triggering reflex tachycardia as seen in fenoldopam-alone, suggesting the slow-sustained release nature of CTNDDS was suitable for further investigation in a larger animal model. The pharmacokinetics profiles of CTNDDS on fenoldopam release were first compared with fenoldopam-alone by collecting blood plasma from the mice (Figure S15a). Total plasma concentration of fenoldopam was significantly higher in fenoldopam-alone than fenoldopam-loaded CTNDDS mice (Figure S15b). The plasma level of fenoldopam in CTNDDS in the first 20 min could be due to circulating NPs in the blood, perhaps prior to binding to the primary cilia. To investigate this possibility, we examined localization of CTNDDS to primary cilia in aorta (Figure S16) and heart (Figure S17). After 24- or 72 h of bolus injection of CTNDDS, we could detect CTNDDS fluorescence in the primary cilia. Importantly, cilia length was increased by CTNDDS but not fenoldopam. Of note is that continuous fenoldopam for 5 days is needed to increase cilia length.18
Defective polycystin-2 gene (Pkd2) in mouse and human is associated with aberrant cellular mechanosensory resulting in abnormal Ca2+ signaling and biosynthesis NO, a clinical consequence in hypertension.20,22,23 To compare the efficacies among CTNDDS and fenoldopam-alone, we therefore used endothelia-specific Pkd2 knockout mouse model. Knockout was induced in 1-week-old mice followed by every 3 days injection/infusion of fenoldopam-alone or CTNDDS for an 8-week treatment period (Figure 4a). While CT-DAu-NPs significantly reduced blood pressure in hypertensive Pkd2 mice, CT-PLGA-NPs further decreased blood pressure toward the wild-type’s level. Short 30 min infusions of fenoldopam showed no long-term effect, indicating an advantage of sustained-release of CTNDDS (Figure 4b). Because long-term hypertension can influence heart function, comprehensive heart parameters was analyzed using a working heart system (Tables S1–S3). These parameters were summarized in the left ventricle volume (LVV) and pressure (LVP) graphs, showing that compared to wild-type, Pkd2 hearts had a significantly higher LVP with narrower LVV (smaller ejection fraction; Figure 4c). Both CTNDDS but not fenoldopam-alone corrected these abnormalities. To further analyze if the heart functions could be further deteriorated with positive (epinephrine) and negative (diltiazem) heart stressors, hearts were challenged with these stressors (Figure 4d). No additional abnormality was observed in Pkd2 hearts without or with fenoldopam-alone/CTNDDS treatment (Tables S1–S3). Surprisingly, Pkd2 hearts were characterized with arrhythmogenic, which could be corrected with 8-week treatment of CTNDDS but not fenoldopam-alone (Figure 4e). This indicated that CTNDDS was a more superior approach than fenoldopam-alone in a long-term treatment. No obvious difference was observed between the CT-PLGA-NPs and CT-DAu-NPs on the blood pressure, cardiac functions, and arrhythmogenic effects. However, it was important to note that CT-PLGA-NPs tended to correct the abnormalities in Pkd2 to the normal wild-type’s levels than CT-DAu-NPs did.
Figure 4.
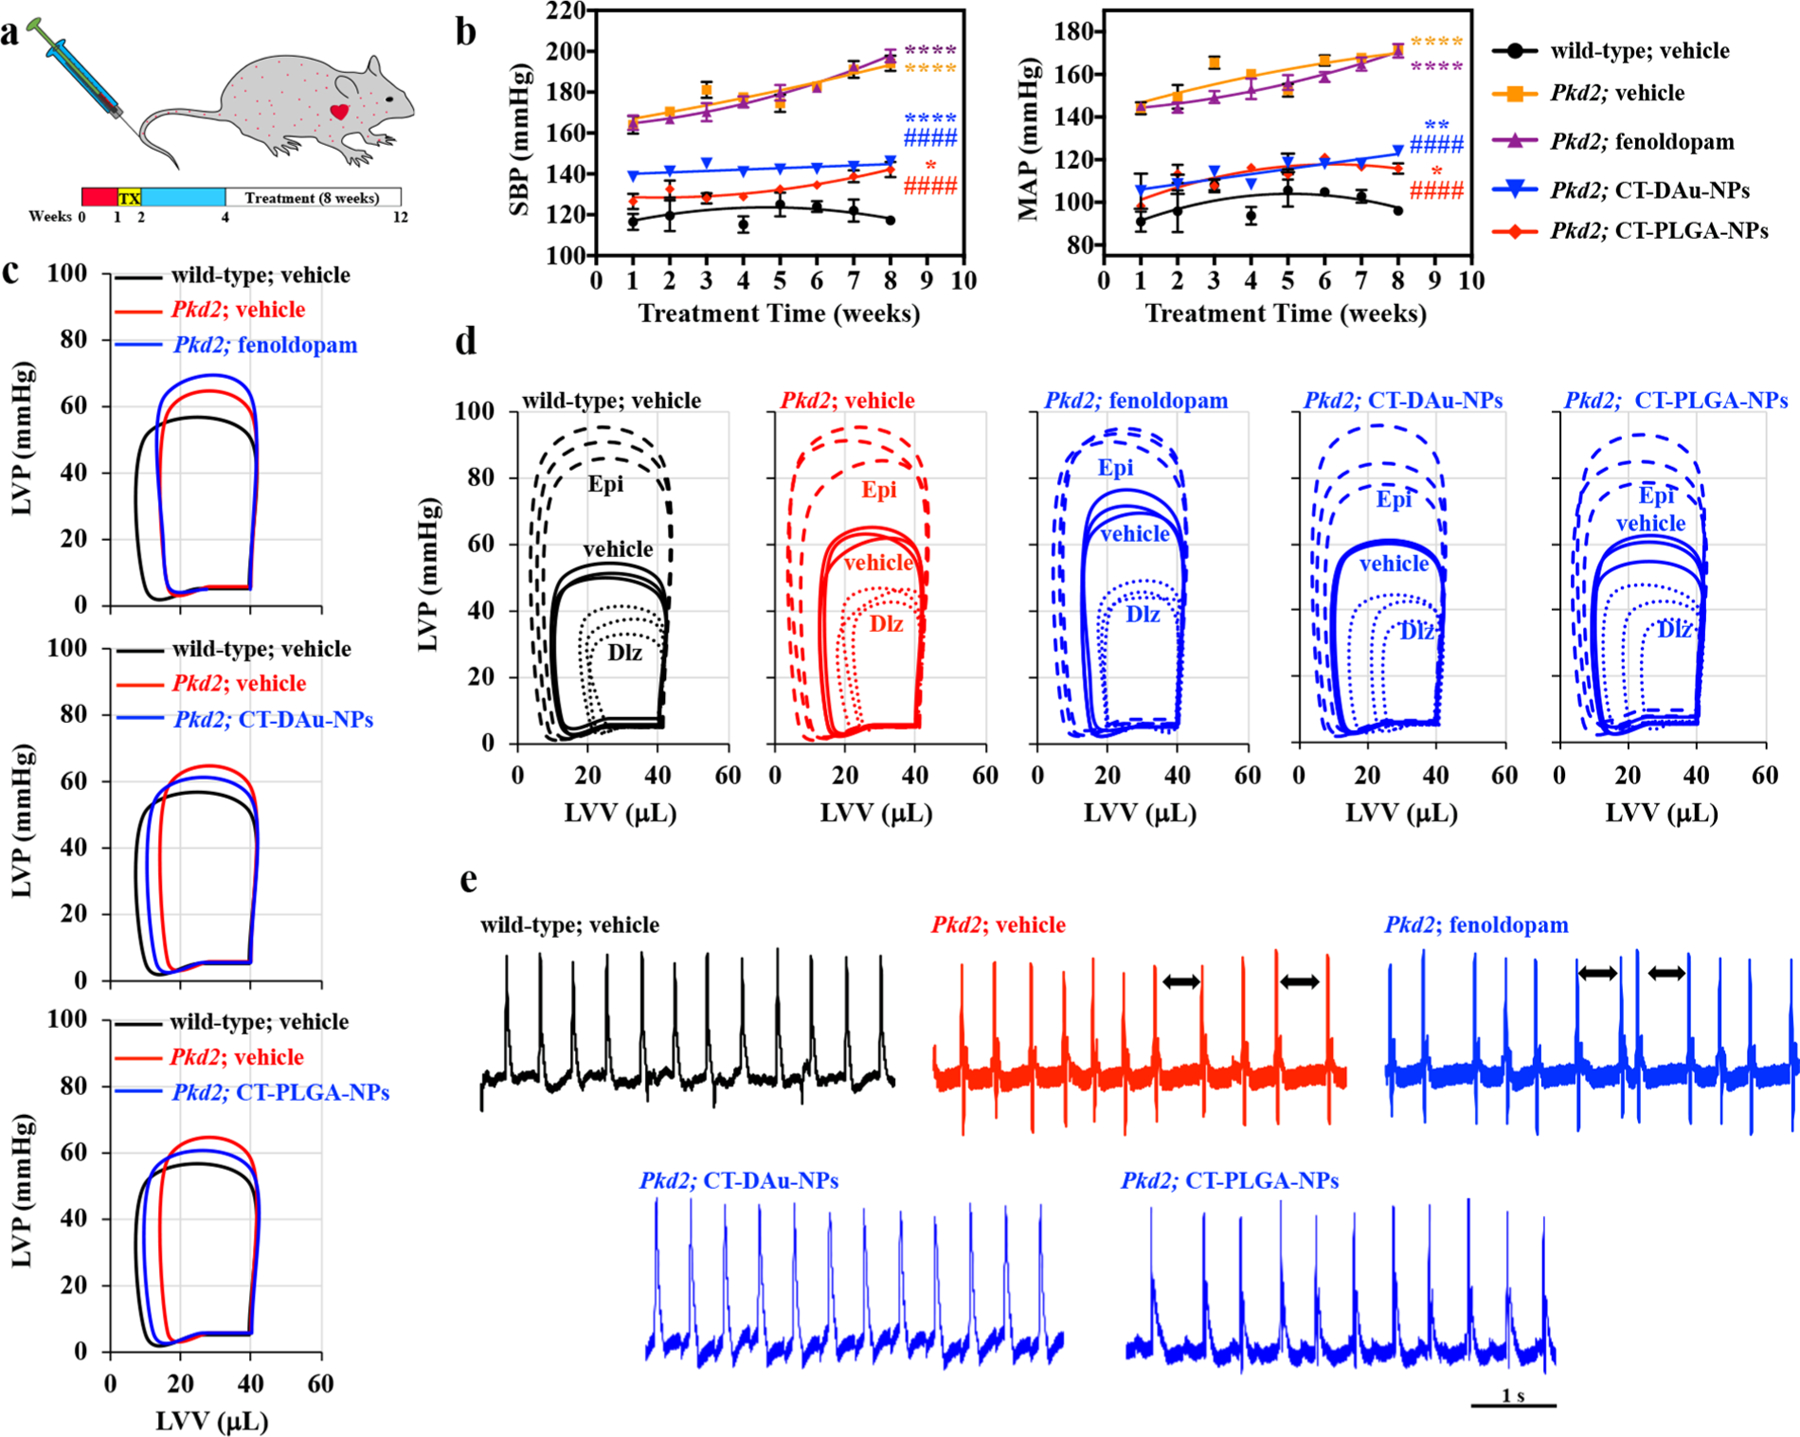
Treatment of hypertensive Pkd2 mouse model. (a) Scheme showing timeline for mutation induction and different treatment regimens. TX, tamoxifen. (b) Representative line graphs showing the changes in systolic (SBP) and mean arterial (MAP) blood pressures for 8 weeks. (c) Representative left ventricular pressure-volume (P-V) loops for control, fenoldopam, CT-DAu-NPs, and CT-PLGA-NPs. (d) P-V loops showing the stress response when treated with negative (diltiazem) or positive (epinephrine) chronotropic agents in different treatment groups. (e) Measurements of hearts from control and different treatments of mice were performed using electrocardiograms (ECG). Arrows indicate abnormal spacing. n = 3 for all experiments. *p < 0.05, **p < 0.01, ***p < 0.001, ****p < 0.0001 compared to wild-type vehicle. #p < 0.05, ##p < 0.01, ###p < 0.001, ####p < 0.0001 compared to Pkd2 vehicle. Statistical analysis was performed using a second order quadratic polynomial goodness of fit followed with ANOVA using a Tukey’s multiple comparisons test.
While fenoldopam-alone seemed to have no effect on Pkd2 mice, fenoldopam had an immediate effect during infusion (Figure S18). A 10 min infusion of fenoldopam significantly decreased blood pressure followed by reflex tachycardia. Fenoldopam is an agonist for dopamine receptors by activating D1 receptor family including DR-1 and DR-5. Activation of D1 receptors in blood vessels results in vasodilation. Fenoldopam has also been shown to inhibit α1- and α2-adrenergic receptors.24,25 Blocking of α1-adrenergic receptors results in a side effects of tachycardia, among others. Blocking of α2-adrenergic receptors in the nervous system will also result in tachycardia. These nonspecific effects of fenoldopam-alone infusion may contribute to the tachycardia in addition to the physiological reflex from a rapid drop of blood pressure by fenoldopam.
To investigate if reduction of blood pressure by CTNDDS involved NO, we measured nitrate/nitrite in the plasma because NO is readily converted to nitrite, which can be further converted to nitrate.26,27 Blood urea nitrogen (BUN) was also measured due to a potential cystic kidney formation that could alter kidney function.28,29 The abnormal levels of nitrate/nitrite (as an indication of vascular function) and BUN (as an indication of renal function) in Pkd2 mice could not be corrected with fenoldopam-alone (Figure 5a). While CT-DAu-NPs significantly corrected nitrate/nitrite and BUN levels in Pkd2 mice, CT-PLGA-NPs further brought the nitrate/nitrite and BUN to comparable levels of wild-type. When heart morphology was closely evaluated, it was apparent that Pkd2 hearts were characterized by hypertrophy (Figure 5b) and fibrosis (Figure 5c), which could be mitigated with CTNDDS (Figure S19a). Fluorescence intensity was also analyzed to examine CTNDDS biodistribution in different organs (Figure S19b). Among other organs, CTNDDS were concentrated in the liver the most. Organ toxicity of CTNDDS was also examined with HE histology imaging (Figure S19c). There was no apparent indication of CTNDDS toxicity in vivo, and this was validated independently from a different set of mice (Table S4).
Figure 5.
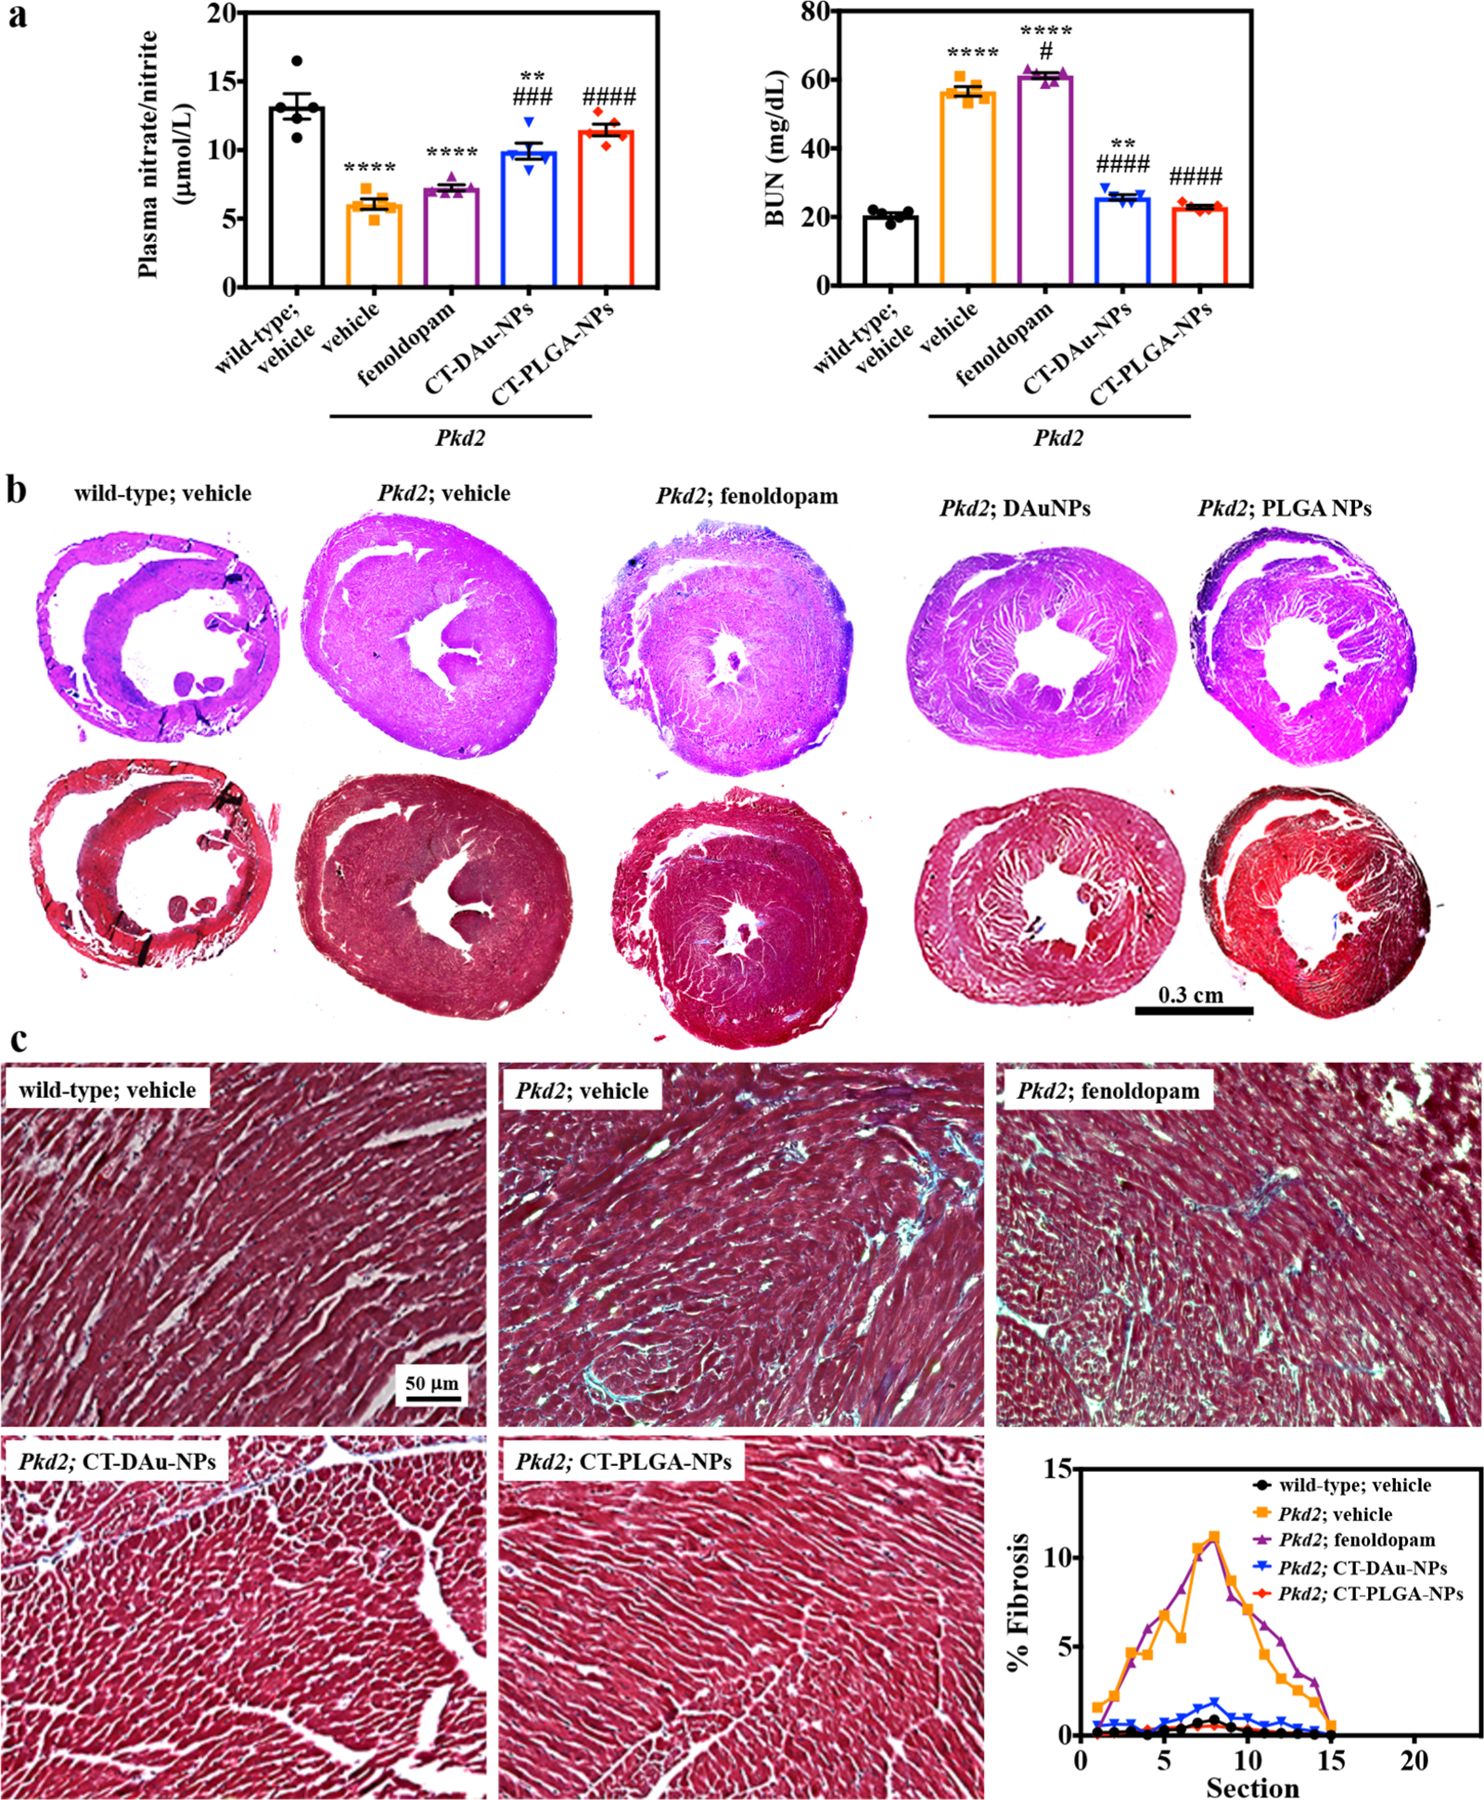
Improvement of biochemistry and heart phenotypes in Pkd2 mice model. (a) Nitrate/nitrite (NOx) and blood urea nitrogen (BUN) concentrations were measured. (b) To assess the heart hypertrophic effect, the thickness of the left ventricle was compared in whole-heart-cross sections using HE staining. Representative microscopic images of HE-stained sections of the left ventricle (LV), showing disparate pathological changes with different treatments. Representative microscopic images of Masson-trichrome-stained sections of LV; myocytes, stained red; collagenous tissue, stained blue. (c) Representative zoomed microscopic images of Masson-trichrome-stained sections of LV showing the amount of fibrosis, which is indicated as blue color. Representative line graphs showing the % of fibrosis in different treatment hearts. n = 3 for all experiments if not represented in dot plot. * p < 0.05, **p < 0.01, ***p < 0.001, ****p < 0.0001 compared to wild-type vehicle. #p < 0.05, ##p <0.01, ###p < 0.001, ####p < 0.0001 compared to Pkd2 vehicle. Statistical analysis was performed using ANOVA followed by a Bonferroni post hoc test.
To validate if the mechanism of action of CTNDDS required primary cilia, similar experiments were performed in endothelia-specific IFT88 knockout mouse model. Like Pkd2 mice, IFT88 mice were also characterized with high blood pressure (Figure S20a) and high LVP with narrow LVV (Figure S20b). The hearts from the IFT88 mice also responded well to epinephrine and diltiazem stressors (Figure S20c). Although IFT88 hearts were also arrhythmogenic, the arrhythmia was characterized by inverted P wave denoting atrial arrhythmia (Figure S20d). Importantly, CTNDDS did not show any effect in IFT88 mice suggesting that the mechanism of CTNDDS required the presence of cilia. This confirmed that the pharmacology action of CTNDDS depended on the presence of primary cilia, while fenoldopam still could exert its nonspecific effect independently from primary cilia.
In summary, we have successfully generated two cilia-targeted biomaterials that were capable of delivering fenoldopam to primary cilia. We reported that although there were no obvious advantages of the CTNDDS compared to drug-alone in cultured cells in vitro, CTNDDS were more superior in providing a more specific target to primary cilia and more efficacious therapy in vivo. Compared to fenoldopam, CTNDDS did not induce nonspecific reflex tachycardia. CTNDDS also allowed a bolus injection that was not possible in fenoldopam. Fenoldopam was significantly more efficient to be loaded into and released from CT-PLGA-NPs than CT-DAu-NPs. While we did not find therapeutic differences between CT-DAu-NPs and CT-PLGA-NPs, CT-PLGA-NPs tended to bring back the physiological parameters closer to those of healthy wild-type levels. Our results showed the slow-sustained release of fenoldopam from CTNDDS was more advantageous than the short-infusion of fenoldopam in vivo. Our studies opened a paradigm of harnessing a novel mechanism for future strategies in nanomedicine toward more personalized medicine for ciliopathy.
Materials and Methods.
Chemicals
SDS (Amersco), oleic acid (Alfa Aesar), SUNBRIGHT OE-040 CS (NOR Corporation), and fenoldopam mesylate (United States Pharmacopeia) were obtained from different companies, and all other chemicals were purchased from Sigma-Aldrich.
DAu-NPs Synthesis and Functionalization.
The DAu-NPs were prepared according to a previous protocol with some modifications.30 Briefly, 20 mL of 0.1 M HAuCl4 was placed in a 100 mL conical flask, and 1 mL of 4 mM dopamine hydrochloride was added and kept for 5 min at room temperature (r.t.). Then 2 mL of 1 mM trisodium citrate dihydrate (Na3C6H5O7·2H2O) was added to the flask, and the reaction mixture was heated at 45 °C for 1 h under stirring. After cooling to r.t., the product was briefly centrifuged; the pellet was collected and washed with deionized water three times to washout any unbound dopamine. The purified DAu-NPs (100 mg) were redispersed in Milli-Q water. OA was conjugated to the free amine on DAu-NPs through an amide bond linkage between carboxylates and amines. Then 20 mg of OA was activated with DCC and NHS (OA/DCC/NHS = 1:1:1) in 4 mL of dimethylformamide containing 1% triethylamine (DMF-TEA) for 30 min. A dispersion of 100 mg of DAu-NPs in 10 mL of DMF-TEA was added to the above mixture such that the activated OA could react with the free amine on DAu-NPs. The reaction mixture was stirred (500 rpm) for 2 h at r.t. The resulting product was then briefly centrifuged, and the pellet was first washed with DMF and later with distilled water five times. Sunbright-40 (OA-PEG-NHS)-functionalized OA-DAu-NPs were prepared by adding an aqueous solution of Sunbright-40 (100 mg/5 mL distilled H2O) and undergoing stirring for another 24 h at r.t. All the bare DAu-NPs and Sunbright-40-OA-DAu-NPs were separated by centrifugation process. The particles were washed with 50 mL of nitrogen-purged sterile water three times using centrifugation at low speed (1000 rpm) to remove large aggregated particles.
PLGA-NPs Synthesis and Functionalization.
PLGA-NPs were prepared by the solvent evaporation method.31,32 Briefly,100 mg of PLGA (50:50, lactide/glycolide) solubilized in 2 mL of acetone was added dropwise into 15 mL of an aqueous phase containing 0.77 g of Tween-20 (as emulsifier) under magnetic stirring at 2500 rpm for 1 h to generate a nanoemulsion. Subsequently, 4.5% (w/v) OA was added to the above crude emulsion, which was then sonicated for 20 min with a probe sonicator (Fisher Scientific) at an optimal amplitude of 55% and a frequency of 20 kHz. The resulting solution was stirred at 1200 rpm for 1 week to evaporate the organic solvent. Then the OA-PLGA-NPs were collected, centrifuged, and washed. For the Sunbright-40 functionalization, OA-PLGA-NPs were prepared by adding an aqueous solution of Sunbright-40 (100 mg/5 mL distilled H2O) and stirred for 24 h at r.t. The particles were then washed and dialyzed with 12-kD MWCO dialysis membrane (Spectrum Laboratories).
Antibody Conjugation and Drug Loading.
We first conjugated DR-5 antibody (EMD Millipore, MA; cat# 324408) with AF594 maleimide using an AF594 Antibody Labeling Kit to target thiol groups, according to manufacturer’s instructions (Thermo Fisher Scientific). The preconjugated DR-5-AF594 binding and fenoldopam loading to the synthesized Sunbright-40-OA-DAu-NPs and Sunbright-40-OA-PLGA-NPs was performed according to a previous report with some modifications.33 Briefly, Sunbright-40-OA-DAu-NPs or Sunbright-40-OA-PLGA-NPs were cooled to 4 °C. Each of these materials was mixed with DR-5-AF594 to a final volume of 25 mL in PBS and shaken overnight at 4 °C. A DMSO solution of fenoldopam (400 μL, 15 mg/mL in each reaction) was then added, and the reaction was allowed to occur under continuous stirring (400 rpm) for another 16 h at cold conditions. The antibody- and fenoldopam-loaded Sunbright-40-OA-DAu-NPs and Sunbright-40-OA-PLGA-NPs were separated from free antibody and free fenoldopam. CT-DAu-NPs and CT-PLGA-NPs were then washed with PBS several times, lyophilized, and stored in the dark.
A set of control groups was also prepared in a same way but without fenoldopam (cCT-DAu-NPs and cCT-PLGA-NPs). In a separate reaction, fluorescent unconjugated DR-5 antibody loading was also carried out accordingly. The DR-5 antibody binding to all synthesized CT-NPs was analyzed by fluorescence spectrometer at λex = 590 nm and λem = 617 nm with a fluorescence plate reader (Molecular devices). Conjugation efficiency of the DR-5 to the different NPs was further assessed with SDS-PAGE and protein concentration measurements indicated by optical density at 280 nm with a NanoDrop.2000 spectrophotometer (Thermo Scientific). The fenoldopam loading efficiency was quantified by HPLC (SHIMADZU). Fenoldopam release was measured by dialyzing 1 mL of each NP solution at a concentration of 5 mg/mL in PBS using 3.5 k MWCO dialysis tubing and subjected to HPLC. A standard plot was prepared under standard conditions with a fenoldopam concentration range from 5 to 200 μg/mL.
Characterizations.
The initial synthesis of the DAu-NPs and PLGA-NPs was confirmed with UV-visible spectroscopy using a SpectraMax system. NP stability was determined by preserving them in an 8% sucrose solution. For the measurements of size and shape, all synthesized nanomaterials were examined by TEM using a FEI/Philips 200 kV CM-20 electron microscope. The size and surface zeta-potential of all synthesized NPs were obtained by DLS measurements using a Malvern ZETASIZER (Nano-ZS; ZEN3600). All samples of lyophilized NPs were subjected to XRD using a Rigaku SmartLab X-ray diffractometer and Cu-Kα (Cu target) radiation at a scanning rate of 1° per min in the region of 2θ = 10–90°. X-ray photoelectron spectra of the samples were recorded on a Kratos Analytical AXIS Supra system with a monochromated Al/Ag X-ray source (Al target). Total survey spectra were recorded in a range from 1200 to −5 eV binding energy (dwell time 200 ms, step size 1 eV, 2 sweeps), and all the region scans were conducted with suitable ranges (dwell time 500 ms, step size 0.05 eV and 5 sweeps). The FTIR spectra were recorded using a Bruker ALPHA (Platinum-ATR) spectrometer in the diffuse reflectance mode at a resolution of 4 cm−1.
Cell Culture.
Porcine kidney epithelial cells (ATCC CL-101) were cultured in Dulbecco’s modified Eagle medium (Corning Cellgro), 10% fetal bovine serum (HyClone) and 1% penicillin/streptomycin (Corning Cellgro) at 37 °C in a 5% CO2 incubator. For endothelial cell lines, we used previously generated mouse endothelial cells.34 Prior to all experiments, cells at 75–85% confluence were differentiated for 24–48 h in serum-free media so we could accurately quantify and study the effects of CT-NPs in each experiment.
Live Imaging of Single Cilium from Single Cell.
To determine the selective targeting efficiency of NPs for targeting cilia, CT-DAu-NPs and CT-PLGA-NPs were evaluated via the side view of both a cell and cilium to avoid bias in the data analysis. Cells were grown on Formvar polymer (Electron Microscopy Science) as previously described.35 Formvar was dissolved in ethylene dichloride to make a 2% Formvar solution. Cells were then grown on this collagen-coated Formvar flexible substratum (FFS). The FFS was placed on a custom-made glass-bottomed plate. A thin pipet tip (Fisher scientific, Inc.) was connected to the inlet and outlet clear plastic PVC tubes with a 0.031-in. inside diameter (Nalgene, Inc.). The tubes were inserted into the in-flow and out-flow pumps (InsTech P720), and the pipet tips were inserted between the bottom glass plate and held with a cover glass slide on top. Different concentrations (0.1–1 μg/mL) of cCT-DAu-NPs, cCT-PLGA-NPs, CT-DAu-NPs or CT-PLGA-NPs were perfused through the cells and imaged for 2 h. Different NP targeting capacities to cilia were observed with a Nikon Eclipse Ti microscope. The microscope is also equipped with an incubator to control CO2, humidity, temperature, and light to provide a suitable environment for the cells during the experiment.
Immunocytochemistry.
For the in vitro cilia length measurements, cells were grown on the Formvar polymer, as mentioned above. Primary cilia consisting of acetylated microtubule structures were measured by direct immuno-fluorescence with acetylated-α-tubulin staining with 0, 2, 4, 8, 16, 24, and 32 h of incubation with different concentrations(0.1–5 μg/mL) of CT-DAu-NPs or CT-PLGA-NPs. Likewise, materials without fenoldopam loading were used as corresponding controls for the CTNDDSs (cCT-DAu-NPs and cCT-PLGA-NPs) and also fenoldopam alone used. The cells were rinsed with sodium cacodylate buffer, fixed with 3% glutaraldehyde in 0.2 M sodium cacodylate buffer for 10 min, and permeabilized with 1% Triton-X in sodium cacodylate for 5 min. Acetylated-α-tubulin (1:10 000 dilution, Sigma) and the secondary antibodies were also diluted in 10% FBS to decrease the background florescence; FITC fluorescence secondary antibody (1:1000; Pierce, Inc.) was used. The cells were then washed three times for 5 min each with cacodylate buffer and mounted with DAPI (Vector laboratories). Confocal microscopic images were obtained using an inverted Nikon Eclipse Ti confocal microscope.
Ca2+ and NO Imaging.
For monolayer cell populations, intracellular measurements were obtained as previously described.34 After incubation for 16 h without or with different concentrations (0.1–5 μg/mL) of fenoldopam, cCT-DAu-NPs, cCT-PLGA-NPs, CT-DAu-NPs, or CT-PLGA-NPs, cells were incubated with 5 μM Fura2-AM (TEFLabs) for 45 min at 37 °C in a 5% CO2 incubator. After washed to remove excess Fura-2 AM, cytosolic Ca2+ images were captured every second by recording Ca2+-bound Fura-2 AM excitation fluorescence at 340/380 nm and emission at 510 nm. For intracellular NO measurements, the cells were incubated for 30 min at 37 °C with 20 μM DAF-FM (Cayman chemicals). NO was then measured every second at the excitation and emission wavelengths of 495 and 515 nm, respectively. The cells were placed in PBS during the experiments and observed with a Nikon Eclipse Ti microscope. Fluid shear stress was then applied to cells through InsTech P720 peristaltic pumps with an inlet and outlet setup. The fluid was perfused through cell monolayers at a subminimal shear stress of 0.5 dyn/cm2.
In single-cell studies, cells were grown on 2% Formvar and transfected with the Ca2+ fluorescence reporter 5HT6-mCherry-G-GECO1.0 (Addgene) using the JetPrime transfection reagent (Polyplus transfection) as previously described and characterized.21 The shear stress ranged from 0.01 to 1.0 dyn/cm2 and was accurately measured and controlled at all times. After transfection, the cells were treated with different concentrations of fenoldopam, cCT-DAu-NPs, cCT-PLGANPs, CT-DAu-NPs, or CT-PLGA-NPs, and 5HT6-mCherry-G-GECO1.0-expressing cilia were observed under an inverted Nikon Eclipse Ti confocal microscope. For these experiments, none of the CT-NPs contained AF594 dye to avoid interference with the mCherry (red) signal. Confocal laser scanning microscopy in fast-scan mode was used to avoid potential excessive photo bleaching. All videos were processed using NIS-Elements High Content AR 4.30.02 (Nikon) used for the live tracking and kymograph analysis of both the cell and cilia. Ca2+ tracking was very efficiently achieved by using binary spotting tracks. The GFP/mCherry ratio calculations were also done using Nikon tracking software.
In Vitro Cytotoxicity.
The in vitro toxicity of CT-DAu-NPs or CT-PLGA-NPs was performed in renal epithelial cells using Annexin V-FITC/propidium iodide apoptosis assay (Molecular Probes and Life Technologies). Cells were treated with different concentrations of 1 to 10 μg/mL of each CTNDDS for 48 h. Normal, apoptotic, and necrotic cells were distinguished by flow cytometry analysis (BD Facsverse). Representative images of cells were captured using a standard fluorescence and DIC microscopy.
cGMP Study.
To quantify the cGMP content, cells were pretreated with either PBS or different concentrations (0.1–5 μg/mL) of fenoldopam, CT-DAu-NPs, or CT-PLGA-NPs. The cGMP levels were measured using a cGMP ELISA Kit (Cayman Chemical Company). The results were converted to pmol/mL via standard curves.
Animal Studies.
All animal procedures were performed according to the University of California Irvine or Chapman University Animal Care and Use Committee Guidelines. To eliminate biases and subjective analyses, all animal studies were performed by double-blinded operators. Wild-type zebrafish AB strains were obtained from the Zebrafish International Resource Center. Embryos were injected with 1 mM morpholino oligos (GeneTools) at the 1–2 cell stage and cultured at 28.5 °C in sterile egg water. The following morpholino sequences were used: control scrambled MO: 5′-CCT CTT ACC TCA GTT ACA ATT TAT A-3′, Pkd2: 5′-AGG ACG AAC GCG ACT GGG CTC ATC-3′. The cardiac function was assessed by placing zebrafish on their dorsal axis to examine the relative locations of the ventricle and bulbus arteriosus, blood circulation, and the heartbeat. Measurements of blood flow characteristics and heart parameters were performed using a Nikon Eclipse Ti microscope. NIS-Elements High Content AR 4.30.02 (Nikon) was used for the live tracking of the speed and acceleration of a single blood cell.
One-week-old Tie2Cre·Pkd2WT/WT (with cre activation; control group) or Tie2Cre·Pkd2flox/flox (without cre activation; control group) and Tie2Cre·Pkd2flox/flox (with cre activation; experimental group) mice were injected intraperitoneally with 5 μg/μL tamoxifen every day for five consecutive days. A limited number of IFT88 mice was also used as no cilia model in our study. The overall process for the preparation of the final nanoformulation for the animal studies included the following steps. The lyophilized antibody conjugated and drug-loaded CT-DAu-NPs or CT-PLGA-NP powders were first brought to the room temperature from a storage at −50 °C. Then the required amounts (0.5, 1.0, 1.5, and 2.0 mg) of CT-DAu-NPs or CT-PLGA-NPs were weighed carefully in the dark room using a highly sensitive weighing balance (Sartorius). The final formulations for the injections were prepared by individually dispersing them in 150 μL of PBS. The formulations were mixed by vortex for 2 min followed by filtration of 0.2 μm. The mice were next injected with PBS (control), CT-DAu-NPs, or CT-PLGA-NPs (0.5 to 2.0 mg/kg body weight) via intravenous (IV) injections. On the other hand, fenoldopam alone (1 μg/kg/min) was perfused for 30 min every 72 h for 8 weeks. The mice were treated every 72 h with different NPs for 8 weeks. Blood pressure from four-week-old mice was taken with the noninvasive tail-cuff method using the CODA system (Kent Scientific). Blood pressure was measured twice daily for the duration of the study after the initial 3 days of acclimating each mouse to the cuff. At the end of the 12 weeks of treatment, the hematology parameters, including the blood urea nitrogen (BUN) and plasma nitrate/nitrite measurements, were examined. BUN assays were conducted using a calorimetric kit (Arbor Assays). Plasma nitrate/nitrite concentrations were quantified using a nitrate/nitrite assay kit (Cayman). All steps were followed according to the manufacturer’s instructions.
Sections of the zebrafish and mouse major organs, including the heart, kidneys, liver, spleen, and lungs, were collected and subjected to HE staining for zebrafish cysts and histopathology by starting with fixation in 10% paraformaldehyde overnight at 4 °C. Then the tissues were dehydrated using buffered ethanol and xylene. Finally, the tissues were embedded in wax, sectioned (4 μm, Microtome, HM-355S, Thermo Scientific), and were subsequently stained with standard hematoxylin and eosin (HE). The pathology slices were observed and imaged using a KEYENCE-BZ-X710 microscope. Mouse heart sections were stained with Masson’s Trichrome to detect fibrosis using a Masson’s Trichrome Stain Kit (Polysciences, Inc.).
The pharmacokinetics of different NPs treated mice were studied. Blood samples of 50 μL were collected prior to drug injections and 5–60 min during the duration of injections (for NPs) or perfusions (for fenoldopam). Blood samples were collected into heparin-coated tubes and centrifuged at 10 000g for 8 min to obtain plasma. All drugs were extracted from plasma samples and performed HPLC analysis by using previously described method.36 In the biodistribution studies, whole organs from the fluorescent-labeled NPs treated mice (heart, kidney, liver, spleen, and lung) were collected, homogenized, and measured for fluorescence intensity to assess the amount of NP distribution in different organs at 24- and 72-h after treatments. For the in vivo toxicity studies, 200 μL of blood samples was collected from different treatments (PBS, CT-DAu-NPs, or CT-PLGA-NPs). Biochemistry was performed using biochemical analyzer (VetScan VS2).
Working Heart Perfusion System.
To study the heart function independently from neuronal innervation or humoral effect, ex vivo heart parameters were collected using a mouse working heart system from Emka Technologies. This system collected data of the cardiac contractile strength, electrical heart propagation (ECG; electrocardiogram), and other cardiac functions including the heart rate (HR), left ventricle pressure (LVP), left ventricular volume (LVV), left atrial pressure (LAP), aortic out flow (AOF), stroke volume (SV), cardiac output (CO), end diastolic/systolic volume (Edv-Esv), rate of left atrial pressure raise (+dp/dt) and fall (−dt/dt), preload, afterload, and main aortic pressure. Heparin (100 units, IP), xylazine (10–15 mg/kg, IP), and ketamine (200–350 mg/kg, IP) were used to prevent blood coagulation in the coronary arteries and to anesthetize the mice. After cannulation, the heart was perfused with Krebs-Ringer superfusion solution (in mM: 125 NaCl, 2.5 KCl, 1.25 NaH2PO4, 2 CaCl2, 1 MgCl2, 25 NHCO3, and 25 glucose). Throughout the experiment, the solution was continuously bubbled with carbogen (95% O2 and 5% CO2) to reach 7.4 pH at 38.0 °C. Stress tests were performed in the heart by perfusing epinephrine (4 μg/L) or diltiazem (0.08 μg/L). The cardiac function was plotted in a loop diagram showing the LVV-LVP relationship (volume-pressure loop).
Statistical Analysis.
All quantifiable data are reported as the mean ± standard error of the mean (SEM). The homogeneity of variance (homoscedasticity) was verified within each data set. When a data set was not normally distributed or heterogeneous variance was detected, the distributions were normalized via log transformation. This approach produced normally distributed data sets. Statistical analysis was performed using ANOVA (analysis of variance) followed by a Bonferroni or Tukey post hoc test. Power analysis was determined from the coefficient variant. When our coefficient variant was above 15%, the number of experimental and corresponding control groups was increased. In all our studies, both the control and experimental groups were run in parallel; therefore, our control and experimental values represent matched observations. In some cases, all the experimental groups (including the corresponding controls) were analyzed with the post hoc test. In other cases, only the selected pairs (vehicle vs experimental groups) were tested. Whenever possible, paired-experimental analysis was used to design our studies to allow for a more powerful statistical analyses and to reduce the number of mice used in each study group. Most of our statistical analyses were performed with GraphPad Prism (version 7.0). Linear regression was performed to obtain a standard calibration curve and linear equation. In this case, the analysis was done with the ordinary least-squares regression of y on x. A nonlinear logarithmic regression was used to fit the sigmoidal trend curve to show the dose-response relationship. Sample sizes are included in figures/legends. * and # symbols represent statistically significant differences at various probability levels (P).
Supplementary Material
ACKNOWLEDGMENTS
We thank Armando Diaz for the expertise in generating the videos and Maki Takahashi for reagent preparations and technical assistance. This work was supported in part by the Congressionally Directed Medical Research Program PR130153, NIH HL131577, and Chapman University.
Footnotes
Supporting Information
The Supporting Information is available free of charge on the ACS Publications website at DOI: 10.1021/acs.nano-lett.8b04138.
Nanoparticles characterizations, epithelia, and endothelia cilia length measurements at different time points, in vitro calcium (Ca2+) and nitric oxide (NO) analysis, time lapse images of cilia Ca2+ measurements in live cells, Ca2+ speed and acceleration measurements, in vitro cytotoxicity analysis, cGMP measurement, in vivo zebrafish functional studies, cilia length measurements in zebrafish, pharmacokinetics of plasma fenoldopam, cilia length measurements in mouse arteries and hearts, in vivo toxicity analysis by HE and blood pressure measurements, mouse working heart analysis tables, blood chemistry analysis (PDF)
The authors declare no competing financial interest.
REFERENCES
- (1).Cui W; Li J; Decher G Self-Assembled Smart Nanocarriers for Targeted Drug Delivery. Adv. Mater 2016, 28 (6), 1302–11. [DOI] [PubMed] [Google Scholar]
- (2).Polo E; Collado M; Pelaz B; Del Pino P Advances toward More Efficient Targeted Delivery of Nanoparticles in Vivo: Under-standing Interactions between Nanoparticles and Cells. ACS Nano 2017, 11 (3), 2397–2402. [DOI] [PubMed] [Google Scholar]
- (3).Zhang Y; Chan HF; Leong KW Advanced materials and processing for drug delivery: the past and the future. Adv. Drug Delivery Rev 2013, 65 (1), 104–20. [DOI] [PMC free article] [PubMed] [Google Scholar]
- (4).Danhier F; Ansorena E; Silva JM; Coco R; Le Breton A; Preat V PLGA-based nanoparticles: an overview of biomedical applications. J. Controlled Release 2012, 161 (2), 505–22. [DOI] [PubMed] [Google Scholar]
- (5).Lukianova-Hleb EY; Wagner DS; Brenner MK; Lapotko DO Cell-specific transmembrane injection of molecular cargo with gold nanoparticle-generated transient plasmonic nanobubbles. Biomaterials 2012, 33 (21), 5441–50. [DOI] [PMC free article] [PubMed] [Google Scholar]
- (6).Connor EE; Mwamuka J; Gole A; Murphy CJ; Wyatt MD Gold nanoparticles are taken up by human cells but do not cause acute cytotoxicity. Small 2005, 1 (3), 325–7. [DOI] [PubMed] [Google Scholar]
- (7).Vogel G News focus: Betting on cilia. Science 2005, 310 (5746), 216–8. [DOI] [PubMed] [Google Scholar]
- (8).Li Y; Klena NT; Gabriel GC; Liu X; Kim AJ; Lemke K; Chen Y; Chatterjee B; Devine W; Damerla RR; Chang C; Yagi H; San Agustin JT; Thahir M; Anderton S; Lawhead C; Vescovi A; Pratt H; Morgan J; Haynes L; Smith CL; Eppig JT; Reinholdt L; Francis R; Leatherbury L; Ganapathiraju MK; Tobita K; Pazour GJ; Lo CW Global genetic analysis in mice unveils central role for cilia in congenital heart disease. Nature 2015, 521 (7553), 520–4. [DOI] [PMC free article] [PubMed] [Google Scholar]
- (9).Aboualaiwi WA; Muntean BS; Ratnam S; Joe B; Liu L; Booth RL; Rodriguez I; Herbert BS; Bacallao RL; Fruttiger M; Mak TW; Zhou J; Nauli SM Survivin-induced abnormal ploidy contributes to cystic kidney and aneurysm formation. Circulation 2014, 129 (6), 660–72. [DOI] [PMC free article] [PubMed] [Google Scholar]
- (10).Hildebrandt F; Benzing T; Katsanis N Ciliopathies. N. Engl.J. Med 2011, 364 (16), 1533–43. [DOI] [PMC free article] [PubMed] [Google Scholar]
- (11).Leaf A; Von Zastrow M, Dopamine receptors reveal an essential role of IFT-B, KIF17, and Rab23 in delivering specific receptors to primary cilia. eLife 2015, 4 DOI: 10.7554/eLife.06996 [DOI] [PMC free article] [PubMed] [Google Scholar]
- (12).Berbari NF; Johnson AD; Lewis JS; Askwith CC; Mykytyn K Identification of ciliary localization sequences within the third intracellular loop of G protein-coupled receptors. Mol. Biol. Cell 2008, 19 (4), 1540–7. [DOI] [PMC free article] [PubMed] [Google Scholar]
- (13).Brailov I; Bancila M; Brisorgueil MJ; Miquel MC; Hamon M; Verge D Localization of 5-HT(6) receptors at the plasma membrane of neuronal cilia in the rat brain. Brain Res. 2000, 872 (1–2), 271–5. [DOI] [PubMed] [Google Scholar]
- (14).Handel M; Schulz S; Stanarius A; Schreff M; Erdtmann-Vourliotis M; Schmidt H; Wolf G; Hollt V Selective targeting of somatostatin receptor 3 to neuronal cilia. Neuroscience 1999, 89 (3), 909–26. [DOI] [PubMed] [Google Scholar]
- (15).Thompson CL; Wiles A; Poole CA; Knight MM Lithium chloride modulates chondrocyte primary cilia and inhibits Hedgehog signaling. FASEB J. 2016, 30 (2), 716–26. [DOI] [PubMed] [Google Scholar]
- (16).Abdul-Majeed S; Nauli SM Dopamine receptor type 5 in the primary cilia has dual chemo- and mechano-sensory roles. Hypertension 2011, 58 (2), 325–31. [DOI] [PMC free article] [PubMed] [Google Scholar]
- (17).Besschetnova TY; Kolpakova-Hart E; Guan Y; Zhou J; Olsen BR; Shah JV Identification of signaling pathways regulating primary cilium length and flow-mediated adaptation. Curr. Biol 2010, 20 (2), 182–7. [DOI] [PMC free article] [PubMed] [Google Scholar]
- (18).Kathem SH; Mohieldin AM; Abdul-Majeed S; Ismail SH; Altaei QH; Alshimmari IK; Alsaidi MM; Khammas H; Nauli AM; Joe B; Nauli SM Ciliotherapy: a novel intervention in polycystic kidney disease. J. Geriatr. Cardiol 2014, 11 (1), 63–73. [DOI] [PMC free article] [PubMed] [Google Scholar]
- (19).Holmberg JP; Ahlberg E; Bergenholtz J; Hassellov M; Abbas Z Surface charge and interfacial potential of titanium dioxide nanoparticles: experimental and theoretical investigations. J. Colloid Interface Sci 2013, 407, 168–76. [DOI] [PubMed] [Google Scholar]
- (20).AbouAlaiwi WA; Takahashi M; Mell BR; Jones TJ; Ratnam S; Kolb RJ; Nauli SM Ciliary polycystin-2 is a mechanosensitive calcium channel involved in nitric oxide signaling cascades. Circ. Res 2009, 104 (7), 860–9. [DOI] [PMC free article] [PubMed] [Google Scholar]
- (21).Su S; Phua SC; DeRose R; Chiba S; Narita K; Kalugin PN; Katada T; Kontani K; Takeda S; Inoue T Genetically encoded calcium indicator illuminates calcium dynamics in primary cilia. Nat. Methods 2013, 10 (11), 1105–7. [DOI] [PMC free article] [PubMed] [Google Scholar]
- (22).Luu VZ; Chowdhury B; Al-Omran M; Hess DA; Verma S Role of endothelial primary cilia as fluid mechanosensors on vascular health. Atherosclerosis 2018, 275, 196–204. [DOI] [PubMed] [Google Scholar]
- (23).Cornec-Le Gall E; Audrezet MP; Rousseau A; Hourmant M; Renaudineau E; Charasse C; Morin MP; Moal MC; Dantal J; Wehbe B; Perrichot R; Frouget T; Vigneau C; Potier J; Jousset P; Guillodo MP; Siohan P; Terki N; Sawadogo T; Legrand D; Menoyo-Calonge V; Benarbia S; Besnier D; Longuet H; Ferec C; Le Meur Y The PROPKD Score: A New Algorithm to Predict Renal Survival in Autosomal Dominant Polycystic Kidney Disease. J. Am. Soc. Nephrol 2016, 27 (3), 942–51. [DOI] [PMC free article] [PubMed] [Google Scholar]
- (24).Martin SW; Broadley KJ Renal vasodilatation by dopexamine and fenoldopam due to alpha 1-adrenoceptor blockade. Br. J. Pharmacol 1995, 115 (2), 349–55. [DOI] [PMC free article] [PubMed] [Google Scholar]
- (25).Szabo B; Hedler L; Starke K Dopamine1 receptor agonist and alpha-2 adrenoceptor antagonist effects of fenoldopam in rabbits.J. Pharmacol. Exp. Ther 1986, 239 (3), 881–6. [PubMed] [Google Scholar]
- (26).Klinger JR Plasma nitrite/nitrate levels: a new biomarker for pulmonary arterial hypertension? Eur. Respir. J 2016, 48 (5), 1265–1267. [DOI] [PubMed] [Google Scholar]
- (27).Tiso M; Schechter AN Nitrate reduction to nitrite, nitric oxide and ammonia by gut bacteria under physiological conditions. PLoS One 2015, 10 (3), e0119712. [DOI] [PMC free article] [PubMed] [Google Scholar]
- (28).Grantham JJ; Torres VE The importance of total kidney volume in evaluating progression of polycystic kidney disease. Nat. Rev. Nephrol 2016, 12 (11), 667–677. [DOI] [PMC free article] [PubMed] [Google Scholar]
- (29).Hailpern SM; Melamed ML; Cohen HW; Hostetter TH Moderate chronic kidney disease and cognitive function in adults 20 to 59 years of age: Third National Health and Nutrition Examination Survey (NHANES III). J. Am. Soc. Nephrol 2007, 18(7), 2205–13. [DOI] [PubMed] [Google Scholar]
- (30).Liu X; Cao J; Li H; Li J; Jin Q; Ren K; Ji J Mussel-inspired polydopamine: a biocompatible and ultrastable coating for nanoparticles in vivo. ACS Nano 2013, 7 (10), 9384–95. [DOI] [PubMed] [Google Scholar]
- (31).Bennet D; Marimuthu M; Kim S; An J Dual drug-loaded nanoparticles on self-integrated scaffold for controlled delivery. Int. J. Nanomed 2012, 7, 3399–419. [DOI] [PMC free article] [PubMed] [Google Scholar]
- (32).Liong M; Lu J; Kovochich M; Xia T; Ruehm SG; Nel AE; Tamanoi F; Zink JI Multifunctional inorganic nanoparticles for imaging, targeting, and drug delivery. ACS Nano 2008, 2 (5), 889–96. [DOI] [PMC free article] [PubMed] [Google Scholar]
- (33).Yallapu MM; Foy SP; Jain TK; Labhasetwar V PEG-functionalized magnetic nanoparticles for drug delivery and magnetic resonance imaging applications. Pharm. Res 2010, 27 (11), 2283–95. [DOI] [PMC free article] [PubMed] [Google Scholar]
- (34).Nauli SM; Kawanabe Y; Kaminski JJ; Pearce WJ; Ingber DE; Zhou J Endothelial cilia are fluid shear sensors that regulate calcium signaling and nitric oxide production through polycystin-1. Circulation 2008, 117 (9), 1161–71. [DOI] [PMC free article] [PubMed] [Google Scholar]
- (35).Mohieldin AM; Haymour HS; Lo ST; AbouAlaiwi WA; Atkinson KF; Ward CJ; Gao M; Wessely O; Nauli SM Protein composition and movements of membrane swellings associated with primary cilia. Cell. Mol. Life Sci 2015, 72 (12), 2415–29. [DOI] [PMC free article] [PubMed] [Google Scholar]
- (36).Bloom CA; Labato MA; Hazarika S; Court MH Preliminary pharmacokinetics and cardiovascular effects of fenoldopam continuous rate infusion in six healthy dogs. J. Vet. Pharmacol. Ther 2012, 35 (3), 224–30. [DOI] [PMC free article] [PubMed] [Google Scholar]
Associated Data
This section collects any data citations, data availability statements, or supplementary materials included in this article.