ABSTRACT
Chemical modifications (attributes) in the binding regions of stressed therapeutic proteins may affect binding to target and efficacy of therapeutic proteins. The method presented here describes the criticality assessment of therapeutic antibody modifications by size-exclusion chromatography (SEC) of competitive binding between a stressed antibody and its target, human epidermal growth factor receptor-2 (HER2), followed by SEC fractionation and peptide mapping characterization of bound and unbound antibodies. When stressed antibody and its target were mixed at a stoichiometric molar ratio of 1:2, only antibody-receptor complex eluted from SEC, indicating that binding was not decreased to break the complex. When a smaller amount of the receptor was provided (1:1), the antibody species with modifications reducing binding eluted as unbound from SEC, while the antibody-receptor complex eluted as the bound fraction. Peptide mapping revealed ratios of modifications between unbound and bound fractions. Statistical analysis after triplicate measurements (n = 3) indicated that heavy chain (HC) D102 isomerization and light chain (LC) N30 deamidation were four-fold higher in unbound fraction with high statistical significance. Although HC N55 deamidation and M107 oxidation were also abundant, they were not statistically different between unbound and bound. Our findings agree with previously published potency measurements of collected CEX fractions and the crystal structure of antibody and HER2. Overall, competitive SEC of stressed antibody-receptor mixture followed by peptide mapping is a useful tool in revealing critical residues and modifications involved in the antibody-target binding, even if they elute as a complex from SEC when mixed at 1:2 stoichiometric ratio.
KEYWORDS: Monoclonal antibody, size exclusion chromatography, mass spectrometry, critical attribute assessment, competitive binding, antibody-antigen binding, antibody-antigen complex. chemical modification, therapeutic protein
Introduction
During discovery and development programs, a large number of attributes are typically identified for therapeutic proteins (antibodies, Fc-fusion, and other therapeutic proteins), including glycosylation, hydroxylation, glycation, deamidation, oxidation, isomerization, clips, and other chemical modifications.1–3 Of these attributes, post-translational modifications typically take place during cell culture,4 and chemical modifications/degradations occur during production, purification, formulation, and storage.5 Attributes that alter the binding region of a therapeutic protein may impact its binding to target, and thus affect efficacy.6 As one of the main criteria for attribute criticality assessment, the efficacy of therapeutic proteins is measured as binding strength to the therapeutic target and duration in human circulation (pharmacokinetics).7–11 At present, criticality (clinical significance) of the attributes is assessed by separating intact proteins on fractions using soft separation techniques, such as ion exchange chromatography (IEX),12,13 hydrophobic interaction chromatography (HIC),14,15 and size exclusion chromatography (SEC) with the goal of having one attribute per fraction.16–18 An example is that protein molecules with one deamidated asparagine appear as an earlier-eluting peak on cation exchange chromatography (CEX),19–21 which can be collected as one fraction for further potency testing.22 However, it is difficult, if not impossible, to cleanly fractionate protein species with only one attribute/modification per chromatographic peak, or to assess criticality experimentally for each attribute.23–25 It also remains challenging to fractionate sufficient amounts of each proteoform to perform assays.26,27
Here, we further developed the method described in Bondarenko et al28 by incorporating competitive binding. As an example, trastuzumab and its target, human epidermal growth factor receptor-2 (HER2), were studied as a model system using competitive binding SEC followed by peptide mapping. Prior collection and study of CEX fractions22,29 and also online CEX-mass spectrometry (MS) studies28 revealed the presence of three main attributes in trastuzumab: light chain (LC) N30 deamidation, heavy chain (HC) N55 deamidation, and HC D102 isomerization. According to the sequence analysis and available crystal structure,30 all three residues are located in the complementarity-determining regions (CDRs) of trastuzumab and within close distance to HER2. It is typically assumed that all modifications in the CDRs of monoclonal antibodies (mAbs) are critical, and all modifications outside of CDRs are not critical. However, this is not always the case because not all residues in CDRs are involved in binding.31 Additionally, modifications on residues outside of CDRs may break binding due to long-range (allosteric) effects.32–34 Previous fraction collection and potency examination of trastuzumab CEX peaks indicated that LC N30 deamidation and HC D102 are critical quality attributes because they resulted in approximately 2- and 10-fold decreases in potency, respectively.22 No potency data are available for HC N55 deamidation.22
This work describes an approach to experimentally assess criticality of modifications by SEC of the competitive binding between the therapeutic antibody and its target (Figure 1). Different species of antibody-target complex are separated by SEC, collected by fractionation, and characterized by liquid chromatography (LC)-MS/MS analysis of bound and unbound therapeutic proteins. Rehder et al. investigated the mixture of stressed panitumumab, which targets epidermal growth factor receptor (EGFR), and soluble EGFR by using SEC and collecting the fractions of bound and unbound antibody.35 LC-MS characterization of intact and reduced antibody fractions (not peptide mapping) was then applied, driven by the hypothesis that iso-aspartate formation in LC D92 is responsible for the loss of antibody binding.35 In our method (Figure 1), LC-MS/MS analysis and statistical examination determined the relative abundance of modification in each fraction and the fold of change of each modification between unbound and bound fractions. When the experiments are repeated in triplicate, a volcano plot was generated where the modifications in the top right corner were the critical modifications in therapeutic protein that prevented the therapeutic protein-target binding. Insights into the binding interface can also be obtained by mapping the experimentally determined attributes to the available crystal structure of the antibody-receptor complex.
Figure 1.
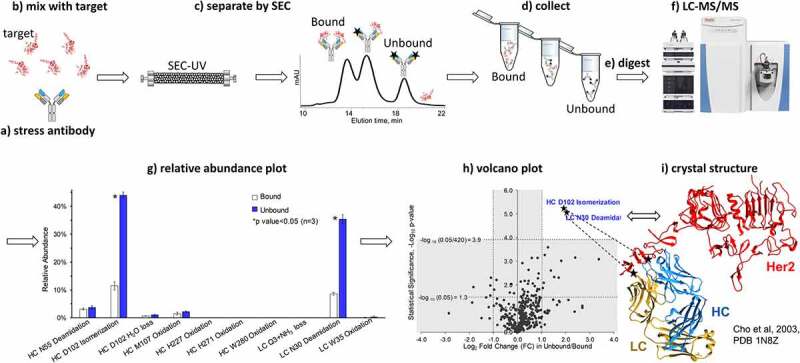
Workflow for experimentally assessing the criticality of modifications by (a) stressing antibody, (b) mixing with target protein, (c) separating by SEC on bound antibody-target complex and unbound antibody, (d) collecting fractions, (e) digesting by trypsin or other proteases, (f) LC-MS/MS peptide mapping identification and relative quantitation of modifications in bound and unbound antibody. Statistical analysis performed and presented as (g) relative abundance plot and (h) volcano plot, where every dot is defined by the fold change of a chemical modification level in unbound versus bond fraction as X-axis and confidence as Y-axis. The round dots in the gray area of the volcano plot represent modifications that are not affecting binding and the artificial modifications caused by the sample preparation. The modifications affecting binding appeared in the top right corner of the volcano plot and were mapped on the crystal structure (i) and represented by stars
The affinity measurement range of SEC is different from that of the traditional affinity measurement approach, surface plasmon resonance (SPR) technology, in which even a weakly bound complex with an equilibrium dissociation constant (Kd) value up to 10−6 M can be detected.36 It appeared that in SEC, antibody and its target elute separately when the binding becomes weaker and the Kd value becomes greater than 10−8 M.36 Typical therapeutic antibody-target binding affinity is much stronger, with a Kd value ranging from 10−11 to 10−9 M.37–39 These therapeutic antibodies bind quickly (within seconds after mixing at ~1 mg/ml concentration) and remain bound for hours, which allows the elution of antibody-receptor complex from SEC even after on-column dilution for an hour.40–42 In our experiments, when a ratio of 1:2 was applied to mix the stressed (at 45°C for 10 days) antibody and receptor, only antibody–receptor complex was found in the SEC elution profile; no significant amount of unbound antibody was observed (Figure 2). This suggested that, although stress at 45°C for 10 days led to various modifications in the antibody, these modifications only slightly affected the antibody-target binding, instead of eliminating the antibody binding (weakening above 10−8 M). When the amount of receptor was reduced to 1:1, a significant amount of unbound antibody was observed in the SEC binding experiments, enabling the subsequent fraction collection and peptide mapping of each antibody species.
Figure 2.
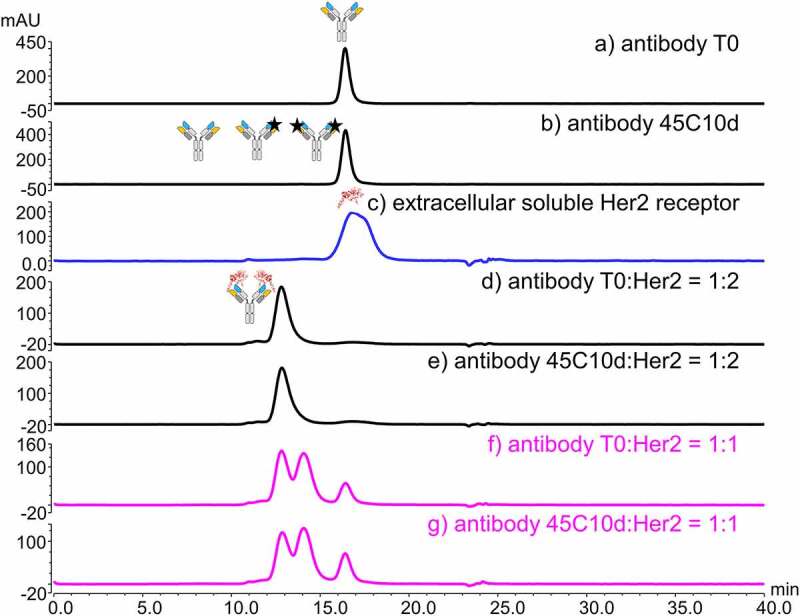
SEC-UV profile (280 nm) of (a) antibody, (b) stressed antibody (45°C 10 days, 45C10d), black stars represent modified Fab arms on unbound antibody, (c) HER2, represented on the figure by a minimized crystallographic image from Figures 1 and 9, and (d-g) the antibody-receptor and stressed antibody-receptor mixtures at different binding ratios. The binding ratio and material used for each binding experiment is indicated in the corresponding panel. Cartoons of antibody, receptor, and antibody-receptor complex are shown on top of each assigned peak based on SEC-UV data. Panels f-g show competitive binding when the receptor is in deficit, and antibody species need to compete to crease the antibody-receptor complex
Results
SEC of competitive binding of antibody and receptor
In the method presented here, the stressed antibody is mixed with its target protein (antigen) to form antibody-antigen complex. The mixture is then fractionated by SEC on antibody bound to target (complexed) and unbound (non-complexed), later containing critical attributes preventing the binding (Figure 1, top). Once the fractions are collected, the attributes (chemical modifications) of the mAb in each fraction are characterized by LC-MS/MS peptide mapping. The characterization includes identification and quantitation of modifications in the bound and unbound therapeutic protein fraction. This allows identification of the critical quality attributes responsible for the loss of affinity binding, as the attributes affecting binding are more abundant in the unbound antibody fraction than the bound antibody fraction. The SEC fractionation, sample preparation, and data analysis are repeated several times to measure statistical significance. The results can be presented as a volcano plot, which is a type of scatter plot used to identify changes in large data sets with replicate data (Figure 1, bottom). In the volcano plots, every dot represents a modified residue with y-axis value as statistical significance and x-axis value as fold change between the modification abundance in unbound and bound antibody fractions.
Our work was initiated by performing SEC-UV experiments to examine unstressed antibody, stressed antibody, and the binding of receptor with unstressed antibody and stressed antibody (Figure 2). No significant difference was found between the SEC-UV profiles of unstressed antibody sample (T0) and the antibody stressed at 45°C for 10 days (45C10d), shown in Figure 2a and 2b. The broadness of the SEC-UV peak of HER2 may be due to the high heterogeneity in the glycan profiles of this receptor (Figure 2c).43 When a ratio of 1:2 was used to generate antibody-receptor complex, ~96% of antibody formed a complex with two molecules of HER2 regardless of the stress (Figure 2d and 2e). A smaller amount of the receptor was provided to create a competitive binding environment where the unbound antibody can be present (Figure 2f and 2g). When a ratio of 1:1 HER2 and antibody was used, ~20% and ~40% of antibody was unbound for the T0 and stressed samples, respectively. Based on the SEC-UV data of antibody and receptor at different ratios, a 1:1 ratio of 45C10d antibody binding to HER2 was further used to perform SEC with multi-angle light scattering (MALS) detection and fraction collection studies.
Binding stoichiometry determined by SEC-UV-MALS
SEC-UV-MALS method was applied to establish the binding stoichiometry between antibody and receptor (Figure 3). The UV profiles revealed the reproducibility of the SEC-UV peaks of stressed antibody, receptor, and their mixture with a ratio of 1:1. The experimentally determined molecular weight of antibody 45C10d and HER2 appeared to be 147 and 118 kDa, respectively, which agreed with the theoretical molecular weight of antibody and receptor.22,43 The MALS data of 1:1 stressed antibody:receptor mixture showed that ~40% of the stressed antibody remained unbound, with a molecular weight of 142 kDa. Additionally, the peak eluting at ~12.8 min had a molecular weight of 360 kDa, while the peak eluting at ~14.1 min had a molecular weight of 267 kDa. The earlier eluting peak at ~12.8 min thus corresponded to the binding complex of antibody and receptor with a ratio of 1:2; and a ratio of 1:1 was assigned for the antibody-receptor complex eluting at ~14.1 min.
Figure 3.
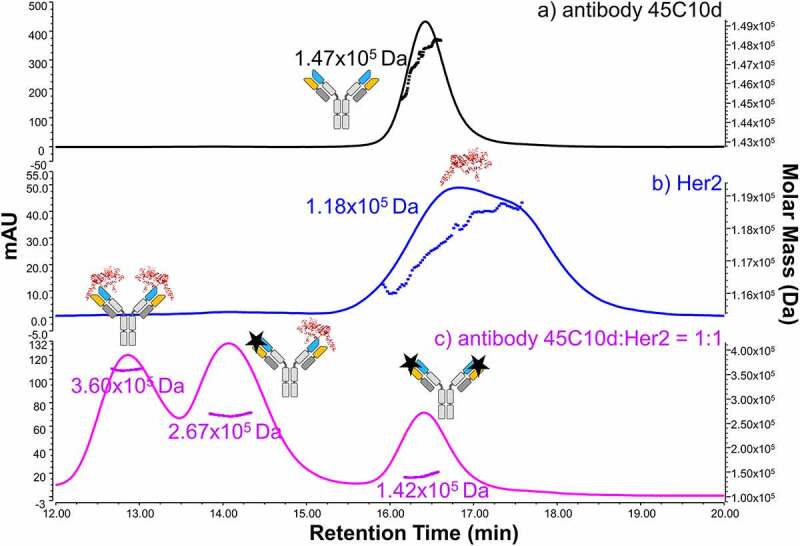
SEC-UV-MALS profiles of (a) stressed antibody (45°C 10 days, 45C10d), (b) the receptor HER2, and (c) the stressed antibody-receptor mixture with a binding ratio of 1:1. The UV absorbance is shown in solid lines. The y-axis on the left represents the milli Absorbance Units of UV at 280 nm. The MALS data are displayed as dots, and the y-axis of the determined molecular weight is shown on the right. Cartoons of antibody, receptor, and antibody-receptor complexes are shown on top of each assigned peak based on the experimentally measured molecular weight
SEC fraction collection and CEX-UV analysis of collected fractions
Three fractions were collected from the SEC separation of the 1:1 mixture of antibody 45C10d and receptor (blue trace in Figure 4). For comparison, the SEC-UV profiles of antibody T0, antibody 45C10d, and the mixture of antibody T0 and receptor at a 1:1 ratio are also shown in Figure 4. Fraction 1 represented the bound species of antibody in the 1:2 antibody:receptor complex. The unbound species of antibody was studied in collected Fraction 3. Fraction 2, representing antibody bound to one receptor, was also collected. The SEC fractions were collected for two sets of experiments including native CEX and reduced peptide mapping. The CEX analysis and peptide mapping presented here focused on the results of Fraction 1, the bound species of antibody, and Fraction 3, the unbound species of antibody.
Figure 4.
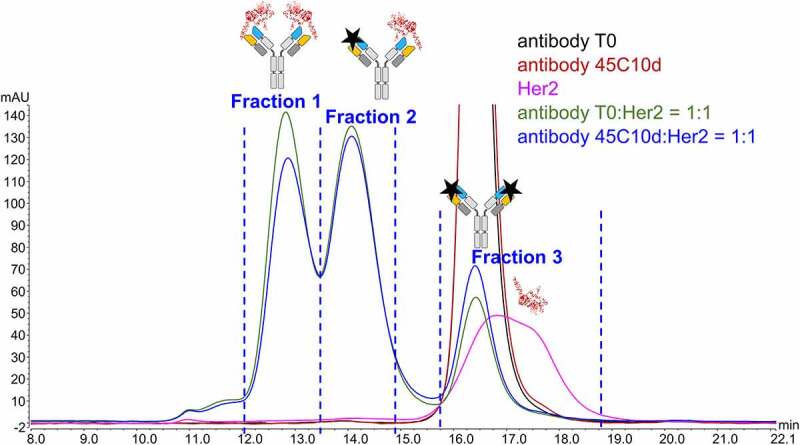
SEC-UV (280 nm) profile of antibody T0 (black), antibody 45°C 10 days (45C10d, red), HER2 (magenta), antibody T0/receptor mixture (green), and antibody 45C10d – receptor mixture (blue). A ratio of 1:1 was used to generate the antibody T0/receptor and antibody 45C10d – receptor mixtures. Blue dashed lines delineate the regions for fraction collection of antibody 45C10d – antigen mixture. Cartoons of antibody, receptor, and antibody-receptor complexes are shown on top of each assigned peak based on SEC-UV-MALS data
The SEC fractions were analyzed using the CEX-UV method, which revealed significant differences in the elution profiles between bound and unbound antibody species. Fraction 1 (bound) contained one main peak, while Fraction 3 (unbound) included a large percentage of variants eluting as pre-peaks and post-peaks of the main species (Figure 5). CEX of Fraction 1 (bound), showed a significantly greater tailing (Figure 5) and a broad peak eluting with the column flash at 45 minutes (not shown in Figure 5), suggesting that only a portion of antibody dissociated from HER2 during CEX to elute as a peak at 18.5 min, while the remaining antibody-HER2 complex contributed to the tailing. Figure 5 also includes the CEX-UV profiles of antibody T0 and antibody 45C10d, displaying that heat stress led to an increase in the abundance of various minor species that eluted as pre and post peaks in CEX measurements.
Figure 5.
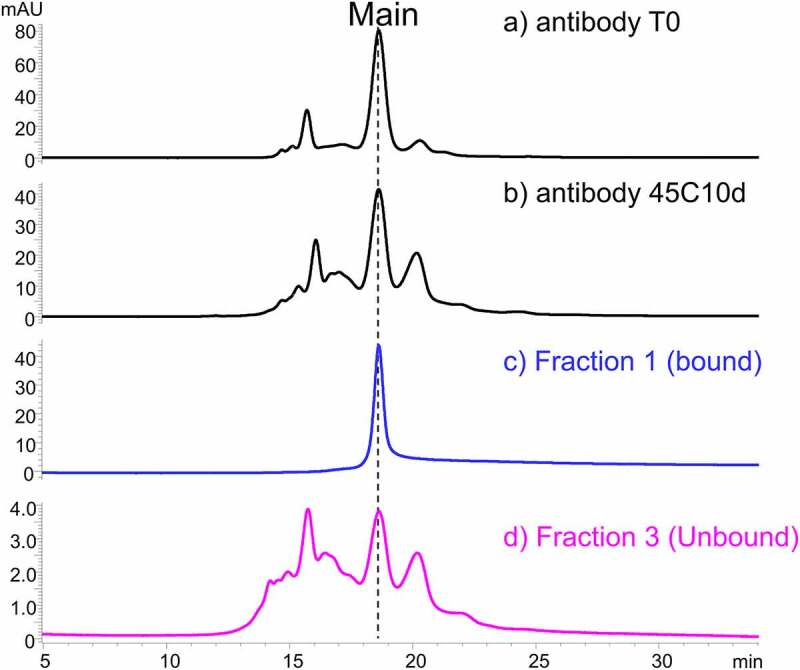
CEX-UV (280 nm) profiles of (a) antibody T0, (b) antibody 45°C 10 days (45C10d), (c) the collected fraction 1, and (d) the collected fraction 3. Fraction 1 and 3 are collected based on the SEC-UV profile of the antibody 45C10d – antigen mixture shown in Figure 4
For peptide mapping, SEC fraction collection was performed in denaturing solution containing high concentration of guanidine with addition of methionine, where the proteins were unfolded, reduced and alkylated (see Materials and Methods section for details).
Peptide mapping data of collected SEC fractions
The bound and unbound antibody species separated by SEC were subjected to peptide mapping LC-MS/MS analysis to identify the amino acid residues and their modifications (Supplemental Table S1). Sequence coverage of ~96% and 100% was found for the HC and LC of the antibody, respectively (Figure S1). Peptide mapping results including measured percentages of 420 modifications were summarized in the volcano plot, and a scatter-plot was used to identify changes in large data sets composed of replicate data (Figure 6). Volcano plot showed statistical significance (often defined as – log10 of p-value) and Fold Change on the y- and x-axes, respectively. As log2 Fold Change was used instead of Fold Change, Fold Change values ¼, ½, 1, 2, and 4 corresponded to log2 Fold Change values of −2, −1, 0, 1, and 2, respectively, symmetrical on x-axis.
Figure 6.
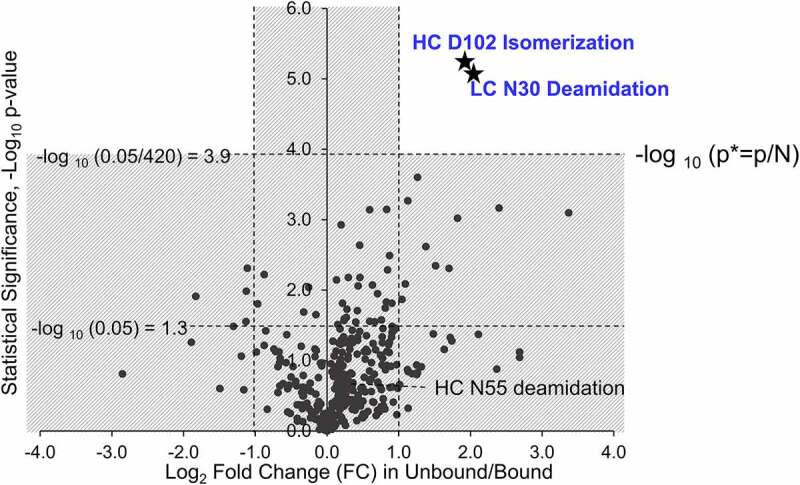
Volcano plot for criticality assessment of antibody attributes. The x-axis represents the log2 values of the ratio between unbound and bound, and the y-axis represents the negative log10 value of p-value. For reference, the vertical dashed lines correspond to ±0.6, suggesting a ratio of 1.5 between the unbound and bound species. Three horizontal dashed lines represent two p-values: 0.05 and 0.05/420
Every dot in the volcano plot represented a residue modified with a certain chemical modification, and the fold change on x-axis was abundance ratio of modifications in unbound versus bound protein fractions. In the system of antibody binding to HER2, the modified residues on the top right corner of the volcano plot affect binding the most and with high statistical significance. HC D102 isomerization and LC N30 deamidation emerged as critical attributes for antibody binding based on the volcano plot and statistical analysis (Figure 6). Abundance of critical modifications should be statistically significantly higher in unbound antibody fractions, while abundances of noncritical and artificial modifications should be the same and have fold change close to 1. This can be used to assess probability that the observed difference was “real” or just an error of the method (precision). When a cutoff of 2 was applied for the fold change in unbound/bound (right vertical dashed lines in Figure 6), the modifications with an x-axis value larger than 1 in the volcano plot were considered as potential modifications that may impact antibody binding, as in the right region of the volcano plot. Only a few modifications with relatively low statistical significance were observed in the region to the left from Fold Change log2 = −1, suggesting that none of the modifications on residues actually promoted antibody binding to HER2.
When high statistical significance and large fold change were both considered, the modified residues that affect antibody binding to HER2 the most appeared on the top right corner of the volcano plot (Figure 6). For every detected modification in the volcano plot, the y-axis value represented the statistical significance coming from the p-value that was calculated using t-test function by comparing triplicate measurements of modification percentage in bound and unbound protein fractions. In addition to a cutoff of 1 on the x-axis (right vertical dashed line in Figure 6), a cutoff of p* < 1.19 × 10⁻⁴, or -log10 p-value larger than 3.9, was applied for the p-value of each modification to decrease the false discovery rate (top horizontal dashed line in Figure 6). A cutoff of 1.19 × 10⁻⁴ was set as p* and used for the p-value because p* came from a p-value of 0.05 divided by 420, the total number of antibody modifications detected in peptide mapping. The analysis of volcano plot showed that HC D102 isomerization and LC N30 deamidation were statistically significant and displayed a significant change in the modification percentages between unbound and bound fractions, indicating HC D102 isomerization and LC N30 deamidation were critical attributes in antibody binding to HER2. Automatically identified Q37 deamidation was ruled out from the volcano plot, as Q37 was a part of the same peptide as N30. Manual verification of fragmentation mass spectra (MS/MS) indicated that the deamidation was on N30 (Figure S2). The dots in the gray area of the volcano plot in Figure 6 represented the noncritical and artificial antibody modifications with similar abundances in unbound and bound fractions, or having different abundances but failing the strict statistical test.
When the values of 1 and 1.3 were applied for the cutoff in the x-axis and y-axis, respectively (vertical and bottom horizontal dashed lines in Figure 6), the modifications with a fold change larger than 2 and a p-value smaller than 0.05 would be considered as attributes that may potentially impact antibody binding to HER2. In addition to HC D102 isomerization and LC N30 deamidation, several modifications on HC and LC N-termini of antibody appeared as possibly affecting binding of antibody to HER2 target (see dots in the top right gray area in Figure 6 and also Figure S3 and Discussion section for more information).
Quality control by volcano plots and relative abundance of selected antibody modifications
Theoretically, all modifications detected in peptide mapping should have symmetrical distribution in the volcano plot, if those modifications do not impact binding, or they are induced by sample preparation. Deviation from symmetrical distribution in the volcano plot would indicate sample preparation non-equality between the unbound and bound fractions of antibody. Quality control of the peptide mapping data was performed by plotting different types of modifications as individual volcano plot to reveal if the volcano plot is symmetrical for each category (Figure 7). In total, five main types of modifications, oxidation, isomerization, deamidation, glycation, and artifacts, were plotted individually to examine the shape of the distribution of the modifications in the volcano plot. A minor shift to the left was found for oxidation on x-axis scale (fold change in unbound/bound), suggesting that the collected bound fraction(s) of antibody was artifactually oxidized slightly more than unbound (Figure 7a). On the other hand, other types of modifications slightly affected the unbound fraction artifactually, as minor shifts to the right were observed in the region where the x-axis value is between −0.5 and 0.5 in the volcano plot (Figure 7b-7e). This confirmed that HC D102 isomerization and N30 deamidation showed much greater fold of change and statistical significance than the possible artifactual modifications. Although oxidation of LC W35 and carboxymethylation of HC K124 showed a fold of change that was larger than 2 (log2 Fold Change in Unbound/Bound > 1), neither of these modifications passed the t-test for statistical significance. These modifications, as a result, were not considered as critical quality attributes for antibody.
Figure 7.
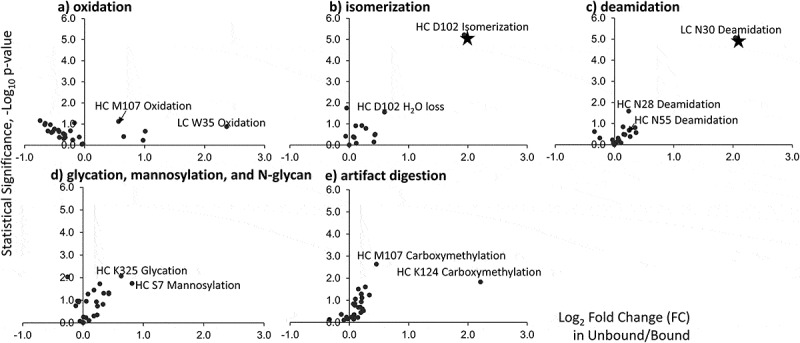
Volcano plots for selective attributes of antibody. These attributes include oxidation (a), isomerization (b), deamidation (c), glycation, and N-glycan (d), and artifacts of digestion (e). The x-axis represents the ln2 values of the ratio between unbound and bound, and the y-axis represents the negative log10 value of p-value
Figure 8 summarizes the relative abundance of selective antibody modifications in bound and unbound fractions from competitive binding SEC experiments. All these modifications showed a fold of change larger than 1.5, but only two modifications, HC D102 isomerization and LC N30 deamidation, were with the strict statistical significance between bound and unbound (marked by asterisk). The percentage of HC D102 isomerization was ~12% and ~43% in the bound and unbound fractions of the stressed antibody, respectively. The abundance of LC N30 deamidation was also approximately fourfold higher in the unbound fraction (~36%) as compared to bound (~7%). The percentage of HC D102 H2O loss (succinimide) was below 5% in the bound and unbound fractions of stressed antibody. Although the percentage of HC N55 deamidation and HC M107 oxidation was ~5% in the unbound fraction, the difference between unbound and bound fraction was not statistically significant, suggesting that they did not significantly affect binding or were induced during sample preparation.
Figure 8.
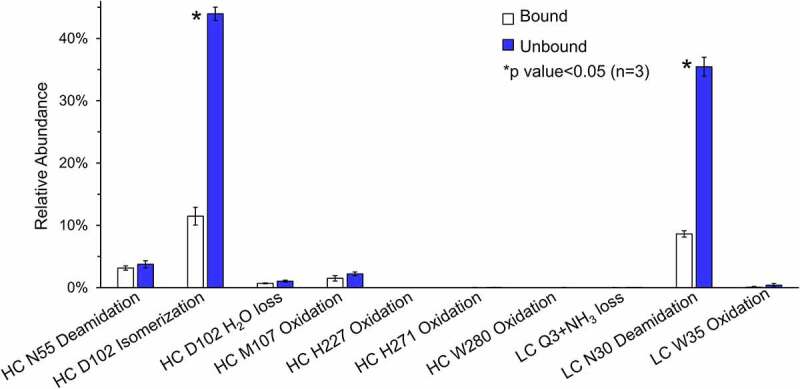
Relative abundance plots of selective attributes of antibody in the bound (white) and unbound (dark) species. The modifications with a p-value that is smaller than 0.05 are labeled with asterisk signs, and the p-value is determined from triplicate measurements
Calculations described in Figure S5 and related text in the Supporting Information suggest that either modification, N30 deamidation or D102 isomerization, reduce binding and concentrate antibody molecules in partially and completely unbound SEC fractions 2 and 3. Accuracy of the binding strength quantitation by the competitive binding SEC method will benefit from further development, including, for example, adjusting the molar ratios of antibody:antigen, incubation time for assessing differences in association (ka) and SEC column length for assessing dissociation (kd).
Correlation to prior potency measurement and crystal structure
Our SEC data of competitive antibody binding to HER2 indicated that HC D102 isomerization and LC N30 deamidation were critical antibody attributes impacting target binding the most (Figure 6). This finding agreed with previous potency measurements of collected CEX fractions of different antibody proteoforms (Figure 9a). Harris et al. identified six different proteoforms upon separating antibody by CEX-UV using high-concentration salt buffers and collected three CEX fractions to perform a potency test.22 We have also performed peptide mapping and characterized the main proteoform in each CEX peak.29 The potency measurements of the collected CEX fractions showed that the main CEX peak had a potency of 140%, while the CEX peak characterized as HC D102 isomerization only had a potency of 12–30%.22 A potency of 98% was found for the second acidic peak on the CEX profile of antibody that mainly contains LC N30 deamidation.22 No potency data was obtained for the antibody CEX peak characterized as HC N55 deamidation due to the low abundance of HC N55 deamidation in antibody and possible challenges in fraction collections, enrichment and potency measurements.
Figure 9.
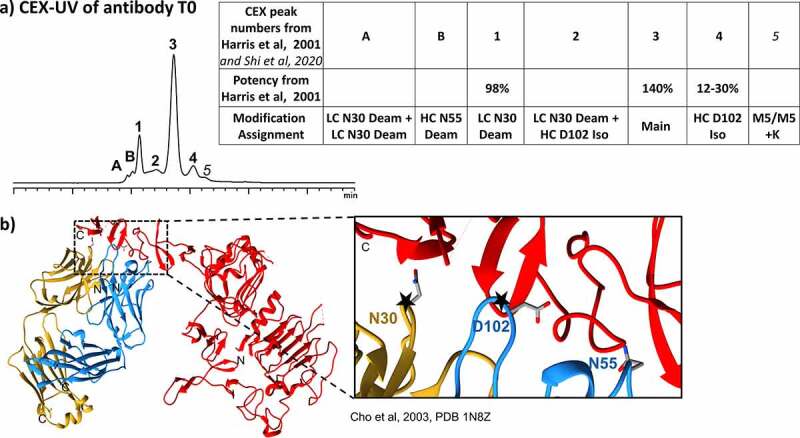
(a) CEX-UV profile of antibody T0 and features of each proteoform observed in the CEX experiments. Potency measurement of CEX peaks are also shown in the table on the right. (b) Crystal structure of antibody- HER2 complex (PDB: 1N8Z)30 and the closer view of the binding region with critical attributes shown in the right box
LC N30, HC D102 and HC N55 of antibody were found in close proximity to HER2 (within 6 Å) based on the crystal structure of the complex for HER2 and the antibody Fab region (Figure 9b),30 suggesting that modifications on the residues may affect binding. Figure S4 summarized the measured distance from HER2 to the amino acids on LC N30, HC D102 and HC N55 of antibody. Although close proximity of HC N55 to HER2 (6.4 Å) suggested that N55 deamidation may affect binding, the SEC-based method described here showed that the modification is not critical for binding.
Discussion
Protein-protein complexes, including antibody-target complexes, remain bound during SEC separation if the Kd is smaller than 10−8 M.36 A Kd value smaller than 10−9 M is typically found for therapeutic antibody-target binding.37,38 In the case of antibody-HER2 complex, modifications after stress at 45°C for 10 days did not lead to loss of binding as measured by SEC (Figure 2). This suggested that even for stressed and degraded antibody molecules, the Kd value of the receptor binding was still smaller than 10−8 M when a ratio of 1:2 was applied for antibody and receptor. The strong interaction between therapeutic protein and target enabled the therapeutic molecules to bind quickly with target and remain bound during the SEC separation. In the competitive binding experiment, several modifications on therapeutic antibody decreased its binding to target below a Kd value of 10−8 M, but led to the separate elution of unbound antibody on SEC because it was outcompeted by stronger binding, unmodified antibody molecules. The modified antibody with even minor loss of binding strength (from Kd = 10−11-10−9 M) would elute separately on SEC, facilitating fraction collection and identification of the modifications affecting binding the most. When other stress conditions, including 40°C for 21 days, were tested, the SEC-UV profiles of antibody T0 and stressed antibody remain similar. A 1:1 ratio of 45C10d antibody binding to HER2 was used to create competitive SEC binding and further analyzed using fraction collection and peptide mapping.
A 1:2 binding stoichiometry was assigned for antibody binding to HER2 by using SEC-UV-MALS techniques (Figure 3). Prior work of antibody binding to HER2 demonstrated that when one arm of the antibody is missing, the antibody would lost its binding potency against the receptor.44–46 The HER2 sample used in this work was the extracellular soluble region of the receptor, suggesting the binding stoichiometry in solution can be different from that on the cell surface.47–50 After characterization by SEC-UV-MALS, the bound and unbound fractions of antibody were collected separately to perform CEX-UV studies. As the bound and unbound antibody fractions showed different CEX elution profiles (Figure 5), CEX analysis can serve as a fast and convenient tool to understand the proteoform distributions in the fractions collected from competitive binding SEC experiments.
The potency measurements of the CEX fractions were from an antiproliferation assay, which measures the ability of antibody to prevent proliferation of a cell line derived from a human adenocarcinoma that overexpresses the her2/neu gene and HER2 receptor on cell surface.22 Biological activities requiring bivalent receptor binding (such as trastuzumab antiproliferation)22,44–46 may be affected by modifications to a greater extent than the monovalent binding measured here by SEC.
The modifications on the N-termini of antibody HC and LC, shown as dots in the top right of the gray area in Figure 6, were considered as possible, but not strictly statistically significant considering the large size of the population of measured chemical modifications (also see supplemental information Figure S3). This was because the number of the detected modifications should be included when the p-value cutoff was established. The p-value is a measure of false positive rate (FPR). Traditionally, the p-value cutoff of 0.05 suggests that one false positive (erroneous) result occurs approximately every 20 tests of a single modification (bottom horizontal dashed line in Figure 6). In our experiments, hundreds of modifications were identified and quantified on most of the amino acid residues of the therapeutic protein, increasing the chance of false discovery of critical modifications.
To minimize the chance of false discovery, the number of the tested modifications, or a scientifically relevant fraction of it, should be included in the evaluation of statistical significance. The false discovery rate (FDR) was introduced for the list of modifications detected in peptide mapping, rather than FPR. This approach was similar to genome-wide studies where a few genes involved in a pathway or a disease need to be selected from a list of thousands of genes with high confidence.51,52 The FDR is the expected fraction of false positives in a list of modifications. Statistics proposed several procedures for adjusting p-values to correct for the multiple comparisons problem. The oldest was the Bonferroni correction, where the corrected p-value (p*) needs to include the total number of tested modifications.52 p* can be determined by dividing p by N, where p was the p-value for a test of a single modification, and N was the number of modifications tested. As there were 420 modifications in the results from peptide mapping, corrected p-value threshold should be set to 1.19 × 10⁻⁴, as a result of 0.05 divided by 420 (top horizontal dashed line in Figure 6), or -log10 p-value should set to be larger than 3.9. Removing modifications from remote domains can be further applied to reduce the significance level or FDR level. For an antibody or Fc-fusion protein, modifications on the Fc region could be removed from the list, since CDRs are far from the Fc domain. To summarize, the number of tested modifications in the list, or a scientifically relevant fraction of it, should be added to the denominator of p-value.
Statistical analysis of the volcano plot demonstrated that several modifications on the N-termini of antibody HC and LC might prevent binding (Figure 6, Figure S3). Close review of antibody-HER2 crystal structure indicated that only regions from T23 to N623 were crystalized for HER2 and had available structure,30 while the HER2 sample used in this study was the extracellular soluble region with a longer sequence from T23 to T652. Our manual extrapolation of the crystallography data indicated that the N-termini of antibody HC and LC might come close to HER2 C-terminal residues N623-T652 (not present on the crystal structure), and the N-terminal antibody modifications including extensions might lead to loss of binding (see HER2 C-terminus labeled as “C” on Figure 9b).
After assessment of several different (similarly stressed, e.g., at 45°C for 10 days) therapeutic proteins (antibodies and Fc-fusion proteins) bound to their targets, we typically detected loss of binding by SEC while using the stoichiometric protein–target ratio. This indicated that those modifications dramatically reduced the antibody-target binding strength by 2 orders of magnitude from a typical Kd at ~10−10 M to the SEC “breaking point” of Kd ~10−8 M. The example of antibody-HER2 described here illustrated that there may be other modifications (attributes) that reduced binding, but still eluted as a complex from SEC. Competitive SEC binding appeared to be an important method in assessing all modifications, strongly and relatively weakly impacting binding. This example also raised a question regarding whether the weaker bound therapeutic antibodies would retain the therapeutic efficacy. For example, if antibody-target binding strength decreases from Kd ~10−10 M to Kd ~10−9 M (10-fold decrease, from 100% to 10% for the fractionated proteoforms), would the therapeutic antibody still benefit patients? Were the modifications described here really critical for efficacy of the drug? Determining answers to these questions, however, was beyond the scope of our study.
Our SEC-based method uses chemical modifications on amino acid side chains for mapping protein–protein interactions, which is somewhat similar to radiolysis53–56 and fast photochemical oxidation of proteins.57–60 However, affinity binding by SEC measurement does not require costly use of lasers to perform radiolysis and fast photochemical oxidation of biomolecules. Our approach can also be applied for paratope-epitope mapping of antibody-target binding sites, providing an effective tool to distinguish between binding and nonbinding residues closely positioned to the target.
Materials and methods
Materials and sample preparation
The antibody vial (lot 3072991, Genentech, South San Francisco, CA) including 440 mg trastuzumab, 9.9 mg L-histidine HCl, 6.4 mg L-histidine, 400 mg a-trehalose dihydrate, and 1.8 mg polysorbate 20, United States Pharmacopoeia (USP), was reconstituted in 20 mL of the supplied bacteriostatic water for injection, USP, containing 1.1% benzyl alcohol as a preservative to yield solution containing 21 mg/mL trastuzumab antibody at a pH of ~ 6. The antibody was stressed at 45°C for 10 days (45C10d) in the original formulation. The human recombinant HER2 protein (containing the extracellular domain Thr23-Thr652 of human ERBB2 NP_004439.2 with His tag) was purchased from Sino Biological (catalog number 10004-H08H, Wayne, PA) and dissolved in water to reach a final concentration of 1 mg/mL. The antibody-HER2 complex was formed by incubating the antibody and receptor at 37°C for 30 min. Two different molar ratios of antibody:receptor, 1:2 and 1:1, were used in the formation of the binding complex. Trypsin from bovine pancreas (sequencing grade) was purchased from Roche Biochemical Reagents, Sigma Aldrich (St. Louis, MO). Unless specified, other reagents were purchased from Fisher Scientific (Pittsburgh, PA). A Tosoh TSK Gel G3000SWXL columns (7.8 mm i.d. × 300 mm, 5 μm) was purchased from Tosoh Bioscience (Grove City, Ohio) for SEC separation.
Competitive binding SEC experiments and fraction collection for CEX-UV and peptide mapping
The SEC experiments were performed on an Agilent 1100 HPLC equipped with a variable wavelength detector (VWD) using a flow rate of 0.5 mL/min at a column temperature of 37°C. 150 mM sodium phosphate, 300 mM sodium chloride, and 5% ethanol, pH 7.0, was used as mobile phase. SEC-UV data were collected using absorbance detection at 280 nm. The samples were also analyzed using SEC-UV coupled with MALS technique as described previously.35 A miniDawn TriStar light scattering detector (Wyatt Technologies) was connected immediately downstream of the VWD. The molar masses of individual peaks in the chromatograms were determined using ASTRA software (v.5.3, Wyatt Technologies). A change in refractive index with respect to concentration (dn/dc) of 0.186 mL/g was employed.35 Each peak observed in the SEC-UV profile was assigned based on the measured molecular weight. Based on the SEC-UV elution profile, SEC fractions were collected for CEX-UV and peptide mapping analyses as follows. SEC fractions eluting in pH 7 buffer were manually collected in 500 µL Microcon tubes equipped with 30-kDa molecular weight cutoff (MWCO) filter (Sigma-Aldrich, St. Louis, MO) and concentrated above the filter before CEX-UV analysis. CEX-UV was performed as described previously.29 For peptide mapping, the SEC fractions were collected into an Eppendorf tube with the presence of 200 µL denature solution containing 6 M guanidine hydrochloride, 0.2 M Tris, 2 mM EDTA, and 20 mM methionine (pH 3.5) to minimize artificial oxidation caused by collection. SEC runs and fraction collection were carried out in triplicate.
Proteolysis and mass spectrometry analysis
Detailed digestion and LC-MS/MS analysis procedures have been described elsewhere.29,61 Corresponding fractions from each run were transferred onto a 500 µL Microcon filter (30 kDa MWCO, Sigma-Aldrich, St. Louis, MO) and were dried by spinning for 15 min at 14,000 × g. Then, each fraction was dissolved in the denature solution with 10 mM dithiothreitol for reduction at 37°C for 30 min, followed by alkylation (10 mM iodoacetamide) in dark at room temperature for 30 min. The filter of each fraction was further washed with digestion solution (0.1 M Tris, 20 mM methionine, and 5% acetonitrile (ACN)) three times to remove the residual denature solution. Each SEC fraction was digested for 45 min with trypsin at a 1:20 enzyme:substrate ratio at 37°C. Digestions were quenched with 40 µL quench solution including 8 M guanidine hydrochloride, 2 mM EDTA, and 20 mM methionine to a final ~5.3 M guanidine hydrochloride solution at pH 5.0. After spinning for 15 min at 14,000 × g, the flow-through with tryptic peptides was collected using a new centrifuge tube. The digestion of antibody and receptor were also performed by following the same protocol.
Tryptic peptides were injected via an auto-sampler onto a Varian Polaris Ether C18 column (Agilent, 2.1 × 250 mm, 3.0 μm particle size, 180 Å pore size) at a flow rate of 0.2 mL/min using Agilent 1290 system. A linear gradient from 100% phase A (water with 0.1% trifluoroacetic acid) to 50% phase B (10% water and 90% ACN with 0.1% trifluoroacetic acid) was applied for 190 min. Tryptic peptides were analyzed online using a Q Exactive Biopharma mass spectrometer (Thermo Fisher Scientific). Data were collected in data-dependent mode with higher-energy collisional dissociation fragmentation.
Peptide identification and data analysis
MS data were searched against the sequence of mAb heavy chain and light chain, the receptor, and trypsin using MassAnalyzer (v4.05).62 The volcano plot, a type of scatter-plot, was used to represent the peptide mapping results to identify changes in large data sets that are composed of replicate data. The plot includes statistical significance (defined as – log10 of p-value) and fold change (FC) on the y and x axes, respectively. In this experiment, the fold change was abundance ratio of modifications in unbound versus bound protein fractions.
Supplementary Material
Acknowledgments
We gratefully acknowledge Zhongqi Zhang for optimizing MassAnalyzer software and Daniel Woodall for helpful discussions. We also thank Kate Hutterer for providing the antibody samples; Patrick Swann, Tiffany Thiel, Scott Siera, Julie Hong, Tom Wrona, David Semin and Chetan Goudar for fruitful discussions and support of the project. This research was supported by Amgen Inc.
Abbreviations
Å, Angstrom; CDR, Complementarity determining region; CEX, Cation exchange chromatography; EGFR, Epidermal growth factor receptor; FPR, False positive rate; FDR, False discovery rate; HC, Heavy chain; HER2, Human epidermal growth factor receptor-2; HIC, Hydrophobic interaction chromatography; IEX, Ion exchange chromatography; ka, Association rate constant; kd, Dissociation rate constant; Kd, Equilibrium dissociation constant; LC, Liquid chromatography; LC, Light chain; MALS, Multi-angle light scattering; MS, Mass spectrometry; SEC, Size-exclusion chromatography; SPR, Surface plasmon resonance; VWD, Variable wavelength detector.
Supplementary material
Supplemental data for this article can be accessed on the publisher’s website.
References
- 1.Hmiel LK, Brorson KA, Boyne MT.. Post-translational structural modifications of immunoglobulin G and their effect on biological activity. Anal Bioanal Chem. 2015;407:79–12. doi: 10.1007/s00216-014-8108-x. [DOI] [PubMed] [Google Scholar]
- 2.Wei B, Berning K, Quan C, Zhang YT. Glycation of antibodies: modification, methods and potential effects on biological functions. MAbs. 2017;9:586–94. doi: 10.1080/19420862.2017.1300214. [DOI] [PMC free article] [PubMed] [Google Scholar]
- 3.Beyer B, Schuster M, Jungbauer A, Lingg N. Microheterogeneity of Recombinant Antibodies: analytics and Functional Impact. Biotechnol J. 2018:13. doi: 10.1002/biot.201700476. [DOI] [PubMed] [Google Scholar]
- 4.Wang Q, Chung CY, Chough S, Betenbaugh MJ. Antibody glycoengineering strategies in mammalian cells. Biotechnol Bioeng. 2018;115:1378–93. doi: 10.1002/bit.26567. [DOI] [PubMed] [Google Scholar]
- 5.Moritz B, Stracke JO. Assessment of disulfide and hinge modifications in monoclonal antibodies. Electrophoresis. 2017;38:769–85. doi: 10.1002/elps.201600425. [DOI] [PMC free article] [PubMed] [Google Scholar]
- 6.Rathore AS, Sarker A, Gupta RD. Recent Developments Toward Antibody Engineering and Affinity Maturation. Protein Pept Lett. 2018;25:886–96. doi: 10.2174/0929866525666180925142757. [DOI] [PubMed] [Google Scholar]
- 7.Stoll D, Danforth J, Zhang K, Beck A. Characterization of therapeutic antibodies and related products by two-dimensional liquid chromatography coupled with UV absorbance and mass spectrometric detection. J Chromatogr B Analyt Technol Biomed Life Sci. 2016;1032:51–60. doi: 10.1016/j.jchromb.2016.05.029. [DOI] [PubMed] [Google Scholar]
- 8.Hayes JM, Wormald MR, Rudd PM, Davey GP. Fc gamma receptors: glycobiology and therapeutic prospects. J Inflamm Res. 2016;9:209–19. doi: 10.2147/JIR.S121233. [DOI] [PMC free article] [PubMed] [Google Scholar]
- 9.Gupta SK, Shukla P. Advanced technologies for improved expression of recombinant proteins in bacteria: perspectives and applications. Crit Rev Biotechnol. 2016;36:1089–98. doi: 10.3109/07388551.2015.1084264. [DOI] [PubMed] [Google Scholar]
- 10.Goetze AM, Liu YD, Zhang Z, et al. High-mannose glycans on the Fc region of therapeutic IgG antibodies increase serum clearance in humans. Glycobiology. 2011;21:949–59. doi: 10.1093/glycob/cwr027. [DOI] [PubMed] [Google Scholar]
- 11.Awotwe-Otoo D, Agarabi C, Wu GK, Casey E, Read E, LuteS, Brorson KA, Khan MA, Shah RB. Quality by design: impact of formulation variables and their interactions on quality attributes of a lyophilized monoclonal antibody. Int J Pharm. 2012;438:167–75. doi: 10.1016/j.ijpharm.2012.08.033. [DOI] [PubMed] [Google Scholar]
- 12.Liu H, Ren W, Zong L, Zhang J, Wang Y. Characterization of recombinant monoclonal antibody charge variants using WCX chromatography, icIEF and LC-MS/MS. Anal Biochem. 2019;564–565:1–12. doi: 10.1016/j.ab.2018.10.002. [DOI] [PubMed] [Google Scholar]
- 13.Farsang E, Murisier A, Horváth K, Beck A, Kormany R, Guillarme D, Fekete S. Tuning selectivity in cation-exchange chromatography applied for monoclonal antibody separations, part 1: alternative mobile phases and fine tuning of the separation. J Pharm Biomed Anal. 2019;168:138–47. doi: 10.1016/j.jpba.2019.02.024. [DOI] [PubMed] [Google Scholar]
- 14.Cao M, Mulagapati SHR, Vemulapalli B, Wang J, Saveliev SV, Urh M, Hunter A, Liu D. Characterization and quantification of succinimide using peptide mapping under low-pH conditions and hydrophobic interaction chromatography. Anal Biochem. 2019;566:151–59. doi: 10.1016/j.ab.2018.11.021. [DOI] [PubMed] [Google Scholar]
- 15.King C, Patel R, Ponniah G, Nowak C, Neill A, Gu Z, Liu H. Characterization of recombinant monoclonal antibody variants detected by hydrophobic interaction chromatography and imaged capillary isoelectric focusing electrophoresis. J Chromatogr B Analyt Technol Biomed Life Sci. 2018;1085:96–103. doi: 10.1016/j.jchromb.2018.03.049. [DOI] [PubMed] [Google Scholar]
- 16.Goyon A, Beck A, Veuthey JL, Guillarme D, Fekete S. Comprehensive study on the effects of sodium and potassium additives in size exclusion chromatographic separations of protein biopharmaceuticals. J Pharm Biomed Anal. 2017;144:242–51. doi: 10.1016/j.jpba.2016.09.031. [DOI] [PubMed] [Google Scholar]
- 17.Liu H, Gaza-Bulseco G, Chumsae C. Analysis of reduced monoclonal antibodies using size exclusion chromatography coupled with mass spectrometry. J Am Soc Mass Spectrom. 2009;20:2258–64. doi: 10.1016/j.jasms.2009.08.015. [DOI] [PubMed] [Google Scholar]
- 18.Ouyang Y, Zeng Y, Yi L, Tang H, Li D, Linhardt RJ, Zhang Z. Qualitative and quantitative analysis of heparin and low molecular weight heparins using size exclusion chromatography with multiple angle laser scattering/refractive index and inductively coupled plasma/mass spectrometry detectors. J Chromatogr A. 2017;1522:56–61. doi: 10.1016/j.chroma.2017.09.040. [DOI] [PubMed] [Google Scholar]
- 19.Trappe A, Fussl F, Carillo S, Zaborowska I, Meleady P, Bones J. Rapid charge variant analysis of monoclonal antibodies to support lead candidate biopharmaceutical development. J Chromatogr B Analyt Technol Biomed Life Sci. 2018;1095:166–76. doi: 10.1016/j.jchromb.2018.07.037. [DOI] [PubMed] [Google Scholar]
- 20.Yan Y, Liu AP, Wang S, Daly TJ, Li N. Ultrasensitive Characterization of Charge Heterogeneity of Therapeutic Monoclonal Antibodies Using Strong Cation Exchange Chromatography Coupled to Native Mass Spectrometry. Anal Chem. 2018;90:13013–20. doi: 10.1021/acs.analchem.8b03773. [DOI] [PubMed] [Google Scholar]
- 21.Bailey AO, Han G, Phung W, Gazis P, Sutton J, Josephs JL, Sandoval W. Charge variant native mass spectrometry benefits mass precision and dynamic range of monoclonal antibody intact mass analysis. MAbs. 2018;10:1214–25. doi: 10.1080/19420862.2018.1521131. [DOI] [PMC free article] [PubMed] [Google Scholar]
- 22.Harris RJ, Kabakoff B, Macchi FD, Shen FJ, Kwong M, Andya JD, Shire SJ, Bjork N, Totpal K, Chen AB. Identification of multiple sources of charge heterogeneity in a recombinant antibody. J Chromatogr B Biomed Sci Appl. 2001;752:233–45. [DOI] [PubMed] [Google Scholar]
- 23.Jian W, Kang L, Burton L, Weng N. A workflow for absolute quantitation of large therapeutic proteins in biological samples at intact level using LC-HRMS. Bioanalysis. 2016;8:1679–91. doi: 10.4155/bio-2016-0096. [DOI] [PubMed] [Google Scholar]
- 24.Berkowitz SA, Engen JR, Mazzeo JR, Jones GB. Analytical tools for characterizing biopharmaceuticals and the implications for biosimilars. Nat Rev Drug Discov. 2012;11:527. doi: 10.1038/nrd3746. [DOI] [PMC free article] [PubMed] [Google Scholar]
- 25.Goetze AM, Schenauer MR, Flynn GC. Assessing monoclonal antibody product quality attribute criticality through clinical studies. mAbs. 2010;2:500–07. doi: 10.4161/mabs.2.5.12897. [DOI] [PMC free article] [PubMed] [Google Scholar]
- 26.Vlasak J, Ionescu R. Heterogeneity of Monoclonal Antibodies Revealed by Charge-Sensitive Methods. Curr Pharm Biotechnol. 2008;9:468–81. doi: 10.2174/138920108786786402. [DOI] [PubMed] [Google Scholar]
- 27.Quan C, Alcala E, Petkovska I, Matthews D, Canova-Davis E, Taticek R, Ma S. A study in glycation of a therapeutic recombinant humanized monoclonal antibody: where it is, how it got there, and how it affects charge-based behavior. Anal Biochem. 2008;373:179–91. doi: 10.1016/j.ab.2007.09.027. [DOI] [PubMed] [Google Scholar]
- 28.Bondarenko PV, Nichols A, Xiao G, Shi RL, Chan PK, Dillon TM, Garces F, Semin DJ, Ricci MS. Identification of critical chemical modifications and paratope mapping by size exclusion chromatography (SEC) of stressed antibody-target complexes. mAbs. 2021. 10.1080/19420862.2021.1887629. [DOI] [PMC free article] [PubMed] [Google Scholar]
- 29.Shi RL, Xiao G, Dillon TM, Ricci MS, Bondarenko PV. Characterization of therapeutic proteins by cation exchange chromatography-mass spectrometry and top-down analysis. mAbs. 2020;12:1739825. doi: 10.1080/19420862.2020.1739825. [DOI] [PMC free article] [PubMed] [Google Scholar]
- 30.Cho H-S, Mason K, Ramyar KX, Stanley AM, Gabelli SB, Denney DW, Leahy DJ. Structure of the extracellular region of HER2 alone and in complex with the Herceptin Fab. Nature. 2003;421:756–60. doi: 10.1038/nature01392. [DOI] [PubMed] [Google Scholar]
- 31.Alt N, Zhang TY, Motchnik P, Taticek R, Quarmby V, Schlothauer T, Beck H, Emrich T, Harris RJ. Determination of critical quality attributes for monoclonal antibodies using quality by design principles. Biologicals. 2016;44:291–305. doi: 10.1016/j.biologicals.2016.06.005. [DOI] [PubMed] [Google Scholar]
- 32.Hudis C, Swanton C, Janjigian YY, Lee R, Sutherland S, Lehman R, Chandarlapaty S, Hamilton N, Gajria D, Knowles J, et al. A phase 1 study evaluating the combination of an allosteric AKT inhibitor (MK-2206) and trastuzumab in patients with HER2-positive solid tumors. Breast Cancer Res. 2013;15:R110. doi: 10.1186/bcr3577. [DOI] [PMC free article] [PubMed] [Google Scholar]
- 33.Baral TN, Chao S-Y, Li S, Tanha J, Arbabi-Ghahroudi M, Zhang J, Wang S. Crystal Structure of a Human Single Domain Antibody Dimer Formed through VH-VH Non-Covalent Interactions. Plos One. 2012;7:e30149. doi: 10.1371/journal.pone.0030149. [DOI] [PMC free article] [PubMed] [Google Scholar]
- 34.Li S, Schmitz KR, Jeffrey PD, Wiltzius JJW, Kussie P, Ferguson KM. Structural basis for inhibition of the epidermal growth factor receptor by cetuximab. Cancer Cell. 2005;7:301–11. doi: 10.1016/j.ccr.2005.03.003. [DOI] [PubMed] [Google Scholar]
- 35.Rehder DS, Chelius D, McAuley A, Dillon TM, Xiao G, Crouse-Zeineddini J, Vardanyan L, Perico N, Mukku V, Brems DN. Isomerization of a single aspartyl residue of anti-epidermal growth factor receptor immunoglobulin gamma2 antibody highlights the role avidity plays in antibody activity. Biochemistry. 2008;47:2518–30. doi: 10.1021/bi7018223. [DOI] [PubMed] [Google Scholar]
- 36.Pollastrini J, Dillon TM, Bondarenko P, Chou RYT. Field flow fractionation for assessing neonatal Fc receptor and Fcγ receptor binding to monoclonal antibodies in solution. Anal Biochem. 2011;414:88–98. doi: 10.1016/j.ab.2011.03.001. [DOI] [PubMed] [Google Scholar]
- 37.Chevreux G, Tilly N, Bihoreau N. Fast analysis of recombinant monoclonal antibodies using IdeS proteolytic digestion and electrospray mass spectrometry. Anal Biochem. 2011;415:212–14. doi: 10.1016/j.ab.2011.04.030. [DOI] [PubMed] [Google Scholar]
- 38.Ye H. Simultaneous determination of protein aggregation, degradation, and absolute molecular weight by size exclusion chromatography-multiangle laser light scattering. Anal Biochem. 2006;356:76–85. doi: 10.1016/j.ab.2006.05.025. [DOI] [PubMed] [Google Scholar]
- 39.Rudnick SI, Lou J, Shaller CC, Tang Y, Klein-Szanto AJ, Weiner LM, Marks JD, Adams GP. Influence of affinity and antigen internalization on the uptake and penetration of Anti-HER2 antibodies in solid tumors. Cancer Res. 2011;71:2250–59. doi: 10.1158/0008-5472.CAN-10-2277. [DOI] [PMC free article] [PubMed] [Google Scholar]
- 40.Ishii-Watabe A, Kuwabara T. Biosimilarity assessment of biosimilar therapeutic monoclonal antibodies. Drug Metab Pharmacokinet. 2019;34:64–70. doi: 10.1016/j.dmpk.2018.11.004. [DOI] [PubMed] [Google Scholar]
- 41.Lakayan D, Haselberg R, Gahoual R, Somsen GW, Kool J. Affinity profiling of monoclonal antibody and antibody-drug-conjugate preparations by coupled liquid chromatography-surface plasmon resonance biosensing. Anal Bioanal Chem. 2018;410:7837–48. doi: 10.1007/s00216-018-1414-y. [DOI] [PMC free article] [PubMed] [Google Scholar]
- 42.Tsuchida D, Yamazaki K, Akashi S. Comprehensive Characterization of Relationship Between Higher-Order Structure and FcRn Binding Affinity of Stress-Exposed Monoclonal Antibodies. Pharm Res. 2016;33:994–1002. doi: 10.1007/s11095-015-1845-5. [DOI] [PubMed] [Google Scholar]
- 43.Wu JT, Astill ME, Zhang P. Detection of the extracellular domain of c-erbB-2 oncoprotein in sera from patients with various carcinomas: correlation with tumor markers. J Clin Lab Anal. 1993;7:31–40. doi: 10.1002/jcla.1860070107. [DOI] [PubMed] [Google Scholar]
- 44.Eigenbrot C, Ultsch M, Dubnovitsky A, Abrahmsen L, Hard T. Structural basis for high-affinity HER2 receptor binding by an engineered protein. Proc Natl Acad Sci U S A. 2010;107:15039–44. doi: 10.1073/pnas.1005025107. [DOI] [PMC free article] [PubMed] [Google Scholar]
- 45.Nilvebrant J, Astrand M, Georgieva-Kotseva M, Bjornmalm M, Lofblom J, Hober S. Engineering of bispecific affinity proteins with high affinity for ERBB2 and adaptable binding to albumin. PLoS One. 2014;9:e103094. doi: 10.1371/journal.pone.0103094. [DOI] [PMC free article] [PubMed] [Google Scholar]
- 46.Bostrom J, Haber L, Koenig P, Kelley RF, Fuh G. High affinity antigen recognition of the dual specific variants of herceptin is entropy-driven in spite of structural plasticity. PLoS One. 2011;6:e17887. doi: 10.1371/journal.pone.0017887. [DOI] [PMC free article] [PubMed] [Google Scholar]
- 47.Thurber GM, Schmidt MM, Wittrup KD. Antibody tumor penetration: transport opposed by systemic and antigen-mediated clearance. Adv Drug Deliv Rev. 2008;60:1421–34. doi: 10.1016/j.addr.2008.04.012. [DOI] [PMC free article] [PubMed] [Google Scholar]
- 48.Pollock NI, Grandis JR. HER2 as a therapeutic target in head and neck squamous cell carcinoma. Clin Cancer Res. 2015;21:526–33. doi: 10.1158/1078-0432.CCR-14-1432. [DOI] [PMC free article] [PubMed] [Google Scholar]
- 49.Richard S, Selle F, Lotz JP, Khalil A, Gligorov J, Soares DG. Pertuzumab and trastuzumab: the rationale way to synergy. An Acad Bras Cienc. 2016;88(Suppl 1):565–77. doi: 10.1590/0001-3765201620150178. [DOI] [PubMed] [Google Scholar]
- 50.Hudis CA. Trastuzumab — mechanism of Action and Use in Clinical Practice. N Eng J Med. 2007;357:39–51. doi: 10.1056/NEJMra043186. [DOI] [PubMed] [Google Scholar]
- 51.Tusher VG, Tibshirani R, Chu G.. Significance analysis of microarrays applied to the ionizing radiation response. Proc Natl Acad Sci USA. 2001;98:5116. doi: 10.1073/pnas.091062498 [DOI] [PMC free article] [PubMed] [Google Scholar]
- 52.Storey JD, Tibshirani R.. Statistical significance for genomewide studies. Proc Natl Acad Sci U S A. 2003;100:9440. doi: 10.1073/pnas.1530509100 [DOI] [PMC free article] [PubMed] [Google Scholar]
- 53.Takamoto K, Chance MR. Radiolytic Protein Footprinting With Mass Spectrometry To Probe The Structure Of Macromolecular Complexes. Annu Rev Biophys Biomol Struct. 2006;35:251–76. doi: 10.1146/annurev.biophys.35.040405.102050. [DOI] [PubMed] [Google Scholar]
- 54.Xu G, Chance MR. Hydroxyl Radical-Mediated Modification of Proteins as Probes for Structural Proteomics. Chem Rev. 2007;107:3514–43. doi: 10.1021/cr0682047. [DOI] [PubMed] [Google Scholar]
- 55.Xu G, Chance MR. Radiolytic Modification and Reactivity of Amino Acid Residues Serving as Structural Probes for Protein Footprinting. Anal Chem. 2005;77:4549–55. [DOI] [PubMed] [Google Scholar]
- 56.Maleknia SD, Brenowitz M, Chance MR. Millisecond Radiolytic Modification of Peptides by Synchrotron X-rays Identified by Mass Spectrometry. Anal Chem. 1999;71:3965–73. doi: 10.1021/ac990500e. [DOI] [PubMed] [Google Scholar]
- 57.Li J, Chen G. The use of fast photochemical oxidation of proteins coupled with mass spectrometry in protein therapeutics discovery and development. Drug Discov Today. 2019;24:829–34. doi: 10.1016/j.drudis.2018.12.008. [DOI] [PubMed] [Google Scholar]
- 58.Shi L, Gross ML. Fast Photochemical Oxidation of Proteins Coupled with Mass Spectrometry. Protein Pept Lett. 2019;26:27–34. doi: 10.2174/0929866526666181128124554. [DOI] [PMC free article] [PubMed] [Google Scholar]
- 59.Li KS, Shi L, Gross ML. Mass Spectrometry-Based Fast Photochemical Oxidation of Proteins (FPOP) for Higher Order Structure Characterization. Acc Chem Res. 2018;51:736–44. doi: 10.1021/acs.accounts.7b00593. [DOI] [PMC free article] [PubMed] [Google Scholar]
- 60.Johnson DT, Di Stefano LH, Jones LM. Fast photochemical oxidation of proteins(FPOP): a powerful mass spectrometry based structural proteomics tool. J Biol Chem. 2019;10:1074. doi: 10.1074/jbc.REV119.006218. [DOI] [PMC free article] [PubMed] [Google Scholar]
- 61.Ren D, Pipes GD, Liu D, Shih LY, Nichols AC, Treuheit MJ, Brems DN, Bondarenko PV. An improved trypsin digestion method minimizes digestion-induced modifications on proteins. Anal Biochem. 2009;392:12–21. doi: 10.1016/j.ab.2009.05.018. [DOI] [PubMed] [Google Scholar]
- 62.Zhang Z. Large-scale identification and quantification of covalent modifications in therapeutic proteins. Anal Chem. 2009;81:8354–64. doi: 10.1021/ac901193n. [DOI] [PubMed] [Google Scholar]
Associated Data
This section collects any data citations, data availability statements, or supplementary materials included in this article.


