Abstract
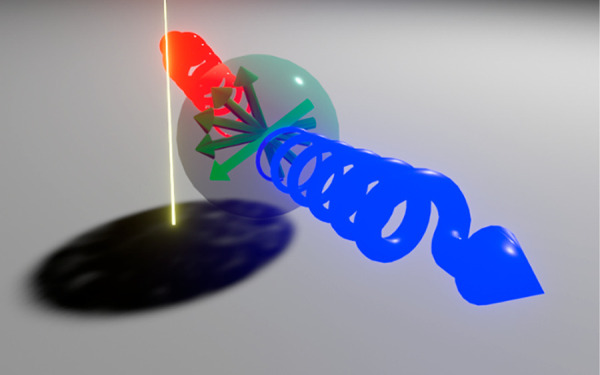
Circularly polarized light (CPL) is currently receiving much attention as a key ingredient for next-generation information technologies, such as quantum communication and encryption. CPL photon generation used in those applications is commonly realized by coupling achiral optical quantum emitters to chiral nanoantennas. Here, we explore a different strategy consisting in exciting a nanosphere—the ultimate symmetric structure—to produce CPL emission along an arbitrary direction. Specifically, we demonstrate chiral emission from a silicon nanosphere induced by an electron beam based on two different strategies: either shifting the relative phase of degenerate orthogonal dipole modes or interfering electric and magnetic modes. We prove these concepts both theoretically and experimentally by visualizing the phase and polarization using a fully polarimetric four-dimensional cathodoluminescence method. Besides their fundamental interest, our results support the use of free-electron-induced light emission from spherically symmetric systems as a versatile platform for the generation of chiral light with on-demand control over the phase and degree of polarization.
Keywords: chirality, cathodoluminescence, scanning transmission electron microscopy, phase mapping, optical nanoantenna
Circularly polarized light (CPL) has been identified as a key ingredient for next-generation information technologies, such as quantum communication1,2 and encryption.3,4 CPL, classified by its parity as having right- or left-handed circular polarization (RCP, LCP), can be utilized as a digital signal carrier.5,6 Compared to linearly polarized light, which can convey polarization information in an analog manner, CPL provides a more robust platform for information transfer that has been adopted even in biological systems.7,8 However, light sources used in quantum circuits, such as single-photon generators, consist of linear optical dipoles typically hosted on molecules, atomic defects, or few-nanometer quantum dots, which are not capable of encoding CPL information unless one involves momentum transfer to electron spins under high magnetic field and low temperature.5 A routinely used way to efficiently generate CPL from atomic-scale emitters consists in coupling them to chiral nanoantennas.9−11 This strategy allows using any light source without chirality to generate CPL. Various chiral optical nanoantennas have been proposed, which include three-dimensionally sculpted plasmonic nanostructures with chiral structural symmetry, typically shaped as helical structures12 inspired by radio frequency antennas, or multiple nanoparticles stuck in layers to support collective geometrical chirality.13−15 Instead of using such intrinsically chiral structures, chiral emission from two-dimensional achiral shapes,16−18 such as a rectangle and an ellipse, has recently been reported in which chiral emission is obtained by breaking mirror symmetry through external factors, such as localized excitation and detection. This is the so-called extrinsic chirality, which is associated with an externally broken symmetry.10 Achiral nanoantennas present the advantages of being equally responsive to both CPL polarizations yet offering some selectivity through the local field and providing an efficient solution as CPL light emitters and receivers.19 Spherical nanoparticles, which constitute ultimate examples of symmetric structures, work as omnidirectional antennas, but of course without intrinsic chirality. Although a spherical structure has never been used as a CPL light source, chiral emission from a spherical nanoantenna can be obtained through extrinsic chirality supported by breaking the symmetry of the whole excitation and measurement system. In general, CPL generation can be ascribed to the interference between two orthogonal linear dipoles with a relative phase difference. In previous studies of rectangular or elliptical achiral nanoantennas,16−18 two orthogonal linear dipoles with different resonance energies are utilized to produce a relative phase difference.16−18 However, the dipole modes of a sphere are degenerate, and the phase difference must be generated through a properly designed excitation.20 Electron beams provide a versatile way of exciting optical modes with high spatial resolution that has been extensively used to investigate the optical response of different structures from the resulting cathodoluminescence (CL) emission.21−25 This approach thus presents potential advantages for the on-demand generation of CPL, which has not been exploited so far.
Here, we propose two possible schemes to generate CPL from a sphere induced by electron beams. The first approach consists in shifting the phase of orthogonal degenerate modes26,27 as schematically illustrated in Figure 1a,c. In a second approach, we rely on two modes with different resonance energies, and more precisely, the electric and magnetic dipoles supported by the dielectric nanosphere, which can generate CPL through mutual interference, as depicted in Figure 1b,d.
Figure 1.
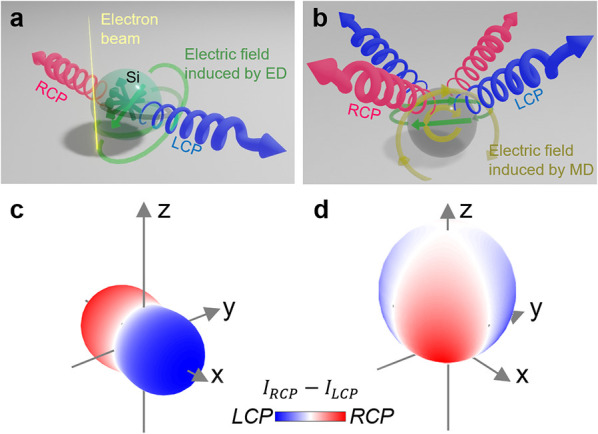
Illustration of CPL emitted from a spherical dielectric particle. Conceptual diagrams of CPL generated (a) by a perpendicular (along the z axis) electric dipole (pED) and an in-plane (in the x–y plane) electric dipole (iED) with different phases excited through a swift electron; and (b) by interfering iED and iMD (in-plane magnetic dipole) modes. (c, d) CPL handedness projected on the radiation patterns of two interfering orthogonal linear dipoles of the same magnitude with different relative phases: (c) iED + pED with a phase shift of π/2 and (d) iED + iMD with a phase shift of π/4.
Knowledge about the nanoscopic field distribution and the relative phase of excitation modes is essential to design achiral nanoantennas. In order to access the field distribution inside the structure, which is especially important for dielectric antennas, and detect chiral emission, scanning transmission electron microscopy (STEM) with CL28 is an ideal choice because no other currently available nano-optical measurement techniques satisfy that requirement; in particular, scanning near-field optical microscopy (SNOM)29 cannot probe the internal field, while electron energy loss spectroscopy (EELS) has no chiral detection capabilities. Indeed, we have previously shown that STEM-CL can visualize the interference of emitted light.30,31 In this work, we demonstrate chiral emission from a Si nanosphere using STEM-CL by visualizing the nanoscopic relative phase distribution of the chiral excitation state. In order to do so, we have developed a four-dimensional (4D) STEM-CL technique capable of rendering angle- and energy-resolved field mapping simultaneously in all angles and energies with full polarimetry (Figure 2). We further validate the experimental results through rigorous CL calculations based on an analytical multipole decomposition (AMD) method.
Figure 2.
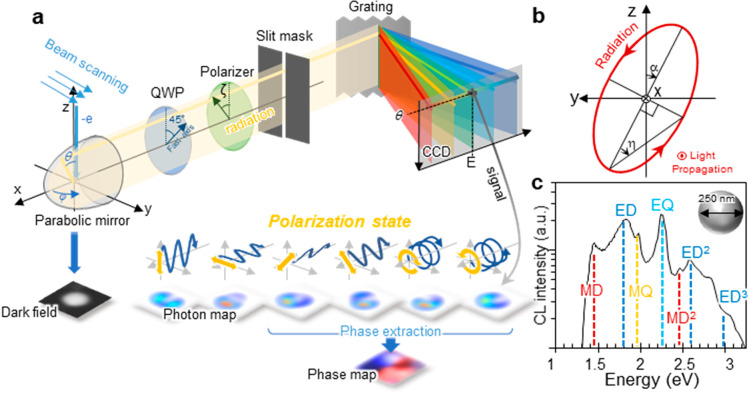
(a) Schematic illustration of the 4D STEM-CL setup and diagrams of phase extraction. (b) Definition of the ellipticity angle η and the orientation angle α. (c) Experimentally observed CL spectrum from a 250 nm Si sphere without polarization selection, obtained by integrating the signal over the emission angle range θ = 0–180° and averaging over all electron beam positions on the sample. Mode types in the spectral features are indicated by labels: MD (magnetic dipole), ED (electric dipole), MQ (magnetic quadrupole), and EQ (electric quadrupole). The superscript denotes the radial order.
Results and Discussion
4D STEM-Cathodoluminescence
Since the CL signal is
proportional to the projection of the radiative component of the electromagnetic
local density of states along the trajectory of the electron beam,26,32 the detected CL signal from a sphere corresponds to a superposition
of multiple modes that can be selectively observed by resolving the
detection angle.33 The 4D STEM-CL setup
that we use in this study allows imaging with simultaneous acquisition
of the angular distribution and spectrum at each beam position (corresponding
to 51 (angle) × 256 (energy) images), as described in Figure 2a. The CL signal
collimated by a parabolic mirror accommodated in the STEM column is
collected by the 2D CCD elements of a spectrometer. By inserting a
slit mask in the light path, the radiation in the azimuthal angle
is selected with φ = 0° and is transferred through the
optical system to the CCD with information on the θ-angle dependence
preserved along the vertical axis, while information on photon energy
is obtained through horizontal dispersion using a grating. The resulting
2D angle-energy information is thus acquired while raster-scanning
the electron beam in 2D space, leading to 4D (1D angle, 1D energy,
and 2D space) CL measurements (see more details on our apparatus in
the Methods). To observe CPL from a Si sphere
by electron beam excitation we performed fully polarimetric imaging
and obtained CL maps with six polarization configurations for the
Stokes parameter calculation. The circular polarization state (RCP
or LCP) is selected by a polarizer and a quarter-wave plate (QWP).
The polarization angle ζ is defined from the vertical axis,
as shown in Figure 2a. In what follows, p- and s-polarizations
denote ζ = 0° and ζ = 90°, respectively. The
Stokes parameters (S0–3) can be
obtained from the intensities of the linearly polarized signal Iζ (polarization angle
ζ) and circularly polarized signals IRCP and ILCP as S0 = Inon = Is + Ip, S1 = Is – Ip = Inonp cos
2α cos 2η, S2 = I45° – I–45° = Inonp sin 2α
cos 2η = 2IsIp cos δ, S3 = IRCP – ILCP = Inonp sin 2η = 2IsIp sin δ,
and  . Here, we introduce the ellipticity angle
η and orientation angle α as defined in Figure 2b. The ellipticity angle η
ranges from −π/4 to π/4 and is defined such that
positive and negative values correspond to RCP and LCP, respectively.
We also investigate the phase difference δ between the horizontal
and vertical emitted electric field, which can be calculated as δ
= arg(S3/S2). Figure 2c shows
the experimentally obtained spectrum of a 250 nm Si sphere without
polarization. The CL signal is integrated over the detection angle
θ = 0–180° and spatially integrated over the Si
sphere to include all excited modes. The observed resonance peaks
are identified by comparison with AMD theory (see details in the Methods and Supporting Information) and are labeled as magnetic dipole (MD), magnetic quadrupole (MQ),
electric dipole (ED), and electric quadrupole (EQ). Dielectric particles
can accommodate multiple field nodes in the radial direction inside
the particle with the same symmetry in the angular direction, which
we refer to as high-radial-order modes.27 We indicate radial orders by superscripts (e.g., ED2 for
the second-order electric dipole).
CPL Emission and Phase Mapping of Interfering Degenerate Electric Dipoles
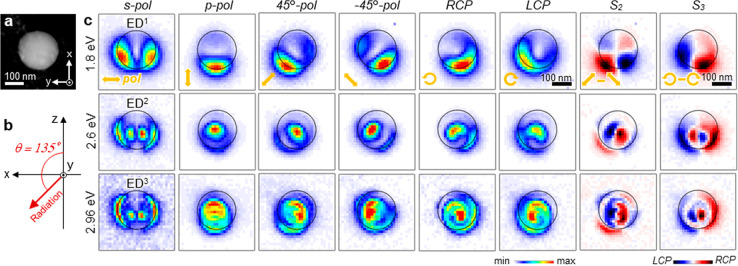
The 4D STEM-CL technique enables visualizing photon map stacks fully resolved in angle and energy (see examples in Figures S4–S6). In this section, we focus on CPL generation from EDs. We denote the in-plane ED with orbital momentum numbers (l, m) = (1, ± 1) as iED (see a more precise definition of (l, m) in the Supporting Information); these modes present polarization lying on the x–y plane. The perpendicular ED characterized by (l, m) = (1, 0) and denoted pED presents polarization along the z axis. With the electron beam running along the z axis, iED and pED modes are excited with phase mismatch even though they are degenerate;26 we thereby generate CPL emission due to the interference of two orthogonal degenerate EDs, as described in Figure 1. Figure 3 shows the fully polarimetric CL maps acquired from a 250 nm Si sphere for selected photon energies of 1.8, 2.6, and 2.96 eV, corresponding to the resonances ED1, ED2, and ED3, respectively (see Figure 2c and Figure S2a). We chose a detection angle θ = 135° (schematically shown in Figure 3b) as a compromise that fulfills both a sufficient signal intensity and interference of iED and pED. We further describe below the advantage of this detection angle to map the phase. At the photon energy of 1.8 eV for the ED1 mode, the CL maps obtained by selecting linear polarization show clear dipolar hot spots along the polarization direction. The S3 plot, which intuitively indicates the handedness of CPL, shows the generation of CPL, where the parity of CPL is inverted with respect to the x–z plane. This map proves the concept of CPL generation from a sphere controlled by the electron beam as illustrated in Figure 1a. The presented CPL generation implies an effective phase difference of degenerate pED and iED modes excited by a swift electron, which we further discuss below by performing phase mapping. For the higher radial-order ED modes at photon energies of 2.6 eV (ED2) and 2.96 eV (ED3), we observe similar features, except that they show double- and triple-layered dipole patterns with parity inversion also along the radial direction.
Figure 3.
CL maps of interfering iED and pED modes. (a) STEM dark-field image of the probed Si nanosphere with a diameter of 250 nm (same particle as in Figure 2c). (b) Schematic illustration of the detection configuration. The CL signal is integrated over photon energy within a ± 0.1 eV interval at a detection angle θ = 135°. (c) Photon maps obtained for selected polarization angles ζ = 90° (s-pol), 0° (p-pol), 45°, −45°, RCP, and LCP, along with the Stokes parameter S2 and S3 at photon energies of 1.8 eV (ED1), 2.6 eV (ED2), and 2.96 eV (ED3). The edge of the Si nanosphere is indicated by black circles. The direction of polarization is schematically shown by yellow arrows in each panel. The emitted light is propagating normal to the image from the back side (see coordinate axes in (a) and (b)).
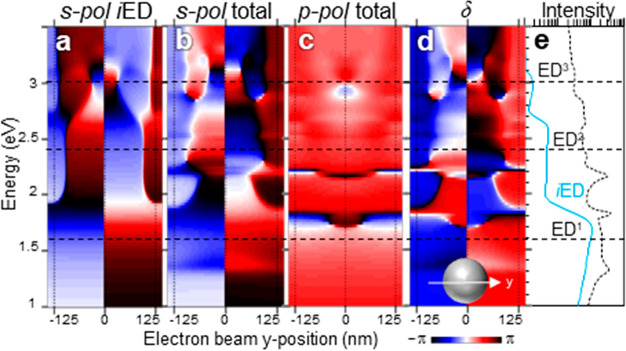
Since CPL generation is based on off-phase interference of two orthogonal fields, it is essential to determine the relative phase of the involved orthogonal modes. From the fully polarimetric data set shown in Figure 3, one can quantitatively extract the relative phase of the two orthogonally polarized fields. Before discussing experimental phase measurements, we perform an analytical calculation to show that the p-polarized light actually works as a reference for mapping the phase of the in-plane modes at the detection angle θ = 135°. We follow an analytical multipole decomposition (AMD) approach based on previously described methods to calculate the CL emission from homogeneous spheres21,26 now extended to include electron trajectories penetrating the particle (see full details in the Supporting Information). Our theory allows us to calculate the complex field emission amplitude decomposed in the contributions coming each and all of the individual electric and magnetic modes labeled by orbital numbers (l, m) and the radial order. In Figure 4a–c, we show calculated line profiles of the phase of the polarization-projected emission amplitude for an electron moving along the z direction and its position scanned along the y axis across the center of a 250 nm Si sphere. As in the experiment, we fix the detection angle at θ = 135° (Figure 3b). For comparison, the space- and angle-integrated spectra of the iED contribution and the contribution from all modes are shown in Figure 4e. Note that the calculated spectra are slightly blue-shifted compared to experiment, presumably due to slight differences in size or dielectric constant (we use literature values in our calculations34). The phase patterns for s-polarization (Figure 4a,b) exhibit phase inversions when y moves from negative to positive values. For instance, around the iED1 mode resonance, the phase is constantly negative for y < 0 and positive for y > 0, indicating a specific selection of iED modes when measuring light polarized along the y axis (y-iED). Around the energies of ED2 and ED3 modes, the sign of the phase is flipped multiple times along the radial direction, thus evidencing the corresponding nodes of each mode. Even when including all the electric and magnetic modes (Figure 4b), the phase pattern shows dominant contributions from projected y-iED modes around their resonances, thus yielding similar features as in Figure 4a. In contrast, the phase of the total field resolved when measuring p-polarization is almost constant over energy and space, as shown in Figure 4c (see more details in the Supporting Information). This constant phase can work as a reference for phase measurements. We thus conclude that the relative phase measurement of δ should correspond to the phase of the s-polarization light amplitude for in-plane modes. Indeed, the calculated relative phase pattern in Figure 4d corresponds well with the features of the s-polarized signal phase.
Figure 4.
Spectral line profiles of the emission phase calculated from AMD theory. (a–c) Calculated line profiles of the radiation phase of (a) the electric field extracted only from iEDs modes with s-polarization, (b) the total electric field with s-polarization (in-plane mode), (c) the total electric field with p-polarization, and (d) the relative phase δ. The electron beam is scanned across the center of a 250 nm Si nanoparticle along the y direction. The detection angle is set to θ = 135°. The black vertical dotted lines at y positions of −125, +125, and 0 nm indicate the edges and the center of the sphere. (e) Integrated spectra of all modes (dashed curve) and partial contribution of iED modes (light blue curve) plotted in semilog scale. The energies of EDn modes, which correspond to the mapping in Figure 6, are indicated by horizontal dashed lines across all panels.
Based on the theoretical result that the phase of the p-polarized signal can be used as a nearly uniform reference, we experimentally perform relative phase mapping. Figure 5 shows the maps of the relative phase difference δ, ellipticity angle η, and orientation angle α using the CL results of Figure 3c (see the Methods for details of the calculation procedure). For comparison, we also simulated the corresponding phase mapping by AMD calculations, which are shown in Figure 6. The experimental δ maps of Figure 5a show the relative phase difference of y-iEDs with respect to the p-polarized radiation, which is the reference at this detection angle, as we have discussed above. At the photon energy of the ED1 mode (1.8 eV), the sign of the phase is inverted with respect to the x–z plane, as shown schematically in Figure 5b. For ED1, the phase distribution is not constant in the x direction due to the influence of iED modes projected along the x axis (x-iED), as demonstrated in the calculated phase of p-polarized components shown in Figure 6a. The calculated δ map in Figure 6 also shows the corresponding phase modulation along the x axis, which reproduces well the experimental result. At photon energies of 2.6 eV (ED2) and 2.96 eV (ED3), the experimental δ maps (Figure 5a) of the higher radial-order modes neatly show the phase flips between adjacent dipole layers depending on the number of poles of the iED modes inside the sphere illustrated in Figure 5b. Also, for these higher ED modes, there is a slight phase modulation along the x axis, which can be confirmed by the calculated phase maps in Figure 6b,c. For instance, at the energy of the ED3 mode, the δ value changes from −π/2 (blue) through 0 (white) to −π/2 (blue), starting from the center to the y positive direction (leftwards), without reaching the positive value of π/2 (red), unlike the perfect phase inversion illustrated in panel b (and vice versa for the right-hand side of red, black, and then red contrasts without reaching blue). This discrepancy from the ideal phase mapping illustrated in panel b is due to the intervention of higher-order multipoles (l > 2). The calculated relative phase δ reproduces the experimental result, including the aforementioned zero phase in the second layer, as shown in the line profile in Figure 4d and the δ map in Figure 6. Due to the influence of x-iEDs (p-pol), δ signals slightly deviate from those of pure y-iEDs (s-pol). In addition to the investigation of the phase difference δ, fully polarimetric mapping can show the experimental distribution of the ellipticity angle η and rotation angle α. The resulting ellipticity maps can reveal the presence of CPL in the emission. Upon inspection of the η maps, we conclude that almost full CPL (η = ±π/4) can be achieved at the antinodes. We can thus attribute the generation CPL to ED modes thanks to our photon mapping and relative-phase-extraction analyses.
Figure 5.
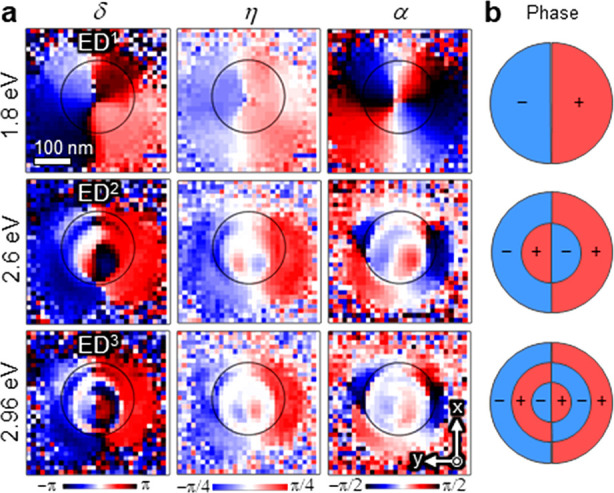
Phase mapping of ED modes in the same Si sphere as in Figure 3. (a) Maps showing the relative phase δ, the ellipticity η, and the optical rotation α at a detection angle θ = 135° for photon energies of 1.8 eV (ED1), 2.6 eV (ED2), and 3.0 eV (ED3), respectively. The phase δ, obtained from the corresponding photon maps of Figure 3, is referred to the p-polarization component. (b) Schematic illustration of the phase sign in the corresponding electric dipole modes.
Figure 6.
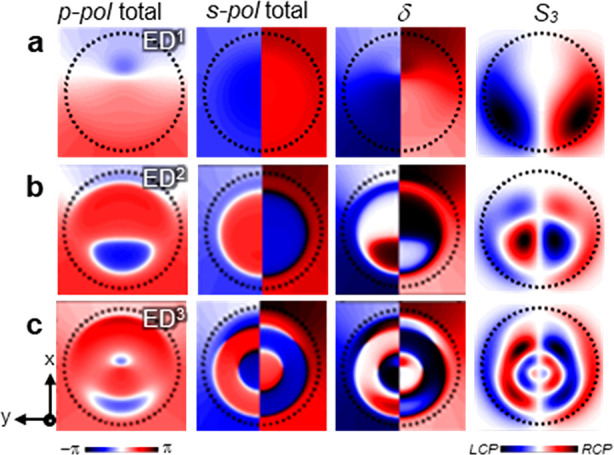
Simulated phase maps of a 250 nm Si nanosphere with a detection angle θ = 135°. (a–c) ED1, ED2, and ED3 modes at photon energies of 1.6, 2.4, and 3.0 eV, respectively. The first and second columns from the left show the phase maps for p- and s-polarizations including all modes. The third and fourth columns display δ (the phase difference between s- and p-polarization CL emission components) and the Stokes parameter S3. The edge of the sphere is indicated by a dashed circle in each panel.
Angular Spectral Patterns of CPL Emission
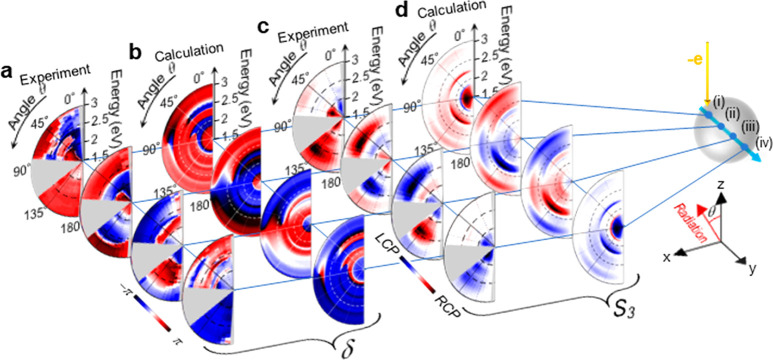
We have so far discussed the spatial distribution of CPL generation and the relative phase depending on the electron beam position. Since the angle of detection relative to the electron beam is another symmetry-breaking factor for CPL generation, the analysis of the angle-resolved emission amplitude including its phase can be important to gain control over CPL generation. We here investigate the angular dependence of CPL generation, which we can simultaneously perform with 2D spatial mapping of the same particle (Figure 3–5) using the 4D STEM-CL method. The angular distribution maps of the Stokes parameter S3 and the phase difference δ are extracted for detection angles in the θ = 0–180° range at four representative positions along the y direction across the center of the sphere (Figure 7). Gray masks overlay unobservable regions caused by specimen-shadowing (θ = 90°) and the holes in the parabolic mirror around θ = 0 and 180° through which the electron beam passes. For comparison, we show calculated angular spectral patterns using AMD theory. The sampling positions (i)–(iv) correspond to hotspots of iED2 modes. The phase difference δ, shown in Figure 7a, varies depending on emission angle, photon energy, and excitation location in (i)–(iv); this dependence is also neatly reproduced by the simulation presented in Figure 7b. The experimentally measured δ values are somewhat noisy around θ = 0–90° at higher energies (>2.0 eV) for edge-grazing excitations (i) and (iv) because the radiation amplitude is weak. This can be understood from the patterns S3 (panels c and d), which include the actual CPL amplitude with S3 = 2IpIs sin δ. Indeed, in the S3 radiation patterns (Figure 7c) at positions (i) and (iv) the CPL emission is stronger in the downward direction, except at low emission energies (< 2.0 eV). Interestingly, the observed parity is mostly the same for all the directions and photon energies at the edge. In contrast, the CPL strength and parity with excitation at the inner positions (ii) and (iii) (Figure 7c,d) dramatically vary depending on the photon emission angle and energy; at photon energies in the 2.0–2.6 eV and θ = 0–90° range, the chiral emission has strong intensity depletions, while at higher photon energies of 2.6–3.0 eV strong CPL emission is observed. These trends are neatly reproduced by the AMD theory, as shown in Figure 7d. In a more detailed analysis presented in the Supporting Information, the directionality of the CPL radiation with excitation at (ii) and (iii) positions is found to be dominantly caused by the contribution of the EQ {(l, m) = (2, 0)} mode. Thus, these results demonstrate tunable CPL generation from a sphere by adjusting the detection angle, the electron beam position, and the photon energy.
Figure 7.
Angular dispersion patterns of chiral emission from the same sphere as in Figure 3. Experimentally measured (a, c) and calculated (b, d) phase differences δ (a, b) and S3 (c, d) at beam-spot positions (i) y = −120 nm, (ii) y = −45 nm, (iii) y = 45 nm, and (iv) y = 120 nm along a scan following the y axis and crossing the center of the sphere (x = 0 nm) as shown in the right inset. Angle ranges inaccessible in our setup are shaded in gray.
CPL Generation by Interfering ED and MD Modes
In this section, we demonstrate CPL generation by relying on the concept of interfering MD and ED modes, as schematically illustrated in Figure 1b,d. This CPL generation scheme can be discerned by the CPL distribution with quadrupolar symmetry around the z axis, which we experimentally visualize here. We choose a slightly smaller particle (170 nm diameter, see Figure 8a) than in the previous discussion in order to have the full profile of the low energy MD1 mode within the measurable range (see Figure 8c). When observing a rotationally symmetric structure around the z axis, such as the present sphere, rotating the detection angle φ with the excitation electron beam position at a certain radial distance r from the z axis is equivalent to rotating the electron beam with that radius r around the z axis for fixed detection angle φ (see details in the Supporting Information). Therefore, the information contained in the angular radiation pattern as a function of φ can be obtained by analyzing the photon maps. Figure 8 shows photon maps of the Stokes parameter, the phase, and the polarization state parameters observed at a polar detection angle of θ = 10° for a measured photon energy of 2.18 eV, which lies between the MD and ED resonances (see Figure 8c). We choose the polar angle θ = 10° because radiation at θ = 0° has no chirality, as described in Figure 1b,d (i.e., the electric fields of iMD1 and iED1 modes are parallel), and also because the pED1 mode has stronger emission as the angle θ approaches 90°. The S3 plot in Figure 8d exhibits four hotspots at the sphere edge with mirrored parities against the x−z and y–z planes. Now we extract the φ directional angular plots by scanning the excitation beam position along a circle of radius r = 78 nm around the center of the sphere. We find that grazing electron beam excitation (e.g., near the edge of the sphere) is efficient to excite the iED and iMD modes dominantly. The obtained polar plot of S3 is shown in Figure 8e. The quadrupolar symmetric pattern is clearly discernible for polar angles θ < 30°, as anticipated in Figure 1d. We note that the CPL radiation of the first scheme (Figure 1a,c) becomes dominant at θ > 30° because the pED mode has stronger emission. This quadrupolar-symmetry pattern of CPL generation clearly demonstrates interference of magnetic and electric modes. Finally, we also note that this second strategy with interfering ED and MD modes should work with excitation by linearly polarized plane waves.
Figure 8.
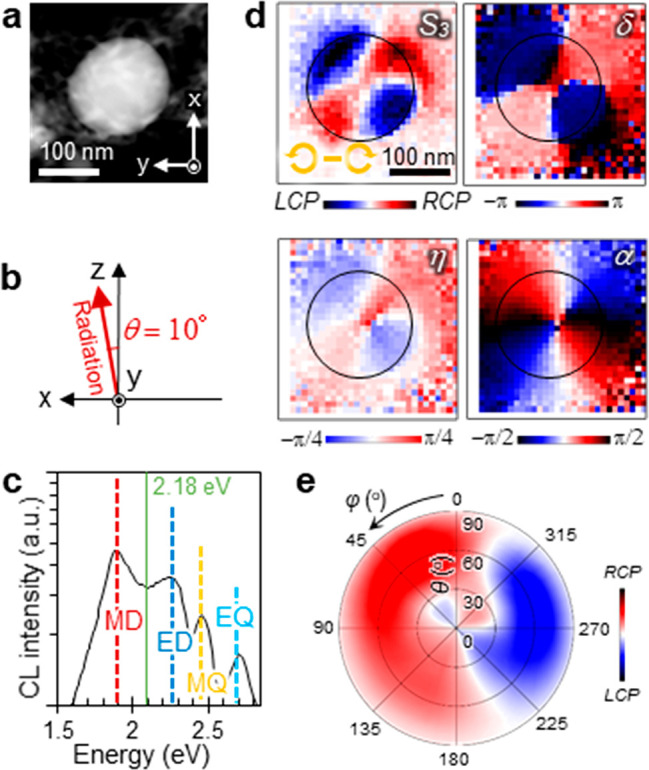
CL maps of interfering ED and MD modes in a 170 nm Si particle. (a) STEM dark-field image of the observed Si nanosphere. (b) Schematic illustration of the detection configuration for the mapping presented in panel d. The CL signal is integrated over a photon energy interval of ±0.1 eV at a detection angle θ = 10°. (c) CL spectrum without polarization selection, as obtained by integrating the signal over the radiation angular emission range θ = 0–180° and averaging over all electron beam positions on the sample. Mode types are indicated by labels in the spectral peaks. (d) Mapping of the Stokes parameter S3, the phase difference δ, the ellipticity η, and the orientation angle α with the detection angle of θ = 10°. The edge of the Si nanosphere is indicated by black circles on each image. (e) S3 angular plot as a function of θ and φ, obtained by rotating the electron beam position around and at a radial distance r = 78 nm with respect to the sphere center for a measured photon energy of 2.18 eV.
Conclusions
The emission of CPL from a dielectric sphere has been realized by following two complementary generation mechanisms, which we have visualized using a fully polarimetric 4D STEM-CL setup. The first strategy consists in interfering degenerate in- and out-of-plane electric dipole modes with different phases controlled by the position of the electron beam. We measured full polarimetry maps and further extracted emission phase maps, clearly visualizing CPL generation from the Si sphere up to full circular polarization (η = ± π/4), depending on electron beam positions. This mapping also revealed the distribution of emitted-light phase associated with the excitation of high-radial-order electric dipole modes even inside the sphere. A rigorous theoretical analysis based on a multipolar decomposition of the emitted optical fields supports this phase mapping approach and shows results in excellent agreement with experiment. The angular and spectroscopic distribution of CPL emission showed that the CPL parity can be fully selected not only by the excitation position but also through the photon emission direction and energy. We further experimentally and theoretically demonstrated a second concept of CPL generation consisting in interfering electric dipole and magnetic dipole modes, showing a characteristic quadrupolar symmetry in the angular profile of the CPL emission. The use of 4D STEM-CL holds great potential for the development of customizable CPL sources, whereby the phase and degree of polarization of the light emission are readily controllable through positioning the electron beam on the sphere. Further customization is expected to be achievable by using other sample morphologies. The versatility of the present approach to generate light with controlled phase and polarization could find application in encoding information on the phase and polarization of emitted photons. Such an electron beam-based device could possibly be realized using the technologies developed for field emission displays.
Methods
Detail of 4D STEM-CL
A modified STEM (JEM-2100F, JEOL, Japan) with a Cs-corrector is used at an acceleration voltage of 80 kV.35 The electron probe current is about 1 nA with a 20 mrad illumination half angle, which results in a 1 nm probe size. These beam conditions are optimized so that we obtain sufficient CL signals without noticeable damage on the samples. An aluminum parabolic mirror is mounted between the pole pieces of the objective lens, so that the sample is exactly on the focal position of the mirror (see Figure 2a). The radiation passing through the vacuum window is polarized by a polarization system consisting of a quarter-wave plate (QWP) and a linear polarizer to resolve circular polarization. The QWP is aligned such that the fast axis is tilted by 45° from the z axis, where RCP is converted into horizontal polarization. A slit mask resolves the emitted light in the φ direction while enabling us to simultaneously collect all angular information in the θ direction. Angular information along the θ direction is dispersed along the vertical axis on the 2D CCD surface by inserting a cylindrical lens in the optical system, which allows focusing the collimated beam in the φ direction while imaging the θ-selected intensity along the vertical axis on the CCD plane. The grating of the spectrometer disperses the photon energy in the horizontal direction of the CCD plane. The chromatic aberration induced by the optical system is corrected by postprocessing the CCD image (see details in the Supporting Information). The photon maps are extracted from the corrected angle- and energy-dispersion patterns.
Normalization of Mapping Intensities for Phase Calculations
Before calculating the Stokes parameters and the relative phases, we corrected the position drift and normalized the intensity of the image at each polarization. The following normalization procedure compensates the intensity unbalance in the 4D STEM setup caused by the optical elements and the asymmetry of the spectrometer. The position of each photon map is adjusted based on the STEM images of the particles acquired simultaneously with the photon maps. The normalization is performed on the basis of two conditions: (i) the integrated intensity over all the mapping area is equal to that of the geometrically symmetric measurement with respect to the x–z plane, namely ∬ I45°d2s = ∬ I–45°d2s and ∬ IRCPd2s = ∬ ILCPd2s; (ii) the sum of the integrated intensity of orthogonal polarizations should be equal to the unpolarized intensity, that is, ∬Isd2s + ∬ Ipd2s = ∬ I45°d2s + ∬ I–45°d2s = ∬ IRCPd2s + ∬ ILCPd2s. These conditions lead to simpler normalization relations of the integrated intensities for ±45° and circular polarizations as ∬ I45°d2s = ∬ I–45°d2s = ∬ IRCPd2s = ∬ ILCPd2s. The phase shift caused by light reflection at the parabolic mirror is subtracted from the measured phase (see details in the Supporting Information).
Fabrication of Si Nanospheres
Si nanospheres are fabricated by femtosecond laser ablation.27 A Si wafer is ablated by a commercial 1 kHz femtosecond laser (Hurricane, Spectra Physics) with 1 mJ, 100 fs pulses at a central wavelength of 800 nm. The laser beam is focused down to 10 μm in diameter. The particles produced by laser irradiation are collected on a TEM grid with an elastic carbon membrane (∼25 nm thickness), which is placed above the ablated Si wafer. To a good approximation, particles acquire a spherical shape due to surface tension during the fabrication process.
Analytical Multipole Decomposition (AMD) Theory
We extend a previously developed formalism for CL emission from a sphere excited by an external electron beam26 in order to include penetrating trajectories. Here, we summarize the resulting expressions, which are derived in detail in the Supporting Information for an electron moving with constant velocity v along a straight-line trajectory parallel to and separated a distance R0 from the z axis, and crossing the x–y plane at a point that forms an azimuthal angle φ0 with respect to the x axis. The sphere of radius a and local, frequency-dependent permittivity ϵ(ω) is taken to be centered at the origin of coordinates. This formalism allows us to write the electric far-field of the emitted light at the position r and time t as E (r,t) = (1/r) ∫(dω/2π) eiωr/c-iωtfCL(Ω,ω), where c is the speed of light in vacuum, Ω is the direction of emission, and
| 1 |
is the angle- and frequency-dependent emission amplitude, decomposed in multipolar modes that are labeled by angular momentum numbers L = (l, m) with symmetry ν = E (electric) and ν = M (magnetic). Also, k = ω/c is the free-space light wave vector. In this expression, we use vector spherical harmonics
defined in terms of spherical harmonics YL(Ω) with  . The scalar coefficients in eq 1 are given by (see detailed derivation
in the Supporting Information)
 |
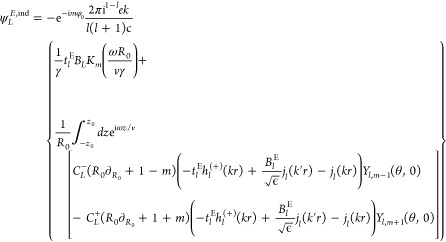 |
in which  , θ = cos–1(z/r), jl and hl(+) are spherical Bessel and Hankel
functions, respectively, and we use the Mie scattering and transmission
coefficients
where ρ0 = ka and  . We further define the electron multipolar
coupling coefficients
 |
where Cl-mm+1/2 are Gegenbauer polynomials evaluated at the argument value c/v.36,37 The CL photon emission probability is readily obtained from the far-field Poynting vector divided by the photon energy ℏω,21,26 which leads to
This quantity is normalized in such a way that the integral over angle and frequency ∫ dΩ ∫0∞dω ΓCL(Ω,ω) yields the total photon emission probability per incident electron. Finally, using the orthogonality of the vector spherical harmonics (see the details in the Supporting Information), we obtain the angle-integrated CL photon emission probability
where the sum runs over electric (ν = E) and magnetic (ν = M) multipoles L = (l, m).
Acknowledgments
We thank Dr. Taka-aki Yano, Dr. Masaki Hada, and Dr. Takuo Tanaka for helping us with the sample fabrication, Mr. Jaewon Shin for improving the CCD image acquisition software, and Dr. Naoki Yamamoto for his valuable advice. The authors acknowledge the financial support from JST PRESTO (JPMJPR17P8), JSPS KAKENHI (20J14821), ERC (advanced grant 789104-eNANO), the Spanish MINECO (MAT2017-88492-R and SEV2015-0522), the Catalan CERCA, and Fundació Privada Cellex. T.M. is grateful for the JSPS Research Fellowship for Young Scientists.
Supporting Information Available
The Supporting Information is available free of charge at https://pubs.acs.org/doi/10.1021/acsnano.0c05624.
Data analysis of angle- and energy-resolved patterns, phase shift caused by the aluminum parabolic mirror, 4D data set of CL maps, analytical multipole decomposition (AMD) method, comparison of AMD calculations of CL spectra and Mie calculations of the optical scattering cross section, simulated phase line profiles, equivalence of beam rotation and detection rotation, angular plots revealing interference of ED and MD modes (PDF)
Author Contributions
The manuscript was written through contributions from all authors. T.M. and T.S. conceived the research, carried out the experiment, and performed the analysis. F.J.G.A. developed the AMD theory and computational tool. All authors have given approval to the final version of the manuscript.
The authors declare no competing financial interest.
Supplementary Material
References
- Wang J.; Yang J. Y.; Fazal I. M.; Ahmed N.; Yan Y.; Huang H.; Ren Y. X.; Yue Y.; Dolinar S.; Tur M.; Willner A. E. Terabit Free-Space Data Transmission Employing Orbital Angular Momentum Multiplexing. Nat. Photonics 2012, 6, 488–496. 10.1038/nphoton.2012.138. [DOI] [Google Scholar]
- Nicolas A.; Veissier L.; Giner L.; Giacobino E.; Maxein D.; Laurat J. A Quantum Memory for Orbital Angular Momentum Photonic Qubits. Nat. Photonics 2014, 8, 234–238. 10.1038/nphoton.2013.355. [DOI] [Google Scholar]
- Li J.; Kamin S.; Zheng G.; Neubrech F.; Zhang S.; Liu N. Addressable Metasurfaces for Dynamic Holography and Optical Information Encryption. Sci. Adv. 2018, 4, eaar6768 10.1126/sciadv.aar6768. [DOI] [PMC free article] [PubMed] [Google Scholar]
- Jin L.; Dong Z. G.; Mei S. T.; Yu Y. F.; Wei Z.; Pan Z. Y.; Rezaei S. D.; Li X. P.; Kuznetsov A. I.; Kivshar Y. S.; Yang J. K. W.; Qiu C. W. Noninterleaved Metasurface for (2(6)-1) Spin- and Wavelength-Encoded Holograms. Nano Lett. 2018, 18, 8016–8024. 10.1021/acs.nanolett.8b04246. [DOI] [PubMed] [Google Scholar]
- Fujita T.; Morimoto K.; Kiyama H.; Allison G.; Larsson M.; Ludwig A.; Valentin S. R.; Wieck A. D.; Oiwa A.; Tarucha S. Angular Momentum Transfer from Photon Polarization to an Electron Spin in a Gate-Defined Quantum Dot. Nat. Commun. 2019, 10, 2991. 10.1038/s41467-019-10939-x. [DOI] [PMC free article] [PubMed] [Google Scholar]
- Asshoff P.; Merz A.; Kalt H.; Hetterich M. A Spintronic Source of Circularly Polarized Single Photons. Appl. Phys. Lett. 2011, 98, 112106. 10.1063/1.3564893. [DOI] [Google Scholar]
- Wynberg H.; Meijer E. W.; Hummelen J. C.; Dekkers H.; Schippers P. H.; Carlson A. D. Circular Polarization Observed in Bioluminescence. Nature 1980, 286, 641–642. 10.1038/286641a0. [DOI] [Google Scholar]
- Gagnon Y. L.; Templin R. M.; How M. J.; Marshall N. J. Circularly Polarized Light as a Communication Signal in Mantis Shrimps. Curr. Biol. 2015, 25, 3074–3078. 10.1016/j.cub.2015.10.047. [DOI] [PubMed] [Google Scholar]
- Garcia-Guirado J.; Svedendahl M.; Puigdollers J.; Quidantt R. Enantiomer-Selective Molecular Sensing Using Racemic Nanoplasmonic Arrays. Nano Lett. 2018, 18, 6279–6285. 10.1021/acs.nanolett.8b02433. [DOI] [PubMed] [Google Scholar]
- Le K. Q.; Hashiyada S.; Kondo M.; Okamoto H. Circularly Polarized Photoluminescence from Achiral Dye Molecules Induced by Plasmonic Two-Dimensional Chiral Nanostructures. J. Phys. Chem. C 2018, 122, 24924–24932. 10.1021/acs.jpcc.8b07297. [DOI] [Google Scholar]
- Kan Y. H.; Andersen S. K. H.; Ding F.; Kumar S.; Zhao C. Y.; Bozhevolnyi S. I. Metasurface-Enabled Generation of Circularly Polarized Single Photons. Adv. Mater. 2020, 32, 1907832. 10.1002/adma.201907832. [DOI] [PubMed] [Google Scholar]
- Gansel J. K.; Thiel M.; Rill M. S.; Decker M.; Bade K.; Saile V.; von Freymann G.; Linden S.; Wegener M. Gold Helix Photonic Metamaterial as Broadband Circular Polarizer. Science 2009, 325, 1513–1515. 10.1126/science.1177031. [DOI] [PubMed] [Google Scholar]
- Hentschel M.; Schaeferling M.; Metzger B.; Giessen H. Plasmonic Diastereomers: Adding up Chiral Centers. Nano Lett. 2013, 13, 600–606. 10.1021/nl3041355. [DOI] [PubMed] [Google Scholar]
- Liu N.; Liu H.; Zhu S.; Giessen H. Stereometamaterials. Nat. Photonics 2009, 3, 157–162. 10.1038/nphoton.2009.4. [DOI] [Google Scholar]
- Decker M.; Ruther M.; Kriegler C. E.; Zhou J.; Soukoulis C. M.; Linden S.; Wegener M. Strong Optical Activity from Twisted-Cross Photonic Metamaterials. Opt. Lett. 2009, 34, 2501–2503. 10.1364/OL.34.002501. [DOI] [PubMed] [Google Scholar]
- Abasahl B.; Dutta-Gupta S.; Santschi C.; Martin O. J. F. Coupling Strength Can Control the Polarization Twist of a Plasmonic Antenna. Nano Lett. 2013, 13, 4575–4579. 10.1021/nl4029363. [DOI] [PubMed] [Google Scholar]
- Plum E.; Liu X. X.; Fedotov V. A.; Chen Y.; Tsai D. P.; Zheludev N. I. Metamaterials: Optical Activity without Chirality. Phys. Rev. Lett. 2009, 102, 113902. 10.1103/PhysRevLett.102.113902. [DOI] [PubMed] [Google Scholar]
- Sersic I.; van de Haar M. A.; Arango F. B.; Koenderink A. F. Ubiquity of Optical Activity in Planar Metamaterial Scatterers. Phys. Rev. Lett. 2012, 108, 223903. 10.1103/PhysRevLett.108.223903. [DOI] [PubMed] [Google Scholar]
- Vazquez-Guardado A.; Chanda D. Superchiral Light Generation on Degenerate Achiral Surfaces. Phys. Rev. Lett. 2018, 120, 137601. 10.1103/PhysRevLett.120.137601. [DOI] [PubMed] [Google Scholar]
- Espinosa-Soria A.; Pinilla-Cienfuegos E.; Diaz-Fernandez F. J.; Griol A.; Marti J.; Martinez A. Coherent Control of a Plasmonic Nanoantenna Integrated on a Silicon Chip. ACS Photonics 2018, 5, 2712–2717. 10.1021/acsphotonics.8b00447. [DOI] [Google Scholar]
- García de Abajo F. J. Optical Excitations in Electron Microscopy. Rev. Mod. Phys. 2010, 82, 209–275. 10.1103/RevModPhys.82.209. [DOI] [Google Scholar]
- Yamamoto N.; Araya K.; García de Abajo F. J. Photon Emission from Silver Particles Induced by a High-Energy Electron Beam. Phys. Rev. B: Condens. Matter Mater. Phys. 2001, 64, 205419. 10.1103/PhysRevB.64.205419. [DOI] [Google Scholar]
- Meuret S.; Tizei L. H. G.; Cazimajou T.; Bourrellier R.; Chang H. C.; Treussart F.; Kociak M. Photon Bunching in Cathodoluminescence. Phys. Rev. Lett. 2015, 114, 197401. 10.1103/PhysRevLett.114.197401. [DOI] [PubMed] [Google Scholar]
- Peng S. Y.; Schilder N. J.; Ni X.; van de Groep J.; Brongersma M. L.; Alu A.; Khanikaev A. B.; Atwater H. A.; Polman A. Probing the Band Structure of Topological Silicon Photonic Lattices in the Visible Spectrum. Phys. Rev. Lett. 2019, 122, 117401. 10.1103/PhysRevLett.122.117401. [DOI] [PubMed] [Google Scholar]
- Polman A.; Kociak M.; García de Abajo F. J. Electron-Beam Spectroscopy for Nanophotonics. Nat. Mater. 2019, 18, 1158–1171. 10.1038/s41563-019-0409-1. [DOI] [PubMed] [Google Scholar]
- García de Abajo F. J. Relativistic Energy Loss and Induced Photon Emission in the Interaction of a Dielectric Sphere with an External Electron Beam. Phys. Rev. B: Condens. Matter Mater. Phys. 1999, 59, 3095–3107. 10.1103/PhysRevB.59.3095. [DOI] [Google Scholar]
- Matsukata T.; Matthaiakakis N.; Yano T.; Hada M.; Tanaka T.; Yamamoto N.; Sannomiya T. Selection and Visualization of Degenerate Magnetic and Electric Multipoles up to Radial Higher Orders by Cathodoluminescence. ACS Photonics 2019, 6, 2320–2326. 10.1021/acsphotonics.9b00833. [DOI] [Google Scholar]
- Fang Y.; Verre R.; Shao L.; Nordlander P.; Kall M. Hot Electron Generation and Cathodoluminescence Nanoscopy of Chiral Split Ring Resonators. Nano Lett. 2016, 16, 5183–5190. 10.1021/acs.nanolett.6b02154. [DOI] [PubMed] [Google Scholar]
- Khanikaev A. B.; Arju N.; Fan Z.; Purtseladze D.; Lu F.; Lee J.; Sarriugarte P.; Schnell M.; Hillenbrand R.; Belkin M. A.; Shvets G. Experimental Demonstration of the Microscopic Origin of Circular Dichroism in Two-Dimensional Metamaterials. Nat. Commun. 2016, 7, 12045. 10.1038/ncomms12045. [DOI] [PMC free article] [PubMed] [Google Scholar]
- Sannomiya T.; Konecna A.; Matsukata T.; Thollar Z.; Okamoto T.; García de Abajo F. J.; Yamamoto N. Cathodoluminescence Phase Extraction of the Coupling between Nanoparticles and Surface Plasmon Polaritons. Nano Lett. 2020, 20, 592–598. 10.1021/acs.nanolett.9b04335. [DOI] [PubMed] [Google Scholar]
- Matsukata T.; Wadell C.; Matthaiakakis N.; Yamamoto N.; Sannomiya T. Selected Mode Mixing and Interference Visualized within a Single Optical Nanoantenna. ACS Photonics 2018, 5, 4986–4992. 10.1021/acsphotonics.8b01231. [DOI] [Google Scholar]
- Losquin A.; Kociak M. Link between Cathodoluminescence and Electron Energy Loss Spectroscopy and the Radiative and Full Electromagnetic Local Density of States. ACS Photonics 2015, 2, 1619–1627. 10.1021/acsphotonics.5b00416. [DOI] [Google Scholar]
- Thollar Z.; Wadell C.; Matsukata T.; Yamamoto N.; Sannomiya T. Three-Dimensional Multipole Rotation in Spherical Silver Nanoparticles Observed by Cathodoluminescence. ACS Photonics 2018, 5, 2555–2560. 10.1021/acsphotonics.7b01293. [DOI] [Google Scholar]
- Aspnes D. E.; Studna A. A. Dielectric Functions and Optical-Parameters of Si, Ge, GaP, GaAs, GaSb, InP, InAs, and InSb from 1.5 to 6.0 eV. Phys. Rev. B: Condens. Matter Mater. Phys. 1983, 27, 985–1009. 10.1103/PhysRevB.27.985. [DOI] [Google Scholar]
- Sannomiya T.; Saito H.; Junesch J.; Yamamoto N. Coupling of Plasmonic Nanopore Pairs: Facing Dipoles Attract Each Other. Light: Sci. Appl. 2016, 5, e16146 10.1038/lsa.2016.146. [DOI] [PMC free article] [PubMed] [Google Scholar]
- Winther A.; Alder K. Relativistc Coulomb-Excitation. Nucl. Phys. A 1979, 319, 518–532. 10.1016/0375-9474(79)90528-1. [DOI] [Google Scholar]
- Hochstrasser U. W., Orthogonal Polynomials. In Handbook of Mathematical Functions with Formulas, Graphs, and Mathematical Tables; Abramowitz M., Stegun A. I., Ed.; Dover: New York, 1972; pp 771–792. [Google Scholar]
Associated Data
This section collects any data citations, data availability statements, or supplementary materials included in this article.


