Supplemental Digital Content is available in the text.
Keywords: heart failure, cardiogenic shock, simulation, cardiovascular modelling, right–left heart interaction, mechanical circulatory support, ECMO, venoarterial ECMO
Abstract
Left ventricular (LV) dilatation is commonly seen with LV failure and is often aggravated during venoarterial extracorporeal membrane oxygenation (VA ECMO). In this context, the intricate interaction between left and right heart function is considered to be of pivotal importance, yet mechanistically not well understood. We hypothesize that a preserved or enhanced right heart contractility causes increased LV loading both with and without VA ECMO. A closed-loop in-silico simulation model containing the cardiac chambers, the pericardium, septal interactions, and the pulmonary and systemic vascular systems with an option to connect a simulated VA ECMO circuit was developed. Right ventricular contractility was modified during simulation of severe LV failure with and without VA ECMO. Left atrial pressures increased from 14.0 to 23.8 mm Hg without VA ECMO and from 18.4 to 27.0 mm Hg under VA ECMO support when right heart contractility was increased between end-systolic elastance 0.1 and 1.0 mm Hg/ml. Left-sided end-diastolic volumes increased from 125 to 169 ml without VA ECMO and from 150 to 180 ml with VA ECMO. Simulations demonstrate that increased diastolic loading of the LV may be driven by increased right ventricular contractility and that left atrial pressures cannot be interpreted as a reflection of the degree of LV dysfunction and overload without considering right ventricular function. Our study illustrates that modelling and computer simulation are important tools to unravel complex cardiovascular mechanisms underlying the right–left heart interdependency both with and without mechanical circulatory support.
In severe left heart failure, cumulating into refractory cardiogenic shock1 and cardiac arrest,2,3 venoarterial extracorporeal membrane oxygenation (VA ECMO) is increasingly used as a lifesaving temporary circulatory support modality. It is preferentially applied as a bridge to cardiac recovery but also to chronic mechanical circulatory support or ultimately cardiac transplantation. Systemic perfusion is generally sufficient in VA ECMO, whereas cardiac unloading and more specifically left ventricular (LV) unloading is often unsatisfactory.4–6 The most dreadful clinical manifestation of this problem is a massive LV dilatation without aortic valve opening, thrombus formation within the LV cavity, and aortic root accompanied by pulmonary “white-out” due to high left atrial pressures (LAPs) and severe pulmonary edema. Seven percent of VA ECMO cases require immediate LV decompression, whereas a less urgent need for LV unloading is seen in 22% according to Takayama et al.7 A bundle of adjunct strategies, such as intra-aortic balloon pump,8,9 ventriculo-aortic axial pump (Impella),10,11 LV venting,12,13 and atrial septostomy,14 has been shown to be advantageous in handling this significant shortcoming of VA ECMO, and in observational studies, LV unloading has been associated with decreased mortality.15,16 Yet, not all patients on VA ECMO are equally affected by LV overloading despite a similar degree of left heart failure, ECMO support flow, and cannulation mode. The pathophysiology and therapies available are thoroughly described by us and others.5,17,18 A recent modelling study has shown that this hemodynamic profile of LV overload may be explained by changed loading conditions with a preserved Starling curve in the absence of changes in ventricular contractile function,19 while myocardial ischemia, stunning, and the effects of pharmacological therapy should also be considered in clinical reality. From clinical observations, it could be hypothesized that more pronounced LV overload will most likely occur in patients with predominant LV failure and a preserved right ventricular (RV) function as in left proximal acute coronary syndromes. Instead, patients with biventricular failure as encountered in dilated cardiomyopathy, show less pulmonary congestion and LV overload despite a comparable degree of LV failure.20,21
Therefore, we hypothesize that this dependency of LV overload on RV contractile function may well equally hold for patients with or without VA ECMO support. Mechanistically, LAP may increase to pathologic levels, when a nonfailing RV pumps blood into the pulmonary circulation, but the failing LV is not capable of handling the RV output due to the high LV afterload and its reduced intrinsic contractile function. Thus, LAP could be considered as a measure of the imbalance in RV–LV interaction, rather than serving as an independent clinical gauge for the degree of LV failure.
Different degrees of combined RV and LV failure is difficult to study both in clinical practice and in experimental models due to a multitude of confounding factors such as varying extension of biventricular disease, autoregulatory responses, and variable loading conditions. Clinical data are difficult to interpret since load-independent measures of LV and RV function are usually not available and in addition patients present with a wide variation in systemic and pulmonary vascular resistances further complicating their interpretation.
Therefore, we developed a simulation model (Aplysia CardioVascular Lab, Aplysia Medical AB, Solna, Sweden, Figure 1), where LV and RV failure can both be simulated including various ECMO support flow rates, while keeping other hemodynamic determinants such as vascular resistance and blood volume constant. Here, we test the hypothesis that preserved RV contractility determines the increase in LAP and LV overload in patients with severe LV failure with or without VA ECMO support in a mathematical simulation model.
Figure 1.
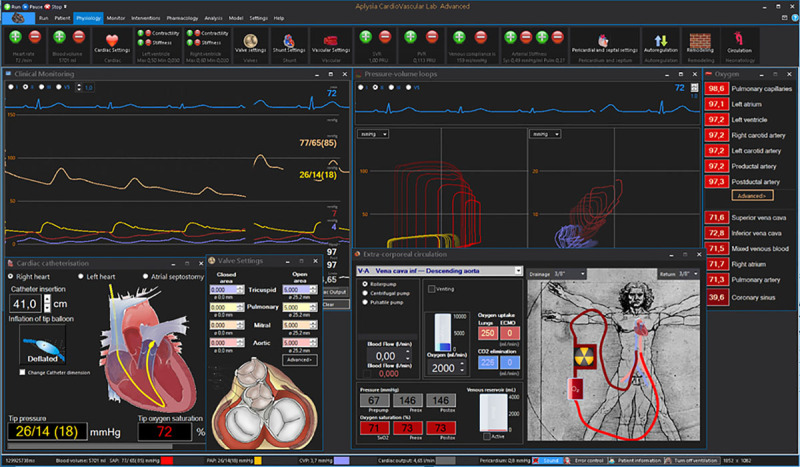
Model interface showing pressure monitoring window, ventricular and atrial pressure–volume (PV) loops, valve areas, pulmonary artery catheter, and extracorporeal circulation windows. Left ventricular PV loops are right-shifted due to systolic heart failure, while left atrial loops indicate an increase in filling pressures.
Methods
Simulations are performed with a high-fidelity closed-loop real-time model described in detail elsewhere,5,22–24 but briefly described below. The model allows gradual changes in LV and RV function and includes optional VA ECMO support. We run simulations with a generic model of LV systolic failure and explore the effects of changing right heart function on clinically relevant parameters representing LV loading conditions.
Model and Validation
The Aplysia Cardiovascular Lab model is based on a closed-loop electrical analogue of the cardiovascular system with hydraulic resistance represented by electrical resistance, mass flow inertia by inductance, and the elastic properties of biological tissues represented by capacitances. Known nonlinear relations between pressures, flows, and volumes in the heart and blood vessels are allowed to modify model parameters in every calculation step. All four cardiac chambers are represented by time-varying elastance functions, based on the established fact that the end-systolic pressure/volume ratio of a cardiac chamber is relatively insensitive to loading conditions.25 The shape of the elastance function is also relatively insensitive to loading conditions and adopted from other authors.26,27 The model also includes a pericardium and 27 vascular segments, including 21 systemic and 6 pulmonary segments (Figure 2). Valves are opening and closing gradually depending on flow and pressure gradients.
Figure 2.
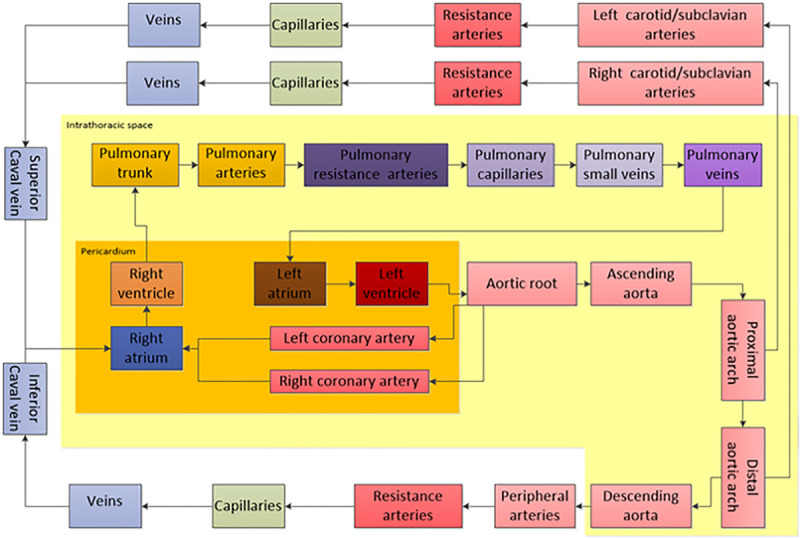
Overview of the hemodynamic model consisting of cardiac chambers inside a pericardium, six pulmonary vascular compartments inside the intrathoracic space and 21 systemic vascular compartments both inside and outside the chest. Model parameters may be modified to simulate heart failure and an ECMO system connected to any vascular compartment.
Validation of a model describing the entire circulatory system is critically important. Model features and parameters are based on previous publications,28,29 physics, and known well-validated physiology models such as time-varying elastance models26,30,31 representing cardiac contractility. Details of the model both in normal physiology and heart failure is described in previous publications5,22–24,32 and validated based on normal physiology,33 well-known heart failure physiology,34 and experimental studies.35
Simulation of Isolated Left Ventricular Systolic Heart Failure
The virtual case simulates a patient (70 kg, 170 cm) with a blood volume of 5,561 ml (79 ml/kg) at baseline. LV heart failure was simulated by reducing systolic contractility expressed as the end-systolic elastance from 2.8 to 0.6 mm Hg/ml, resulting in a low cardiac output state with a cardiac index reduced from 2.7 to 1.5 L/min/m2. The blood volume was increased by 10 ml/kg to 6261 ml to mimic heart failure pathophysiology including neurohormonal compensatory mechanisms. No autonomic autoregulatory features were included in the simulation, whereas the Starling mechanism is an intrinsic property of the model, therefore an increase in end-diastolic volume results in not only an exponential increase in end-diastolic pressure, but also an increase in end-systolic pressure, partly compensating for the decrease in contractility. See Figure 3.
Figure 3.
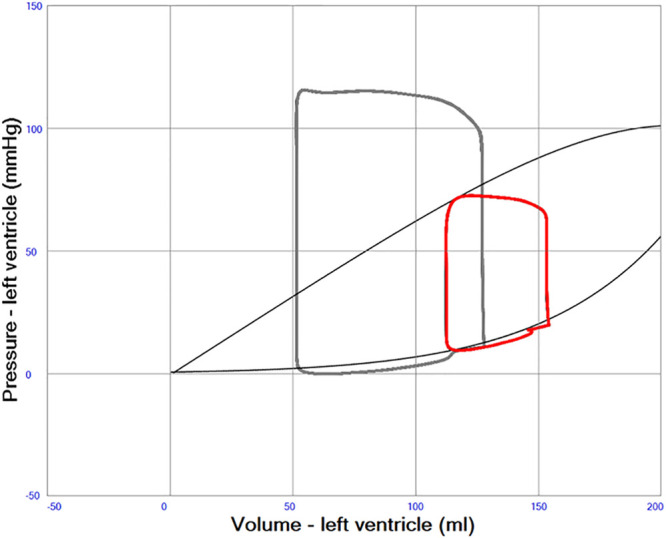
A left ventricular pressure–volume (PV) loop in red illustrating severe systolic left heart failure with an ejection fraction of about 20%. Normal PV loop in gray. End-systolic and end-diastolic pressure volume relations indicated with gray curves. The curved part of the end-systolic line at high volumes represents overstretching of left ventricular myocardium.
Simulation of VA ECMO
The virtual patient was cannulated with venous drainage in the superior caval vein and the arterial cannula inserted into a femoral artery with the tip placed in the descending aorta model compartment. VA ECMO centrifugal pump flow was 3.7 L/min with a rotational speed of 3,600 rpm.
Modification of Right Heart Function in Systolic Left Heart Failure
RV systolic contractility was varied by stepwise changing the end-systolic elastance between 0.1 and 1.0 mm Hg/ml both up and down from an estimated normal value of 0.7 mm Hg/ml as illustrated in Figure 6 and Table 1.
Figure 6.
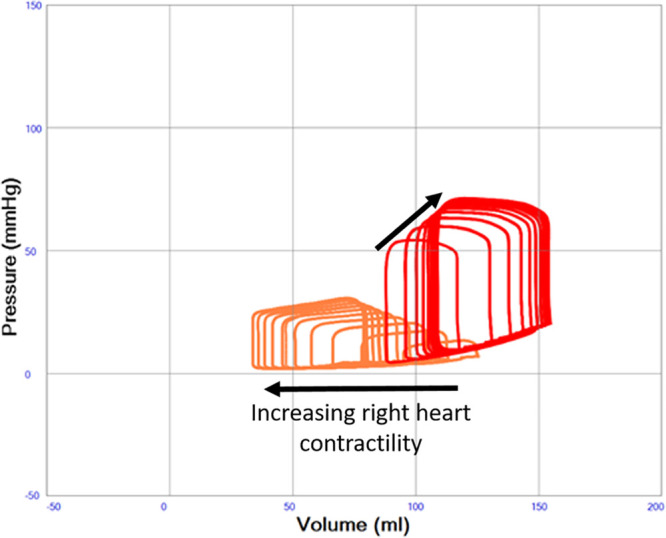
Left ventricular pressure–volume (PV) loops illustrating severe systolic left heart failure (red loops, end-systolic elastance constant 0.6 mm Hg/ml) with variable right heart function (orange loops, end-systolic elastance increasing from 0.1 to 1.0 mm Hg/ml in the direction of the arrow). A progressive dilatation of the left ventricle with increasing end-diastolic pressure is seen with increasing right heart function.
Table 1.
Hemodynamic Data in Simulations of Normal Physiology, Left Heart Failure and Left Heart Failure With Variable Right Heart Function. Increases in Right Heart Function Increases Pulmonary Arterial, Pulmonary Capillary, and Left Atrial Pressure as Well as End-Diastolic and End-Systolic Left Ventricular Volumes Both With and Without ECMO
| Heart Rate/min | Mean Arterial Pressure, mm Hg | LV End-Diastolic Volume, ml | LV End-Systolic Volume, ml | LV Stroke Volume, ml | LV Ejection Fraction, fraction | RV Ejection Fraction, fraction | Mean Pulmonary Capillary Pressure, mm Hg | Mean LA Pressure, mm Hg | Mean RA Pressure, mm Hg | Mean Pericardial Pressure, mmHg | ECMO Flow, L/min | Native Cardiac Output, L/min | |
|---|---|---|---|---|---|---|---|---|---|---|---|---|---|
| Normal. No ventilation. | 72 | 102 | 128 | 54 | 77 | 60% | 66% | 11.7 | 6.5 | 1.7 | -0.3 | 0.00 | 5.49 |
| Systolic heart failure | 72 | 62 | 159 | 125 | 39 | 25% | 51% | 17.7 | 15.7 | 3.0 | 2.3 | 0.00 | 2.76 |
| + 10 ml/kg blood volume | 72 | 68 | 165 | 129 | 41 | 25% | 46% | 24.6 | 22.5 | 8.6 | 7.4 | 0.00 | 2.87 |
| No ECMO | |||||||||||||
| RV 0.1 | 72 | 52 | 125 | 102 | 26 | 21% | 18% | 15.6 | 14.0 | 11.3 | 7.0 | 0.00 | 1.84 |
| RV 0.2 | 72 | 58 | 140 | 113 | 32 | 23% | 24% | 18.4 | 16.0 | 10.6 | 7.2 | 0.00 | 2.20 |
| RV 0.3 | 72 | 62 | 149 | 119 | 35 | 23% | 30% | 20.5 | 18.1 | 9.8 | 7.3 | 0.00 | 2.45 |
| RV 0.4 | 72 | 64 | 155 | 123 | 37 | 24% | 35% | 22.0 | 19.8 | 9.3 | 7.3 | 0.00 | 2.61 |
| RV 0.5 | 72 | 66 | 159 | 126 | 39 | 24% | 39% | 23.1 | 21.0 | 9.0 | 7.4 | 0.00 | 2.72 |
| RV 0.6 | 72 | 67 | 162 | 127 | 40 | 25% | 43% | 24.0 | 21.8 | 8.8 | 7.4 | 0.00 | 2.81 |
| RV 0.7 | 72 | 68 | 165 | 129 | 41 | 25% | 46% | 24.6 | 22.5 | 8.6 | 7.4 | 0.00 | 2.87 |
| RV 0.8 | 72 | 68 | 166 | 130 | 41 | 25% | 49% | 25.2 | 23.0 | 8.5 | 7.3 | 0.00 | 2.92 |
| RV 0.9 | 72 | 69 | 168 | 131 | 42 | 25% | 52% | 25.6 | 23.5 | 8.4 | 7.3 | 0.00 | 2.96 |
| RV 1.0 | 72 | 70 | 169 | 132 | 42 | 25% | 54% | 26.0 | 23.8 | 8.3 | 7.3 | 0.00 | 2.99 |
| + VA ECMO 3600 rpm VCS-DA | |||||||||||||
| RV 0.1 | 72 | 87 | 150 | 144 | 7 | 5% | 6% | 18.4 | 18.4 | 8.9 | 7.4 | 3.70 | 0.41 |
| RV 0.2 | 72 | 91 | 161 | 152 | 11 | 7% | 12% | 21.4 | 20.9 | 8.2 | 7.3 | 3.69 | 0.72 |
| RV 0.3 | 72 | 93 | 168 | 156 | 14 | 8% | 18% | 23.4 | 22.9 | 7.7 | 7.3 | 3.69 | 0.92 |
| RV 0.4 | 72 | 95 | 171 | 159 | 15 | 9% | 22% | 24.8 | 24.1 | 7.4 | 7.3 | 3.68 | 1.04 |
| RV 0.5 | 72 | 96 | 174 | 160 | 17 | 10% | 27% | 25.8 | 24.9 | 7.2 | 7.3 | 3.68 | 1.13 |
| RV 0.6 | 72 | 97 | 176 | 161 | 18 | 10% | 30% | 26.5 | 25.5 | 7.1 | 7.3 | 3.68 | 1.20 |
| RV 0.7 | 72 | 97 | 178 | 162 | 18 | 10% | 34% | 27.0 | 26.1 | 7.0 | 7.3 | 3.68 | 1.25 |
| RV 0.8 | 72 | 98 | 179 | 163 | 19 | 11% | 37% | 27.5 | 26.4 | 6.9 | 7.3 | 3.68 | 1.29 |
| RV 0.9 | 72 | 98 | 180 | 163 | 19 | 11% | 39% | 27.8 | 26.8 | 6.8 | 7.3 | 3.68 | 1.33 |
| RV 1.0 | 72 | 99 | 180 | 164 | 20 | 11% | 41% | 28.1 | 27.0 | 6.8 | 7.2 | 3.68 | 1.35 |
Abbreviations: ECMO, extracorporeal membrane oxygenation; LA, left atrial; LV, left ventricular; RA, right atrial; RV, right ventricular; VA ECMO, Venoarterial ECMO.
Ventricular and Atrial Septal Properties
The ventricular septum was simulated as originally proposed by Maughan et al.31 and adopted by Sun et al.28 as a septal elastance in addition to the RV and LV elastances in a three compartment model, where both septal shift volume, cross-talk pressures, and gain can be calculated during the entire cardiac cycle. The previous authors used a constant ventricular septal elastance/stiffness (45.9 mm Hg/ml), but the current previously unpublished implementation of the model uses a variable septal elastance where the maximum value is similar to previous authors scaled to the size of the patient. A lower septal stiffness value should be used during diastole, mimicking the fact that the septum is part of the contracting myocardium and therefore more compliant in diastole. Septal elastance/stiffness is therefore set proportional to the mean value of RV and LV elastance/stiffness throughout the cardiac cycle. Atrial septum was similarly simulated with a variable elastance/stiffness depending on the elastance/stiffness of the atria and therefore more compliant than the ventricular septum. See Figure 4.
Figure 4.
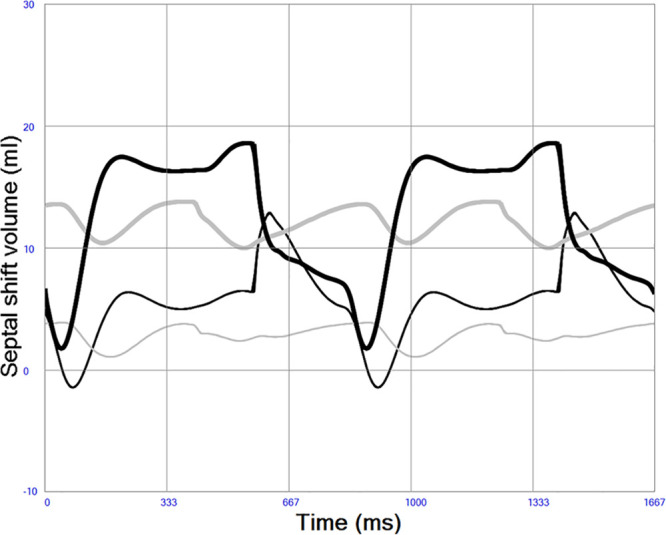
Atrial (thick gray) and ventricular (thick black) septal shift volumes in left heart failure. A positive value denotes shift from left to right, meaning that both the atrial and ventricular septum are shifted slightly to the right during this simulation of systolic left heart failure indicating higher left-sided pressures during the entire cardiac cycle. Less septal shift is seen in normal physiology indicated by atrial (thin gray line) and ventricular (thin black line).
Pericardial Properties
The pericardium was simulated as previously described by Sun et al.28 as a compliant sac characterized by an exponential pressure–volume (PV) relation containing the four cardiac chambers. The physiologic consequence of this is that the cardiac chambers are competing for space within the sac and that filling acutely may be restricted if chamber dilatation occurs as illustrated in Figure 5. Pericardial pressures are generally positive as usually seen in acute heart failure and shown in Table 1.
Figure 5.
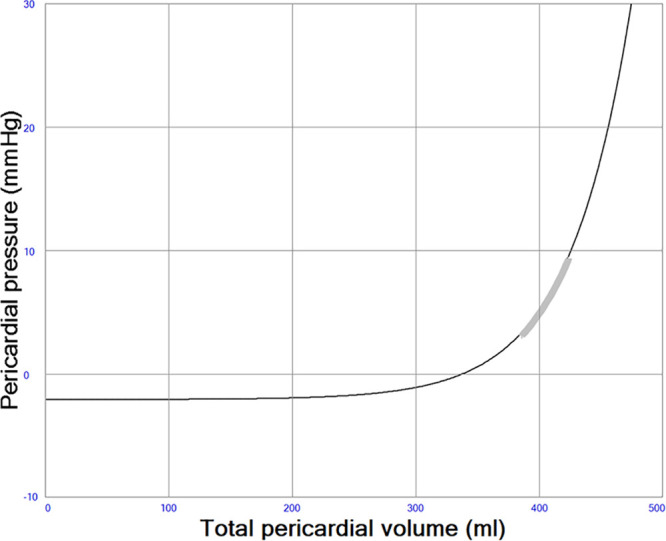
Pericardial pressure–volume (PV) relation. The thick gray line represents the operating range (3–9 mm Hg) in a simulation with acute systolic left heart failure. Pericardial pressures are usually close to zero in normal physiology.
Hemodynamic Variables
Pulmonary arterial and capillary pressures, RAPs and LAPs, arterial blood pressure, and cardiac output were sampled at end diastole. Airway pressures were set to zero to avoid variability due to hemodynamic changes during the respiratory cycle. All hemodynamic variables were sampled at steady-state conditions at least 5 minutes after changing contractility parameters.
Calculations
The program version used was Aplysia CardioVascular Lab 9.0.1.4 (Aplysia Medical AB, Stockholm, Sweden). Mean values in the model were calculated as weighted running averages with recent values having more impact than older ones. Pressures, flows, volumes, and saturations in every compartment were updated with 4,000 Hz. Hemodynamic differential equations were solved with implicit or explicit Euler’s method. No autoregulatory features or cardiovascular remodeling features were active during simulations.
Results
Variable Right Heart Function in Severe Systolic Left Heart Failure Without VA ECMO
Native cardiac output increases from 1.84 to 2.99 L/min when right heart contractility increases from end-systolic elastance 0.1 to 1.0 mm Hg/ml in a state of constantly depressed left heart function. Increased right heart contractility also monotonically increases LAP from 14.0 to 23.8 mm Hg, LV end-diastolic (from 125 to 169 ml) and end-systolic (from 102 to 132 ml) volumes as shown in Table 1 and Figure 6. Pericardial pressure remains elevated and increases slightly from 7.0 to 7.3 mm Hg as shown in Table 1. The position of the interventricular septum during diastole bulges progressively more from left to right with increased right heart contractility as shown in Figure 7.
Figure 7.
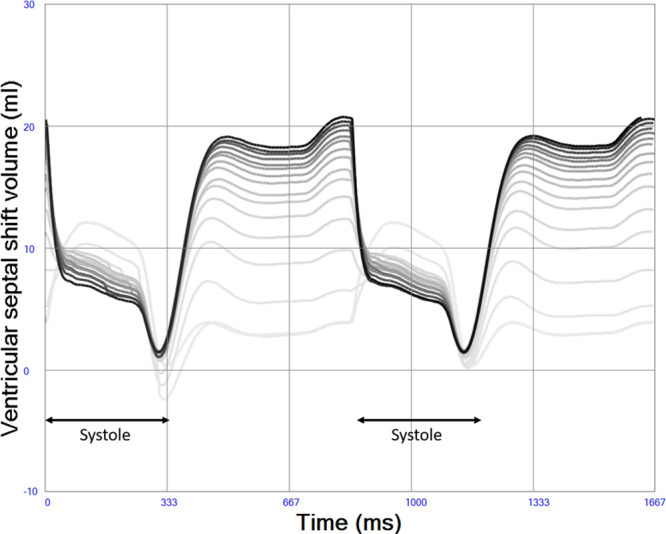
Left-to-right ventricular septal shift volume during increased right heart contractility (indicated by darker lines). Diastolic bulging of ventricular septum from left to right is more pronounced with high right ventricular contractility due to volume loading of the left ventricle, whereas a slight decrease in left-right bulging is seen during systole due to increasing right ventricular pressures.
Variable Right Heart Function in Severe Systolic Left Heart Failure Treated With VA ECMO
Native cardiac output increases from 0.41 to 1.35 L/min when right heart contractility increases from end-systolic elastance 0.1 to 1.0 mm Hg/ml in a state of constantly depressed left heart function and ongoing VA ECMO. Total systemic blood flow, the sum of native cardiac output and VA ECMO flow, increases from 4.11 to 5.03 L/min. A slight decrease in VA ECMO flow with increased right heart function from 3.70 to 3.68 L/min is seen due to the afterload sensitivity of the simulated centrifugal pump. Increased right heart contractility also monotonically increases LAP from 18.4 to 27.0 mm Hg, LV end-diastolic (from 150 to 180 ml) and end-systolic (from 144 to 164 ml) volumes during VA ECMO as shown in Table 1 and Figure 8. The diastolic position of the interventricular septum bulges progressively more from left to right with increased right heart contractility in a way similar to in Figure 7 without VA ECMO (data not shown). Pericardial pressure remains elevated but decreases slightly from 7.4 to 7.2 mm Hg.
Figure 8.
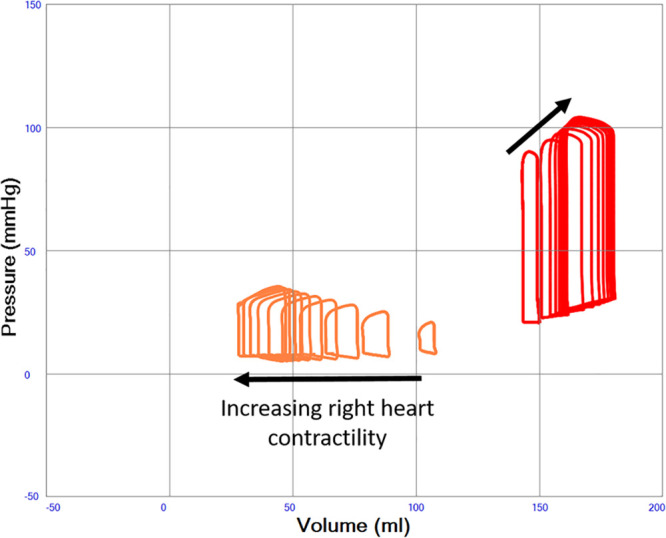
Left ventricular pressure–volume (PV) loops illustrating severe systolic left heart failure (red loops, end-systolic elastance constant 0.6 mm Hg/ml) with variable right heart function (orange loops, end-systolic elastance increasing from 0.1 to 1.0 mm Hg/ml in the direction of the arrow) during VA ECMO support. A progressive dilatation of the left ventricle with increasing end-diastolic pressures is seen with increasing right heart function.
Discussion
The simulations show that the right–left heart interaction is a major determinant of the loading conditions of the left heart in severe systolic LV failure both with and without VA ECMO. More specifically RV contractility is a major determinant of LAP and should therefore be taken into consideration, when the severity of left heart failure and concomitant LV overload is quantified by measuring filling pressures (See Video 1, Supplemental Digital Content, http://links.lww.com/ASAIO/A531). Our simulations reveal that a preserved or improved right heart function can significantly aggravate pulmonary congestion by increasing left atrial and LV filling pressures. In this sense, right heart contractility will drive LV dilatation and overloading in the setting of VA ECMO.
In previous publications, we have shown that LV unloading during VA ECMO is often unsatisfactory in systolic left heart failure with preserved right heart function.5,17 In this study, we have explored the importance of the right heart function in more detail. Although, the clinical importance of the current work needs to be further investigated, our results underscore a pivotal role of RV function in left heart failure. As a consequence, the right ventricle may be considered as a more prominent therapeutic target in left heart failure than anticipated so far, since it acts as a major determinant of LV overload and pulmonary congestion. Likewise, it could be hypothesized that inotropic drug therapy in left heart systolic failure may substantially increase the risk of pulmonary edema and overt decompensation. This may mainly occur when the contractile reserve of the left ventricle is significantly impaired as compared with the right ventricle, as holds for the majority of cases complicated by cardiogenic shock in predominantly left-sided myocardial infarction. Our findings also emphasize the relevance of effective venous drainage during VA ECMO to avoid unwanted right heart output, which in turn increases hydrostatic pulmonary vascular pressure and left heart (over-)loading. Moreover, it has been suggested that the long-term beneficial effects seen with anti-adrenergic, yet negative inotropic, beta-blocking agents in left heart failure,36 may in part be due to the negative inotropic effects on the RV myocardium, thereby unloading the left side of the heart. Similarly, the beneficial effects of pulmonary arterial banding in congenital dilated cardiomyopathy37,38 may be explained by restricting right heart output, thereby decreasing left heart preload.
From a pathophysiological point of view, this study emphasizes the importance of a serial right–left heart interaction and specifically points to the importance of balancing right and left heart function in heart failure therapy with and without VA ECMO support. This balance is clinically well accessible and can easily be evaluated by visualizing the position of the ventricular septum in a two(four-)-chamber cross-sectional echocardiogram. Here, the dynamics of the septal position should in this context be interpreted as a functional marker of a serial interaction rather than as a causative factor by itself. In this sense, our data indicate that the term “septal function” is a mis-nomer and “septal shift” should rather be considered as a clinical sign of the imbalance between right and LV functional states and their mutual interdependency.
Limitations
The present 0D model cannot represent three-dimensional (3D) features of the circulatory system. The accuracy of hemodynamic output of simulations in 0D models is however often more reliable than 3D models since it allows more realistic boundary conditions and real-time simulation of the entire circulation including arteries, capillaries, and veins in both the pulmonary and systemic circulation. The cardiac model does not include AV-plane displacement and diastolic elastic recoil, but has despite this proven to produce realistic filling patterns and pressures both in normal physiology and various pathologies.5,23
LV and RV filling pressures above 30 and 20 mm Hg respectively may be seen in a clinical VA ECMO population contrasting to lower values in this study. This may be explained by lack of compensatory venous constriction and only a modest fluid infusion in our study aiming to minimize confounding factors. The original model of the ventricular septum used in this study28,31 has been further developed by Dickstein et al.39 who concluded that septal interaction is dependent on right heart volume and curvilinearity of the ventricular PV relation. These effects are not fully taken into account in the current study, but the overall gain of pressure and volume interactions are in the same range as the values found by Dickstein et al. and our conclusions therefore remain valid. An experimental isolated heart study by Damiano et al.40 shows that more than 60% of right heart pressure generation may originate from the left ventricle, but the clinical relevance in an intact heart with a pericardium is unclear. Experimental data are conflicting, but it may be that we have underestimated the right-sided consequences of severe left heart failure to some degree. Furthermore, it should be noted that our approach with a septal stiffness proportional to the mean of left- and right-sided stiffness is a simplification of real life, where septal contractility could be virtually absent or preserved depending on regional myocardial function. A detailed study of septal cross-talk and pathophysiology is beyond the scope of this study.
Conclusion
The serial right–left heart interaction is of paramount importance in the development of LV dilatation and pulmonary congestion in left heart failure with and without VA ECMO support. It is a preserved or increased RV function that drives the degree of LV (over-)loading. Therefore, LAP cannot be considered as an independent measure of LV dysfunction and myocardial overload without taking the RV function into account. This approach exemplifies that modelling and computer simulation of human hemodynamics are relevant tools to unravel complex cardiovascular mechanisms and identify future therapeutic targets and improve individualized tailoring of VA ECMO, yet further clinical and experimental studies are needed to confirm our findings.
Acknowledgments
M.B.’s research during the years 2013–2015 was founded by The Swedish Research Council Grant 2012-2800. M.B.’s research during the years 2017–2018 was founded by The Stockholm City Council Grant SLL20160421. In 2019, the research is funded by grant No.20180265 from the Swedish Heart Lung Foundation.
Supplementary Material
Footnotes
Disclosures: Michael Broomé is the founder and owner of the company Aplysia Medical AB developing the simulation software Aplysia CardioVascular Lab. The authors have no other conflicts of interest.
Supplemental digital content is available for this article. Direct URL citations appear in the printed text, and links to the digital files are provided in the HTML and PDF versions of this article on the journal’s Web site (www.asaiojournal.com).
Michael Broomé constructed the model, performed programming, simulation runs, analyzed data, and drafted the manuscript. All authors have contributed to drafting the manuscript, read, and approved the final manuscript. All authors are clinicians taking care of patients discussed in the article confirming that simulation results have clinical relevance.
References
- 1.Napp LC, Kühn C, Bauersachs J. ECMO in cardiac arrest and cardiogenic shock. Herz. 2017; 42:27–44 [DOI] [PMC free article] [PubMed] [Google Scholar]
- 2.Wengenmayer T, Rombach S, Ramshorn F, et al. Influence of low-flow time on survival after extracorporeal cardiopulmonary resuscitation (eCPR). Crit Care. 2017; 21:157. [DOI] [PMC free article] [PubMed] [Google Scholar]
- 3.Richardson AS, Schmidt M, Bailey M, Pellegrino VA, Rycus PT, Pilcher DV. ECMO Cardio-Pulmonary Resuscitation (ECPR), trends in survival from an international multicentre cohort study over 12-years. Resuscitation. 2017; 112:34–40 [DOI] [PubMed] [Google Scholar]
- 4.Burkhoff D, Sayer G, Doshi D, Uriel N. Hemodynamics of mechanical circulatory support. J Am Coll Cardiol. 2015; 66:2663–2674 [DOI] [PubMed] [Google Scholar]
- 5.Donker DW, Brodie D, Henriques JPS, Broome M. Left ventricular unloading during veno-arterial ECMO: A simulation study. ASAIO J. 2019; 65:11–20 [DOI] [PMC free article] [PubMed] [Google Scholar]
- 6.Rupprecht L, Flörchinger B, Schopka S, et al. Cardiac decompression on extracorporeal life support: A review and discussion of the literature. ASAIO J. 2013; 59:547–553 [DOI] [PubMed] [Google Scholar]
- 7.Truby LK, Takeda K, Mauro C, et al. Incidence and implications of left ventricular distention during venoarterial extracorporeal membrane oxygenation support. ASAIO J. 2017; 63:257–265 [DOI] [PubMed] [Google Scholar]
- 8.Aso S, Matsui H, Fushimi K, Yasunaga H. The effect of intraaortic balloon pumping under venoarterial extracorporeal membrane oxygenation on mortality of cardiogenic patients: An analysis using a nationwide inpatient database. Crit Care Med. 2016; 44:1974–1979 [DOI] [PubMed] [Google Scholar]
- 9.Park TK, Yang JH, Choi SH, et al. Clinical impact of intra-aortic balloon pump during extracorporeal life support in patients with acute myocardial infarction complicated by cardiogenic shock. BMC Anesthesiol. 2014; 14:27. [DOI] [PMC free article] [PubMed] [Google Scholar]
- 10.Burzotta F, Trani C, Doshi SN, et al. Impella ventricular support in clinical practice: Collaborative viewpoint from a European expert user group. Int J Cardiol. 2015; 201:684–691 [DOI] [PubMed] [Google Scholar]
- 11.Lauten A, Engström AE, Jung C, et al. Response to letter regarding article, “percutaneous left-ventricular support with the impella-2.5-assist device in acute cardiogenic shock results of the impella-EUROSHOCK registry.” Circ Heart Fail. 2013; 6:e56. [DOI] [PubMed] [Google Scholar]
- 12.Cevasco M, Takayama H, Ando M, Garan AR, Naka Y, Takeda K. Left ventricular distension and venting strategies for patients on venoarterial extracorporeal membrane oxygenation. J Thorac Dis. 2019; 11:1676–1683 [DOI] [PMC free article] [PubMed] [Google Scholar]
- 13.Xie A, Forrest P, Loforte A. Left ventricular decompression in veno-arterial extracorporeal membrane oxygenation. Ann Cardiothorac Surg. 2019; 8:9–18 [DOI] [PMC free article] [PubMed] [Google Scholar]
- 14.Baruteau AE, Barnetche T, Morin L, et al. Percutaneous balloon atrial septostomy on top of venoarterial extracorporeal membrane oxygenation results in safe and effective left heart decompression. Eur Heart J Acute Cardiovasc Care. 2018; 7:70–79 [DOI] [PubMed] [Google Scholar]
- 15.Russo JJ, Aleksova N, Pitcher I, et al. Left ventricular unloading during extracorporeal membrane oxygenation in patients with cardiogenic shock. J Am Coll Cardiol. 2019; 73:654–662 [DOI] [PubMed] [Google Scholar]
- 16.Meuwese CL, Koudstaal S, Braithwaite S, Hermens JAJ, Donker DW. Left ventricular unloading during extracorporeal membrane oxygenation: Insights from meta-analyzed observational data corrected for confounders. J Am Coll Cardiol. 2019; 73:3034–3035 [DOI] [PubMed] [Google Scholar]
- 17.Donker DW, Brodie D, Henriques JPS, Broomé M. Left ventricular unloading during veno-arterial ECMO: A review of percutaneous and surgical unloading interventions. Perfusion. 2019; 34:98–105 [DOI] [PMC free article] [PubMed] [Google Scholar]
- 18.Rajagopal K. Left ventricular distension in veno-arterial extracorporeal membrane oxygenation: From mechanics to therapies. ASAIO J. 2019; 65:1–10 [DOI] [PubMed] [Google Scholar]
- 19.Dickstein ML. The starling relationship and veno-arterial ECMO: Ventricular distension explained. ASAIO J. 2018; 64:497–501 [DOI] [PubMed] [Google Scholar]
- 20.Barral MM, Nunes Mdo C, Barbosa MM, Ferreira CS, Tavares WC, Jr, Rocha MO. Echocardiographic parameters associated with pulmonary congestion in outpatients with Chagas’ cardiomyopathy and non-chagasic cardiomyopathy. Rev Soc Bras Med Trop. 2012; 45:215–219 [DOI] [PubMed] [Google Scholar]
- 21.Liew S, Nanayakkara S, Sheldrake J, Pellegrino V, Kaye D. Venoarterial ECMO reduces left ventricular dimensions in patients with cardiogenic shock. J Am Coll Cardiol. 2018; 71suppl 11A751 [Google Scholar]
- 22.Lindfors M, Frenckner B, Sartipy U, Bjällmark A, Broomé M. Venous cannula positioning in arterial deoxygenation during veno-arterial extracorporeal membrane oxygenation—A simulation study and case report. Artif Organs. 2017; 41:75–81 [DOI] [PMC free article] [PubMed] [Google Scholar]
- 23.Broomé M, Maksuti E, Bjällmark A, Frenckner B, Janerot-Sjöberg B. Closed-loop real-time simulation model of hemodynamics and oxygen transport in the cardiovascular system. Biomed Eng Online. 2013; 12:69. [DOI] [PMC free article] [PubMed] [Google Scholar]
- 24.Broomé M, Donker DW. Individualized real-time clinical decision support to monitor cardiac loading during venoarterial ECMO. J Transl Med. 2016; 14:4. [DOI] [PMC free article] [PubMed] [Google Scholar]
- 25.Sagawa K, Suga H, Shoukas AA, Bakalar KM. End-systolic pressure/volume ratio: A new index of ventricular contractility. Am J Cardiol. 1977; 40:748–753 [DOI] [PubMed] [Google Scholar]
- 26.Stergiopulos N, Meister JJ, Westerhof N. Determinants of stroke volume and systolic and diastolic aortic pressure. Am J Physiol. 1996; 2706 pt 2H2050–H2059 [DOI] [PubMed] [Google Scholar]
- 27.Mynard JP, Davidson MR, Penny DJ, Smolich JJ. A simple, versatile valve model for use in lumped parameter and one-dimensional cardiovascular models. Int J Numer Method Biomed Eng. 2012; 28:626–641 [DOI] [PubMed] [Google Scholar]
- 28.Sun Y, Beshara M, Lucariello RJ, Chiaramida SA. A comprehensive model for right-left heart interaction under the influence of pericardium and baroreflex. Am J Physiol. 1997; 2723 pt 2H1499–H1515 [DOI] [PubMed] [Google Scholar]
- 29.Sun Y, Sjöberg BJ, Ask P, Loyd D, Wranne B. Mathematical model that characterizes transmitral and pulmonary venous flow velocity patterns. Am J Physiol. 1995; 2681 pt 2H476–H489 [DOI] [PubMed] [Google Scholar]
- 30.Little WC, Freeman GL. Description of LV pressure-volume relations by time-varying elastance and source resistance. Am J Physiol. 1987; 2531 pt 2H83–H90 [DOI] [PubMed] [Google Scholar]
- 31.Maughan WL, Sunagawa K, Sagawa K. Ventricular systolic interdependence: Volume elastance model in isolated canine hearts. Am J Physiol. 1987; 2536 pt 2H1381–H1390 [DOI] [PubMed] [Google Scholar]
- 32.Broman M, Frenckner B, Bjällmark A, Broomé M. Recirculation during veno-venous extra-corporeal membrane oxygenation–a simulation study. Int J Artif Organs. 2015; 38:23–30 [DOI] [PubMed] [Google Scholar]
- 33.Guyton AC. Guyton AC, Hall JE. (eds), Chapter 20: Cardiac output, venous return and their regulation Textbook of Medical Physiology, 2000, pp. 10th ed. Philadelphia, PA: W.B.Saunders Company, 210–222 [Google Scholar]
- 34.Borlaug BA, Kass DA. Ventricular-vascular interaction in heart failure. Heart Fail Clin. 2008; 4:23–36 [DOI] [PMC free article] [PubMed] [Google Scholar]
- 35.Ostadal P, Mlcek M, Kruger A, et al. Increasing venoarterial extracorporeal membrane oxygenation flow negatively affects left ventricular performance in a porcine model of cardiogenic shock. J Transl Med. 2015; 13:266. [DOI] [PMC free article] [PubMed] [Google Scholar]
- 36.Joseph P, Swedberg K, Leong DP, Yusuf S. The evolution of β-blockers in coronary artery disease and heart failure (part 1/5). J Am Coll Cardiol. 2019; 74:672–682 [DOI] [PubMed] [Google Scholar]
- 37.Schranz D, Akintuerk H, Bailey L. Pulmonary artery banding for functional regeneration of end-stage dilated cardiomyopathy in young children: World network report. Circulation. 2018; 137:1410–1412 [DOI] [PubMed] [Google Scholar]
- 38.Rupp S, Jux C. Advances in heart failure therapy in pediatric patients with dilated cardiomyopathy. Heart Fail Rev. 2018; 23:555–562 [DOI] [PubMed] [Google Scholar]
- 39.Dickstein ML, Todaka K, Burkhoff D. Left-to-right systolic and diastolic ventricular interactions are dependent on right ventricular volume. Am J Physiol. 1997; 2726 pt 2H2869–H2874 [DOI] [PubMed] [Google Scholar]
- 40.Damiano RJ, Jr, La Follette P, Jr, Cox JL, Lowe JE, Santamore WP. Significant left ventricular contribution to right ventricular systolic function. Am J Physiol. 1991; 2615 Pt 2H1514–H1524 [DOI] [PubMed] [Google Scholar]
Associated Data
This section collects any data citations, data availability statements, or supplementary materials included in this article.


