Supplemental Digital Content is available in the text
Keywords: authorship weighted scheme, Kano model, pyramid plot, research achievement, hx-index, ophthalmology, PubMed Central
Abstract
Background:
Ophthalmology authors in mainland China, Hong Kong, or Taiwan were interested in knowing their individual research achievements (IRAs). This study was to evaluate the most cited authors, institutes, and regions in the mainland, Hong Kong, and Taiwan in the field of ophthalmology in the recent 10 years using the hx-index and to display the result with visual representations.
Methods:
Using the PubMed search engine to download data, we conducted an observational study of citation analyses in affiliated research institutes and regions (provinces/areas) of all ophthalmology authors since 2010. A total of 19,364 published articles from 22,393 authors in the mainland, Hong Kong, and Taiwan were analyzed. The x-index and the Kano model were complemental to the hx-index in identifying IRAs. A pyramid plot was used to illustrate the importance of the author-weighted scheme (AWS) used in evaluating IRAs in academics. The hx-index combining both advantages of the h and x-index was proposed to assess individual IRAs. Furthermore, we drew
-
1.
a choropleth map on Google Maps to visualize the differences of IRA among regions and
-
2.
a visual display to present individual hx-indexes.
Results:
There is a significant rise over time in the number of publications. The top-ranking regions in hx-index were Shanghai (26.82), Guangdong (25.82), and Beijing (25.81). We demonstrated that Dr Wu from Taiwan published 144 articles in PMC and used the example to explain the importance of AWS when IRAs were assessed.
Conclusions:
With an overall increase in publications in the field of ophthalmology, contributions assessed by hx-indexes and the AWS should be encouraged and promoted more in the future.
Highlights
We emphasized the importance of the h-index in comparing individual achievements.
A summary of research achievements in Mainland China, Hong Kong, and Taiwan for ophthalmology authors is rarely seen in literature because of difficulties in extracting data for authors who were only in the department of ophthalmology.
Choropleth maps were plotted in this study. The need for complementing choropleth maps with the Kano diagrams and pyramid plot were introduced and demonstrated in this study.
1. Introduction
A few bibliometric studies have been published in the field of ophthalmology.[1–3] Despite the h-index[3] being one of the most popular indicators of individual research achievement (IRA),[4] there are 2 main disadvantages:
-
1.
coauthors are weighted equally in contribution to the article bylines[6–8] and
-
2.
the integer nature of the h-index making it very hard to differentiate the IRA among groups.[9]
We were motivated to use these novel approaches (i.e., AWS and modified h-index) to evaluate IRAs for ophthalmology authors in mainland China, Hong Kong, or Taiwan.
Visualizations of results are commonly included in bibliographic analyses.[10–13] However, none of the bibliometric studies have displayed IRAs on a dashboard for better understanding and detailed examination of the IRAs with a user-friendly interface. Visualization is a potential area of improvement in bibliometric studies.
Three questions were of interest:
-
1.
which regions and institutes have significantly higher IRA,
-
2.
which individual author has higher IRA, and
-
3.
how the AWS and the modified h-index compared in assessing IRA.
2. Methods
2.1. Data sources
We included original research articles and excluded letters, editorials, and comments. A total of 19,364 results published since 2010 were obtained from PubMed Central (PMC) by searching keywords (“Ophthalmology [Affiliation] and (China [Affiliation] or “Hong Kong” [Affiliation], or Taiwan [Affiliation] China [Affiliation])) on January 2, 2019. A total number of 76,895 citing articles were successfully linked to 9327 cited papers on the PMC. The rest of the articles (n = 10,037) have not been cited as of January 2, 2019. Study data were included in Supplemental Digital Content file 1.
The study is exempt from review and approval by the research ethics committees because it did not involve any patient records.
2.2. Two novel approaches used in this study
1. An authorship-weighted scheme (AWS) was used in the previous articles[8,14,15] to quantify contributions of individual authors with the definition of total weights equal to 1.0 for each publication. More importance is given to the first (primary) and the last (corresponding or supervisory) authors while assuming that others (the middle authors) made smaller contributions.[1,16–18]
| (1) |
2. The hx-index shown in formula (1) is derived from the h-index and allow better discrimination in the form of decimal places;[9] it is defined by rh denoting the ratio (=citations/publications on the x-core of the x-index = , where all of the cited papers are denoted by ci at the i-th publications sorted in descending order) based on the x-core publications and the citations.[17]
For instance, an author whose h-index=2 and has an x-index with publications and citations of 3 and 1 has an hx-index of 2.25 (=2 + (1/3)/(1 + 1/3)). This hx-index is the first 1 proposed in the literature so far, and the idea was inspired by previous studies.[18,19] From formula (1), it can be seen that the hx-index is used to distinguish authors with the same h indexes. In other words, the formula rank the authors with the same h indexes by looking at the impact factors (=citations/publications on the x-core of the x-index) in order to overcome the integer nature of the h-index, which would have made it hard to differentiate the IRAs among entities.[9]
2.3. Representations of the research results
2.3.1. Choropleth maps
The term “choropleth map” was raised by John Kirtland Wright in 1938.[20] The most famous example of CM used was on the results of the 2000 US presidential election.[21] Other examples included showing the disparities in health outcomes across areas involved with dengue outbreaks,[22,23] disease hotspots,[24] and the Global Health Observatory (GHO) maps on major health topics.[25]
2.3.2. Kano diagrams
The Kano model is developed based on a theory of product development and customer satisfaction in 1984 by Professor Noriaki Kano,[26] who classified products or items into 3 main categories of quality: basic requirement, one-dimensional quality, and excitement (aka. wow) feature. Graphs are made with the satisfaction perceived by customers on Axis Y and the accomplishment achieved by providers on Axis X. In this study, we attempt to demonstrate the use of the Kano diagram to characterize the feature of authors using the hx-index in bubble and x-core publications and citations on axes X and Y, respectively.
2.3.3. Pyramid plot for comparing IRAs with AWS or non-AWS in comparison
A productive author will be illustrated using the pyramid plot comparing the feature of IRAs with AWS and non-AWS.
2.3.4. Visual representations for a personal hx-index
Visual representation on a dashboard was developed to present individual IRAs in this study.
2.4. Creating dashboards on Google Maps
All figures but the pyramid are shown by author-made modules in Excel (Microsoft Corp). We created pages of HTML with Google Maps used. All relevant h-index information on the entities can be linked to dashboards on Google Maps.
3. Results
The overall impact factor is 3.97 (=76895/19364), as shown in Table 1. There was a significant rise over time in the number of publications, referring to statistics of each region in Table 1. The top 3 regions in publication number were Shanghai, Beijing, and Guangdong, with the proportion being of 12.87%, 12.71%, and 12.41%, respectively.
Table 1.
Publications with first authors in China, Hong Kong, and Taiwan.
| Regions | 2010 | 2011 | 2012 | 2013 | 2014 | 2015 | 2016 | 2017 | 2018 | 2019 | Total | % | Citations | IF |
| Shanghai | 84 | 130 | 152 | 166 | 206 | 273 | 302 | 342 | 363 | 474 | 2492 | 12.87 | 10766 | 4.32 |
| Beijing | 106 | 134 | 178 | 194 | 239 | 284 | 279 | 303 | 352 | 392 | 2461 | 12.71 | 9610 | 3.90 |
| Guangdong | 99 | 130 | 164 | 158 | 194 | 236 | 269 | 324 | 361 | 468 | 2403 | 12.41 | 9940 | 4.14 |
| Taiwan | 113 | 102 | 94 | 105 | 182 | 256 | 259 | 273 | 288 | 383 | 2055 | 10.61 | 7298 | 3.55 |
| Zhejiang | 39 | 55 | 66 | 79 | 128 | 153 | 178 | 188 | 217 | 297 | 1400 | 7.23 | 5295 | 3.78 |
| Hong Kong | 52 | 47 | 55 | 63 | 110 | 142 | 133 | 139 | 110 | 158 | 1009 | 5.21 | 5713 | 5.66 |
| Shandong | 44 | 39 | 47 | 46 | 67 | 110 | 118 | 123 | 137 | 171 | 902 | 4.66 | 3146 | 3.49 |
| Jiangsu | 14 | 11 | 24 | 36 | 47 | 61 | 82 | 97 | 94 | 143 | 609 | 3.15 | 2275 | 3.74 |
| Hunan | 17 | 28 | 30 | 26 | 39 | 34 | 75 | 75 | 68 | 132 | 524 | 2.71 | 2245 | 4.28 |
| Hubei | 28 | 23 | 33 | 14 | 37 | 56 | 48 | 90 | 81 | 108 | 518 | 2.68 | 2418 | 4.67 |
| Tianjin | 10 | 16 | 22 | 23 | 45 | 65 | 67 | 73 | 84 | 98 | 503 | 2.60 | 1282 | 2.55 |
| Sichuan | 18 | 31 | 21 | 25 | 30 | 45 | 52 | 57 | 76 | 105 | 460 | 2.38 | 2322 | 5.05 |
| Shaanxi | 19 | 22 | 22 | 22 | 30 | 40 | 60 | 55 | 75 | 97 | 442 | 2.28 | 1155 | 2.61 |
| Others | 42 | 58 | 72 | 87 | 164 | 181 | 239 | 264 | 331 | 405 | 1844 | 9.52 | 2144 | 1.16 |
| Total | 723 | 882 | 1050 | 1108 | 1642 | 2134 | 2366 | 2657 | 2976 | 3825 | 19364 | 100.00 | 76895 | 3.97 |
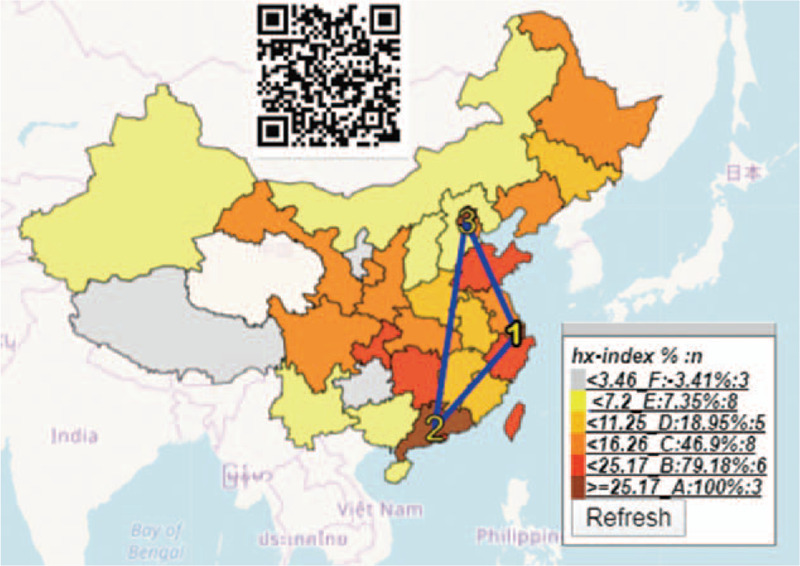
The top 3 regions in hx-index were Shanghai (26.82), Guangdong (25.82), and Beijing (25.81), as shown in Figure 1.
Figure 1.

The top 3 regions whose authors were in ophthalmology department using choropleth map to present.
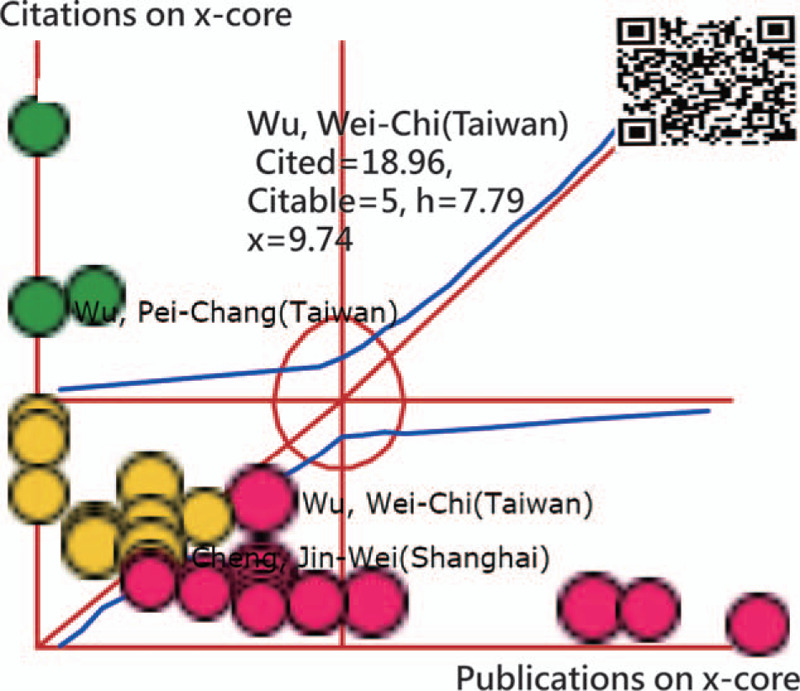
The top 30 authors are shown in Figure 2 using the Kano diagram. It is worth noting that the article[27] cited 34 times was authored by Dr Wu and his/her colleagues from the Department of Ophthalmology Chang Gung Memorial Hospital, Linkou(Taiwan). The article will instantly appear on PMC when the bubble is clicked, and the publication is selected in Figure 2.
Figure 2.

Comparison of research achievements in regions where their authors were in ophthalmology department using 95% CI to present.
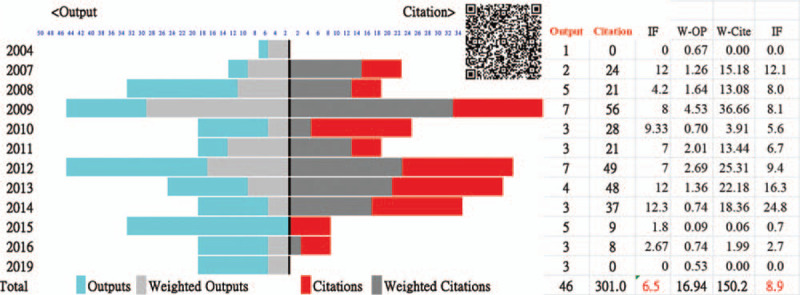
Moreover, we noticed an individual author Dr Wu (Taiwan), on PMC, who published 46 articles since 2004. The importance of AWS when IRAs were assessed is present in Figure 3, where we can see the author's impact factor increased from 6.5 to 8.9. The hx-indexes identified by either AWS or non-AWS are substantially different because the weighted hx-index will be smaller due to both weighted publications and citations being less than the non-AWS ones.
Figure 3.

Author Dr Wu who was in ophthalmology department using the pyramid plot tp present his research achievements since 2004.
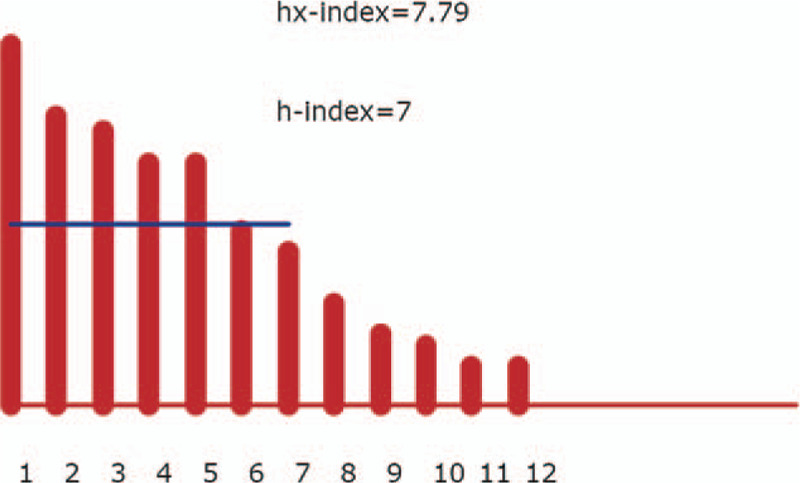
The hx-index for Dr Wu is 7.64, as shown in Figure 4. It is worth mentioning that the citations and publications have been weighted by the AWS[8,14,15] we proposed in this study. Readers are invited to click on the link[28] to see the details about the hx-index for Dr Wu on Google Maps.
Figure 4.

An online module used for displaying the author hx-index on Google Maps.
4. Discussion
In this study, there was a significant rise over time in the number of original research published by ophthalmology authors in mainland China, Hong Kong, and Taiwan. Citations were not considered in the case.
Similar to choropleth maps that provide a better interpretation of the disparities in health outcomes across countries/areas,[29] the hx-index in Figure 4 helps us understand the IRA for an individual author.[28]
There are other features in this study. First, the hx-index with decimal places can complement the original h-index to increase the discrimination power[9] for identifying the IRA characteristics and rankings of a given group.
The second feature is the application of the Kano model[26] to interpret the attributes for one's IRA using visual representations. Particularly, the dashboard-type display allows us to see details of the bibliometric indices by scanning the QR-code and clicking on the entity of interest on Google Maps. Readers are invited to see the number of citations for each author in Figure 2 by clicking the bubbles.
The reasons for using x-index on 2 axes in Figure 4 are
-
1.
to closely correlate to h-index;[19] and
-
2.
because it was newly developed in 2018, and despite being a simple and easy-to-use metric in comparison to others, the disadvantage of using h-index has been raised.[19]
For example, an h-index of 5 means that a scientist has published 5 papers with at least 5 citations each.[10] The h-index is little affected in those with a high volume of low-impact papers or authors with only a few high-impact articles.[10] A high number of citations or publications were often neglected.[30,31] The x-index was thus used to complement the h-index to clearly interpret one's feature toward either citation-oriented or productivity-oriented. The hx-index shown on the Kano diagram (Fig. 4) is novel and innovative in showing the author's IRAs on a dashboard.
The third feature is the dashboard of the Kano diagram combined with the hx-index on Google Maps, which is more difficult to create using the traditional BibExce software.[32] The pyramid plot (Fig. 3) for displaying author publications and citations is unique and innovative in comparing the non-weighted and weighted AWS colored bars.[33]
4.1. Limitations and suggestions
Although our analysis provides significant findings, several potential limitations were noticed, and may encourage further research. First, this study only focused on authors in China, Hong Kong, or Taiwan. The results cannot be generalized to other areas and countries. Second, certain biases might have occurred during citation extraction because of the number of citations increasing over the years. Namely, the IRA might differ if the time periods and the citation sources of the data are disparate. Third, many authors work for multiple departments, such as in university, medical school, and affiliated hospital. Only the units listed first were included in this study. The results of hx-index in comparison in Figures 3 might be biased if we were to apply the author-weighted scheme.[8,14,15] Fourth, although our proposed hx-index can be easily applied to many other disciplines for comparison of IRAs, many statistical software do not provide such an approach to their users. A simple and useful hyperlink was provided to readers to display the hx-index on a dashboard[28] and arrange their citations in descending order on their own in the future.
Finally, although the hx-index is considered useful and applicable in nature, the comparison of the difference in hx-index between groups should be used in cautions due to the hx-indexes not always following a normal distribution. The bootstrapping method[34–36] was recommended to readers for comparison among groups.
5. Conclusions
The hx-index and the Kano models can complement the original h-index in identifying the various IRA characteristics among groups. The bootstrapping method that allows estimation of the sampling distribution for almost all statistic data using random sampling methods with accuracy (as defined by 95% CI) is recommended in future studies when hx-indexes were compared among departments or institutes. We highly recommend the 3 features used in this study, AWS, hx-index, and the Kano diagram, to be applied in the future, not just limited to ophthalmology publications.
5.1. Uncited reference
[5].
Author contributions
Conceptualization: Yu-Tsen Yeh, Tsair-Wei Chien, Wei-Chih Kan.
Formal analysis: Shu-Chun Kuo.
Investigation: Yu-Tsen Yeh, Tsair-Wei Chien, Shu-Chun Kuo.
Methodology: Tsair-Wei Chien.
Software: Tsair-Wei Chien.
Supervision: Shu-Chun Kuo.
Supplementary Material
Footnotes
Abbreviations: AWS = authorship-weighted scheme, PMC = Pubmed Center,.
How to cite this article: Yeh YT, Chien TW, Kan WC, Kuo SC. The Use of hx-index to compare research achievements for ophthalmology authors in Mainland China, Hong Kong, and Taiwan since 2010. Medicine. 2021;100:8(e24868).
All data used in this study are available in Supplemental Digital Content files.
The authors have no funding and conflicts of interests to disclose.
The datasets generated during and/or analyzed during the current study are publicly available.
References
- [1].Mimouni M, Zayit-Soudry S, Segal O, et al. Trends in authorship of articles in major ophthalmology journals by gender, 2002-2014. Ophthalmology 2016;123:1824–8. [DOI] [PubMed] [Google Scholar]
- [2].Pekel E, Pekel G. Publication trends in corneal transplantation: a bibliometric analysis. BMC Ophthalmol 2016;16:194. [DOI] [PMC free article] [PubMed] [Google Scholar]
- [3].Zhao F, Shi B, Liu R, et al. Theme trends and knowledge structure on choroidal neovascularization: a quantitative and co-word analysis. BMC Ophthalmol 2018;18:86. [DOI] [PMC free article] [PubMed] [Google Scholar]
- [4].Hirsch JE. An index to quantify an individual's scientific research output. Proc Natl Acad Sci USA 2005;102:16569–72. [DOI] [PMC free article] [PubMed] [Google Scholar]
- [5].Nowak JK, Lubarski K, Kowalik LM, et al. H-index in medicine is driven by original research. Croat Med J 2018;59:25–32. [DOI] [PMC free article] [PubMed] [Google Scholar]
- [6].Vavryčuk V. Fair ranking of researchers and research teams. PLoS One 2018;13:e0195509. [DOI] [PMC free article] [PubMed] [Google Scholar]
- [7].Sekercioglu CH. Quantifying coauthor contributions. Science 2008;322:371. [DOI] [PubMed] [Google Scholar]
- [8].Chien TW, Wang HY, Lai Fj. Applying an author-weighted scheme to identify the most influential countries in research achievements on skin cancer: observational study. JMIR Dermatol 2019;2:e11015. [Google Scholar]
- [9].Huang MH, Chi PS. A comparative analysis of the application of h-index, g-index, and a-index in institutional-level research evaluation. J Library Inform Studi 2010;8:1–0. [Google Scholar]
- [10].Chen Y, Guo YB, Guo R, et al. Visual analysis of coronavirus disease 2019 (COVID-19) studies based on bibliometrics. Zhongguo Zhong Yao Za Zhi 2020;45:2239–48. [DOI] [PubMed] [Google Scholar]
- [11].Mataftsi A, Kappos N, Riga P, et al. Use of log-scaled crowded visual acuity charts in clinical studies regarding amblyopia. Graefes Arch Clin Exp Ophthalmol 2019;257:639–44. [DOI] [PubMed] [Google Scholar]
- [12].Ragghianti CP, Martínez R, Martins J, et al. Comparative study of scientific publications in ophthalmology and visual sciences in Argentina, Brazil, Chile, Paraguay and Uruguay (1995–2004). Arq Bras Oftalmol 2006;69:719–23. [DOI] [PubMed] [Google Scholar]
- [13].Synnestvedt MB, Chen C, Holmes JH. Visual exploration of landmarks and trends in the medical informatics literature. AMIA Annu Symp Proc 2005;2005:1129. [PMC free article] [PubMed] [Google Scholar]
- [14].Chien TW, Wang HY, Kan WC, et al. Whether article types of a scholarly journal are different in cited metrics using cluster analysis of MeSH terms to display: a bibliometric analysis. Medicine 2019;98:e17631. [DOI] [PMC free article] [PubMed] [Google Scholar]
- [15].Lin C.H., Chou P.H., Chou W., et al. Using the Kano model to display the most cited authors and affiliated countries in schizophrenia research. Schizophr Res 2020;216:422–8. [DOI] [PubMed] [Google Scholar]
- [16].Mimouni M, Zayit-Soudry S, Segal O, et al. Trends in authorship of articles in major ophthalmology journals by gender. Ophthalmology 2016;123:1824–8. [DOI] [PubMed] [Google Scholar]
- [17].Lindsey D. Further evidence for adjusting for multiple authorship. Scientometrics 1982;4:389–95. [Google Scholar]
- [18].Chien TW, Wang HY, Chang Y, et al. Using Google Maps to display the pattern of coauthor collaborations on the topic of schizophrenia: a systematic review between 1937 and 2017. Schizophr Res 2018;204:206–13. [DOI] [PubMed] [Google Scholar]
- [19].Fenner T, Harris M, Levene M, et al. A novel bibliometric index with a simple geometric interpretation. PLoS One 2018;13:e0200098. [DOI] [PMC free article] [PubMed] [Google Scholar]
- [20].Wright JK. Problems in Population Mapping in Notes on statistical mapping, with special reference to the mapping of population phenomena. American Geographical Society; Washington, Population Association of America, NY, 1938. 2019/4/4 available at https://www.worldcat.org/title/notes-on-statistical-mapping-with-special-reference-to-the-mapping-of-population-phenomena/oclc/5160537/. [Google Scholar]
- [21].Newman ME, Gastner MT. Diffusion-based method for producing density-equalizing maps. Proc Natl Acad Sci U S A 2004;101:7499–504. [DOI] [PMC free article] [PubMed] [Google Scholar]
- [22].Chen WJ. Dengue outbreaks and the geographic distribution of dengue vectors in Taiwan: a 20-year epidemiological analysis. Biomed J 2018;41:283–9. [DOI] [PMC free article] [PubMed] [Google Scholar]
- [23].Lai WT, Chen CH, Hung H, et al. Recognizing spatial and temporal clustering patterns of dengue outbreaks in Taiwan. BMC Infect Dis 2018;18:256. [DOI] [PMC free article] [PubMed] [Google Scholar]
- [24].Soetens L, Hahné S, Wallinga J. Dot map cartograms for detection of infectious disease outbreaks: an application to Q fever, the Netherlands and pertussis, Germany. Euro Surveill 2017;22:30562.doi: 10.2807/1560-7917.ES.2017.22.26.30562. [DOI] [PMC free article] [PubMed] [Google Scholar]
- [25].WHO. Schizophrenia Fact sheet. 2018/2/23 archived from the original reviewed April 2018 at HTTP://www.who.int/mediacentre/factsheets/fs397/en/. [Google Scholar]
- [26].Kano N, Seraku N, Takahashi F, et al. Attractive quality and must-be quality. J the Japn Soc Qual Contr 1984;41:39–48. [Google Scholar]
- [27].Cheng JW, Zong Y, Zeng YY, et al. The prevalence of primary angle closure glaucoma in adult Asians: a systematic review and meta-analysis. PLoS One 2014;9:e103222.Published 2014 Jul 24. [DOI] [PMC free article] [PubMed] [Google Scholar]
- [28].Chien TW. The hx-index shown on Google Maps. 2020/9/14 available at http://www.healthup.org.tw/gps/hxindexgoogle.asp?dataset=36;25;23;19;18.96;12;10;6;4;3.26;2;2. [Google Scholar]
- [29].Chien TW, Wang HY, Hsu CF, et al. Choropleth map legend design for visualizing the most influential areas in article citation disparities: a bibliometric study. Medicine (Baltimore) 2019;98:e17527. [DOI] [PMC free article] [PubMed] [Google Scholar]
- [30].Zhang CT. The h’-Index, effectively improving the h-Index based on the citation distribution. PLoS One 2013;8:e59912. [DOI] [PMC free article] [PubMed] [Google Scholar]
- [31].Zhang CT. The e-index, complementing the h-index for excess citations. The e-index, complementing the h-index for excess citations. PLoS One 2009;4:e5429. [DOI] [PMC free article] [PubMed] [Google Scholar]
- [32].Persson O. Analyzing bibliographic data to visualize representations. 2019/12/20 available at https://homepage.univie.ac.at/juan.gorraiz/bibexcel/index.html%3ffbclid=IwAR0FCL3Tjjmx2XyUI_ZKxfv12DYTGhGsStmU-MKzOECxQ2kJEglfouO_2aQ?fbclid=IwAR2SMJF-pnZ7dRDXzy8VgqPW0fzMZ0CIyGDNmtVPtsnDVOABx7WqfHTgyNE. [Google Scholar]
- [33].Liu MY, Chou W, Chien TW, et al. Evaluating the research domain and achievement for a productive researcher who published 114 sole-author articles: a bibliometric analysis. Medicine (Baltimore) 2020;99:e20334. [DOI] [PMC free article] [PubMed] [Google Scholar]
- [34].Efron B. Bootstrap methods: another look at the jackknife. Ann Stat 1979;7:1–26. [Google Scholar]
- [35].Kung SC, Chien TW, Yeh YT, et al. Using the bootstrapping method to verify whether hospital physicians have different h-indexes regarding individual research achievement: a bibliometric analysis. Medicine (Baltimore) 2020;99:e21552. [DOI] [PMC free article] [PubMed] [Google Scholar]
- [36].Kuo SC, Yeh YT, Kan WC, et al. The use of bootstrapping method to compare research achievements for ophthalmology authors in the US since. Scientometrics 2020;126:509–20. [Google Scholar]
Associated Data
This section collects any data citations, data availability statements, or supplementary materials included in this article.


