

Abstract
Intradialytic hypotension (IDH) is a hemodynamic phenomenon recently associated with decreased blood oxygen saturation (SO2). The ratio between peripheral oxygen saturation (SpO2) and central venous SO2 (ScvO2) or Oxygen Extraction Ratio (OER), which represents a roughly estimate of the amount of oxygen claimed by peripheral tissues, might be used to estimate haemodialysis (HD) related hypoxic stress. Aim of this pilot study was to evaluate the relationship between OER increments during dialysis sessions (ΔOER) and episodes of IDH. We enrolled chronic HD patients with permanent central venous catheter (CVC) and no fistula, in whom ScvO2 measurement is at hand. OER ([(SpO2 − ScvO2)/SpO2] × 100) was measured in three consecutive HD sessions (HD OER sessions) before HD, after 15′, 30′ and 60′ min and at the end of HD. Then, a one-year follow-up was planned to record the number of IDH episodes. In the 28 enrolled patients (age 74 ± 2.6 years), during 12 ± 1.2 months of follow up, incidence of IDH was 3.6%. We divided patients into two groups, above or below the median value of ΔOER at the end of HD, which was 36%. In these groups, the average incidence of IDH was 7% and 2% respectively (p < 0.01), while OER values before HD were not different. Notably, in the high ΔOER group the OER increment was evident since after 15′ and was significantly higher than in the low ∆OER group (∆OER-15′ = 19 ± 3.0% vs. 9.0 ± 3.0%; p < 0.05). By comparison, blood volume changes overlapped in the two groups (average change − 9 ± 0.8%). Values of ∆OER > 19% after only 15′ of HD treatment or > 36% at the end of the session characterize patients with higher rates of hypotension. Intradialytic ∆OER, a parameter of tissue hypoxic stress, identifies more fragile patients at greater risk of IDH.
Subject terms: Nephrology, Renal replacement therapy, Haemodialysis
Introduction
Intradialytic hypotension (IDH) is a common hemodynamic phenomenon observed in haemodialysis (HD) patients, leading to a reduced tolerance of therapy. Patients typically report symptoms like abdominal discomfort, nausea, yawning, muscle cramps, restlessness and syncope. Since the definition of IDH is not uniform, its exact incidence, which varies from 7.5 to 69% according to the diagnostic criteria considered1,2, is not determined yet. However, most definitions include at least one of the following conditions: (1) reduction in blood pressure (BP) under specific thresholds, (2) intradialytic symptoms, (3) the need of medical intervention during haemodialysis session to restore blood volume (BV)1. In addition, IDH is associated with poor quality of life and higher mortality rate3,4. In clinical practice, intradialytic monitoring systems are able to assess patient hemodynamic parameters such as BP, BV and heart rate (HR). Nevertheless, these devices do not detect clinical conditions that might increase the risk for IDH and therefore, do not allow to adopt preventive strategies. Recently, a new non-invasive hemodynamic parameter measured by some dialysis machines: oxygen saturation, has been associated to episodes of IDH. This parameter must to have an important pathogenetic role in IDH but might also contribute to explain the increased mortality rate of HD patients. In fact, during HD sessions, both arterial oxygen saturation (SaO2) and central venous oxygen saturation (ScvO2, normal value 70–80%)5 decline in IDH prone patients, suggesting that either or both of these indices could be helpful predictors of IDH and fragility6–8. In particular, ScvO2 is lower in HD patients than in general population and its further reduction during HD could be secondary to the reduction of SaO2 (as in case of chronic lung diseases) but more likely to an increased parenchymal extraction of O27–9. A more sensitive way to evaluate hypoxic phenomenon is by Oxygen Extraction Ratio (OER), i.e., the percentage of extracted oxygen in peripheral tissues, which is defined as the ratio between SaO2 and ScvO2. Major determinants of OER values are cardiac output, blood oxygen availability and peripheral oxygen consumption. Normal values are estimated to range between 20 and 30% in resting conditions, but can increase up to 70%, for example during cycling10. Thus, similarly to heart rate or breath frequency, OER values could provide an estimate of the individual cardiocirculatory and haemodynamic condition. However, due to the invasiveness of measuring ScvO2 few studies evaluate OER. In normal subjects, data have been reported during mountain ascending11 or while cycling10. In patients, OER has been used to evaluate the exercise capacity in adults with heart failure12 or the need of blood transfusions in anaemic children receiving cardiac surgery13. In intensive care Unit, OER is regarded as an index of parenchymal stress and oxygen consumption, and values > 50% are considered to be indicative of haemodynamic shock and worse prognosis14,15. Since OER measurement is handy in dialysis patients with central venous catheter (CVC), we recently evaluated it before and during HD sessions in a pilot study. We demonstrated that patients showing lower resting pre-HD OER values (< 32%) and/or greater OER increments (∆OER > 40%) after HD had higher mortality rate16. Also, in this same work, we could appreciate that OER values are rather stable and repeatable in the single patient, thus pointing to its potential usefulness to describe the hemodynamic capacity of a patient. As such, OER could theoretically represent a widely available, novel and simple tool to identify more fragile patients with significant subclinical HD-induced drop in cardiac output, tissue hypoxia and parenchymal stress, deserving increased attention. For all of these reasons, we considered useful to evaluate possible associations between OER change during HD (representative of cardiac output and development of subclinical ischemic injury) and IDH. To the best of our knowledge, no published paper correlates OER and IDH.
Methods
We designed a prospective, single center (Nephrology Unit at Polo Pontino, Sapienza University of Rome), observational study (“OER as a measurement of HD induced tissue hypoxia”) involving HD patients receiving treatment thrice a week via permanent jugular central venous catheter (CVC). The study was approved in 2017 by the “Comitato Etico Lazio 2” EC (prot. N°107055/2017, https://www.aslroma2.it/COMITATOETICO/), was conducted in accordance with the declaration of Helsinki and received informed consent approval from all involved patients. Data for this study represent a sub-analysis aiming at evaluating the association between OER change during HD (ΔOER) and IDH.
Inclusion criteria were: patients age ≥ 18 years, undergoing chronic HD treatment since at least 3 months via permanent jugular CVC, with no evidence of acute underlying illness. Exclusion criteria were: less than 3 months of follow-up, presence of arteriovenous fistula17, evidence of displaced or malfunctioning CVC (checked with chest x-rays and CVC recirculation test), Chronic Obstructive Pulmonary Disease or peripheral oxygen saturation (SpO2) < 90% in resting condition. In addition, patients with severe refractory anemia (Hb < 9 g/dl despite adequate erythropoietin administration and iron supplement therapy), congestive heart failure (NYHA class ≥ II) and severe peripheral vascular ischemia were excluded.
The planned recruitment time was 3 months. In the first week after enrollment, we evaluated OER in three consecutive HD sessions (HD OER sessions) at 5 different time points: before HD, at 15, 30, 60 min since the beginning of HD and post-HD. For the purpose of statistical analysis, we considered the mean OER value obtained of the three HD OER sessions. During the follow-up, IDH episodes were recorded for each patient and for up to one-year. IDH was defined, according to K/DOQI guidelines, as the occurrence of either/or any of the following: (1) a decrease in systolic blood pressure > 20 mmHg, or a decrease in mean arterial pressure > 10 mmHg; (2) the presence of symptoms of end-organ ischemia; (3) the need for intervention carried out by the dialysis staff18.
OER and delta OER (ΔOER) were calculated using the following formula:
where T0 is pre-HD OER and Tx is the value obtained at the established times.
SpO2 was monitored via peripheral pulse-oximetry device (Max Puls Two, Eurosanitas Italy; accuracy of SpO2 measurement = 2%). Patients wore the finger oximeter during HD OER sessions, and SpO2 values were recorded at the established times. Pre-HD ScvO2 was sampled from the arterial line of the CVC after discarding 20 ml of blood and before connection to the extracorporeal circuit, while, during dialysis, blood was sampled from the arterial line of the dialysis circuit. Blood gas analysis was immediately performed with a dedicated equipment (GEM 4000 premier, Instrumentation Laboratory Italy; accuracy of SO2 measurement = 2%). In order to avoid pre-analytical artifacts, handling of blood for gas analysis was standardized according to the manufacturer′s instructions.
All patients received standard bicarbonate dialysis, according to their individual prescriptions of electrolyte concentrations as well as blood and dialysate flows. The HD OER sessions lasted 4 h and during these sessions patients were fasting. Dialyzer membrane was polyaryletheresufone in all, with surface tailored to the patient body surface. Blood volume changes were measured by the optical probe with which the Artis dialysis machine (Baxter srl) is equipped and which is located on the arterial line of the extracorporeal circuit. Blood volume changes are derived from changes in hemoglobin concentration. All patients were connected to the extracorporeal circuit without initial hemorrhage. To increase tolerance to treatment, it is standard policy of our Center to keep ultrafiltration rate at ≤ 10 ml/kg/h and maintain a dialysate temperature between 35.5 and 36.0 °C.
Statistical analysis
Since this is a pilot study for purely exploratory purposes, a formal calculation of the sample size was not carried out. We arbitrarily decided to enroll a minimum of 20 patients. Data are expressed as mean ± standard error (SE) for Gaussian variables. We used the Shapiro test to evaluate normality of continuous measurements. Chi-squared test was used for qualitative variables. Significant statistical differences among various predictors and time were evaluated by mixed-effects linear regression analysis and repeated measures ANOVA and multiple tests were adjusted through Bonferroni correction. The global level for statistical significance was pre-specified as 5%. T-test or parametric ANOVA were used to compare measurements among groups for quantitative variables. Bonferroni's adjusted pairwise comparisons were used to compare groups in pairs if parametric ANOVA was significant. All tests were two tailed and (adjusted) p values < 0.05 were considered as statistically significant.
Analyses were performed using the open-source software package R, 3.4.0 version.
Ethical standards
All the procedures involving humans in this study were in agreement with common and standard clinical practice and in accordance with institutional and/or national research committee and with the 1964 Helsinki Declaration and its later amendments or comparable ethical standards.
Results
Between 01/01/2017 and 31/03/2017, from a total of 32 patients receiving haemodialysis with a permanent jugular CVC, 28 (13 males and 15 females, aged 74 ± 2.6 years, receiving replacement therapy since an average of 46 ± 6.5 months) fulfilled the inclusion criteria and consented to be enrolled for the study. Four patients (65 ± 9 years, 2 males and 2 females) were excluded, for the presence of arteriovenous fistula (two), for SpO2 < 90% in resting condition (one) and for less than three months of follow-up (one). Thus 28 patients, whose clinical and biochemical characteristics are shown in Table 1, were followed up for 12 ± 1.2 months to record IDH episodes (study closed on 31/03/2018). As reported in the table, two patients were obese (10%), eleven had diabetes mellitus (39%) and twenty-six had vascular co-morbidities (93%). In addition, 93% had hypertension while history of ischemic heart disease and peripheral vasculopathy were present in 50% and 61% of the patients, respectively. During the three HD sessions for OER behavior determination, all patients remained asymptomatic. Pre HD OER values and the intradialytic OER trends overlapped in the three HD OER sessions (supplementary material Figure 1). The maximum calculated difference of pre HD OER in the individual patient was 5.5%, in agreement with previously published data showing a maximum individual variability of 6.6%16. In the whole population pre-HD OER averaged 34 ± 1.4%, and reached 46 ± 1.8% post-HD, with a resulting average ∆OER of 39 ± 5% (Table 1). SpO2 did not change during HD OER sessions (Fig. 1), while ScvO2 decreased significantly from 63 ± 3.5 to 53 ± 3.0% (Fig. 1 p < 0.001). In the three HD OER sessions, the average reduction of BV was − 9 ± 0.8%. The intradialytic increment of OER was significant since after 15 min (OER 15′: 40 ± 1.2%; p < 0.001 vs pre-HD OER) and was followed by a progressive increase up to the final post-HD value (p < 0.0001) (Fig. 1). During follow up, we monitored 4342 HD sessions with 188 episodes of IDH (defined as above), which were recorded at least once in 24/28 patients, and produced a median incidence of 3.6% episodes (range between 0 and 15%).
Table 1.
Clinical and biochemical characteristics of enrolled patients.
| Clinical and biochemical characteristics (n 28) | |
|---|---|
| Male/female, n (%) | 13 (46)/15 (54) |
| Age, years | 74.4 ± 2.6 |
| HD vintage, months | 46.5 ± 6.5 |
| BMI | 26.4 ± 1.2 |
| Diabetes mellitus, n (%) | 11 (39%) |
| Hypertension, n (%) | 26 (93%) |
| Vascular co-morbiditiesa, n (%) | 26 (93) |
| Systolic BP, mmHg | 127 ± 3.6 |
| Diastolic BP, mmHg | 69 ± 2.2 |
| MAP, mmHg | 88 ± 2.4 |
| HR, bpm | 75 ± 5.2 |
| Hb, g/dl | 10.2 ± 0,4 |
| CRP, mg/dl | 2.2 ± 0.5 |
| ESR, mm | 36 ± 4.7 |
| Ferritin, mcg/l | 174 ± 12 |
| Albumin, g/dl | 3.1 ± 0.1 |
| Na, meq/l | 141 ± 3.1 |
| K, meq/l | 5.5 ± 1.1 |
| HCO3−, meq/l | 23.4 ± 4.2 |
| Ca, mg/dl | 8.4 ± 0.1 |
| P, mg/dl | 5.3 ± 0.2 |
| PTH, pg/ml | 311 ± 30 |
| UF, ml/h/kg | 7 ± 0.6 |
| ScvO2 pre-HD, % | 63 ± 3.5 |
| ScvO2 post-HD, % | 53 ± 3.0 |
| SpO2 pre HD, % | 96 ± 0.5 |
| SpO2 post HD, % | 98 ± 0.4 |
| OER pre-HD | 34 ± 1.4 |
| OER post-HD | 46 ± 1.8 |
| ∆OER, % | 39 ± 5.0 |
| BV post-HD, % | − 9 ± 0.8 |
Data are expressed as mean ± SE.
HD: haemodialysis; BMI: body mass index; BP: blood pressure; MAP: mean arterial pression; HR: heart rate; Hb: haemoglobin; CRP: C-reactive protein; ESR: erythrocyte sedimentation rate; Na: sodiemia; HCO3−: bicarbonate; Ca: calcemia; P: phosphatemia; PTH: parathormone; UF: ultrafiltration rate; ScvO2: central venous SO2; SpO2: peripheral oxygen saturation; OER: oxygen extraction ratio; ∆OER: variation in OER; BV: blood volume.
aVascular co-morbidities: hypertension, ischemic heart disease, peripheral vasculopathy.
Figure 1.
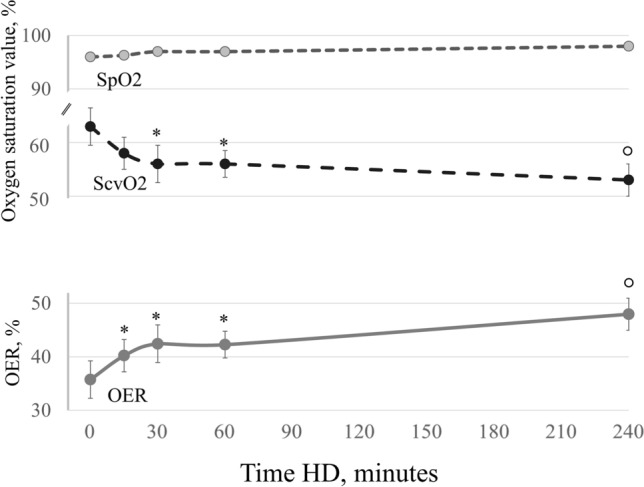
Oxygen saturation trends during dialysis. In the population as a whole, SpO2 was stable, while ScvO2 decreased after 30 min and OER increased after 15 min of HD initiation (repeated measures ANOVA: p < 0.001 for both variables). Bonferroni post-hoc test vs. basal values: *p < 0.01; °p < 0.001. SpO2: peripheral oxygen saturation; ScvO2: central venous oxygen saturation; OER: oxygen extraction rate; HD: hemodialysis.
To assess the link between ∆OER and IDH, we divided patients into two groups according to the median ∆OER value (threshold at 36%). As shown in Table 2, these two groups had similar age (76 ± 2.4 vs 73 ± 3.0 years; p = n.s.), HD vintage (52 ± 8.6 vs 40 ± 4.0 months; p = n.s.), systolic BP (125 ± 3.2 vs 129 ± 4.0 mmHg; p = n.s.), diastolic BP (67 ± 2.2 vs 70 ± 2.2 mmHg; p = n.s.), HR (70 ± 2.2 vs. 76 ± 2.3 bpm; p = n.s.) and other biomarkers of anaemia, inflammation and pre- and post-HD values of electrolytes. Before and after HD, ScvO2 values were non-significantly different between the groups (respectively, 62 ± 3.5 vs 66 ± 3.0; p = n.s. and 53 ± 3.0 vs 51 ± 3.0; p = n.s.), similarly to the intradialytic trend (Table 2 and Fig. 2). As for OER, pre-HD values were not different between the groups (Table 2), but during session the percent increment was significantly higher since after 15 min in the high ∆OER compared to the low ∆OER group (19 ± 3.0% vs. 9.0 ± 3.0% respectively; p = 0.009), a difference that persisted after 30 min (26 ± 3.0% vs. 10 ± 4.0%; p = 0.037), and 60 min of treatment (27 ± 4.0% vs. 8 ± 4.6%; p = 0.001) (Fig. 3). By comparison, blood volume reduction overlapped in these two groups (− 9 ± 0.4 vs − 9 ± 1.6 p = n.s.) (Fig. 4).
Table 2.
Characteristics of patients divided according to the median ΔOER% final value.
| Characteristics of patients divided according to the median ΔOER% final value (threshold 36%) | p | ||
|---|---|---|---|
| ΔOER ≤ 36% (n 14) | ΔOER > 36% (n 14) | ||
| Age, years | 76.4 ± 2.4 | 73.3 ± 3.0 | 0.440 |
| HD vintage, months | 52.2 ± 8.6 | 40.3 ± 4.0 | 0.218 |
| Diabetes mellitus, n (%) | 5 (36) | 6 (42) | 0.815 |
| Hypertension, n (%) | 12 (85) | 14 (100) | 0.820 |
| Vascular co-morbiditiesa, n (%) | 13 (93) | 13 (93) | 0.999 |
| Anti-hypertensive drugs, n(%) | 12 (85) | 14 (100) | 0.820 |
| Pre-HD systolic BP, mmHg | 125 ± 3.2 | 129 ± 4.0 | 0.401 |
| Pre-HD diastolic BP, mmHg | 67 ± 2.2 | 70 ± 2.2 | 0.341 |
| Post-HD systolic BP, mmHg | 131 ± 3.0 | 130 ± 3.0 | 0.816 |
| Post-HD diastolic BP, mmHg | 71 ± 2.2 | 73 ± 2.2 | 0.526 |
| Pre-HD HR, bpm | 74 ± 4.8 | 76 ± 5.6 | 0.870 |
| Post-HD HR, bpm | 72 ± 5.0 | 71 ± 4.5 | 0.921 |
| UF, ml/h/kg | 7 ± 0.6 | 6 ± 0.6 | 0.062 |
| UF total, L | 2.0 ± 0.1 | 2.2 ± 0.5 | 0.820 |
| Hb, g/dl | 10.1 ± 0,4 | 10.3 ± 0,2 | 0.850 |
| CRP, mg/dl | 2.2 ± 0.5 | 2.1 ± 0.6 | 0.820 |
| ESR, mm | 36 ± 4.7 | 34 ± 5.0 | 0.630 |
| Albumin, g/dl | 3.1 ± 0.1 | 3.0 ± 0.2 | 0.880 |
| Na pre-HD, mmol/l | 140 ± 2.2 | 141 ± 3.5 | 0.921 |
| Na post-HD, mmol/l | 139 ± 1.8 | 140 ± 3.0 | 0.890 |
| K pre-HD, mmol/l | 5.6 ± 1.6 | 5.4 ± 1.0 | 0.860 |
| K post-HD, mmol/l | 3.5 ± 0.8 | 3.4 ± 0.7 | 0.880 |
| HCO3– pre-HD , mmol/l | 22.3 ± 3.8 | 23.4 ± 4.5 | 0.845 |
| HCO3– post-HD , mmol/l | 27.2 ± 1.3 | 26.5 ± 1.4 | 0.900 |
| HD treatments, n | 2197 | 2145 | |
| IDH episodes, n | 64 | 124 | |
| IDH episodes, % | 2 | 7 | 00.01 |
| Follow-up time, months | 12 ± 1.0 | 12 ± 1.1 | 0.060 |
| ScvO2 pre-HD, % | 62 ± 3.5 | 66 ± 3.0 | 0.780 |
| ScvO2 post-HD, % | 53 ± 3.0 | 51 ± 3.0 | 0.720 |
| SpO2 pre HD, % | 97 ± 0.5 | 96 ± 0.5 | 0.830 |
| SpO2 post HD, % | 98 ± 0.4 | 98 ± 0.4 | 0.920 |
| OER pre-HD | 36 ± 1.6 | 30 ± 1.5 | 0.055 |
| OER post-HD | 45 ± 1.7 | 47 ± 1.6 | 0.399 |
| ∆OER, % | 23 ± 3.0 | 55 ± 3.6 | 0.001 |
| BV post HD, % | − 9 ± 1.6 | − 9 ± 0.4 | 0.990 |
Data are expressed as mean ± SE.
Chi-squared test for qualitative variables and T-test for quantitative variables were used to compare measurements between groups.
∆OER: variation in OER; IDH: intradialytic hypotension; HD: hemodialysis; BP: blood pressure; HR: heart rate: UF: ultrafiltration rate; Hb: hemoglobin; CRP: C-reactive protein; ESR: erythrocyte sedimentation rate; ScvO2: central venous SO2 SpO2: peripheral oxygen saturation; OER: oxygen extraction ratio; BV: blood volume.
aVascular co-morbidities: hypertension, ischemic heart disease, peripheral vasculopathy.
Figure 2.

Comparison of ScvO2 trends during HD between the two groups ΔOER > 36% and ΔOER ≤ 36%. ScvO2 decreased significantly (ANOVA, p < 0.001) in both groups but without differences between them, in particular after 30 min. ScvO2: central venous oxygen saturation; ∆OER: percent change in OER; HD: haemodialysis.
Figure 3.

During HD ∆OER increased in both groups with either low or high ΔOER (repeated measures ANOVA, p < 0.001), but in the ΔOER > 36% group the increment was significantly higher than in the ΔOER ≤ 36% group after 15 min, 30 min and 60 min. Bonferroni post-hoc test, ΔOER > 36% vs. ΔOER ≤ 36% *p < 0.05; °p < 0.001. ∆OER: percent change in OER; HD: haemodialysis;
Figure 4.

Overlapping trends of hemodialysis induced changes in blood volume in ΔOER > 36% and ΔOER ≤ 36% groups.
During follow-up, which lasted 12 ± 1.0 months in both groups and included a total of 2197 and 2145 HD sessions in the low and high ∆OER groups respectively, IDH events were 64 (2.0%) in the former and 124 (7%) in the last (p < 0.01) (Table 2; Fig. 5). Moreover, if we divided patients according to the median IDH incidence (threshold 3.6%) the higher incidence group had greater post-HD ∆OER % than the lower incidence group (44 ± 3.6 vs. 35 ± 3.0%; p 0.044, respectively, supplementary material Table 1).
Figure 5.
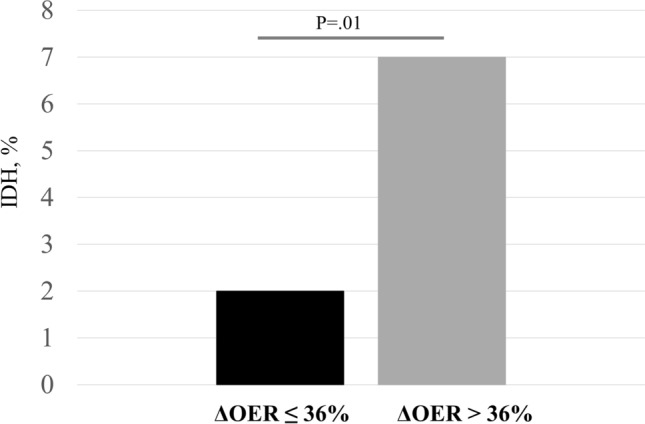
The ΔOER > 36% group had higher IDH incidence than ΔOER ≤ 36% group. Bonferroni test p 0.01. ∆OER: percent change in OER; IDH: intradialytic hypotension.
By comparison, if we divided patients according to the median BV reduction, no difference emerged in the prevalence of IDH (supplementary materials Table 2).
Discussion
Our data show that intradialytic ∆OER, a measurement of tissue hypoxic stress differs in patients with different rates of IDH. In particular, a percentage increment > 19% since after 15 min of treatment or a final increment > 36% could be helpful to identify patients at higher risk of hemodynamic instability. The pathogenesis of IDH is multifactorial and involves mechanism responsible for a drop in cardiac output, like ultrafiltration rate, electrolyte shifts, and biocompatibility of solutions and/or of membranes. Other recently discovered biomarkers of mineral and bone disorders now regarded as additional long-term cardiovascular risk factor in HD patients19,20 could be at play, but their acute effects are not still evaluated. At variance, during each HD session the rapid hemodynamic changes produced by dialysis inevitably induce an acute hypoxic stress that in some patients becomes clinically relevant thus representing a further burden to the cardiovascular system. These episodes are secondary to reduced cardiac output with the eventual low oxygen delivery and increased parenchymal tissues demand6,17. Both ultrafiltration rate and the dialytic procedure per se can lead to parenchymal stress responsible for IDH16,21–25. In our study, in the three HD OER sessions monitored at enrollment, OER increased progressively in all patients with an average end of dialysis ∆OER of 39% (Fig. 1). This is in perfect agreement with the available evidence16 of HD related hypoxic stress which is not sensed by the patients and is not detected by commonly available parameters like BP and HR6,7,16,26–28. Therefore, ∆OER seems to offer a prompt and direct measurement of the hypoxic stress produced by HD and could thus represent a useful tool to identify more fragile patients. As predictable, also ScvO2 changed during HD (significant drop after 30 min, Fig. 1) but later than OER which increased since after 15 min, thus resulting more sensitive. Notably, in our study the incidence of IDH (3.6%) was significantly lower than the average 20% most frequently reported in the literature29,30. This low incidence of IDH in our population can be explained by our standard policy of keeping ultrafiltration rates at ≤ 10 ml/kg/h and dialysate temperature at 35.5–36.0 °C to increase hemodynamic stability31,32. Therefore, we can underline that ∆OER was sensitive even in a population with low prevalence of IDH. Also, in our study, the two groups of patients obtained according to the median ΔOER threshold had similar prevalence of comorbidities and similar HD related parameters (like UF rates, BP, HR etc. see Table 2). Notably, pre-HD OER values, which were not different between the two groups (36 ± 1.6 vs 30 ± 1.5 respectively in the low- and high- ∆OER groups), were on average higher than the normal reference of 20% in resting conditions, suggesting that uremic patients have an increased oxygen requirement even when inactive. In addition, in the high ΔOER group with greater incidence of IDH (Fig. 5), OER increment was remarkably greater than the more stable group after only 15 min (19% vs 8%, respectively) (Fig. 3). Therefore, since we measured OER during three consecutive and asymptomatic HD sessions, values of ∆OER > 19% since after 15 min could be an early and sensitive indicator of hypoxic stress, capable of identifying cases at increased risk of IDH. Our results also describe how the response to the hypoxic stress can be different among patients. In particular, the increment of OER was rather smooth and progressive in the ΔOER ≤ 36% group and sharp and rapid in the ΔOER > 36% group, suggesting a maladaptive response in the latter. Thus, also OER trends could be helpful to recognize patients that are more sensitive to the hemodialysis-related cardio-circulatory stress.
A major limitation of OER measurement technique is that it can be exclusively applied to patients with CVC and without a fistula. However, CVC use in HD, although not recommended, is nonetheless necessary in many patients with poor vascular system, who are also fragile and with a higher risk of IDH and mortality rate. Therefore, in this population, the implementation of a new hemodynamic parameter measurable during HD session, such as OER, could be useful in clinical practice. Another limitation of our study is the small number of patients enrolled. However, this was a pilot study and it is important that differences have been detected even with such a low number of cases and in a population with a low prevalence of IDH episodes, using a cheap, non-sophisticated and commonly available equipment. A multicenter study including hundreds of patients is now warranted to confirm our results and to evaluate the association with other outcomes like quality of life and overall and cardiovascular mortality. Also, in a next future, we need to know how much resting values of OER are stable over time in the individual patient. Our data from a previous study16 suggest a significant stability in the short term; however, we need to characterize how much resting and HD induced changes in OER are affected by occasional or chronic clinical events.
In conclusion, measurement of ∆OER as early as 15 min after initiation or at the end of HD sessions could be a new and simple way to identify hemodynamically fragile patients. Efforts are warranted to test if adopting preventive measures in patients identified with OER changes, effectively allow to reduce the rate of IDH.
Supplementary Information
Acknowledgements
We acknowledge all the nurse staff at ICOT Hospital Dialysis Unit, Polo Pontino Sapienza, whose extra-work made the study possible. In particular, head nurse Cristina De Santis for organization and patience and nurse Nakita Lanzano for special commitment and interest in collecting data.
Author contributions
S.M. and S.R. designed experiments; S.M., S.R., D.B., N.D.M., and M.P. wrote the main manuscript text; S.R., M.L.M., S.C. and L.T. performed experiments; S.M, S.R, M.P. and S.C. analyzed data; S.M., M.P. and S.R. performed figures, S.M. supervised paper. All authors reviewed the manuscript.
Competing interests
The authors declare no competing interests.
Footnotes
Publisher's note
Springer Nature remains neutral with regard to jurisdictional claims in published maps and institutional affiliations.
Supplementary Information
The online version contains supplementary material available at 10.1038/s41598-021-84375-7.
References
- 1.Kanbay M, et al. An update review of intradialytic hypotension: Concept, risk factors, clinical implications and management. Clin. Kidney J. 2020;13(6):981–993. doi: 10.1093/ckj/sfaa078. [DOI] [PMC free article] [PubMed] [Google Scholar]
- 2.Assimon MM, Flythe JE. Definitions of intradialytic hypotension. Semin. Dial. 2017;30:464–472. doi: 10.1111/sdi.12626. [DOI] [PMC free article] [PubMed] [Google Scholar]
- 3.Yu J, Liu Z, et al. Intradialytic hypotension as an independent risk factor for long-term mortality in maintaining hemodialysis patients: A 5-year follow-up cohort study. Blood Purif. 2018;45:320–326. doi: 10.1159/000486231. [DOI] [PubMed] [Google Scholar]
- 4.Stefansson BV, et al. Intradialytic hypotension and risk of cardiovascular disease. Clin. J. Am. Soc. Nephrol. 2014;9:2124–2132. doi: 10.2215/CJN.02680314. [DOI] [PMC free article] [PubMed] [Google Scholar]
- 5.Barratt-Boyes BG, Wood EH. The oxygen saturation of blood in the venae cavae, right-heart chambers, and pulmonary vessels of healthy subjects. J. Lab. Clin. Me. 1957;50:93–106. [PubMed] [Google Scholar]
- 6.Mancini E, et al. Italian Oxygen Saturation Study Group (SOGLIA): Intra-dialytic blood oxygen saturation (SO2): Association with dialysis hypotension (the SOGLIA Study) J. Nephrol. 2017;30:811–819. doi: 10.1007/s40620-016-0346-x. [DOI] [PubMed] [Google Scholar]
- 7.Chan L, et al. Intradialytic central venous oxygen saturation is associated with clinical outcomes in hemodialysis patients. Sci. Rep. 2017;7:8581. doi: 10.1038/s41598-017-09233-x. [DOI] [PMC free article] [PubMed] [Google Scholar]
- 8.Cordtz J, et al. Central venous oxygen saturation and thoracic admittance during dialysis: New approaches to hemodynamic monitoring. Hemodial Int. 2008;12:369–377. doi: 10.1111/j.1542-4758.2008.00283.x. [DOI] [PubMed] [Google Scholar]
- 9.Kooman JP, et al. Hemodialysis: A model for extreme physiology in a vulnerable patient population. Semin. Dial. 2018;31:500–506. doi: 10.1111/sdi.12704. [DOI] [PubMed] [Google Scholar]
- 10.Beck KC, et al. Relationship between cardiac output and oxygen consumption during upright cycle exercise in healthy humans. J. Appl. Physiol. 2006;101:1474. doi: 10.1152/japplphysiol.00224.2006. [DOI] [PubMed] [Google Scholar]
- 11.Martin DS, Xtreme Alps Research Group et al. Systemic oxygen extraction during exercise at high altitude. Br. J. Anaesth. 2015;114(4):677–682. doi: 10.1093/bja/aeu404. [DOI] [PMC free article] [PubMed] [Google Scholar]
- 12.Dhakal BP, et al. Mechanisms of exercise intolerance in heart failure with preserved ejection fraction: The role of abnormal peripheral oxygen extraction. Circ. Heart Fail. 2015;8:286–294. doi: 10.1161/CIRCHEARTFAILURE.114.001825. [DOI] [PMC free article] [PubMed] [Google Scholar]
- 13.Nasser B, et al. Effects of blood transfusion on oxygen extraction ratio and central venous saturation in children after cardiac surgery. Ann. Saudi Med. 2017;37:31–37. doi: 10.5144/0256-4947.2017.31. [DOI] [PMC free article] [PubMed] [Google Scholar]
- 14.Park JS, et al. Initial low oxygen extraction ratio is related to severe organ dysfunction and high in-hospital mortality in severe sepsis and septic shock patients. J. Emerg. Med. 2015;49:261–267. doi: 10.1016/j.jemermed.2015.02.038. [DOI] [PubMed] [Google Scholar]
- 15.Gutierrez G. Wulf-Gutierrez, ME & Reines HD Monitoring oxygen transport and tissue oxygenation. Curr. Opin. Anaesthesiol. 2004;17:107–117. doi: 10.1097/00001503-200404000-00004. [DOI] [PubMed] [Google Scholar]
- 16.Rotondi S, et al. Oxygen extraction ratio (OER) as a measurement of hemodialysis (HD) induced tissue hypoxia: A Pilot Study. Sci. Rep. 2018;8:5655. doi: 10.1038/s41598-018-24024-8. [DOI] [PMC free article] [PubMed] [Google Scholar]
- 17.Rotondi S, et al. A new technique for measuring fistula flow using venous blood gas oxygen saturation in patients with a central venous catheter. Clin. Kidney J. 2019;13:184–187. doi: 10.1093/ckj/sfz064. [DOI] [PMC free article] [PubMed] [Google Scholar]
- 18.K/DOQI Workgroup K/DOQI clinical practice guidelines for cardiovascular disease in dialysis patients. Am J Kidney Dis. 2015;45:S1–S153. [PubMed] [Google Scholar]
- 19.Cozzolino M, Mazzaferro S. The fibroblast growth factor 23: A new player in the field of cardiovascular, bone and renal disease. Curr. Vasc. Pharmacol. 2010;8(3):404–411. doi: 10.2174/157016110791112313. [DOI] [PubMed] [Google Scholar]
- 20.Mazzaferro S, et al. News on biomarkers in CKD-MBD. Semin. Nephrol. 2014;34(6):598–611. doi: 10.1016/j.semnephrol.2014.09.006. [DOI] [PubMed] [Google Scholar]
- 21.Harrison LEA, Selby NM, McIntyre CW. Central venous oxygen saturation: A potential new marker for circulatory stress in haemodialysis patients? Nephron Clin. Pract. 2014;128:57–60. doi: 10.1159/000362557. [DOI] [PubMed] [Google Scholar]
- 22.Zhang H, Chan L, et al. Association between intradialytic central venous oxygen saturation and ultrafiltration volume in chronic hemodialysis patients. Nephrol. Dial Transplant. 2018;33:1636–1642. doi: 10.1093/ndt/gfx271. [DOI] [PMC free article] [PubMed] [Google Scholar]
- 23.Sato M, Morita H, Ema H, Yamaguchi S, Amano I. Effect of different dialyzer membranes on cutaneous microcirculation during hemodialysis. Clin. Nephrol. 2006;66:426–432. doi: 10.5414/CNP66426. [DOI] [PubMed] [Google Scholar]
- 24.Raidis PC, Papadimitriou M, Metaxas P, Valtis DJ. Haemoglobin oxygen dissociation curve in patients on regular haemodialysis. Proc. Eur. Dial Transplant Assoc. 1977;14:200–206. [PubMed] [Google Scholar]
- 25.Soliani F, et al. Intradialytic changes of the oxyhaemoglobin dissociation curve during acetate and bicarbonate haemodialysis. Possible interactions with haemodialysis-associated hypoxaemia. Nephrol. Dial Transplant. 1990;5(Suppl 1):119–121. doi: 10.1093/ndt/5.suppl_1.119. [DOI] [PubMed] [Google Scholar]
- 26.McIntyre CW, Crowley L. Dying to feel better: The central role of dialysis-induced tissue hypoxia. Clin. J. Am. Soc. Nephrol. 2016;11:549–551. doi: 10.2215/CJN.01380216. [DOI] [PMC free article] [PubMed] [Google Scholar]
- 27.McIntyre CW, et al. Hemodialysis-induced cardiac dysfunction is associated with an acute reduction in global and segmental myocardial blood flow. Clin. J. Am. Soc. Nephrol. 2008;3:19–26. doi: 10.2215/CJN.03170707. [DOI] [PMC free article] [PubMed] [Google Scholar]
- 28.McIntyre CW. Recurrent circulatory stress: The dark side of dialysis. Semin. Dial. 2010;23:449–451. doi: 10.1111/j.1525-139X.2010.00782.x. [DOI] [PubMed] [Google Scholar]
- 29.Kuipers J, et al. The prevalence of intradialytic hypotension in patients on conventional hemodialysis: A systematic review with meta-analysis. Am. J. Nephrol. 2019;49:497–506. doi: 10.1159/000500877. [DOI] [PMC free article] [PubMed] [Google Scholar]
- 30.Okoye OC, Slater HE, Rajora N. Prevalence and risk factors of intra-dialytic hypotension: A 5 year retrospective report from a single Nigerian Centre. Pan Afr. Med. J. 2017;28:62. doi: 10.11604/pamj.2017.28.62.13743. [DOI] [PMC free article] [PubMed] [Google Scholar]
- 31.Flythe JE, Kimmel SE, Brunelli SM. Rapid fluid removal during dialysis is associated with cardiovascular morbidity and mortality. Kidney Int. 2011;79:250–257. doi: 10.1038/ki.2010.383. [DOI] [PMC free article] [PubMed] [Google Scholar]
- 32.Saran R, et al. Longer treatment time and slower ultrafiltration in hemodialysis: Associations with reduced mortality in the DOPPS. Kidney Int. 2006;69:1222–1228. doi: 10.1038/sj.ki.5000186. [DOI] [PubMed] [Google Scholar]
Associated Data
This section collects any data citations, data availability statements, or supplementary materials included in this article.