

Abstract
RcsB is a transcriptional regulator that controls expression of numerous genes in enteric bacteria. RcsB accomplishes this role alone or in combination with auxiliary transcriptional factors independently or dependently of phosphorylation. To understand the mechanisms by which RcsB regulates such large number of genes, we performed structural studies as well as in vitro and in vivo functional studies with different RcsB variants. Our structural data reveal that RcsB binds promoters of target genes such as rprA and flhDC in a dimeric active conformation. In this state, the RcsB homodimer docks the DNA-binding domains into the major groove of the DNA, facilitating an initial weak read-out of the target sequence. Interestingly, comparative structural analyses also show that DNA binding may stabilize an active conformation in unphosphorylated RcsB. Furthermore, RNAseq performed in strains expressing wild-type or several RcsB variants provided new insights into the contribution of phosphorylation to gene regulation and assign a potential role of RcsB in controlling iron metabolism. Finally, we delimited the RcsB box for homodimeric active binding to DNA as the sequence TN(G/A)GAN4TC(T/C)NA. This RcsB box was found in promoter, intergenic and intragenic regions, facilitating both increased or decreased gene transcription.
INTRODUCTION
Gram-negative bacteria encompassing the Enterobacteriaceae family possess a complex signal transduction system named Rcs, initially characterized as a regulator of capsular polysaccharide synthesis (1,2). The Rcs system detects cell envelope stress conditions and triggers an adaptative response to withstand such conditions (3). This response comprises a fine-tuned regulatory cascade that involves outer and inner membrane proteins as well as a transcriptional factor aimed to influence gene expression. Specifically, under envelope stress conditions, the outer membrane protein RcsF interacts with the essential inner membrane protein IgaA (4,5) to release the inhibition that in basal conditions this inner membrane protein exerts over the RcsCDB phosphorelay system (6,7). The Rcs system comprises the inner membrane hybrid histidine kinase named RcsC, which is activated by autophosphorylation and transfers the phosphoryl group to the inner membrane phosphotransfer protein RcsD, which in turn transfers the phosphoryl group to the response regulator RcsB (8). This phospho-transfer occurs in a conserved aspartate residue (D56) located in the receiver domain (REC) of RcsB, resulting in modulation of gene expression. RcsB can also act in combination with other auxiliary transcriptional factors in a phosphorylation dependent or independent manner (3). In addition, the sensor protein BarA can also activate the RcsB protein in an RcsC- and RcsD-independent manner (9).
In this context, phosphorylated RcsB activates expression of the capsule (cps) operon (10); rprA, which encodes the small RNA RprA (11); osmC and osmB, two genes also regulated by RpoS (12); and, the cell division gene ftsZ (13), among others. Conversely, phosphorylated RcsB represses transcription of the flhDC flagellar operon required for motility (14,15). Phosphorylated RcsB can act in combination with RcsA to enhance activation of the cps operon, to activate expression of the rcsA gene or to repress flhDC (14,16). Independently of phosphorylation, RcsB also regulates genes acting together with additional transcriptional factors such as GadE (17), BglJ (18), MatA (19) or RflM (20). The auxiliary proteins TviA and RmpA have also been proposed to act in concert with RcsB (10). This versatility shown by RcsB both in their phosphorylated and dephosphorylated forms to regulate genes, and alone or in complex with other transcriptional factors or auxiliary proteins, suggests that a large number of genes must be under the control of this response regulator. Accordingly, microarray analysis performed in Escherichia coli (21,22) and Salmonella enterica serovar Typhimurium (S. Typhimurium) (23,24) have identified ∼100 genes comprising the Rcs regulon.
In order to understand at the molecular level how RcsB exerts its activity, several crystal structures have been recently obtained for the E. coli and the intracellular bacterial pathogen S. Typhimurium. The structure of the unphosphorylated receiver (REC) domain of E. coli RcsB (25), together with the full-length structure of phosphorylated S. Typhimurium RcsB (26), revealed that upon phosphorylation: (i) RcsB dimerizes through the REC domains using α1–α5 elements, a common interaction surface observed in other members of NarL/FixJ subfamily of response regulators (RRs) to which RcsB belongs and (ii) RcsB follows the activation mechanism named β5–T coupling where movement of the catalytic Thr residue is coordinated with β5 to displace a conserved Leu in the NarL/FixJ subfamily (L108 in RcsB) to let catalytic Lys at loop β5α5 approach the active site (26). Additional RcsB structures obtained for S. Typhimurium RcsB show an alternative dimerization mechanism that does not involve interaction through the REC domains. Instead, the DNA-binding domains (DBD) produce a crossed-dimer that is organized in the crystal structures as hexamer of yet unknown biological significance (26). More recently, the crystal structure of full length unphosphorylated E. coli RcsB bound to the P1flhDC promoter (PDB: 5W43) has been obtained (27). In this DNA-bound structure, RcsB presents a dimeric organization resembling the structure in the phosphorylated form. However, to date no structural analysis has been carried out to correlate structural conformation with gene expression control in a phosphorylation dependent or independent manner. In an effort to understand this, we analysed the impact of RcsB phosphorylation for DNA binding by solving the structures of S. Typhimurium RcsB bound to the rprA and P1flhDC promoters and the structures of the isolated REC domain in the absence and presence of phosphomimetic BeF3−. Our study demonstrates that DNA binding takes place when RcsB acquires the phosphorylated active conformation even in the absence of phosphorylation. Our structural analysis has also revealed that RcsB recognizes a pseudo-palindromic sequence TN(G/A)GAN4TC(T/C)NA. Guided by the structural information, we have evaluated in vitro and in vivo the effect of mutations involved in the β5-T coupling mechanism of activation and in gene regulation by performing RNAseq analysis with RcsB wild-type and variants in positions suspected to be critical to control the phosphorylation level. Altogether, these analyses allowed us to unravel an unexpected dimension of the RcsB regulon and to identify genes linked to iron metabolism regulated by RcsB, as well as conduct a genome-wide analysis that identified the pseudo-palindromic sequence in promoter and intragenic regions of genes directly regulated by RcsB.
MATERIALS AND METHODS
Cloning, mutagenesis, protein expression and purification
Cloning, expression and purification of full-length wild-type (WT) RcsB from S. Typhimurium used in the crystallization assays were described previously (26). Cloning of the REC domain from S. Typhimurium (residues 1–143) was done in vector plasmid LIC 1.1 (pETNKI-his3C-LIC-kan), provided by NKI Protein Facility (28). Site-directed mutagenesis at RcsB specific residues was done with the Q5 Site-Directed Mutagenesis Kit (New England Biolabs). Primers used are listed in Supplementary Table S1.
For protein expression, E. coli strain C43 (DE3) containing the appropriate vector was grown in Hyper broth (Molecular Dimension) to exponential phase (OD600 ∼0.6), then induced with 0.5 mM isopropyl β-D-1-thiogalactopyranoside (IPTG), incubated overnight at 20°C and then centrifuged and stored at −20°C. A different approach was followed for the expression of RcsB mutant L108A in E. coli C43 as cells did not grow efficiently probably due to toxicity effects. In this case, cells were grown overnight on an agar plate containing kanamycin, then resuspended in 3 ml of LB medium and transferred to a 1L Hyper broth. Subsequently, when exponential phase was achieved cell were induced with 0.5 mM IPTG, incubated overnight at 20°C and later centrifuged and stored at −20°C.
For purification of the REC domain and RcsB mutants, cells were resuspended in buffer A (50 mM Tris pH 8.5, 500 mM NaCl), sonicated, centrifuged (15 000 × g, 4°C) and then the supernatant was loaded into a HisTrap HP column (GE, Healthcare) to perform affinity chromatography. Elution of the protein was achieved in buffer A containing 200 mM imidazole. The eluted proteins were dialyzed against buffer A to remove imidazole and concentrated to perform gel filtration. In the case of the REC domain and to remove the 6xHis-tag for crystallization purposes, the dialysis was performed overnight at 4°C and protease PresCission was added in a molar ratio of 1:10 (protease:protein). Then, the REC domain was purified again by affinity chromatography and the digested protein was collected in the non-retained fraction from the undigested material and the protease. Finally, gel filtration chromatography was run using a 50 mM Tris pH 8.5, 150 mM NaCl buffer. Collected fractions of the protein were run in a 15% gel for SDS-polyacrylamide gel electrophoresis (SDS-PAGE), then, the purest fractions were collected and concentrated until ∼10 mg/ml, frozen with liquid N2 and stored at −80°C.
EMSA experiments
EMSA experiments were performed as described previously (26). Analysed DNA fragments were provided as lyophilized dsDNA by Macrogen (Supplementary Table S1), then resuspended in water to a final concentration of 2 mM. RcsB was incubated during 1 h at 20 μM in the presence of 0.5 μM double-stranded DNA of rprA and P1flhDC promoters and 0.0125 mg/ml of poly d(I-C) (Roche) in a buffer containing 50 mM Tris pH 8.5, 50 mM MgCl2 and 10% glycerol in absence or presence of 50 mM acetylphosphate (AcP). Briefly, experiments were run in 10% acrylamide/bisacrylamide gels using 0.5× Tris/borate/EDTA (TBE) running buffer containing 4 mM MgCl2. Previously to run, the gels were pre-cooled at 4°C, then samples were loaded on the gel and run at 150 V during 2 h at 4°C. Each gel was stained by adding 2 μl of GreenSafe Premium (NZYTech) in 20 ml of 0.5× TBE buffer and incubated for 20 min, then visualized with UV light.
Synthesis of radioactive acetyl-phosphate (AcP)
Radioactive [32P]-AcP used in the RcsB phosphorylation assay was obtained incubating for 2 h at room temperature 2.5 U of acetate kinase with 10 μCi of [γ-32P] adenosine triphosphate (1000 Ci/mmol Perkin Elmer) in 2.5 mM Tris pH 8, 6 mM potassium acetate and 1 mM MgCl2 buffer. The [32P]-AcP synthesis reaction was centrifuged (14 000 × g, 30 min) with Microcon-10 kDa Centrifugal Filter Unit (GE Healthcare) to eliminate the acetate kinase and the filtrated [32P]-AcP was stored at −20°C until use.
Phosphorylation experiments with [32P]-AcP
Phosphorylation of RcsB wild-type and mutants was conducted using 1 mg/ml (40 μM) of protein incubated with 10 μl of [32P]-AcP in a solution containing 50 mM Tris–HCl pH 8.5, 100 mM KCl, 10 mM MgCl2 and 150 mM NaCl. Phosphorylation reaction was stopped adding loading buffer containing 4% sodium dodecyl sulphate (SDS) and 50 mM EDTA at different incubation times, 5, 10, 20, 40 and 60 min. The samples were loaded in a 15% gel for SDS-PAGE and run at 150 V at room temperature. Phosphorylated proteins were visualized by phosphorimaging using a Fluoro Image Analyzer FLA-5000 (Fuji) and evaluated with the MultiGauge software (Fuji).
Dephosphorylation experiments of phosphorylated RcsB
RcsB at 40μM was phosphorylated with [32P]-AcP for 1 h at room temperature, as indicated previously. Then, free [32P]-AcP was removed using desalting columns with 0.5 ml of Sephadex G-25 fine (GE Healthcare). [32P]-AcP free samples were incubated at room temperature and stopped at different incubation times by adding loading buffer containing 4% SDS and 50 mM EDTA. Then, samples were run in an SDS-PAGE gel at 150V at room temperature. Phosphorylated proteins were visualized by phosphorimaging using a Fluoro Image Analyzer FLA-5000 (Fuji) and evaluated with the MultiGauge software (Fuji).
Protein crystallization
Crystals were obtained by using the sitting drop vapour diffusion technique. Crystallization of RcsB bound to the promoters was achieved by mixing 0.6 μl of a protein solution having 6 mg/ml protein, 0.18 mM DNA, 7 mM MgCl2, 5 mM BeSO4 and 30 mM NaF with 0.3 μl of different screening solutions. To improve complex crystallization, a 23-mer doubled-stranded DNA containing the bona fide sequence of DNA promoter P1flhDC was synthesized (Macrogen) with the last base at the 3′ end changed from A to G (5′-CGAATTAGGAAAAATCTTAGGCG-3′) to increase duplex stability. A similar strategy was used to synthesize the rprA promoter which had a 23-mer sequence where the A at 5′ and 3′ ends were changed to C and G, respectively (5′- CCTATTGAGACGAATCTGATCGG-3′). Crystals for RcsB bound to P1flhDC were grown in a mother liquor solution containing 1.5 M ammonium sulfate and 0.8 mM lithium sulfate while crystals of RcsB bound to rprA promoter (PrprA) were grown in 15% (v/v) PEG8000, 0.1 M MES pH 6.5 and 0.2 M magnesium acetate. For cryopreservation, crystals grown with P1flhDC were harvested in a solution containing 2.3 M lithium sulfate while in the case of PrprA crystals were harvested in the mother liquor solution with increased PEG8000 to 35% (v/v). Crystallization of REC domain of RcsB was achieved by mixing 0.6 μl of a protein solution containing 6 mg/ml protein, 7 mM MgCl2, 5 mM BeSO4 and 30 mM NaF with 0.3 μl of different screening solutions. Two crystal forms were obtained in different conditions. Rod-shaped crystals grew in 30% (v/v) PEG4000, 0.1M Tris–HCl pH 8.5 and 0.2M MgCl2 and led REC domain bound to BeF3− that diffracted to 2.5Å. Diamond-shaped crystals grew in 1.6 M tartrate, 0.1M HEPES pH 7.5 and glucose 2.9% (v/v) and led REC domain in the apo form that diffracted to 3.1Å. The fact that the REC domain mixed with BeF3− produced crystals in the apo form of the protein relies on the presence of tartrate in the mother liquor solution as it has been demonstrated that tartrate can complex beryllium in the presence of fluoride (29) abolishing BeF3− binding to the protein. Cryoprotection of rod-shaped crystals was achieved harvesting the crystal in the crystallization solution with increased PEG4000 to 35% (v/v) while for the diamond-shaped crystals 10% (v/v) ethylene glycol was added to the mother liquor solution. Diffraction and data collection for the crystals were conducted at beamlines I03, I04 and I24 in Diamond light source synchrotron (Didcot, UK) and beamline BL13-XALOC in Alba Synchrotron (Cerdanyola del Vallès, Spain) and the datasets showing the highest resolution were used to solve the structures. Specifically, best crystals for RcsB bound to P1flhDC promoter and REC domain bound to BeF3− were collected at I04 and I24, respectively, while best crystals for RcsB bound to PrprA and REC domain in the apo form were collected at BL13-XALOC. Data integration and reduction were performed using XDS (30) and Aimless from the CCP4 suite (31). Molecular replacement was conducted for phasing using the previously reported structure of RcsB (PDB: 5O8Z) as the search model using Phaser (32). The final structural model was obtained upon iterative cycles of building and refinement using COOT (33) and Refmac5 (34), respectively. Data collection and refinement statistics are provided in Table 1. The Ramachandran plot for refined RcsB bound to PrprA showed 89.1% residues in favored region, 10.9% residues in allowed region and 0.1% residues in disallowed region; for refined RcsB bound to P1flhDC showed 89.2% residues in favoured region, 10.5% residues in allowed region and 0.3% residues in generously allowed region; for refined REC domain of RcsB in the presence of BeF3− showed 95.9% residues in favoured region, 4.1% residues in allowed region; and for refined REC domain of RcsB in the apo form showed 92.2% residues in favoured region and 7.8% residues in allowed region.
Table 1.
Data collection and refinement statistics
| rprA-RcsB-P | flhDC-RcsB-P | RcsBREC-P | RcsBREC | |
|---|---|---|---|---|
| Data collection | ||||
| Space group | P 21 | H 3 | P 21 | I 41 3 2 |
| Cell dimensions | ||||
| a, b, c (Å) | 69.36, 111.51 | 183.2 183.2 | 38.14, 64.40 | 148.1, 148.1 |
| 146.26 | 84.14 | 47.13 | 148.1 | |
| α, β, γ (°) | 90, 90.4, 90 | 90, 90, 120 | 90, 100.1, 90 | 90, 90, 90 |
| Resolution (Å) | 46–3.4 (3.6–3.4) | 74.3–3.4 (3.7–3.4) | 28.7–2.5 (2.6–2.5) | 104.8–3.1 (3.4–3.1) |
| No. reflections | 114 764 (15 807) | 69 020 (14 473) | 48 549 (4022) | 176 922 (44 893) |
| R sym or Rmerge | 0.21 (0.63) | 0.048 (0.43) | 0.067 (0.21) | 0.05 (2.43) |
| Rpim | 0.13 (0.4) | 0.028 (0.241) | 0.03 (0.12) | 0.009 (0.41) |
| I / σI | 4.2 (1.9) | 11.8 (3.1) | 16.1 (6.5) | 36.7 (2.2) |
| Completeness (%) | 99.1 (97.8) | 99.9 (99.9) | 97.0 (81.3) | 96.8 (100) |
| Redundancy | 3.8 (3.6) | 4.8 (4.8) | 6.4 (4.8) | 34.9 (37) |
| Refinement | ||||
| R work / Rfree | 0.26/0.31 | 0.23/0.27 | 0.22/0.27 | 0.24/0.29 |
| No. atoms | ||||
| Protein | 10265 | 2836 | 2125 | 954 |
| Ligand/ion | 1816 | 912 | 10 | |
| Water | 5 | 42 | 1 | |
| B-factors | ||||
| Protein | 92.3 | 182.6 | 33.8 | 166.4 |
| Ligand/ion | 70.2 | 175.2 | 34.2 | |
| Water | 86.7 | 30.5 | 143.2 | |
| R.m.s. deviations | ||||
| Bond lengths (Å) | 0.002 | 0.003 | 0.005 | 0.007 |
| Bond angles (°) | 1.19 | 1.20 | 1.25 | 1.09 |
| PDB code | 6ZJ2 | 6ZIX | 6ZII | 6ZIL |
Values in parentheses are for the highest-resolution shell.
Figures were produced using UCSF Chimera (35) and superpositions were performed using programs from CCP4 suite (31).
Phenotypic assays
Phenotypes involving production of colanic capsule leading to mucoid colonies on plates and bacterial motility were monitored, as described (26). Briefly, the strain used to express the wild-type and mutant RcsB variants is S. Typhimurium MD4821 (igaA1 ΔrcsB). The allele igaA1 bears an R188H mutation in IgaA causing partial loss-of-function and, as consequence, activation of the RcsCDB system (4,36). Strain MD4821 was constructed from SV4450 (igaA1), which is mucoid on plates due to over-activation of the RcsCDB system, by deletion of the rcsB gene (26). Strain MD4821 was subsequently transformed with plasmid pTara:500 (Addgene), which expresses T7 RNA-polymerase, to generate strain MD4822 (igaA1 ΔrcsB pTara:500). This strain was used as recipient of the different series of plasmid LIC 1.1-derivates expressing the respective RcsB-6xHis variants.
RNAseq experiments
Total RNA was obtained from 10 ml cultures of S. Typhimurium MD4821 strain expressing RcsB-WT or mutant variants in exponential phase (OD600 ∼ 0.25) using the TRIzol reagent method, as described elsewhere (37). The samples for the strains expressing each RcsB variant were prepared from three independent biological replicates. Total RNA was further purified by treatment with TURBO DNA-free kit (#AM1907, Invitrogen). Quality of RNA was checked by Bioanalyzer with final yields in the range of 25–40 μg per sample (concentration of 500–800 ng/μl). Purified RNA was then treated with Ribo-Zero™ rRNA Removal Reagent and magnetic core kit (Epicentre). rRNA-free RNA was resuspended in ethanol and subsequently used to prepare libraries using the ScriptSeq™ v2 RNA-Seq Library preparation kit (Epicentre and Illumina Company). The purifications were performed following manufacturer instructions and involving usage of MagSi-NGSPREP Plus (Magtivio).
Size of the fragments composing the different libraries was monitored by capillary electrophoresis in a QIAxcel Advanced System (Qiagen) and quantification of the cDNA was made in a QuantiFluor dsDNA system (Promega). Sequencing was performed in a Hiseq 400 system (Illumina) in a 2 × 75 bp format. Reads were aligned against the NCBI genome sequence for S. Typhimurium strain SL1344 (NC_016810.1) using Bowtie2 (38). Raw reads counts were calculated using the Python package HTSeq, with the function htseq-count (39). The Bioconductor DESeq2 package from R software (40) was used to detect differentially expressed genes. An adjusted P-value of 0.05 was considered to be significant. Gene Ontology (GO) enrichment analysis, the PANTHER (Protein ANalysis THrough Evolutionary Relationships) Classification System was applied (41).
Hierarchical complete-linkage clustering of RPKM log2 fold change was performed with Cluster 3.0 (42). Clusters were visualized using Java Treeview software (43).
Quantitative RT-PCR
In order to analyse the mRNA levels of our target genes, we performed reverse transcription and quantitative PCR reactions with mRNA samples used in the RNAseq analysis obtained from S. Typhimurium MD4821 (igaA1 ΔrcsB) cells expressing RcsB wild type or mutant variants D56A, L108A, M88A as well as empty vector. cDNA was obtained using the QuantiTect Reverse Transcription Kit, and the qPCR reactions were performed following the protocol as described in (44). Briefly, 2.5 μl of cDNA was mixed with 7.5 μl of each qPCR reaction containing 0.2 μM of the corresponding primers and 5 μl of SYBR Pre-mix Ex Taq (Tli RNase H Plus, Takara). Then, reactions were analysed with CFX96 Touch™ Real-Time PCR Detection System (BioRad) to obtain the Cq values under the following conditions: 95°C for 10 s, followed by 40 cycles of 5 s at 95°C and 20 s at 52°C, and a final step at 50°C for 1 min. At the end of the amplification cycles, a melting curve analysis was conducted to verify the specificity of the reaction. For each analysed primer pair, a standard curve was made with serial dilutions of the cDNA samples (1/5, 1/10, 1/50, 1/100, 1/500 and 1/1000). Endogenous aroC mRNA levels were used for normalizations. A total of two biological replicates of each RNA sample was used to analyze the transcript levels for each analysed gene. The list of the specific primers designed to amplify the genes of interest is listed in the Supplementary Table S1.
Bioinformatic search of RcsB consensus sequences
The RcsB consensus sequences and assignation of potential target genes were conducted using Python scripts and the NCBI genome sequence for S. Typhimurium SL1344 (NC_016810.1). Python scripts and genomics data used in this work to find the RcsB DNA motifs are now present in the Github repository (https://github.com/ginerorama/Salmonella-RcsB-regulon). Transcriptional Start Sites (TSS) for RcsB motif mapping analysis were retrieved from SalCom (45).
Nuclease protection assays
Fragment for the intergenic region between entF and fepE (sequence from –1 to –249 from initial ATG codon of fepE gene) were amplified with 5′- fluorescein (FAM) labeled primers (see Supplementary Table S1). Then, the PCR product was treated with ExoProStar™ kit (Fisher Scientific) and was separated in three samples, (i) control DNA, (ii) DNA with RcsB and (iii) DNA with protein phosphorylated RcsB upon addition of 50 mM AcP and 50 mM MgCl2. Digestion with DNase I (Thermo Scientific) was performed for 5 min at 37°C in DNase I buffer and the reaction was stopped adding EDTA at 10 mM final concentration with further incubation at 80°C during 10 min. The digested fragments were analysed by capillary electrophoresis in an ABI 3500 Genetic analyzer (Applied Biosystems) at the DNA sequencing service of the Instituto de Biomedicina de Valencia, and the chromatograms generated were compared to search the protective areas.
RESULTS
RcsB bound to rprA and P1flhDC promoters shows the phosphorylated active conformation
The capacity of RcsB to control expression over a large number of genes in the absence and presence of phosphorylation remains intriguing. Previously, we solved the structure of S. Typhimurium RcsB in the presence of phosphomimetic BeF3− (RcsB-P in PDB 5O8Z; from now on terminology used to present the structures is shown in Supplementary Table S2) which showed a dimer in the phosphorylated-active conformation competent to bind target promoters (26). To understand the molecular bases of promoter recognition, we attempted to solve the 3D structure of this protein in complex with two 23-mer DNA fragments containing the sequences corresponding to promoters of rprA (PrprA) and P1flhDC genes. For PrprA, the sequence ranged from -33 to -53 upstream of the transcription start site (5′-CCTATTGAGACGAATCTGATCGG-3′), while, for P1flhDC the sequence ranged from −225 to −204 of the flhDC operon (5′-CGAATTAGGAAAAATCTTAGGCG-3′). Notice that G or C were added at the 5′- and 3′-ends to stabilize the DNA fragments. Binding of phosphorylated RcsB to these promotors was previously shown (26) and confirmed here by EMSA (Supplementary Figure S1). The phosphomimetic BeF3− was added to stabilize the phosphorylated conformation of RcsB as our previous structural studies showed (26), and crystals containing the promoters PrprA or P1flhDC were obtained in space groups P21 and H3, respectively (Table 1).
Molecular replacement using RcsB-P structure as a model showed that the asymmetric unit for crystals in the presence of PrprA (rprA-RcsB-P) contained two RcsB dimers bound to two PrprA DNA sequences and two additional RcsB dimers not bound to DNA (Figure 1A and Supplementary Figure S2A). In contrast, crystals with P1flhDC DNA (flhDC-RcsB-P) contained in the asymmetric unit one RcsB dimer bound to one P1flhDC promoter sequence (Figure 1A). Possibly, lower affinity binding of RcsB to PrprA than to P1flhDC DNA sequence (Supplementary Figure S1) enabled the presence of RcsB dimers unbound to DNA. Comparison between RcsB dimers bound to each promoter showed almost identical conformation (RMSD 0.7 Å for superimposition of 406 residues; Figure 1A and Supplementary Figure S2B), supporting an identical structural conformation to promoter recognition. Furthermore, comparison of these two structures with the previously reported structure of unphosphorylated E. coli RcsB bound to P1flhDC (flhDC-RcsBEC; PDB 5W43) (27) provided valuable information as showed a similar conformation (RMSD of 1.1 Å for 392 residues; Supplementary Figure S2C) even though the unphosphorylated structure was bound to a shorter version of P1flhDC promoter (22-mer) and crystallized in different conditions and space group (27).
Figure 1.

Structure of RcsB bound to PrprA and P1flhDC promoters. (A) RcsB dimer (subunits in pink and magenta) bound to promoter PrprA (rprA-RcsB-P) and RcsB dimer (subunits in orange and purple) bound to promoter P1flhDC (flhDC-RcsB-P). The REC domain from each subunit is labelled and the loop connecting the REC and DBD domains is colored in cyan. (B) Superposition of the dimerization REC domains for RcsB-P dimer (in blue hues; PDB: 5O8Z) and rprA-RcsB-P complex (pink and magenta subunits). DBD domains rotate to dock at the rprA promoter shown as surface.
Then, we compared the structures phosphorylated (rprA-RcsB-P and flhDC-RcsB-P) and unphosphorylated (flhDC-RcsBEC) of RcsB bound to DNA with the structure of phosphorylated RcsB-P unbound to DNA. Dimerization of the REC domain was similar in all structures (RMSD values ∼1 Å for 247 residues, Supplementary Table S3) showing interaction by the α1–α5 dimerization surface characteristic in the NarL/FixJ response regulator subfamily (46,47). DBD domains showed an asymmetric disposition relative to the REC domain (Figure 1A and B) and, unlike what happens with the REC domains, these domains underwent movements with respect to the unbound form to dock into the major groove of the DNA. Basically, the DBD domain rotated around ∼20° (subunit A rotated 15.1° and translate –0.9Å while subunit B rotated 21.4° and translated –0.5Å, calculated by Dyndom (48)) with respect to the disposition observed in the RcsB-P unbound form (Figure 1B). In this new disposition, both DBD domains are symmetrically related by a two-fold axis (Supplementary Figure S3A) and show a limited interface area between them (∼250 Å) with respect to the RcsB-P unbound structure (381 Å), probably to favour interactions with DNA (Supplementary Table S4). However, some of the interactions between the DBD domains were maintained in both structures of S. Typhimurium RcsB bound and unbound to DNA which involved G165 at loop α6α7 with N197 and I199 at loop α9α10 as well as between L202 in α10 from each DBD domain (Supplementary Table S4). The capacity of DBD domains for RcsB to move and adopt different dispositions has been previously observed (26) and confirmed here by the rprA-RcsB-P crystal. The asymmetric unit of this crystal contains two RcsB dimers bound and two unbound to DNA with similar dimerization at the REC domain but showing alternative dispositions for the DBD domains (Supplementary Figure S3B), confirming the dynamism and plasticity for this RR. Overall, our structural data show that RcsB phosphorylated or unphosphorylated binds DNA in the same conformation and that DBD domains rearranges relative to REC domains to interact with DNA.
Mechanism of RcsB activation stabilized by phosphorylation
RcsB phosphorylation results in the reorientation of T87 towards the active site to mediate contacts with the phosphoryl group, allowing the accommodation of the conserved L108 in a hydrophobic pocket as predicted by the β5-T coupling mechanism (26). In this movement, loops connecting β4 with α4 (Lβ4α4) and β5 with α5 (Lβ5α5) also move to approach K109 to the active site as well as to orient M88 and N90 to allow Q110 to interact with Lβ4α4 in order to produce a proper REC dimeric interface (26). To study the changes involved in the acquisition of an active conformation that is stabilized by phosphorylation, we solved the structure of the REC domain of S. Typhimurium RcsB in the absence (RcsBREC) and presence of phosphomimetic BeF3− (RcsBREC-P) at 3.1 Å and 2.5 Å resolution, respectively (Table 1). As expected, in the presence of phosphomimetic BeF3− the isolated REC domain acquired a dimeric conformation identical to those observed for the active full-length RcsB, either bound or unbound to DNA structures (Figure 2A and B and Supplementary Table S3). Meanwhile the crystal of RcsBREC showed a monomeric organization in agreement with the monomeric state for unphosphorylated RcsB observed in solution (26). All the S. Typhimurium RcsB structures bound to BeF3− had similar orientation of catalytic residues T87, D11 (chelates Mg2+ ion), phosphorylatable D56, together with residues L108, N90, Q110 and H12, as well as Lβ3α3 (loop connecting β3 with α3), Lβ4α4 and Lβ5α5 structural elements (Figure 2C and D). Similarly, the unphosphorylated flhDC-RcsBEC structure, showed similar disposition for this residues and structural elements, except for short displacement of Lβ5α5, supporting an active conformation for this structure (Supplementary Figure S4A). Conversely, in the absence of phosphomimetic, the isolated REC domain suffered significant conformational changes (Figure 2E), including alternative conformations for residues T87 and L108, as well as higher freedom for Lβ3α3, disabling its complete modelling due to lack of electron density for residues 60–64, together with the alternative folding of residues 65–67 as part of helix α3. Conformation of Lβ3α3 seemed important to allow proper disposition of DBDs for DNA binding. Superimposition of unphosphorylated RcsBREC onto the corresponding REC domains of DNA bound structures showed that Lβ3α3 needs to achieve the conformation observed in the phosphorylated S. Typhimurium RcsB structures and the unphosphorylated flhDC-RcsBEC structure (Supplementary Figure S4A) since the ends of Lβ3α3 would produce clashes with the DBD domains, G65 would clash with E157 and R160 in its own DBD and with S207 from the DBD of the second dimer subunit (Supplementary Figure S4B). Also, absence of phosphorylation affected Lβ4α4 and Lβ5α5 conformation displacing α1 and α5. Structural comparison of the isolated REC domain in apo form with the dimeric phosphorylated forms shows that the residues involved in stabilization of the dimeric REC interface such as H12 at α1, M88 at Lβ4α4 or Q110 at Lβ5α5, would produce clashes between subunits (Figure 2F), preventing the appropriate α1–α5 dimerization and explaining the monomeric state for unphosphorylated RcsB (26).
Figure 2.

Mechanism of RcsB activation. (A) Superposition of the dimer formed by the REC domains of RcsB-P (in blue hues; PDB: 5O8Z) with the isolated REC domain (RcsBREC-P in green hues) bound to phosphomimetic BeF3− and as well as with (B) the rprA-RcsB-P complex (pink and magenta subunits) and flhDC-RcsB-P complex (subunits in orange and purple). (C, D) Zoom of the active site in A and B, highlighting the phosphorylatable residue D56, residues involved in the β5-T mechanism (T87 and L108 as well as N90 and Q110), residue H12 involved in REC dimerization and loop β3α3 (Lβ3α3), loop β4α4 (Lβ4α4) and loop β5α5 (Lβ5α5). (E) Zoom of the active site for the superposition of the isolated REC domain of RcsB in apo (RcsBREC in red) and phosphorylated form (RcsBREC-P in green) with REC domain of RcsB-P (in blue; PDB: 5O8Z). Residues are labelled as in C and D. (F) Structures superposed in E, showing the dimer for the phosphorylated forms. The residues that are involved in stabilizing the dimer interface (H12, M88 and Q110) are shown in the apo form avoiding proper disposition of the dimer interface.
To confirm the role of residue L108 in the activation mechanism of RcsB, we generated L108A and L108F mutations. Then, we evaluated phosphorylation, at D56 (26), in the presence of phosphodonor AcP (Figure 3A) and DNA-binding capacity to promoter P1flhDC by electrophoretic mobility assays (EMSA) (Figure 3B). Mutation L108A completely abolished phosphorylation while the L108F change resulted in decreased phosphorylation. This could result by the fact that Phe tends to mimic Leu, occupying the hydrophobic pocket, although its bulkiness avoids proper fitting. In concordance with lack of phosphorylation, the RcsB-L108A variant did not bind promoter P1flhDC. In agreement with its lower phosphorylation capacity, the RcsB-L108F mutant could still bind P1flhDC promotor but with lower affinity (Figure 3B). Phenotypic assays with S. Typhimurium MD4821 (igaA1 ΔrcsB) strains expressing either RcsB-L108A or RcsB-L108F did not produce extracellular capsule and displayed higher motility than WT strain. This phenotype is similar to the strain deficient of RcsB (Figure 3C) in agreement with the in vitro data. Therefore, the results confirmed the key role of L108 in RcsB activation by phosphorylation, signal transduction and DNA regulation. Additional mutations at residues that participate in phosphorylation-mediated conformational changes such as N90 and Q110 located at Lβ4α4 and Lβ5α5, respectively (Figure 2C–E), affected the phosphorylation rate and induced intermediate phenotypes (Supplementary Figure S5). As the net phosphorylation comprises autophosphorylation and dephosphorylation rates, we studied the dephosphorylation time-course (60 min) of WT and mutant variants of RcsB. Our analysis (Supplementary Figure S5B) confirmed a predominant stable phosphorylation of RcsB, which is barely altered by the mutations, supporting that mutations mainly affect the phosphorylation rate.
Figure 3.
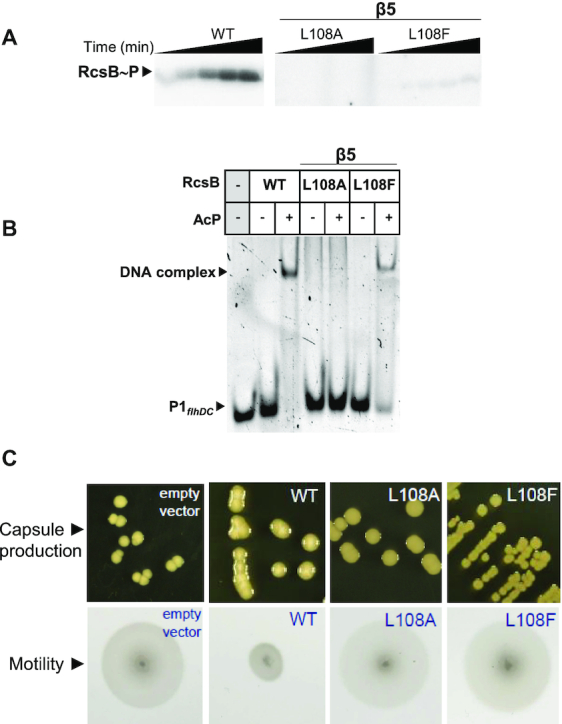
Role of L108 in the activation mechanism of RcsB. (A) Phosphorylation of RcsB-WT and mutant variants RcsB-L108A and RcsB-L108F using radioactive phosphodonor AcP and incubating at room temperature for 5, 10, 20, 40 and 60 min. (B) EMSA experiments performed with RcsB-WT and mutant variants L108A and L108F in order to test binding to P1flhDC in the absence and presence of phosphodonor AcP. (C) Effect of L108A and L108F mutations in capsule formation and motility. Overexpression of RcsB mutants in the S. Typhimurium strain MD4821 (igaA1 ΔrcsB) to monitor effect on colanic capsule production and motility in vivo. Expression of the wild-type and empty vector (as control).
Overall, our data demonstrates that RcsB binding to DNA required, in both S. Typhimurium and E. coli, the acquisition of an active phosphorylated conformation. This could be mediated by a β5-T coupling mechanism where L108 plays a key role together with phosphoryl-interacting T87 to promote adequate conformation of Lβ3α3, Lβ4α4 and Lβ5α5 for REC dimerization and DNA binding. The fact that unphosphorylated flhDC-RcsBEC structure adopts an active conformation implies that the binding to the DNA may stabilize these structural changes.
RcsB binding specificity
RcsB dimer binds PrprA and P1flhDC promoters by the insertion of DBD α9 helices into the major groove of the DNA (Figure 4). Both DBDs present a symmetric disposition related by a two-fold axis, thus the α9 helices cover two inverted pseudo-repeats separated by four bp. In addition to α9 helices that made the direct readout of the DNA, the loop connecting helices α6 with α7 (Lα6α7), and helices α7 and α8 made non-specific interactions with DNA backbone, covering a recognition area of ∼600 Å2 for each DBD (Figure 4B). Analysis of the interactions between S. Typhimurium RcsB with PrprA and P1flhDC promoter sequences using DNAproDB server (49) revealed a conserved recognition motif by DBD residues despite the divergence in sequence observed between promoters (only 63% similarity in 23-mer) (Supplementary Figure S6A). Interactions were observed between residues in α9 with the nitrogenous bases via hydrophobic interactions involving I179, T181, S183 and S184 and via hydrogen bonds involving, surprisingly, only K180 (Figure 4C and Supplementary Table S5). Despite similar location of DBD domains interacting with PrprA and P1flhDC at the dimer, the side chain flexibility of interacting residues for each DBD domain does not reproduce the exact same interactions with each DNA strand (Figure 4C and Supplementary Figure S6B). The flexible side chain of K180 recognizes the major groove floor generated by the AGA motif (GGA in P1flhDC) in both strands (Figure 4C), explaining the critical role of this residue in DNA-binding to the P1flhDC promoter (26,50). Interestingly, K180 flexibility is exploited to recognize this motif in different ways, showing the side chain alternative dispositions in some protomers but always interacting with the nitrogenous bases of AGA motif (Figure 4D). Indeed, the flexibility of K180 was reflected by a weak electron density of the side chain, difficult to trace in some molecules. In this way, S. Typhimurium RcsB seems to recognize a pseudo-palindromic sequence for both promoters comprising two motifs, a TN(G/A)GA motif separated by four bases to TC(T/C)NA (corresponding to the AG(G/A)NT motif in the complementary strand) (Figure 4C). A similar motif AGA…TCT was previously proposed as part of the RcsB box (11). The backbone phosphates and the sugar moiety make extensive interactions with the DBD domain involving residues K154, E155 and T169 from helices α7 and α8. This non-specific recognition increased the interaction surface possibly to stabilize the complex and to overcome the weak read-out of the recognition sequence (Figure 4C and Supplementary Table S5). Similar interactions with P1flhDC promoter were also observed in the structure of unphosphorylated flhDC-RcsBEC (27).
Figure 4.

Dissecting binding specificity of RcsB to DNA. (A) rprA-RcsB-P complex showing how α9 is oriented at each subunit of the dimer with respect to dimerization of the REC domain. (B) Interaction of each DBD domain of the RcsB dimer (in pink and magenta) with PrprA promoter showing the residues involved in binding located at α7, α8 and α9. At each DBD domain, residue K180 inserts specifically in the major groove of DNA. (C) Detail interaction of each DBD domain of the RcsB dimer (in pink and magenta) with the PrprA promoter indicating the residues involved in the binding with the nucleotides at each strand of the promoter (in green and yellow). Labelled residues are colour coded as the DBD chains and show location at the corresponding helix. Nitrogenous bases are represented as boxes, deoxyribose sugar as small pentagons and phosphate groups as red circles. Lines colour coded as DBD chains represent binding interactions between residue and DNA. Nucleotides at motif (G/A)GA in the direct strand are colored in red and at motif AGA in the complementary strand are colored in blue. (D) Superposition of all DBD domains bound to PrprA and P1flhDC to show the flexibility of the side chain for K180.
To study the specificity of recognition by RcsB for the pseudo-palindromic sequence, we mutated one, two or three bases at different positions within the two (G/A)GA motifs present at the pseudo-palindromic P1flhDC promoter and performed EMSA to evaluate the extent of interaction (Supplementary Figure S6C). The second motif AGA corresponds to the TCT motif in the direct strand. Substitution of the first GGA to AGA, as observed in the PrprA promoter, allowed DNA binding to RcsB in a similar extent as the P1flhDC promoter, however, other mutations diminished (GGC, GGT, GGG and AGG) or impaired RcsB binding. Similarly, mutation of the second AGA to AGG allowed RcsB binding but other mutations either diminished (GGA and TGA) or blocked such binding (Supplementary Figure S6C). These results indicated that the two (G/A)GA motifs shape the pseudo-palindromic sequence that seems to be the primary recognition site for RcsB. The fact that: (i) RcsB binds as a homodimer to an imperfect palindrome and (ii) DNA read-out is made mainly by two residues (same residue at each subunit of the dimer) with extensive binding to the backbone DNA would indicate limited binding specificity, explaining the broad number of genes regulated by RcsB alone or in complex with other transcriptional factors. Furthermore, the distance between the contacted bases may play an important role as well.
Transcriptional profiling in S. Typhimurium expressing RcsB variants
To determine the extent to which phosphorylation modulates the function of the S. Typhimurium RcsB regulator, we isolated total RNA from a S. Typhimurium MD4821 (igaA1 ΔrcsB) strain expressing the following RcsB variants: (i) M88A (exhibiting higher phosphorylation) (26); (ii) L108A (impaired for both phosphorylation and signal transduction (Figure 3) or (iii) D56A (non-phosphorylatable) (26). Control samples included ΔrcsB bacteria expressing WT RcsB and bacteria harbouring an empty vector. In all cases, RNA was isolated from actively growing bacteria in nutrient-rich medium LB at exponential phase (OD600 ∼ 0.25). A total 877 genes were differentially expressed (adjusted P-value < 0.05) in WT and the RcsB variants (Supplementary Table S6) with respect to ΔrcsB strain harbouring an empty vector. The RNAseq data were consistent with the previously reported RcsB regulon. Thus, among the differentially-expressed genes were included those related with production of the exopolysaccharide capsule composed of colanic acid, flagella biosynthesis/motility, chemotaxis, the virulence-associated Salmonella pathogenicity island 1 (SPI-1), glutamine transport, glycerol, galactose, ribose and maltose metabolism as well as some encoding for lipoproteins, periplasmic proteins and, secretion and membrane-related proteins (3,21–23,51) (Figure 5A–C and Supplementary Table S6). Importantly, RNA-seq uncovered distinct transcriptional profiles in S. Typhimurium expressing different RcsB versions: WT protein in comparison to the M88A, L108A and D56A variants (Figure 5A–C). These differences confirmed the important role that phosphorylation plays in modulating RcsB-mediated regulation. Compared to bacteria harbouring the empty vector, S. Typhimuirum strains producing the M88A, L108A or D56A variants showed a reduced number of differentially-expressed genes than the strain producing RcsB-WT. Thus, the transcription profile of bacteria producing RcsB-WT was altered in 578 genes, more than the sum of those differentially-expressed genes detected in bacteria producing the M88A, L108A or D56A variants (200 + 83 + 16 = 301, Figure 5B). As expected, the number of affected genes in bacteria producing the non-phosphorylatable D56A variant was quite low compared to bacteria harbouring the empty vector, i.e. no GO groups were differentially expressed (Figure 5C). On the other hand, the M88A and L108A RcsB variants exhibited an intermediate capacity to modulate gene expression compared to RcsB-WT (Figure 5A and C). Expression of genes related with flagella biosynthesis and motility were highly decreased in bacteria producing RcsB-WT but slightly decreased in those producing the M88A and L108A variants, emulating, therefore, the response shown by bacteria producing the D56A variant (Figure 5D). In contrast, the expression of wca operon genes involved in colanic acid synthesis were increased by RcsB-WT and the M88A variant, a response not observed in bacteria producing RcsB-L108A (Figure 5D). This difference was in concordance with the inability of RcsB-L108A, which is unable to become phosphorylated, to repress motility genes (Figure 5D).
Figure 5.

Transcriptional response in S. Typhimurium producing RcsB variants having distinct phosphorylation states. (A) Hierarchical complete-linkage clustering was applied to 578 genes that were differentially expressed (adjusted P-value < 0.05) in S. Typhimurium actively growing in LB medium (OD600 ∼ 0.25) as denoted by the RNA-seq data (Supplementary Table S6). Positive or negative expression values in RPKM (reads per kilobase million) with respect to the reference sample (ΔrcsB null mutant strain harbouring empty vector) are indicated by shades of yellow or blue, respectively. Differential expression values on the colour bar are shown in log2 form. (B) Venn diagram showing number of genes differentially expressed in bacteria producing RcsB-WT or the indicated variants. Black numbers indicate the number of genes that S. Typhimurium expressing each RcsB variant (M88A, L108A and D56A) shares with those producing RcsB-WT. (C) GO enrichment analysis of differentially expressed genes. Only GO of biological process with adjusted P-value < 0.05 are shown. (D) Read coverage of both colanic acid capsule-related (wca) and flagella synthesis (flg) genes. Values in the X-axis indicate genome coordinates. Values in the Y-axis indicate RNA-seq read density profiles. Blue arrows represent gene orientation.
Despite its capacity to induce wca expression (see Figure 5D), the RcsB-M88A variant showed reduced ability to repress motility genes, confirming previous phenotypic assays (26). These findings indicate that hyper-phosphorylation of RcsB-M88A may have deregulated the control over motility disrupting the balance between phosphorylated RcsB homodimer and the unphosphorelated RcsB-RflM heterodimer formation, both complexes contributing to motility repression. Finally, genes mapping in the Salmonella pathogenicity island 1 (SPI-1) were less affected as result of expression of RcsB-WT and the variants, except for bacteria producing RcsB-D56A which showed increased expression of the entire set of genes encompassing SPI-1 (Supplementary Figure S7) and a slight increase expression for the RcsB-M88A variant. These results support previous data on RcsB repressing SPI-1 genes (24) and demonstrate the influence of RscB phosphorylation for control of this pathogenicity island. Taken together, our results reinforce the key role that phosphorylation plays in regulation mediated by RcsB. To our knowledge, these data also highlight, for the first time, differences in the transcriptional profile that correlate with distinct states of phosphorylation in RcsB.
The RNA-seq data also uncovered new genes not previously known to be part of the RcsB regulon. These genes encode chaperone-heat shock and stress proteins and, proteins related to sulphate metabolism as well as iron utilization and molybdenum transport (Figure 5A, C and Supplementary Table S6). Briefly, some of these genes included, i) the cysCND and cysHIJ operons related with cysteine biosynthesis/sulfate reduction (52); and, ii) the genes dnaK, htpG, clpB, hslT, hslS, hslU and hslV encoding heat shock chaperones. The expression of these genes were decreased in the RcsB-M88A and RcsB-L108A variants (Supplementary Table S6). Unexpectedly, we found that iron metabolism-related genes were also differentially expressed, but in this case only in bacteria producing the RcsB-M88A variant (Figure 5B and C). These genes include the fhuACDB operon, involved in uptake of ferric siderophores, the feoAB operon encoding an iron transporter and, genes involved in enterobactin siderophore production and acquisition (entF, fepE, fepB, entC) (Supplementary Figure S8) (53). Other genes related to metal metabolism were also observed differentially expressed by S. Typhimurium producing either RcsB-WT or the RcsB-L108A variant. These included the iron-metal genes ftnB, ybdR and bfr and the mod operon, this latter involved in molybdenum transport (Supplementary Table S6). In summary, RNASeq performed in S. Typhimurium producing distinct RcsB variants allowed to uncover new putative members of its regulon.
Genome-wide identification of RcsB binding sites in S. Typhimurium
Our structural analysis revealed that RcsB binding in promoter regions seems to recognise the pseudo-palindromic sequence TN(G/A)GN4TCTNA, besides the sequence TN(G/A)GN4TCCNA and TN(G/A)GAN4(A/C)CTNA, albeit with lower affinity for the latter (Figure 4C and Supplementary Figure S6C). This information was used to interrogate the S. Typhimurium genome in order to map sites recognized by RcsB for binding to DNA. We reasoned that this search, based on structural information, could allow us to identify new genes under RcsB control apart from the already identified by RNAseq. We identified a total of 190 of these RcsB palindromic motif sites in the genome of S. Typhimurium strain SL1344 that could be assigned to 206 genes (Supplementary Table S7), of which 139 were detected within coding sequences regions (hereinafter named as ‘Intra-CDS’ boxes) and 67 in intergenic regions. (Figure 6). Of these intergenic sites, 16 were detected in bidirectional promoter regions, as it was the case of the yliJ-dacC intergenic region (Supplementary Figure S9A). Overall, these in silico analyses suggested that RcsB could regulate the expression of more than 210 genes through these operators. The majority of RcsB motif sites mapping in the intergenic regions were located upstream at a relatively short distance (<100 bp) of either the transcriptional-start site (TSS) or the ATG start codon (Supplementary Figure S10). Interestingly, up to 19 RcsB motifs were also located within 5′-UTR regions. Some examples include the RcsB boxes in the 5′-UTR of flhDC and modAB (Supplementary Figure S9B), this latter involved in molybdenum metabolism.
Figure 6.
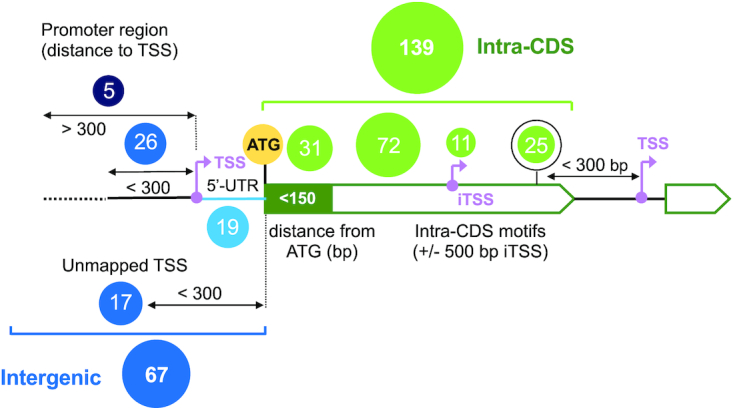
Distribution of predicted RcsB motifs found in the genome of S. Typhimurium strain SL1344. Two main categories: intra-CDS (green) and intergenic (blue). Transcriptional start sites (TSS) are indicated in pink, and initial ATG codon in yellow.
In the case of Intra-CDS RcsB motif sites, 28% of them (11 cases) were located around of internal transcriptional start sites (iTSS) or closer (<300 bp) to the TSS of downstream genes (Figures 6 and 7A). Examples of RcsB boxes located upstream iTSS or closer to TSS of downstream genes were identified within the coding sequences of nlpD, flgA (Figure 7A) and motB (Supplementary Figure S9C), respectively. Lastly, we also found 31 RcsB motif sites mapping in the coding sequences just downstream (<150 bp) of initial ATG codon (Figure 6). A representative case was detected 25 bp downstream of initial ATG codon of fliD (Supplementary Figure S9C and Table S7). This disposition would be compatible with arrest of transcriptional elongation shortly after transcription has initiated, a phenomenon known as ‘roadblocking’. This effect has been reported for the transcriptionals factors CodY in Bacillus subtilis (54) and NtcA in Synechocystis sp. PCC 6803 (55).
Figure 7.

Genome-wide analysis of predicted RcsB binding motifs. (A) Read coverage of potential RcsB target genes. Examples of genes with RcsB binding sites are displayed: internal TSS and downstream gene regulation (rpoS and flgM); located in the iron cluster-related genes fes, entF and fepE; located in the promoter regions osmB and ytfk genes. Values in the X-axis indicate genome coordinates. Values in the Y-axis indicate RNA-seq read density profiles. Blue arrows represent gene positions. Black arrows indicate TSS positions that were retrieved from SalCom (45). (B) Intersection of RcsB motif sites of potential target genes with RNAseq transcriptional expression. Scatter-plot of log2 fold-change (RcsB-WT/null ΔrcsB) versus RcsB binding sites located from -300 bp upstream to +100 bp downstream of either TSS or initial ATG codon. Expressed and repressed genes are coloured in red and blue respectively. Top five most induced/repressed genes are indicated. (C) EMSA experiments were performed with RcsB wild-type and the pseudopalindromic box of RcsB found in promoter regions of fepE, ytfK and osmB as well as in the Intra-CDS regions of nlpD and flgA in order to test binding in the absence and presence of phosphodonor AcP. The sequence of the pseudopalindromic box of RcsB used in the experiments is shown for comparison highlighting in red the nucleotides that compose the box.
Interestingly, crossing the RNAseq results with our mapping exercise involving RcsB motifs uncovered high association with sites upstream of the TSS and for those genes regulated positively. This enrichment contrasted that of sites downstream of TSS or ATG for genes regulated negatively (Figure 7B). To determine the significance of these findings, we focused in predicted RcsB binding sites mapping in the region encompassing from –300 bp upstream to +100 bp downstream of iTSS or initial ATG codon, respectively. This region can be considered key for regulation as we detected 27 genes in which the putative RcsB binding site fulfilled this criterion (Table 2 and Figure 7B). In ten of these genes, the RcsB sites were located downstream of either TSS or ATG codon whereas in 17 they were located upstream in the non-transcribed promoter region. Our study reveals that most (82%, 14/17) genes with increased expression by RcsB contain the motif sequence upstream of TSS or initial ATG codon. In contrast, 70% (7/10) genes with decreased expression showed a RcsB consensus sequences downstream of TSS or ATG codon (Figure 7B). These findings indicate that the location of RcsB binding site upstream or downstream of TSS/ATG initial codon might determine the regulatory mode of this RR. In addition, this agrees with the idea of ‘roadblocking’ to avoid unnecessary transcription when bacteria adapt to changing environmental conditions.
Table 2.
Genes containing RcsB motifs shown by RNA-seq as differentially expressed in S. Typhimurium producing distinct regulator variants
| Motif start | Regulated gene | Symbol | Feature type | Region | Strand | Distance to ATG | TSS | Distance to TSS (range) | Motif (positive strand, 5′-3′) | log2 fold change (WT) | log2 fold change (M88A) | log2 fold change (L108A) |
|---|---|---|---|---|---|---|---|---|---|---|---|---|
| 1337038 | SL1344_1235 | gene | promoter-5′UTR | + | –32 | 1337044 | –6 to 8 | TGAGAATATACTTA | –3.35 | 1.43 | 2.97 | |
| 844864 | SL1344_0758 | modA | gene | 5′UTR | + | –64 | 844835 | 29 to 43 | TGGGAAACCCCTGA | –2.22 | 1.67 | |
| 1979777 | SL1344_1860 | flhD | gene | 5′UTR | – | –143 | 1979837 | 60 to 46 | TGAGATTCGCCTTA | –1.87 | ||
| 1979819 | SL1344_1860 | flhD | gene | 5′UTR | – | –185 | 1979837 | 18 to 4 | TAAGATTTTTCCTA | –1.87 | ||
| 1765036 | SL1344_1644A | ymiA | gene | 5′UTR | – | –36 | 1765037 | 1 to –13 | TGAGACAAATCCTA | –1.10 | ||
| 649004 | SL1344_0577 | fepE | gene | promoter | + | –79 | 649040 | –36 to –22 | TCGGATAATTCTGA | –1.05 | ||
| 866144 | SL1344_0776 | slrP | gene | promoter | + | –55 | 866177 | –33 to –19 | TGAGAATATCCTTA | 0.45 | ||
| 934562 | SL1344_0839 | dacC | gene | promoter | + | –195 | 934578 | –16 to –2 | TGAGATAAACCTAA | 0.70 | ||
| 2239784 | SL1344_2125 | rcnB | gene | promoter | + | –186 | 2239870 | –86 to –72 | TCAGATAGTTCTCA | 0.75 | ||
| 2156848 | SL1344_2057 | udg | gene | 5′UTR | – | –9 | 2156959 | 111 to 97 | TCAGAATTAACTTA | 0.98 | ||
| 3250037 | SL1344_3043 | yggB | gene | 5′UTR | – | –33 | 3250061 | 24 to 10 | TGAGATCATTCTCA | 1.24 | ||
| 1680187 | SL1344_1563 | PBPb | gene | promoter | + | –556 | 1680392 | –205 to –191 | TCAGATATTTCTGA | 1.26 | ||
| 603317 | SL1344_0536 | fimA | gene | promoter | + | –285 | TTAGACCCTTCTTA | 1.42 | ||||
| 437145 | SL1344_0379 | psiF | gene | 5′UTR | + | –57 | 437138 | 7 to 21 | TGGGATATTTCCCA | 1.46 | ||
| 4663803 | SL1344_4339 | ytfK | gene | promoter | + | –165 | 4663853 | –50 to –36 | TTAGATAATTCTGA | 1.72 | ||
| 1601764 | SL1344_1493 | osmC | gene | promoter | – | 243 | 1601743 | –21 to –35 | TGAGATTTATCCTA | 2.67 | ||
| 2968595 | SL1344_2780 | gene | promoter | – | –161 | 2968491 | –104 to –118 | TTAGAAAATACTTA | 2.68 | |||
| 1601764 | SL1344_1494 | yddX | gene | promoter-5′UTR | + | –269 | 1601773 | –9 to 5 | TGAGATTTATCCTA | 2.96 | ||
| 1782070 | SL1344_1659 | yciG | gene | promoter | + | –340 | 1782355 | –55 to –41 | TAAGAAAACTCCTA | 3.01 | ||
| 1251955 | SL1344_1149 | ycfJ | gene | promoter | + | –123 | 1252055 | –100 to –86 | TCGGAGTTGTCCGA | 3.35 | –1.50 | |
| 1756560 | SL1344_1637 | osmB | gene | promoter | + | –215 | 1756633 | –73 to –59 | TAAGACTTTTCTGA | 5.12 | –2.47 | |
| 1983384 | SL1344_1863 | otsB | gene | promoter | – | –318 | 1983117 | –267 to –281 | TGAGACTTTTCCGA | –1.33 | ||
| 4031827 | SL1344_3776 | hslT | gene | promoter | – | –185 | 4031742 | –85 to –99 | TGGGACAGCACTGA | 1.85 | 1.73 | |
| 1977672 | SL1344_1857 | motB | downstream-gene | internalTSS | – | 22 | 1977502 | –170 to –184 | TGGGATGAGCCTGA | –3.24 | 2.25 | |
| 2006994 | SL1344_1889 | fliD | gene | intra-CDS | + | 25 | TGGGATCAAACTTA | –2.94 | 1.99 | |||
| 1213583 | SL1344_1109 | flgM | gene | intra-CDS | – | 649 | 1213566 | –17 to –31 | TAAGAATATTCCCA | –2.93 | –1.38 | –2.28 |
| 2909864 | SL1344_2731 | downstream-gene | intra-CDS | + | –102 | TGGGATATAACTTA | –1.67 | |||||
| 3431481 | SL1344_3215 | tdcC | gene | intra-CDS | – | 589 | TGAGATCAACCTGA | –1.58 | 2.05 | |||
| 3037755 | SL1344_2850 | orgA | gene | intra-CDS | – | 575 | TCAGAACGTTCTGA | –1.41 | ||||
| 2330516 | SL1344_2208 | oafA | gene | intra-CDS | + | 671 | TGGGATAGTCCTCA | –1.23 | ||||
| 3040998 | SL1344_2855 | hilD | gene | intra-CDS | + | 587 | TGAGATCATCCTTA | –0.66 | ||||
| 3936113 | SL1344_3684 | rfaI | downstream-gene | intra-CDS | – | –270 | TAGGAAATCCCTCA | –0.55 | ||||
| 12815 | SL1344_0012 | dnaK | gene | intra-CDS | + | 1223 | TGAGAGAGTTCTGA | –0.46 | 1.87 | 1.74 | ||
| 801182 | SL1344_0718 | sucA | gene | intra-CDS | + | 27 | TTGGACTCTTCTTA | –0.26 | 1.13 | |||
| 643966 | SL1344_0574 | fes | gene | intra-CDS | + | 477 | TGGGATCGTCCTGA | 0.26 | –2.43 | |||
| 695972 | SL1344_0622 | ybeF | gene | internalTSS | – | 695730 | –242 to –256 | TGAGATCGGTCTGA | 1.16 | –0.96 | ||
| 3089909 | SL1344_2904 | nlpD | gene | intra-CDS | – | 334 | TCGGAATATTCCCA | 1.39 | ||||
| 2025283 | SL1344_1911 | rcsA | gene | intra-CDS | + | 289 | TAAGACAAAACTTA | 1.72 | ||||
| 1479070 | SL1344_1379 | mliC | downstream-gene | intra-CDS | + | –98 | 1479085 | –15 to –1 | TCAGAGTTAACTGA | 1.81 | ||
| 1632569 | SL1344_1518 | yncD | gene | intra-CDS | + | 1807 | TGGGATTCGCCTCA | 2.26 | ||||
| 2181905 | SL1344_2078 | wcaK | downstream-gene | intra-CDS | – | 251 | TGAGAATATACTGA | 2.91 | ||||
| 4750668 | SL1344_4416 | yjgB | gene | intra-CDS | – | 703 | TGAGATCGAACTGA | 3.23 | ||||
| 2198160 | SL1344_2093 | wzc | gene | intra-CDS | – | 615 | TGAGAATTTACTCA | 4.43 | ||||
| 4114157 | SL1344_3849 | rbsA | gene | intra-CDS | + | 761 | TGAGATTCGCCTCA | 2.23 | ||||
| 4271020 | SL1344_3987 | antisense | internalTSS | + | 4271128 | –108 to –94 | TGGGATCAAACTCA | –1.43 | ||||
| 2024731 | SL1344_1911 | rcsA | gene | promoter | + | –264 | TAAGGTTTATCCGA | 1.72 |
Validation of RcsB boxes identified in the genome-wide analysis
Our RNAseq data and the mapping of potential RcsB box sites identified new putative members of the RcsB regulon. These included some genes related to iron uptake control (Supplementary Figure S8). Moreover, in some of these cases a potential regulatory mechanism based on roadblocking was inferred. A RcsB site was mapped between entF and fepE (TNGGAN4TCTNA, genome coordinate 649004) in the promoter region of fepE (–35 and –10 sequences were predicted with the server BPROM (56)), and a second site within the coding sequence of fes (TNGGAN4CCTNA, genome coordinate 643966), with probability of affecting transcription of the downstream gene entF (Figure 7A). entF and fes are both involved in the synthesis and degradation of enterobactin, a siderophore that facilitates iron uptake from external sources. Meanwhile, fepE has been shown to be involved in lipopolysaccharide (LPS) very long O antigen chain length polymerization in S. Typhimurium (57). By nuclease assays, we confirmed that RcsB binds, in a phosphorylation dependent way, specifically to the intergenic region between the 3′ end of entF to 5′ fepE gene start codon (sequence from -1 to -249), protecting against DNAse I the region that includes the RcsB consensus sequence (Supplementary Figure S11). To further validate RcsB boxes in genes identified in our genome-wide motif analysis, we selected RcsB consensus sequence located in promoter and Intra-CDS regions whose target genes were also differentially expressed in our RNAseq. This was the case of osmB (log2 fold change = 5.12) and ytfk (log2 fold change = 1.72) (Figure 7A) whose RcsB motifs were located at –215 and –161 nt upstream of the TSS, respectively, as well as flgA (log2 fold change = 2.93) and nlpD (log2 fold change = 1.39) having Intra-CDS boxes (Table 2). EMSA experiments with 23-mer DNA fragments from these genes containing the consensus sequence TN(G/A)GAN4TC(T/C)NA were performed (Figure 7C). These assays confirmed binding of phosphorylated RcsB to fepE, osmB and ytfK promoters and to flgA and nlpD Intra-CDS sequences (Figure 7A and C). Moreover, nucleotide substitution at each DNA fragment were done at the same position in the central base of the (G/A)GA or TC(T/C) motif (position in italic), and as it was expected, the substitutions impaired DNA binding in all cases (Supplementary Figure S12). To confirm that RcsB affected the regulation of these target genes as well as iron-related genes, we conducted qPCR experiments on mRNA samples used in the RNAseq analysis obtained from S. Typhimurium MD4821 (igaA1 ΔrcsB) strains expressing each of the RcsB variants (WT, M88A, D56A, L108A) or empty vector. Differences in transcript level between WT and mutant strains was observed in a similar extent as in the RNAseq, with iron regulation predominantly in the strain expressing the mutant variant M88A (Supplementary Figure S13). Importantly, these results confirmed the presence of the predicted RcsB box at regulatory sequences of genes detected by the RNAseq and genome-wide motif analysis, including those Intra-CDS, as well as direct regulation by phosphorylated RcsB over genes related to iron metabolism. Evaluation of the physiological function and the molecular mechanism of iron metabolism regulation by RcsB will require a future specific study.
DISCUSSION
The Rcs system is a model phosphorelay system that senses signal in the outer membrane and periplasm. As a result, it transmits signals to the cytoplasm in order to modulate gene transcription and achieve a proper response as output. In the Rcs system, the RR RcsB is on charge of modulating gene transcription, a task that can be accomplished alone or together with auxiliary transcriptional factors and, in addition, influenced by phosphorylation. Studies on RcsB have revealed an important number of genes and operons controlled by this RR which are involved in many bacterial functions. Now, our studies focused on RcsB of S. Typhimurium, provide understanding on the molecular basis of gene regulation by DNA-binding, how phosphorylation modulates DNA-binding and how RcsB exploits its conformational dynamism for gene regulation. The structural data presented herein demonstrate that RcsB needs to acquire the active conformation at the REC domain in order to dimerize and to bind DNA. This active conformation is driven and stabilized by the phosphorylation of the conserved Asp in the REC domain. Phosphorylation stabilizes the active conformation by movement of T87 and L108 towards the active site, as predicted by the β5-T coupling mechanism (26), strengthening proper conformations of Lβ3α3, L4βα4 and Lβ5α5 required for REC dimerization that allows DBD domains to dock at the DNA. Interestingly, this mechanism of activation seems to be bi-directional since RcsB binding to the target DNA sequence can also trigger acquisition of the REC active conformation as observed in the unphosphorylated structure of RcsB from E. coli bound to P1flhDC promoter (27). This bi-directionality has been previously reported for OmpR/PhoB and for single domain families of RRs, since the binding of OmpR and CheY, the prototypical RRs of these families, to their DNA and protein targets, respectively, enhanced the RR autophosphorylation (58,59). This observation would explain why unphosphorylated RcsB could also regulate DNA (60). Nonetheless, phosphorylation clearly enhances RcsB dimerization and, consequently, the affinity for DNA binding.
The structural and functional studies have allowed us to identify the pseudopalindromic box TN(G/A)GAN4TC(T/C)NA for homodimeric RcsB binding, and TN(G/A)GAN4(A/C)CTNA albeit with lower affinity binding. This box shares similarity with the RcsAB box (16) and boxes that regulate sRNA rprA (11), flhDC operon (14), ftsA and ftsZ (13), osmC (12) and gadA (17). Our structural data shows that the direct read-out of these boxes is weak, exerted mainly by the flexible K180 that would explain the promiscuity of this transcriptional factor and, consequently, its huge regulon. A comprehensive search for this pseudopalindromic RcsB box in the S. Typhimurium genome identified sites not only in promoter regions but also in transcribed regions, including sites within 5′-UTR regions and inside the coding sequence. Although it is not yet clear how transcriptional regulators may control gene expression binding at coding sequences (61), our data suggest that location of RcsB binding sites downstream of TSS/ATG initial codon may indicate a role of the regulator involving a ‘roadblocking’ mechanism. In this sense, dimerization of RcsB through the REC domains has a primary role in DNA binding for gene regulation, as observed with promoter sequences PrprA and P1flhDC. In the context of signal transduction, our results reveal that RRs may broaden its gene regulatory network by reducing the read-out of DNA sequences through reduction on the number of bases that are recognized at the motifs. However, promiscuous binding capacity does not necessarily rely on sequence specificity. This is observed in nucleoid associated proteins such as the Integration Host Factor (IHF) and CRP, which require a relatively strict match to its consensus sequence, in contrast to LysR-type transcription regulators and H-NS, which rely on DNA shape rather than in sequence (62). In addition, another mechanism of gene regulation may be appointed for the alternative crossed conformation observed for RcsB (26), which allows the formation of homohexamers with alternative arrangements of the recognition helix and, therefore, with putative binding capacity to DNA with different boxes organization and shape. Our data also confirms that unphosphorylated RRs can bind DNA adopting the activated dimeric conformation which is stabilized by phosphorylation. This points out that just active forms of the RRs can be ascribed to DNA binding rather than unphosphorylated or phosphorylated forms. Moreover, these results show that the REC and DBD domains are coupled, a phenomenon previously reported in OmpR (58), which can be now extended to include the NarL-type RRs.
The RNAseq data obtained with strains expressing RcsB variants that affect the extent of phosphorylation have an impact in the genes that are regulated by this RR. We detected differently expressed genes especially between RcsB-WT and the non-phosphorylatable D56A variant. Many of the genes detected as differentially expressed belong to those previously described to be part of the RcsB regulon, such as those involved in motility and extracellular capsule production, among others. Intriguingly, we did not detect major changes in matB and leuO, two genes that are co-regulated by RcsB together with the auxiliary transcriptional factors MatA and BglJ, respectively. This evidence suggests that RcsB overexpression may alter the equilibrium for heterodimer interaction and it could be possible that mutants presenting a displaced equilibrium towards the active form (M88A) or that has restricted plasticity (L108A) could show similar patterns of expression for certain genes regulated by heterocomplexes. However, we detected expression of genes known to be regulated by a RcsA-RcsB heterocomplex, confirmed by the ability of RcsB to increase rcsA expression. On the other hand, RNAseq allowed us to detect other genes already described to be regulated directly or indirectly by RcsB as well as new genes that comprise the cysCND and cysHIJ operons, related with cysteine biosynthesis/sulfate reduction; chaperone-related genes; and, genes related to iron metabolism. Furthermore, the pseudopalindromic RcsB box was detected in 196 genomic sites that were assigned to 206 genes. Of these, 44 genes were detected in the RNAseq as differently expressed, illustrating the complexity of RcsB network. Importantly, 139 RcsB motif sites (∼67%), were located inside of gene coding sequences. Intragenic binding has been reported in recent years for transcriptional regulation in bacteria. Beyond to internal TSS of ncRNAs or antisense, binding to intragenic sites by transcriptional regulators seems to be compatible with transcriptional repression of target genes by a roadblocking mechanism (54) but also with a hypothetical role as chromosome-shaping proteins (55). Closer inspection of these RcsB sites revealed that many could be involved in gene repression, especially for those located at the beginning of the coding sequence, and in transcriptional regulation of downstream genes. In this regard, 70% of genes with decreased expression in the RNAseq, which showed RcsB sites, contained a consensus sequence in the intragenic region, possibly supporting a role for RcsB as a transcriptional repressor when binding to intragenic sites. Moreover, EMSA experiments detected direct binding between phosphorylated RcsB and the promoter or Intra-CDS regions of some differently expressed genes including the fepE gene which is located within a cluster of genes responsible for enterobactin synthesis and transport. This fact has suggested that fepE may possess a potential biological role regulating co-ordinately O antigen chain polymerization and iron transport (57), indeed, alteration of LPS has shown to stimulate enterobactin production (63). Interestingly, the Rcs system is involved in production of colanic acid capsule, thus, an interrelation between O antigen polymerization in LPS and colanic acid in the stress response is plausible as denotes the fact that bacteria without O antigen in LPS overproduces colanic acid (64). Also, the relation between Rcs and regulation of iron related genes is observed in the RNAseq analysis upon expression of the RcsB M88A variant and it has been demonstrated in a recent publication that the heterocomplex RcsB-RcsA together with Fur co-regulate iron-acquisition via entC in Klebsiellapneumoniae (65). This previously unknown aspect of RcsB over iron regulation highlights the crucial role that iron plays in bacterial physiology in basal and altered conditions, not in vain, iron regulation is also under control of the stress response sigma factor RpoS (σS) to prevent oxidative stress (66). Moreover, the rpoS positive transcription depends primarily on small RNAs such as RprA (67) which transcriptional activation is controlled by RcsB. RpoS is involved in many processes such as biofilm formation as well as the heat-shock response (68–70) linking these processes to the Rcs system. Also, the Rcs system seems to be related to the cysteine biosynthesis which has been linked to biofilm formation in different bacteria (71). Altogether, our data expand the RcsB regulon, propose a box for the homodimeric RcsB and give a molecular explanation for the promiscuity of this transcriptional regulator.
DATA AVAILABILITY
Atomic coordinates and structure factors for the reported crystal structures have been deposited with the Protein Data Bank under accession number 6ZJ2 for rprA-RcsB-P, 6ZIX for flhDC-RcsB-P, 6ZII for RcsBREC-P and 6ZIL for RcsBREC. RNA-seq datasets are available at GEO accession (GSE154668).
Python scripts and genomics data used in this work to find RcsB DNA motif are now present in the Github repository (https://github.com/ginerorama/Salmonella-RcsB-regulon).
Supplementary Material
ACKNOWLEDGEMENTS
We would like to thank the Crystallogenesis Facility at Instituto de Biomedicina de Valencia (CSIC) for protein crystallization screenings as well as the NKI Protein Facility for provision of LIC vector(s). The structural results reported in this article derive from measurements made at the synchrotron Diamond Light Source (DLS, Didcot, UK) and ALBA (Cerdanyola del Valles, Spain). Data collection experiments for the best crystals of RcsB structures were taken respectively at synchrotron beamlines BL13-Xaloc at ALBA and I03, I04 and I24 at DLS. We thank the staff of the beamlines used at the synchrotrons for assistance in the measurement of the crystals. X-ray diffraction data collection was supported by Diamond Light Source block allocation group (BAG) Proposal MX20229 and Spanish Synchrotron Radiation Facility ALBA Proposal 2019073629. We thank Dr Vicente Miralles for lending materials. We acknowledge support of the publication fee by the CSIC Open Access Publication Support Initiative through its Unit of Information Resources for Research (URICI).
Contributor Information
Juanjo Huesa, Departamento de Bioquímica y Biología Molecular, Universitat de València. Dr Moliner 50, 46100 Burjassot, Spain; Instituto universitario de Biotecnologia i Biomedicina (BIOTECMED), Universitat de València. Dr Moliner 50, 46100 Burjassot, Spain.
Joaquín Giner-Lamia, Laboratorio de Patógenos Bacterianos Intracelulares. Centro Nacional de Biotecnología (CNB)-CSIC. Darwin 3, 28049 Madrid. Spain; Centro de Biotecnología y Genómica de Plantas (CBGP, UPM-INIA), Campus Montegancedo, E-28223 Pozuelo de Alarcón, Madrid, Spain; Departamento de Biotecnología y Biología Vegetal, ETSI Agronómica, Alimentaria y de Biosistemas, Universidad Politócnica de Madrid, 28040 Madrid, Spain.
M Graciela Pucciarelli, Laboratorio de Patógenos Bacterianos Intracelulares. Centro Nacional de Biotecnología (CNB)-CSIC. Darwin 3, 28049 Madrid. Spain; Centro de Biología Molecular ’Severo Ochoa’ (CBMSO)-CSIC. Departamento de Biología Molecular. Universidad Autónoma de Madrid, Madrid, Spain.
Francisco Paredes-Martínez, Departamento de Bioquímica y Biología Molecular, Universitat de València. Dr Moliner 50, 46100 Burjassot, Spain; Instituto universitario de Biotecnologia i Biomedicina (BIOTECMED), Universitat de València. Dr Moliner 50, 46100 Burjassot, Spain.
Francisco García-del Portillo, Laboratorio de Patógenos Bacterianos Intracelulares. Centro Nacional de Biotecnología (CNB)-CSIC. Darwin 3, 28049 Madrid. Spain.
Alberto Marina, Department of Genomic and Proteomic, Instituto de Biomedicina de Valencia (IBV-CSIC), Jaume Roig 11, 46010 Valencia, Spain; Group 739 of the Centro de Investigación Biomédica en Red sobre Enfermedades Raras (CIBERER) del Instituto de Salud Carlos III, Spain.
Patricia Casino, Departamento de Bioquímica y Biología Molecular, Universitat de València. Dr Moliner 50, 46100 Burjassot, Spain; Instituto universitario de Biotecnologia i Biomedicina (BIOTECMED), Universitat de València. Dr Moliner 50, 46100 Burjassot, Spain; Group 739 of the Centro de Investigación Biomédica en Red sobre Enfermedades Raras (CIBERER) del Instituto de Salud Carlos III, Spain.
SUPPLEMENTARY DATA
Supplementary Data are available at NAR Online.
FUNDING
Spanish Government (Ministerio de Economía y Competitividad y Ministerio de Ciencia e Innovación) [BIO2016-78571-P, PID2019-108541GB-I00 to A.M., BFU2016-78606-P, PID2019-110630GB-I00 to P.C., BIO2016-77639-P to F.G.-dP.]; Valencian Government grant PROMETEO/2020/012 to A.M. P.C. is recipient of a Ramón y Cajal contract from the Ministry of Economy and Competitiveness. Funding for open access charge: Spanish government.
Conflict of interest statement. None declared.
REFERENCES
- 1. Gottesman S., Trisler P., Torres-Cabassa A.. Regulation of capsular polysaccharide synthesis in Escherichia coli K-12: characterization of three regulatory genes. J. Bacteriol. 1985; 162:1111–1119. [DOI] [PMC free article] [PubMed] [Google Scholar]
- 2. Brill J.A., Quinlan-Walshe C., Gottesman S.. Fine-structure mapping and identification of two regulators of capsule synthesis in Escherichia coli K-12. J. Bacteriol. 1988; 170:2599–2611. [DOI] [PMC free article] [PubMed] [Google Scholar]
- 3. Wall E., Majdalani N., Gottesman S.. The complex Rcs regulatory cascade. Annu. Rev. Microbiol. 2018; 72:111–139. [DOI] [PubMed] [Google Scholar]
- 4. Cano D.A., Domínguez-Bernal G., Tierrez A., Garcia-Del Portillo F., Casadesús J.. Regulation of capsule synthesis and cell motility in Salmonella enterica by the essential gene igaA. Genetics. 2002; 162:1513–1523. [DOI] [PMC free article] [PubMed] [Google Scholar]
- 5. Mariscotti J.F., García-del Portillo F.. Instability of the Salmonella RcsCDB signalling system in the absence of the attenuator IgaA. Microbiology. 2008; 154:1372–1383. [DOI] [PubMed] [Google Scholar]
- 6. Hussein N.A., Cho S.-H., Laloux G., Siam R., Collet J.-F.. Distinct domains of Escherichia coli IgaA connect envelope stress sensing and down-regulation of the Rcs phosphorelay across subcellular compartments. PLos Genet. 2018; 14:e1007398. [DOI] [PMC free article] [PubMed] [Google Scholar]
- 7. Wall E.A., Majdalani N., Gottesman S.. IgaA negatively regulates the Rcs phosphorelay via contact with the RcsD phosphotransfer protein. PLos Genet. 2020; 16:e1008610. [DOI] [PMC free article] [PubMed] [Google Scholar]
- 8. Clarke D.J. The Rcs phosphorelay: More than just a two-component pathway. Future Microbiol. 2010; 5:1173–1184. [DOI] [PubMed] [Google Scholar]
- 9. Salvail H., Groisman E.A.. The phosphorelay BarA/SirA activates the non-cognate regulator RcsB in Salmonella enterica. PLos Genet. 2020; 16:e1008722. [DOI] [PMC free article] [PubMed] [Google Scholar]
- 10. Majdalani N., Gottesman S.. The Rcs phosphorelay: a complex signal transduction system. Annu. Rev. Microbiol. 2005; 59:379–405. [DOI] [PubMed] [Google Scholar]
- 11. Majdalani N., Hernandez D., Gottesman S.. Regulation and mode of action of the second small RNA activator of RpoS translation, RprA. Mol. Microbiol. 2002; 46:813–826. [DOI] [PubMed] [Google Scholar]
- 12. Davalos-Garcia M., Conter A., Toesca I., Gutierrez C., Cam K.. Regulation of osmC gene expression by the two-component system rcsB-rcsC in Escherichia coli. J. Bacteriol. 2001; 183:5870–5876. [DOI] [PMC free article] [PubMed] [Google Scholar]
- 13. Carballes F., Bertrand C., Bouche J.-P., Cam K.. Regulation of Escherichia coli cell division genes ftsA and ftsZ by the two-component system rcsC-rcsB. Mol. Microbiol. 1999; 34:442–450. [DOI] [PubMed] [Google Scholar]
- 14. Francez-Charlot A., Laugel B., Van Gemert A., Dubarry N., Wiorowski F., Castanié-Cornet M.-P., Gutierrez C., Cam K.. RcsCDB His-Asp phosphorelay system negatively regulates the flhDC operon in Escherichia coli. Mol. Microbiol. 2004; 49:823–832. [DOI] [PubMed] [Google Scholar]
- 15. Mouslim C., Hughes K.T.. The effect of cell growth phase on the regulatory cross-talk between flagellar and spi1 virulence gene expression. PLoS Pathog. 2014; 10:e1003987. [DOI] [PMC free article] [PubMed] [Google Scholar]
- 16. Wehland M., Bernhard F.. The RcsAB box. Characterization of a new operator essential for the regulation of exopolysaccharide biosynthesis in enteric bacteria. J. Biol. Chem. 2000; 275:7013–7020. [DOI] [PubMed] [Google Scholar]
- 17. Castanié-Cornet M.P., Cam K., Bastiat B., Cros A., Bordes P., Gutierrez C.. Acid stress response in Escherichia coli: mechanism of regulation of gadA transcription by RcsB and GadE. Nucleic. Acids. Res. 2010; 38:3546–3554. [DOI] [PMC free article] [PubMed] [Google Scholar]
- 18. Venkatesh G.R., Koungni F.C.K., Paukner A., Stratmann T., Blissenbach B., Schnetz K. BglJ-RcsB heterodimers relieve repression of the Escherichia coli bgl operon by H-NS. J. Bacteriol. 2010; 192:6456–6464. [DOI] [PMC free article] [PubMed] [Google Scholar]
- 19. Lehti T.A., Heikkinen J., Korhonen T.K., Westerlund-Wikström B.. The response regulator RcsB activates expression of Mat fimbriae in meningitic Escherichia coli. J. Bacteriol. 2012; 194:3475–3485. [DOI] [PMC free article] [PubMed] [Google Scholar]
- 20. Kühne C., Singer H.M., Grabisch E., Codutti L., Carlomagno T., Scrima A., Erhardt M.. RflM mediates target specificity of the RcsCDB phosphorelay system for transcriptional repression of flagellar synthesis in Salmonella enterica. Mol. Microbiol. 2016; 101:841–855. [DOI] [PubMed] [Google Scholar]
- 21. Ferrières L., Clarke D.J.. The RcsC sensor kinase is required for normal biofilm formation in Escherichia coli K-12 and controls the expression of a regulon in response to growth on a solid surface. Mol. Microbiol. 2003; 50:1665–1682. [DOI] [PubMed] [Google Scholar]
- 22. Hagiwara D., Sugiura M., Oshima T., Mori H., Aiba H., Yamashino T., Mizuno T.. Genome-wide analyses revealing a signaling network of the RcsC-YojN-RcsB phosphorelay system in Escherichia coli. J. Bacteriol. 2003; 185:5735–5746. [DOI] [PMC free article] [PubMed] [Google Scholar]
- 23. Mariscotti J.F., Portillo F.G. Del. Genome expression analyses revealing the modulation of the salmonella Rcs regulon by the attenuator IgaA. J. Bacteriol. 2009; 191:1855–1867. [DOI] [PMC free article] [PubMed] [Google Scholar]
- 24. Wang Q., Zhao Y., McClelland M., Harshey R.M.. The RcsCDB signaling system and swarming motility in Salmonella enterica serovar typhimurium: dual regulation of flagellar and SPI-2 virulence genes. J. Bacteriol. 2007; 189:8447–8457. [DOI] [PMC free article] [PubMed] [Google Scholar]
- 25. Filippova E. V., Wawrzak Z., Ruan J., Pshenychnyi S., Schultz R.M., Wolfe A.J., Anderson W.F.. Crystal structure of nonphosphorylated receiver domain of the stress response regulator RcsB from Escherichia coli. Protein Sci. 2016; 25:2216–2224. [DOI] [PMC free article] [PubMed] [Google Scholar]
- 26. Casino P., Miguel-Romero L., Huesa J., García P., García-Del Portillo F., Marina A.. Conformational dynamism for DNA interaction in the Salmonella RcsB response regulator. Nucleic Acids Res. 2018; 46:456–472. [DOI] [PMC free article] [PubMed] [Google Scholar]
- 27. Filippova E. V., Zemaitaitis B., Aung T., Wolfe A.J., Anderson W.F.. Structural basis for DNA recognition by the two-component response regulator RcsB. mBio. 2018; 9:e01993-17. [DOI] [PMC free article] [PubMed] [Google Scholar]
- 28. Luna-Vargas M.P.A., Christodoulou E., Alfieri A., van Dijk W.J., Stadnik M., Hibbert R.G., Sahtoe D.D., Clerici M., Marco V. De, Littler D.et al.. Enabling high-throughput ligation-independent cloning and protein expression for the family of ubiquitin specific proteases. J. Struct. Biol. 2011; 175:113–119. [DOI] [PubMed] [Google Scholar]
- 29. Bell N.A. The titrimetric determination of beryllium by using the tartrate fluoride procedure. Analyst. 1975; 100:124–128. [Google Scholar]
- 30. Kabsch W. XDS. Acta Crystallogr. Sect. D Biol. Crystallogr. 2010; 66:125–132. [DOI] [PMC free article] [PubMed] [Google Scholar]
- 31. Winn M.D., Ballard C.C., Cowtan K.D., Dodson E.J., Emsley P., Evans P.R., Keegan R.M., Krissinel E.B., Leslie A.G.W., McCoy A.et al.. Overview of the CCP4 suite and current developments. Acta Crystallogr. Sect. D Biol. Crystallogr. 2011; 67:235–242. [DOI] [PMC free article] [PubMed] [Google Scholar]
- 32. McCoy A.J., Grosse-Kunstleve R.W., Adams P.D., Winn M.D., Storoni L.C., Read R.J.. Phaser crystallographic software. J. Appl. Crystallogr. 2007; 40:658–674. [DOI] [PMC free article] [PubMed] [Google Scholar]
- 33. Emsley P., Lohkamp B., Scott W.G., Cowtan K.. Features and development of Coot. Acta Crystallogr. Sect. D Biol. Crystallogr. 2010; 66:486–501. [DOI] [PMC free article] [PubMed] [Google Scholar]
- 34. Murshudov G.N., Skubák P., Lebedev A.A., Pannu N.S., Steiner R.A., Nicholls R.A., Winn M.D., Long F., Vagin A.A.. REFMAC5 for the refinement of macromolecular crystal structures. Acta Crystallogr. Sect. D Biol. Crystallogr. 2011; 67:355–367. [DOI] [PMC free article] [PubMed] [Google Scholar]
- 35. Pettersen E.F., Goddard T.D., Huang C.C., Couch G.S., Greenblatt D.M., Meng E.C., Ferrin T.E.. UCSF Chimera--A visualization system for exploratory research and analysis. J. Comput. Chem. 2004; 25:1605–1612. [DOI] [PubMed] [Google Scholar]
- 36. Domínguez-Bernal G., Pucciarelli M.G., Ramos-Morales F., García-Quintanilla M., Cano D.A., Casadesús J., García-Del Portillo F.. Repression of the RcsC-YojN-RcsB phosphorelay by the IgaA protein is a requisite for Salmonella virulence. Mol. Microbiol. 2004; 53:1437–1449. [DOI] [PubMed] [Google Scholar]
- 37. Toledo-Arana A., Dussurget O., Nikitas G., Sesto N., Guet-Revillet H., Balestrino D., Loh E., Gripenland J., Tiensuu T., Vaitkevicius K.et al.. The Listeria transcriptional landscape from saprophytism to virulence. Nature. 2009; 459:950–956. [DOI] [PubMed] [Google Scholar]
- 38. Langmead B., Salzberg S.L.. Fast gapped-read alignment with Bowtie 2. Nat. Methods. 2012; 9:357–359. [DOI] [PMC free article] [PubMed] [Google Scholar]
- 39. Anders S., Pyl P.T., Huber W.. HTSeq-A Python framework to work with high-throughput sequencing data. Bioinformatics. 2015; 31:166–169. [DOI] [PMC free article] [PubMed] [Google Scholar]
- 40. Love M.I., Huber W., Anders S.. Moderated estimation of fold change and dispersion for RNA-seq data with DESeq2. Genome Biol. 2014; 15:550. [DOI] [PMC free article] [PubMed] [Google Scholar]
- 41. Mi H., Muruganujan A., Thomas P.D.. PANTHER in 2013: modeling the evolution of gene function, and other gene attributes, in the context of phylogenetic trees. Nucleic. Acids. Res. 2013; 41:377–386. [DOI] [PMC free article] [PubMed] [Google Scholar]
- 42. de Hoon M.J.L., Imoto S., Nolan J., Miyano S.. Open source clustering software. Bioinformatics. 2004; 20:1453–1454. [DOI] [PubMed] [Google Scholar]
- 43. Saldanha A.J. Java Treeview - extensible visualization of microarray data. Bioinformatics. 2004; 20:3246–3248. [DOI] [PubMed] [Google Scholar]
- 44. Garre E., Romero-Santacreu L., Barneo-Muñoz M., Miguel A., Pérez-Ortín J.E., Alepuz P., Bardoni B.. Nonsense-mediated mRNA decay controls the changes in yeast ribosomal protein pre-mRNAs levels upon osmotic Stress. PLoS One. 2013; 8:e61240. [DOI] [PMC free article] [PubMed] [Google Scholar]
- 45. Kröger C., Colgan A., Srikumar S., Händler K., Sivasankaran S.K., Hammarlöf D.L., Canals R., Grissom J.E., Conway T., Hokamp K.et al.. An infection-relevant transcriptomic compendium for Salmonella enterica serovar typhimurium. Cell Host Microbe. 2013; 14:683–695. [DOI] [PubMed] [Google Scholar]
- 46. Trajtenberg F., Albanes D., Ruétalo N., Botti H., Mechaly A.E., Nieves M., Aguilar P.S., Cybulski L., Larrieux N., De Mendoza D.et al.. Allosteric activation of bacterial response regulators: The role of the cognate histidine kinase beyond phosphorylation. mBio. 2014; 5:e02105. [DOI] [PMC free article] [PubMed] [Google Scholar]
- 47. Leonard P.G., Golemi-Kotra D., Stock A.M.. Phosphorylation-dependent conformational changes and domain rearrangements in Staphylococcus aureus VraR activation. Proc. Natl. Acad. Sci. U.S.A. 2013; 110:8525–8530. [DOI] [PMC free article] [PubMed] [Google Scholar]
- 48. Girdlestone C., Hayward S.. The DynDom3D webserver for the analysis of domain movements in multimeric proteins. J. Comput. Biol. 2016; 23:21–26. [DOI] [PubMed] [Google Scholar]
- 49. Sagendorf J.M., Markarian N., Berman H.M., Rohs R.. DNAproDB: an expanded database and web-based tool for structural analysis of DNA-protein complexes. Nucleic. Acids. Res. 2020; 48:D277–D287. [DOI] [PMC free article] [PubMed] [Google Scholar]
- 50. Thao S., Chen C.S., Zhu H., Escalante-Semerena J.C.. Nϵ-lysine acetylation of a bacterial transcription factor inhibits its DNA-binding activity. PLoS One. 2010; 5:e15123. [DOI] [PMC free article] [PubMed] [Google Scholar]
- 51. Ferrières L., Aslam S.N., Cooper R.M., Clarke D.J.. The yjbEFGH locus in Escherichia coli K-12 is an operon encoding proteins involved in exopolysaccharide production. Microbiology. 2007; 153:1070–1080. [DOI] [PubMed] [Google Scholar]
- 52. Gyaneshwar P., Paliy O., McAuliffe J., Popham D.L., Jordan M.I., Kustu S.. Sulfur and nitrogen limitation in Escherichia coli K-12: specific homeostatic responses. J. Bacteriol. 2005; 187:1074–1090. [DOI] [PMC free article] [PubMed] [Google Scholar]
- 53. McHugh J.P., Rodríguez-Quiñones F., Abdul-Tehrani H., Svistunenko D.A., Poole R.K., Cooper C.E., Andrews S.C.. Global iron-dependent gene regulation in Escherichia coli: A new mechanism for iron homeostasis. J. Biol. Chem. 2003; 278:29478–29486. [DOI] [PubMed] [Google Scholar]
- 54. Belitsky B.R., Sonenshein A.L.. Roadblock repression of transcription by Bacillus subtilis CodY. J. Mol. Biol. 2011; 411:729–743. [DOI] [PMC free article] [PubMed] [Google Scholar]
- 55. Giner-Lamia J., Robles-Rengel R., Hernández-Prieto M.A., Isabel Muro-Pastor M., Florencio F.J., Futschik M.E.. Identification of the direct regulon of NtcA during early acclimation to nitrogen starvation in the cyanobacterium Synechocystis sp. PCC 6803. Nucleic. Acids. Res. 2017; 45:11800–11820. [DOI] [PMC free article] [PubMed] [Google Scholar]
- 56. Solovyev V. Li RW V. Solovyev, A Salamov (2011) Automatic annotation of microbial genomes and metagenomic sequences. Metagenomics and its Applications in Agriculture, Biomedicine and Environmental Studies. 2011; Nova Science Publishers; 61–78. [Google Scholar]
- 57. Murray G.L., Attridge S.R., Morona R.. Regulation of Salmonella typhimurium lipopolysaccharide O antigen chain length is required for virulence; identification of FepE as a second Wzz. Mol. Microbiol. 2003; 47:1395–1406. [DOI] [PubMed] [Google Scholar]
- 58. Ames S.K., Frankema N., Kenney L.J.. C-terminal DNA binding stimulates N-terminal phosphorylation of the outer membrane protein regulator OmpR from Escherichia coli. Proc. Natl. Acad. Sci. U.S.A. 1999; 96:11792–11797. [DOI] [PMC free article] [PubMed] [Google Scholar]
- 59. Schuster M., Silversmith R.E., Bourret R.B.. Conformational coupling in the chemotaxis response regulator CheY. Proc. Natl. Acad. Sci. U.S.A. 2001; 98:6003–6008. [DOI] [PMC free article] [PubMed] [Google Scholar]
- 60. Latasa C., García B., Echeverz M., Toledo-Arana A., Valle J., Campoy S., García-del Portillo F., Solano C., Lasa I.. Salmonella biofilm development depends on the phosphorylation status of RcsB. J. Bacteriol. 2012; 194:3708–3722. [DOI] [PMC free article] [PubMed] [Google Scholar]
- 61. Mrázek J., Karls A.C.. In silico simulations of occurrence of transcription factor binding sites in bacterial genomes. BMC Evol. Biol. 2019; 19:67. [DOI] [PMC free article] [PubMed] [Google Scholar]
- 62. Dorman C.J., Schumacher M.A., Bush M.J., Brennan R.G., Buttner M.J.. When is a transcription factor a NAP?. Curr. Opin. Microbiol. 2020; 55:26–33. [DOI] [PMC free article] [PubMed] [Google Scholar]
- 63. Conley Z.C., Carlson-Banning K.M., Carter A.G., De La Cova A., Song Y., Zechiedrich L.. Sugar and iron: Toward understanding the antibacterial effect of ciclopirox in Escherichia coli. PLoS One. 2019; 14:e0210547. [DOI] [PMC free article] [PubMed] [Google Scholar]
- 64. Ren G., Wang Z., Li Y., Hu X., Wang X.. Effects of lipopolysaccharide core sugar deficiency on colanic acid biosynthesis in Escherichia coli. J. Bacteriol. 2016; 198:1576–1584. [DOI] [PMC free article] [PubMed] [Google Scholar]
- 65. Yuan L., Li X., Du L., Su K., Zhang J., Liu P., He Q., Zhang Z., Peng D., Shen L.et al.. RcsAB and Fur coregulate the iron-acquisition system via entC in Klebsiella pneumoniae NTUH-K2044 in response to iron availability. Front. Cell. Infect. Microbiol. 2020; 10:282. [DOI] [PMC free article] [PubMed] [Google Scholar]
- 66. Lévi-Meyrueis C., Monteil V., Sismeiro O., Dillies M.A., Monot M., Jagla B., Coppée J.Y., Dupuy B., Norel F.. Expanding the RpoS/σS-network by RNA sequencing and identification of σS-controlled small RNAs in Salmonella. PLoS One. 2014; 9:e96918. [DOI] [PMC free article] [PubMed] [Google Scholar]
- 67. McCullen C.A., Benhammou J.N., Majdalani N., Gottesman S.. Mechanism of positive regulation by DsrA and RprA small noncoding RNAs: Pairing increases translation and protects rpoS mRNA from degradation. J. Bacteriol. 2010; 192:5559–5571. [DOI] [PMC free article] [PubMed] [Google Scholar]
- 68. Loewen P.C., Hu B., Strutinsky J., Sparling R.. Regulation in the rpoS regulon of Escherichia coli. Can. J. Microbiol. 1998; 44:707–717. [DOI] [PubMed] [Google Scholar]
- 69. Corona-Izquierdo F.P., Membrillo-Hernández J.. A mutation in rpoS enhances biofilm formation in Escherichia coli during exponential phase of growth. FEMS Microbiol. Lett. 2002; 211:105–110. [DOI] [PubMed] [Google Scholar]
- 70. Evans C.R., Fan Y., Ling J.. Increased mistranslation protects E. coli from protein misfolding stress due to activation of a RpoS-dependent heat shock response. FEBS Lett. 2019; 593:3220–3227. [DOI] [PMC free article] [PubMed] [Google Scholar]
- 71. Singh P., Brooks J.F., Ray V.A., Mandel M.J., Visick K.L.. CysK plays a role in biofilm formation and colonization by Vibrio fischeri. Appl. Environ. Microbiol. 2015; 81:5223–5234. [DOI] [PMC free article] [PubMed] [Google Scholar]
Associated Data
This section collects any data citations, data availability statements, or supplementary materials included in this article.
Supplementary Materials
Data Availability Statement
Atomic coordinates and structure factors for the reported crystal structures have been deposited with the Protein Data Bank under accession number 6ZJ2 for rprA-RcsB-P, 6ZIX for flhDC-RcsB-P, 6ZII for RcsBREC-P and 6ZIL for RcsBREC. RNA-seq datasets are available at GEO accession (GSE154668).
Python scripts and genomics data used in this work to find RcsB DNA motif are now present in the Github repository (https://github.com/ginerorama/Salmonella-RcsB-regulon).