Significance Statement
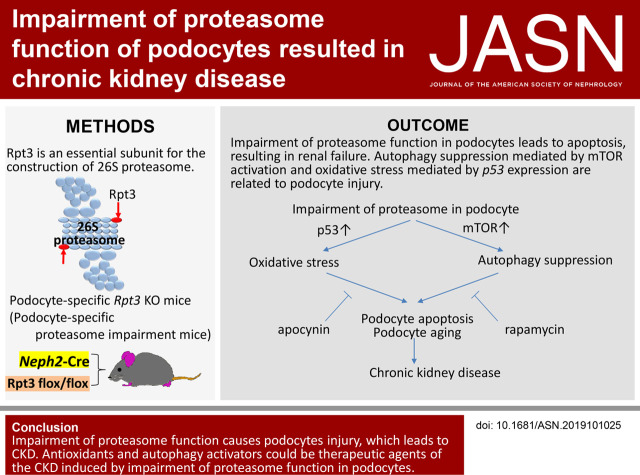
The ubiquitin-proteasome system (UPS) and the autophagy-lysosomal system (APLS) are major intracellular protein degradation mechanisms. The importance of the APLS in podocytes is established, but the role of the UPS is not well understood. The first mouse model of podocyte-specific proteasome impairment revealed that UPS plays important roles in podocyte homeostasis, inducing p53-mediated apoptosis and mTOR-mediated autophagy suppression. The podocytes with impaired proteasomes exhibited characteristic features of aging and increase in a marker of aging. Our data suggest that proteasome impairment in podocytes leads to CKD and show that antioxidants and autophagy activators could be therapeutic agents for age-dependent CKD.
Keywords: podocyte, ubiquitin-proteasome system, autophagy-lysosomal system, oxidative stress, apoptosis
Visual Abstract
Abstract
Background
The ubiquitin-proteasome system (UPS) and the autophagy-lysosomal system (APLS) are major intracellular degradation procedures. The importance of the APLS in podocytes is established, but the role of the UPS is not well understood.
Methods
To investigate the role of the UPS in podocytes, mice were generated that had deletion of Rpt3 (Rpt3pdKO), which encodes an essential regulatory subunit required for construction of the 26S proteasome and its deubiquitinating function.
Results
Rpt3pdKO mice showed albuminuria and glomerulosclerosis, leading to CKD. Impairment of proteasome function caused accumulation of ubiquitinated proteins and of oxidative modified proteins, and it induced podocyte apoptosis. Although impairment of proteasome function normally induces autophagic activity, the number of autophagosomes was lower in podocytes of Rpt3pdKO mice than in control mice, suggesting the autophagic activity was suppressed in podocytes with impairment of proteasome function. In an in vitro study, antioxidant apocynin and autophagy activator rapamycin suppressed podocyte apoptosis induced by proteasome inhibition. Moreover, rapamycin ameliorated the glomerular injury in the Rpt3pdKO mice. The accumulation of ubiquitinated proteins and of oxidative modified proteins, which were detected in the podocytes of Rpt3pdKO mice, is a characteristic feature of aging. An aging marker was increased in the podocytes of Rpt3pdKO mice, suggesting that impairment of proteasome function promoted signs of aging in podocytes.
Conclusions
Impairment of proteasome function in podocytes led to CKD, and antioxidants and autophagy activators can be therapeutic agents for age-dependent CKD.
The prevalence of CKD in the elderly is one of the biggest challenges facing kidney specialists worldwide. Podocytes are specialized cells that cover the urinary side of the glomerular basement membrane. Podocyte injury causes podocyte detachment from the glomerular basement membrane and proteinuria, and sustained injury will lead to glomerulosclerosis and even CKD. The mechanisms of podocyte injury, however, are not yet fully understood.
The ubiquitin-proteasome system (UPS) and the autophagy-lysosomal system (APLS) are major intracellular protein degradation procedures, and they are important for maintaining cell homeostasis. Podocytes show high levels of autophagic activity under basal conditions.1 The podocyte-specific deficiency of autophagy, however, has shown no obvious histologic phenotype in young mice2,3 and leads to glomerulopathy in aging mice.2 It is interesting that the proteasome activity of glomeruli was increased in young mice, whereas it was decreased in aging mice.2 Thus, we theorized that not only APLS but also UPS must play a crucial role in podocytes and that a decrease in proteasome activity must be related to the progression of CKD.
In the UPS process, ubiquitin tags a protein and marks it for degradation by the 26S proteasome, an ATP-dependent protease complex present in both cytoplasm and nuclei. The 26S proteasome is composed of a 20S proteolytic core particle and 19S regulatory particles. The 20S core particle has a hollow barrel shape, in which an α-ring and a β-ring, both consisting of seven subunits, are stacked in the order of αββα. The 20S also contains a protease active center that is exposed on the inner wall of the β-ring. The 19S regulatory particle is a complex wherein an ATPase ring composed of subunits with six ATPase activities is associated with ten or more types of non-ATPase subunits. The 19S complex binds and deubiquitinates polyubiquitinated proteins prior to their degradation within the 20S complex. The ATPase Rpt3 is a component of the 19S complex and is essential for the construction of the 26S proteasome. Systemic Rpt3 deficiency in mice is known to display defective blastocyst development and result in preimplantation death.4
In this study, we generated podocyte-specific proteasome impairment mice (podocyte-specific Rpt3-knockout mice) to investigate the role of UPS in podocytes.
Herein, we elucidate the relationship between UPS and APLS in podocytes and provide further evidence to help explain the role of intracellular protein degradation in CKD.
Methods
Generation and Genotyping of Rpt3pdKO Mice
Rpt3 flox/flox mice inbred line C57BL/6J was provided by the Department of Neurology, Kyoto University Graduate School of Medicine, Japan.5 Rpt3 flox/flox mice were crossed with NPHS2-Cre mice (C57BL/6J background) to generate Rpt3 flox/flox NPHS2-Cre+, podocyte-specific Rpt3-knockout (Rpt3pdKO) mice. NPHS2-Cre mice have been previously described.6 In this study, 4-week-old mice were mainly used. Rpt3 flox/WT NPHS2-Cre+ and Rpt3 flox/flox NPHS2-Cre− littermates served as control animals (Rpt3Control) in this study. These littermates showed no pathologic phenotypes when examined under histologic methods (Supplemental Figure 1A). All mice were maintained in specific pathogen–free facilities, with free access to water and a normal pelleted diet. Rpt3 flox/flox, Rpt3 WT/WT, and Rpt3 flox/WT were distinguished by genotyping with cut tails (Supplemental Figure 1B). Mice were genotyped using genomic PCR with the following primer: Rpt3 forward (5′-TGAGCTGTGTATCAAGGTCC-3′), Rpt3 reverse (5′-TAGAAGCTGCCTAAGGCACA-3′), NPHS2-Cre forward (5′-TTTGCCTGCATTACCGGTCGATGCAAC-3′), and NPHS2-Cre reverse (5′-TGCCCCTGTTTCACTATCCAGGTTACGGA-3′).
Administration of Rapamycin or Chloroquine to Mice
Mice were injected intraperitoneally with rapamycin in a dose of 4 mg/kg body wt every other day from 3 to 8 weeks of age. Rapamycin was dissolved in DMSO and further diluted with sunflower oil to a concentration of 0.2 mg/ml. Vehicle group was injected with the same volume of DMSO diluted with sunflower oil. Mice were injected intraperitoneally with chloroquine in a dose of 100 mg/kg body wt. Vehicle group was injected with PBS. Kidneys of the mice were removed 6 hours after chloroquine injection.
Histologic Analysis
Histologic analysis of mice kidneys was performed as previously described.7 Immunofluorescence (IF) images were obtained by reconstructing the images taken with the focus shifted every 2 μm by Z stack using an all-in-one microscope (BZ-X710; KEYENCE) and confocal laser scanning microscopy (LSM 780; ZEISS). Mice kidney sections were labeled with anti-Rpt3 (BML-PW8175, rabbit, 1:100; Enzo), anti-WT1 (sc-192, rabbit, 1:25; Santa Cruz), anti-Ubiquitin (Z0458, rabbit, 1:200; DAKO), anti–8-hydroxy-2'-deoxyguanosine (anti–8-OHdG; bs-1278R, rabbit, 1:200; Bioss Inc.), anticleaved caspase 3 (#9661, rabbit, 1:250; Cell Signaling), antinephrin (GP-N2, guinea pig, 1:50; Progen, Heidelberg, Germany), anti-p62 (GP62-C, guinea pig, 1:100; Progen, Heidelberg, Germany), anti-p53 (#1C12, mouse, 1:2000; Cell Signaling), and antisynaptopodin (65194, mouse, 1:10; Progen) antibodies. Antipodocin8 antibodies were prepared as previously described.
Electron Microscopy
Electron microscopy was performed as described previously.9
Cell Culture
Conditionally immortalized mouse podocytes were cultured as described previously.10 For IF staining, cultured podocytes were plated on type 1 collagen-coated coverslips. Cells were fixed in 2% paraformaldehyde and 4% sucrose in PBS for 5 minutes and were permeabilized with 0.5% Tx-100/PBS. After fixation, staining was performed in the same protocol as the tissue sample. Commercially available reagents were obtained from the following sources: bortezomib (A10160; Adooq Bioscience), apocynin (A10809–25G; Sigma-Aldrich), E64d (4321v; PEPTIDE INSTITUTE, INC.), Pepstatin A (4397; PEPTIDE INSTITUTE, INC.), rapamycin (R124000; Toronto Research Chemicals Inc.), and Chloroquine (08660–04; NACALAI TESQUE, INC.).
Western Blotting
Mouse glomeruli were isolated as previously described.11 Lysates of glomeruli or cultured podocytes were prepared in CHAPS buffer and supplemented with protease inhibitor (Complete Mini) and a proteasome inhibitor (lactacystin), as previously described.9 Blots were probed with anti-Rpt3 (BML-PW8175, rabbit, 1:1000; Enzo), anticleaved caspase 3 (#9661, rabbit, 1:1000; Cell Signaling), anticleaved caspase 8 (asp387#9429, rabbit, 1:1000; Cell Signaling), antinephrin (GP-N2, guinea pig, 1:1000; Progen), anti-p62 (GP62-C, guinea pig, 1:1000; Progen), anti-p53 (#1C12, mouse, 1:1000; Cell Signaling), anti-Multi Ubiquitin (D058–3, mouse, 1:1000; MBL, Nagoya, Japan), anti-GAPDH (G8795, mouse, 1:1000; Sigma-Aldrich), anti-mTOR (#2972, rabbit, 1:1000; Cell Signaling), antiphospho-S6 ribosomal (91B2#4857, rabbit, 1:1000; Cell Signaling), anti-S6 ribosomal (5G10#2217, rabbit, 1:1000; Cell Signaling), anti-p19ARF (NB-200–106, rabbit, 1:1000; Novus Biologicals), anti-Bip (#3183, rabbit, 1:1000; Cell Signaling), anti-ULK1 (D8H5, rabbit, 1:1000; Cell Signaling), antiphospho-ULK1 (Ser757, rabbit, 1:1000; Cell Signaling), and anti-BiP (#3183, rabbit, 1:1000; Cell Signaling) antibodies. Anti-LC312 and antipodocin8 antibodies were prepared as previously described.
Biochemical Measurements
Urinary albumin was measured using a mouse albumin ELISA kit (Shibayagi, Gunma, Japan). Blood samples were obtained from anesthetized mice and centrifuged at 5000 rpm for 3 minutes at 4°C to obtain serum. Serum and urine creatinine were measured using Lab Assay Creatinine (Wako, Osaka, Japan).
Quantification of the Area of LC3 Dots or p62 Particles
To evaluate the LC3 dots or p62 particles in podocytes, we measured the area of LC3 dots or p62 particles that had merged with synaptopodin. Each individual color image (LC3, synaptopodin, and p62) was extracted and converted to a binarized image according to the threshold. The areas of LC3 dots or p62 particles merged with synaptopodin were quantified using the analyze-particles function of ImageJ software 1.50i (National Institutes of Health).
Proteasome Activity Assay
Proteasome activity was measured using cell lysate according to the manufacturer’s protocol (Proteasome 20S Activity Assay Kit, MAK172; Sigma-Aldrich). Briefly, cultured podocytes treated with DMSO or bortezomib were homogenized with lysis buffer (0.5% NP-40, 2 mM ATP, 5 mM MgCl2, 1 mM DTT, and 50 mM Tris-HCl). After centrifuge for 10 minutes at 4°C and 13,000 rpm, a proteasome substrate of LLVY-R110 was added to the supernatant of the cell lysate. Two hours after incubation at 37°C, fluorescence intensity was measured at excitation =490 nm and emission =525 nm.
Quantification of 8-OHdGs
Random images of 8-OHdG staining were taken at more than ten locations in each time course in vitro and 30 glomeruli in each kidney section, and the fluorescence intensity of the images was quantified using ImageJ software.
Statistical Analyses
All statistical analyses were performed using R version 3.3.1 (The R Foundation for Statistical Computing, Vienna, Austria). Kaplan–Meier survival analysis was performed using the Wilcoxon test. Statistical significance between the two groups was evaluated using a Welch t test or a Mann–Whitney U test and was determined as statistically significant when P=0.05. Data are represented as the mean ± SEMs.
Study Approval
All animal experiments were guided and approved by the Committee for Animal Experiments of Kyoto University (Japan) and the Committee for Animal Experiments of Chiba University (Japan). The committees of animal handling at both Kyoto and Chiba Universities also approved the experimental procedures used.
Results
Podocyte-Specific Rpt3 KO Showed FSGS-Like Lesion and Resulted in Renal Failure
To determine the role of UPS in podocytes, we generated Rpt3pdKO mice. IF staining (Figure 1A) and western blotting (WB) (Supplemental Figure 2) showed that the expression of Rpt3 in the glomeruli of Rpt3pdKO mice was lower than that in the glomeruli of their control littermates (Rpt3Control) at 4 weeks of age. Rpt3pdKO mice were born at the expected Mendelian frequency with no gross renal anomalies. Kaplan–Meier survival curves for a total of 50 weeks showed that Rpt3pdKO mice had a significantly lower survival ratio than Rpt3Control mice (P<0.001, by Wilcoxon test) (Figure 1B). The kidneys of Rpt3pdKO mice were atrophic with a rough surface and a yellowish appearance at 14 weeks of age (Figure 1C). Rpt3pdKO mice developed albuminuria starting from 4 weeks of age, and significantly higher levels appeared in Rpt3pdKO mice than in Rpt3Control mice at 8 weeks of age (Figure 1D). Rpt3pdKO mice had significantly higher levels of serum creatinine than Rpt3Control mice at 8 weeks of age (Figure 1E). These results indicate that Rpt3pdKO mice were suffering from CKD and consequently, had a shorter life expectancy than Rpt3Control mice. In histologic analysis, there were no sclerotic glomeruli in either type of mice at 4 weeks of age, but Rpt3pdKO mice showed FSGS-like lesions at 8 weeks of age (Figure 1F). The sclerotic per total glomeruli ratio in each kidney section of Rpt3pdKO mice was significantly increased compared with Rpt3Control mice at 8 weeks of age (Figure 1G). Many studies have shown that a reduction in the number of podocytes correlates with proteinuria and leads to glomerulosclerosis.13–15 To count the number of podocytes in the glomeruli, fixed and frozen sections of kidneys were stained with WT1, a nuclear marker of podocytes (Supplemental Figure 3). The number of WT1-positive nuclei was significantly decreased at 4 weeks of age in Rpt3pdKO mice compared with Rpt3Control mice (Figure 2A). In IF staining, the expressions of the slit diaphragm proteins podocin and nephrin showed a linear pattern in Rpt3Control mice, whereas these proteins showed cytosolic pattern in Rpt3pdKO mice (Figure 2B). The expressions of these proteins were significantly decreased at 4 weeks of age in Rpt3pdKO mice compared with that of Rpt3Control mice, as shown by WB of the glomerular lysates (Figure 2, C–E). These results strongly suggest that Rpt3 KO in podocytes results in podocyte injury and loss, which lead to glomerulosclerosis and kidney failure.
Figure 1.
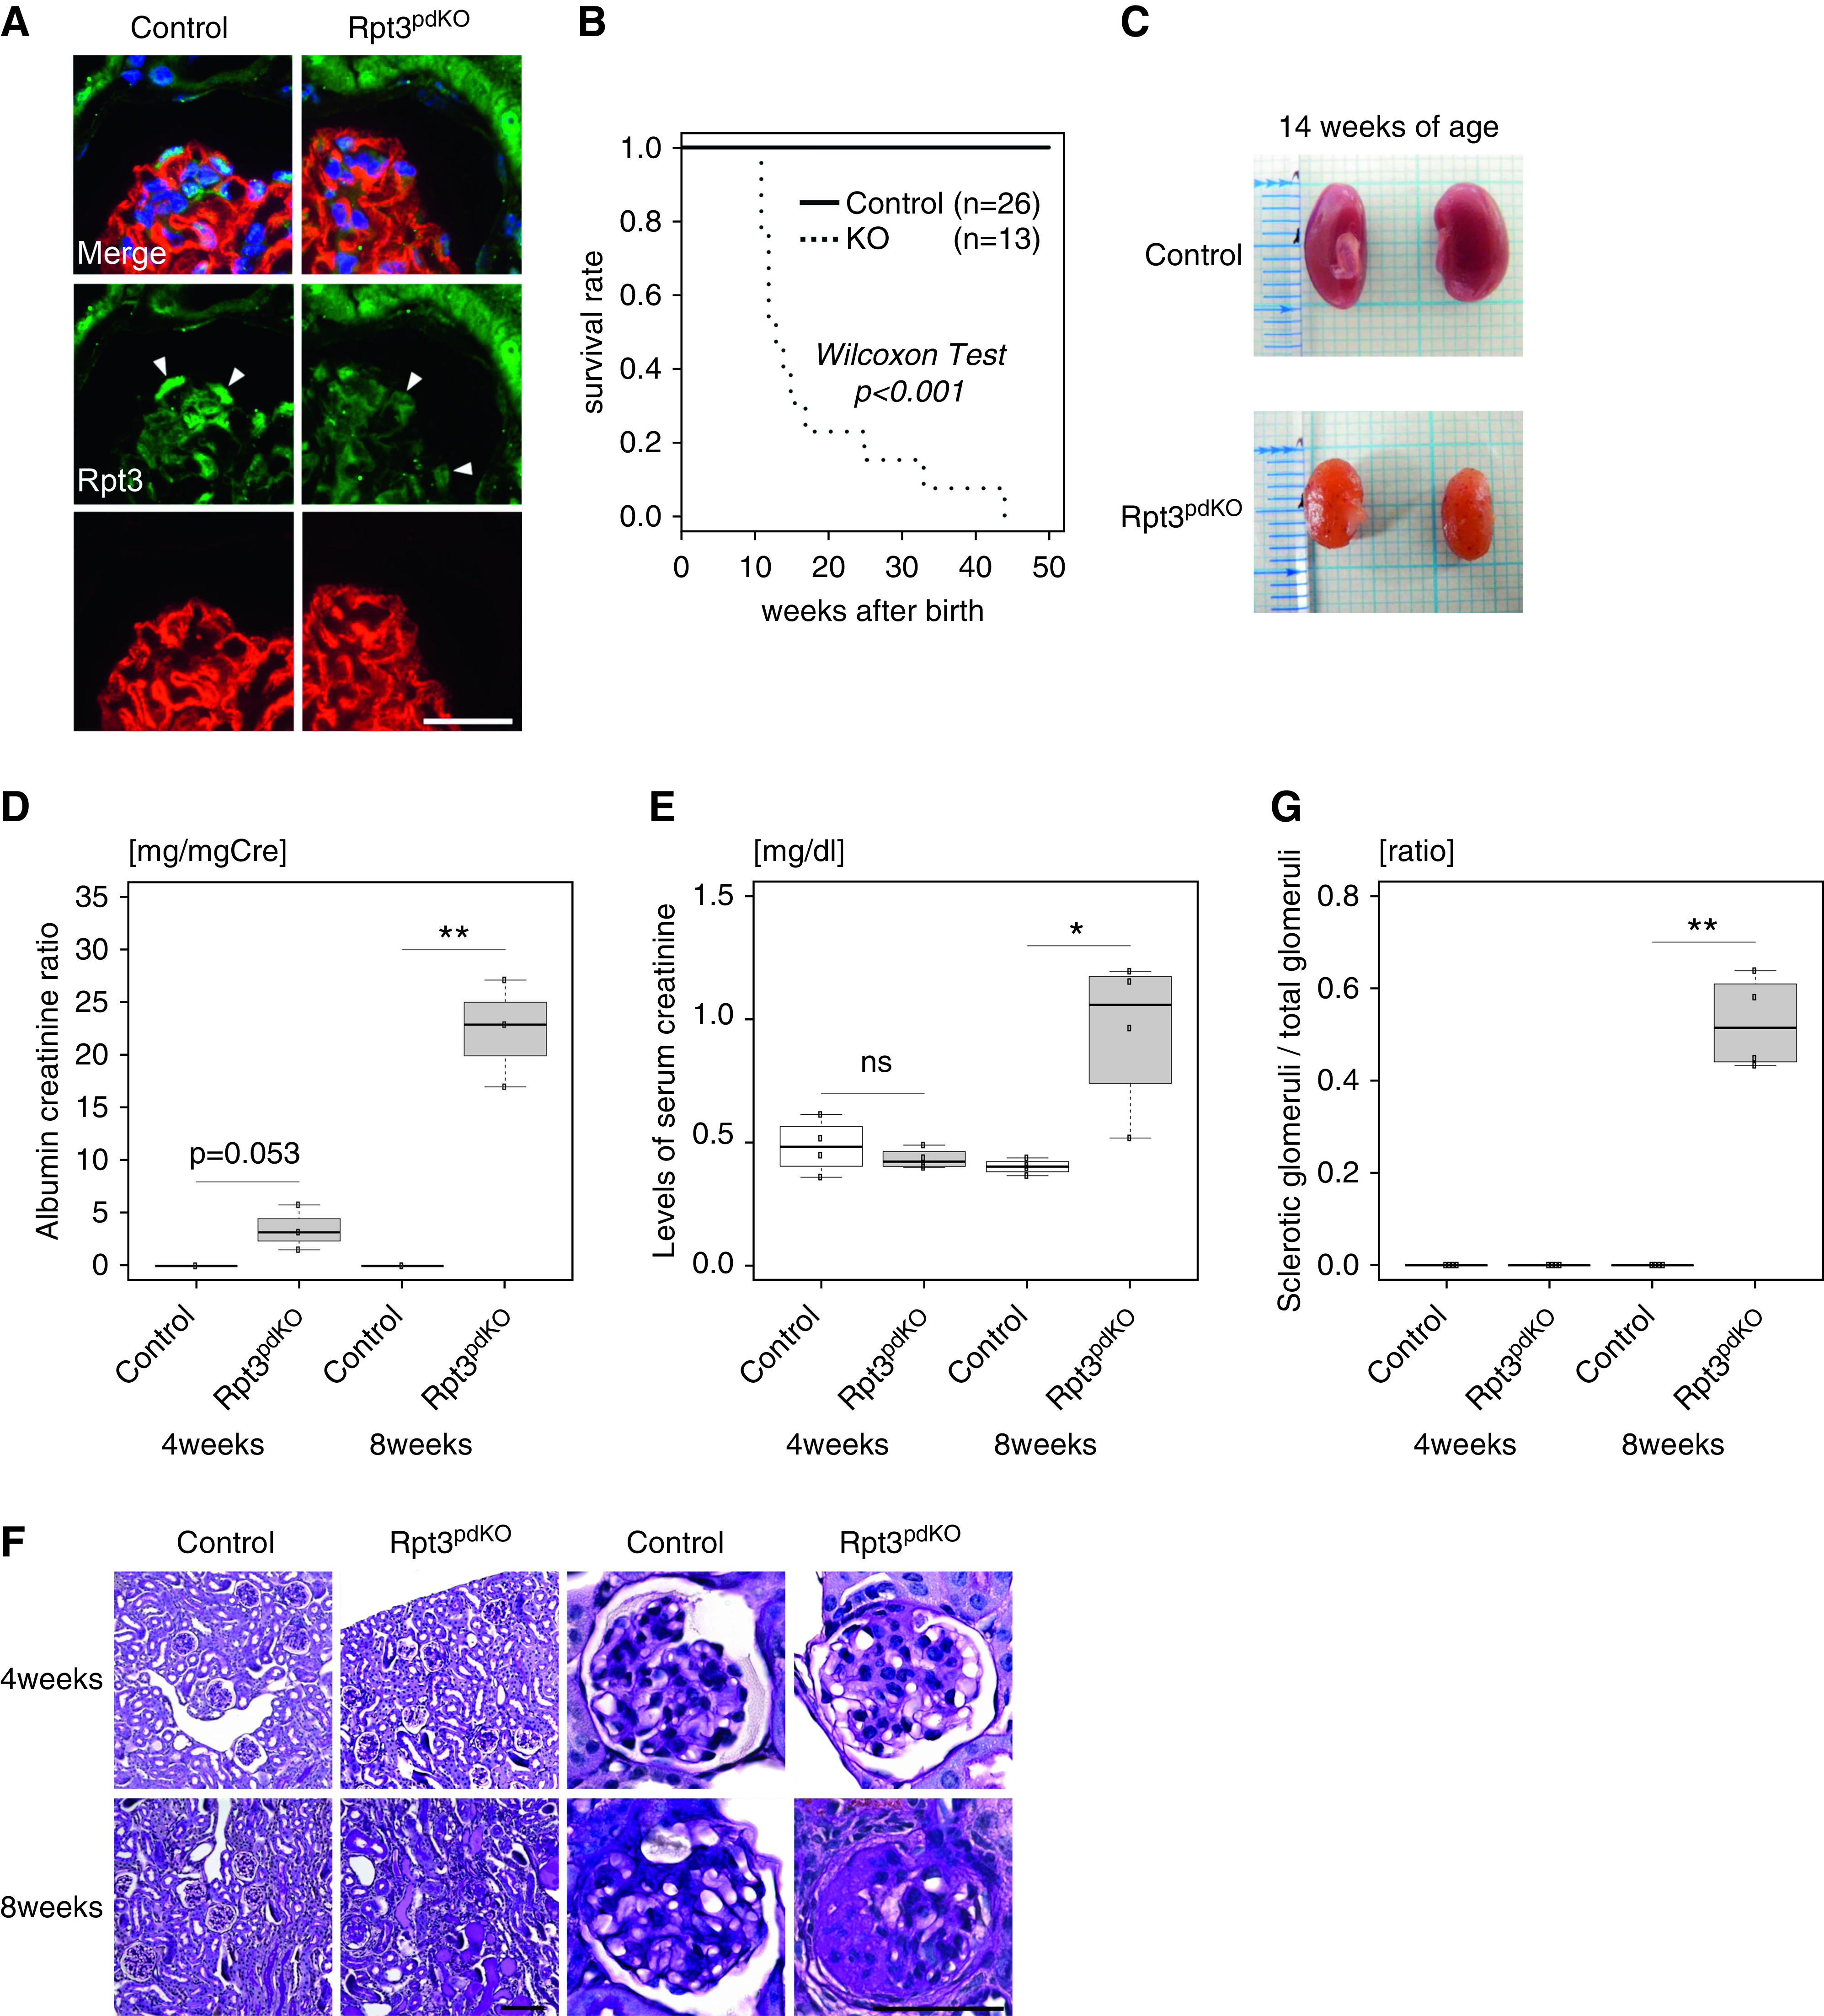
Impairment of proteasome function in podocytes led to renal failure. (A) Rpt3 expression decreased in the podocytes of Rpt3pdKO mice compared with Rpt3Control mice at 4 weeks of age (arrowheads). (B) Kaplan–Meier survival curve showed that Rpt3pdKO mice have a significantly lower survival ratio than Rpt3Control mice (P<0.001, Wilcoxon test, n=26 [Rpt3Control], n=13 [Rpt3pdKO]). Scale bar: 20 μm. (C) The kidneys of Rpt3pdKO mice were atrophic with a rough surface and a yellowish appearance at 14 weeks of age. (D) Albuminuria was observed in Rpt3pdKO mice at 4 weeks of age (0.017 mg/mg creatinine ±0.007 versus 3.52 mg/mg creatinine ±1.24, P=0.05, n=3 per group) and was significantly increased in Rpt3pdKO mice at 8 weeks of age (0.019 mg/mg creatinine ±0.011 versus 22.3 mg/mg creatinine ±2.93, P=0.01, n=3 per group). (E) The levels of serum creatinine were significantly increased in Rpt3pdKO mice at 8 weeks of age (0.40 mg/dl ±0.029 versus 0.96 mg/dl ±0.31, P=0.05, n=4 per group). (F) Periodic acid–Schiff staining of Rpt3pdKO mice showed glomerulosclerosis at 8 weeks of age. Scale bars: 50 μm in F, right panels; 100 nm in F, left panels. (G) The sclerotic per total glomeruli ratio in each kidney section of Rpt3pdKO mice significantly increased compared with Rpt3Control mice at 8 weeks of age (0 versus 0.52±0.1, P=0.05, n=4). *P=0.01 by Welch t test; **P=0.01 by Welch t test.
Figure 2.
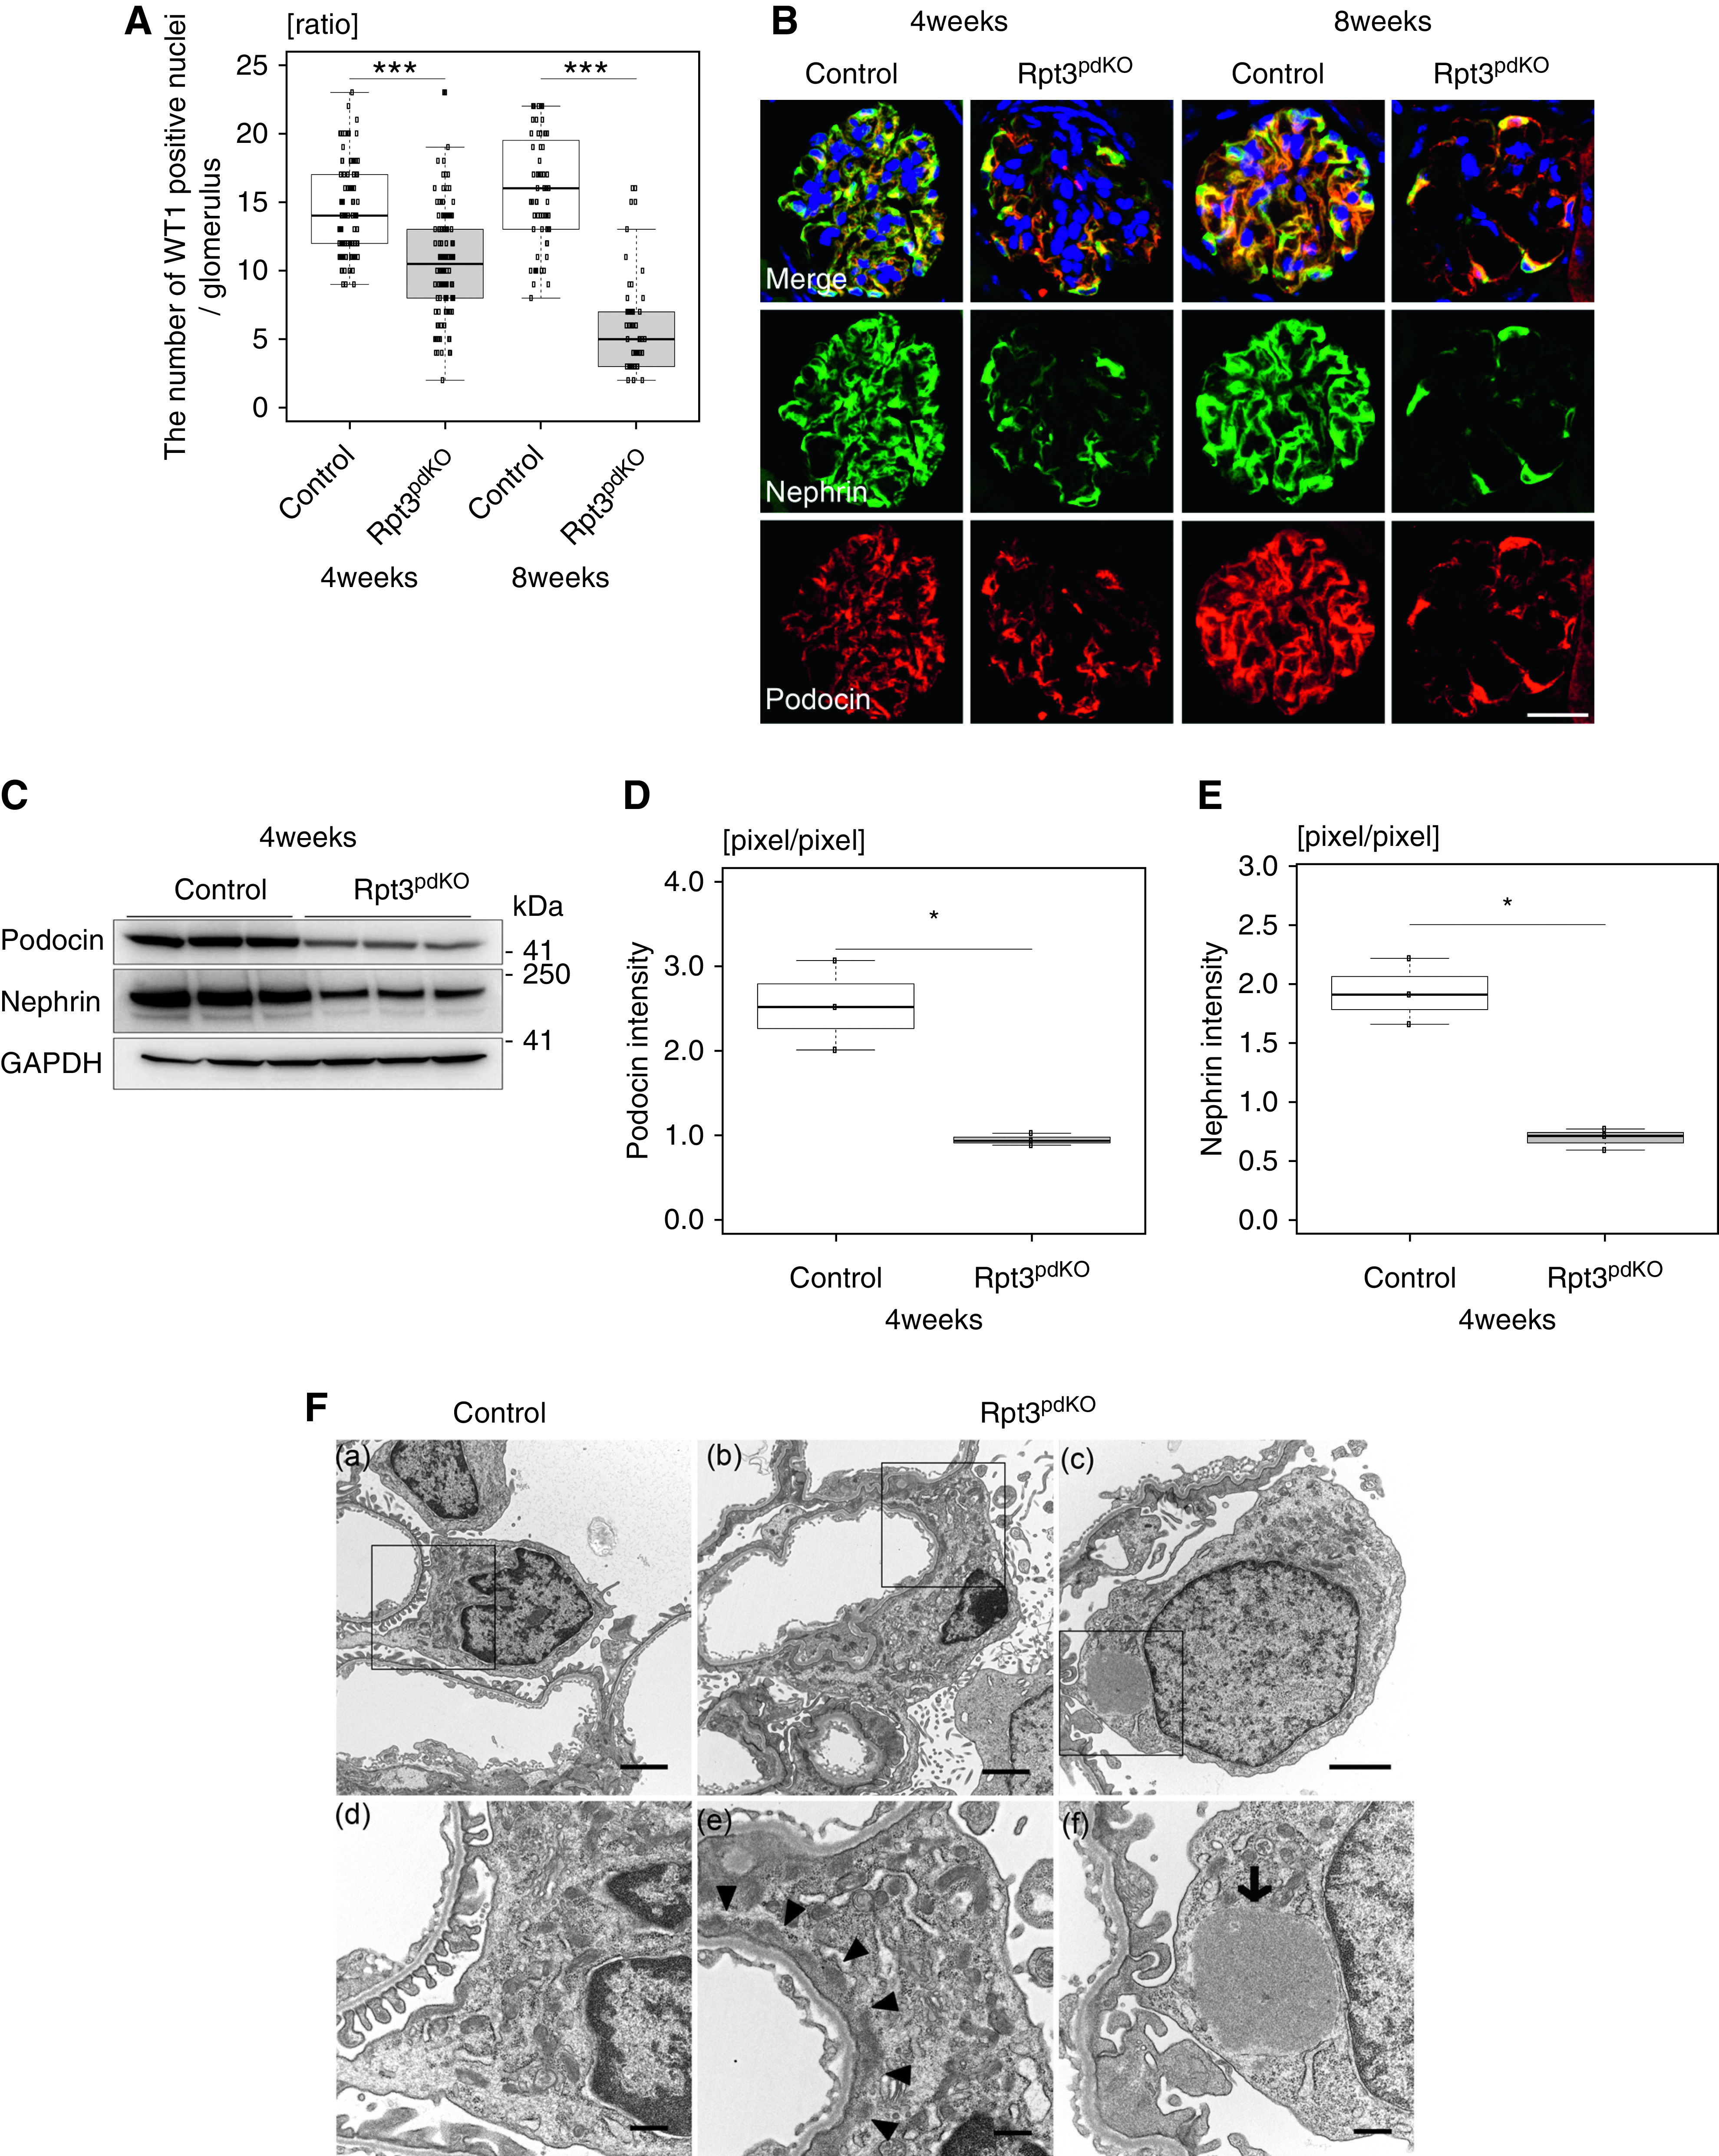
Rpt3pdKO mice showed podocyte injury and loss. (A) The number of WT1-positive cells was significantly decreased in Rpt3pdKO mice at 4 and 8 weeks of age (4 weeks of age: 14.5±0.34 versus 10.7±0.34, P<0.001, Rpt3Control [n=105], Rpt3pdKO [n=120] and 8 weeks of age: 15.9±3.9 versus 5.8±3.2, P<0.001, Rpt3Control [n=64], Rpt3pdKO [n=46], P<0.001 by Mann–Whitney U test). (B) The expressions of podocin and nephrin showed a linear pattern in Rpt3Control kidneys but a cytosolic pattern in Rpt3pdKO kidneys. (C) WB of glomerular lysate showed the expressions of podocin and nephrin decreased in Rpt3pdKO mice compared with Rpt3Control mice at 4 weeks of age. (D and E) The graphs show the densitometry quantification of podocin and nephrin expressions in WB of glomerular lysate (n=3). *P=0.05 by Welch t test; ***P<0.001 by Welch t test. (F, a) Transmission electron microscopy showed podocyte foot processes in Rpt3Control kidneys. (F, b) The podocytes of Rpt3pdKO mice exhibited foot process effacement at 4 weeks of age. (F, c) The podocytes of Rpt3pdKO mice exhibited the formation of intracellular accumulations of uniform density around nuclei at 4 weeks of age. (F, d–f) High-magnification images of the square portions of F, a–c, respectively. (The arrowheads show foot process effacement, and the arrow shows intracellular accumulations of uniform density around nuclei.) Scale bars: 20 μm in B; 2 μm in F, a–c; 500 nm in F, d–f.
Electron Microscopy Analysis of Rpt3pdKO Podocytes Revealed Foot Process Effacement and Intracellular Accumulations of Uniform Density
Foot process effacement was observed in the podocytes of Rpt3pdKO mice at 4 weeks of age (Figure 2F, arrowheads). Formations of intracellular accumulations of uniform density around the nuclei were observed in the podocytes of Rpt3pdKO mice at 4 weeks of age (Figure 2F, arrow).
Rpt3pdKO Mice Exhibit an Accumulation of Ubiquitinated Protein Aggregates and of Oxidative Modified Proteins in Podocytes
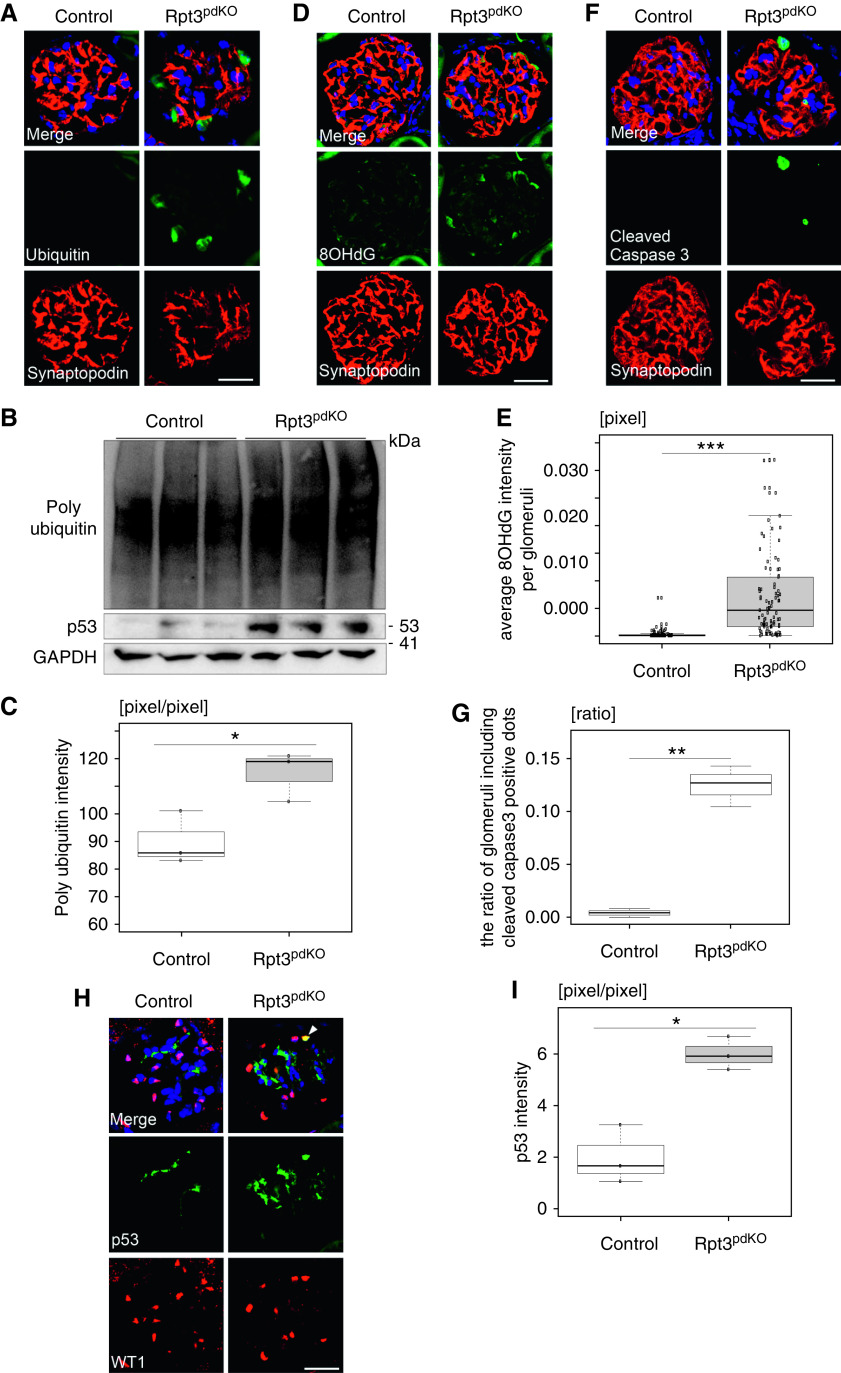
IF staining and WB of glomerular lysate revealed that ubiquitinated proteins had significantly accumulated in the podocytes of Rpt3pdKO mice compared with Rpt3Control mice at 4 weeks of age (Figure 3, A–C). Because oxidative stress is a common cause of podocyte injury, we evaluated the levels of 8-OHdG as one of the predominant forms of free radical–induced oxidative lesions of mitochondrial and nuclear guanosine, and it is therefore widely used as a biomarker for oxidative stress. The podocytes of Rpt3pdKO mice showed strongly positive 8-OHdG fluorescence intensity (Figure 3D). The average intensity of 8-OHdG fluorescence per glomeruli significantly increased in Rpt3pdKO mice compared with Rpt3Control mice at 4 weeks of age (Figure 3E). These results suggested that a decreased removal of oxidative modified proteins by proteasome impairment caused the enhanced signal of 8-OHdG in the podocytes of Rpt3pdKO mice.
Figure 3.
Impairment of proteasome function in the podocytes caused accumulation of ubiquitinated proteins and of oxidative modified proteins, and it induced podocyte apoptosis. (A) Ubiquitin staining was strongly positive in the podocytes of Rpt3pdKO mice at 4 weeks of age. (B) WB of glomerular lysate showed increasing expressions of ubiquitinated proteins and p53 in Rpt3pdKO glomeruli at 4 weeks of age. (C) The densitometry quantification of ubiquitinated proteins expression in the WB of glomerular lysate (n=3, P=0.05, Welch t test). (D) The intensity of 8-OHdG fluorescence increased in Rpt3pdKO at 4 weeks of age. (E) The average intensity of 8-OHdG fluorescence per glomeruli significantly increased in Rpt3pdKO mice at 4 weeks of age (n=92 [Rpt3Control], n=89 [Rpt3pdKO], P<0.001 by Mann–Whitney U test). (F) Cleaved caspase 3–positive podocytes were observed in the glomeruli of Rpt3pdKO mice at 4 weeks of age. (G) The glomeruli with cleaved caspase 3–positive podocytes per total glomeruli ratio in each kidney section of Rpt3pdKO mice significantly increased compared with Rpt3Control mice at 4 weeks of age (n=3, P=0.01 by Welch t test). (H) Positive nuclear staining of p53 was observed in the podocytes of Rpt3pdKO mice at 4 weeks of age. (I) The densitometry quantification of p53 expression in WB of glomerular lysate (n=3, P<0.01, Welch t test). *P=0.05; **P=0.01; ***P<0.001. Scale bars: 20 μm in A, D, F, and H.
Decreased Number of Podocytes in Rpt3pdKO Mice Was Partly Associated with Podocyte Apoptosis
Podocyte injury is a common cause of podocyte apoptosis.16 Cleaved caspase 3, which is classified as an effector caspase, was used as an apoptosis marker. The ratio of the glomeruli with cleaved caspase 3–positive podocytes per total glomeruli in each kidney section of Rpt3pdKO mice was significantly increased compared with Rpt3Control mice at 4 weeks of age (0.0042±0.0041 versus 0.12±0.019; P=0.05; n=3 per group) (Figure 3, F and G). Positive nuclear staining of p53, which is an apoptosis-regulated protein, was observed in the podocytes of Rpt3pdKO mice (Figure 3H). WB of glomerular lysate showed that the expression of p53 was significantly increased in the glomeruli of Rpt3pdKO mice compared with Rpt3Control mice at 4 weeks of age (Figure 3, B and I). These results suggest that p53-mediated apoptosis might contribute to podocyte loss in Rpt3pdKO mice. However, enhanced p53 levels could also be the result of decreased removal of p53 through the proteasomal system, as p53 is a constitutive proteasomal substrate.
APLS Was Suppressed in Rpt3pdKO Podocytes
APLS is another important protein degradation mechanism. Impairment of proteasome function commonly induces autophagic activity.17,18 An autophagosome marker, LC3 (Microtubule-associated protein light chain 3), was used to assess whether impairment of proteasome function had induced autophagic activity in this study. LC3-I is converted to LC3-II during the formation of autophagosomes, and the LC3-II–LC3-I ratio correlates with the autophagic activity.19 In the WB of glomerular lysate, the LC3-II–LC3-I ratio did not change between Rpt3Control and Rpt3pdKO mice at 4 weeks of age (Supplemental Figure 4). Because glomerular lysate contained endothelial cells and mesangial cells as well as podocytes, we quantified LC3-positive dots in the podocytes using IF staining images. To inhibit autophagic flux in vivo, we administered 100 mg/kg chloroquine to the mice intraperitoneally. The area of LC3 dots colocalized with synaptopodin was smaller in the glomeruli of Rpt3pdKO mice than in Rpt3Control mice in the vehicle group. This area of LC3 dots in Rpt3pdKO did not significantly change by chloroquine treatment (Figure 4, A and B). This result indicates autophagy was suppressed in the podocytes of Rpt3pdKO. Next, we evaluated the expression of p62, which is selectively degraded by APLS via interaction with LC3. P62 is known to accumulate in various pathologic conditions associated with insufficient APLS. WB of glomerular lysate showed that the expression of p62 significantly increased in the glomeruli of Rpt3pdKO mice compared with that in Rpt3Control mice at 4 weeks of age (Figure 4, C and D). IF staining showed that p62 was markedly accumulated in the podocyte cell bodies of Rpt3pdKO mice (Figure 4E), and the area of the p62 particles was significantly larger in the glomeruli of Rpt3pdKO mice than in the glomeruli of Rpt3Control mice at 4 weeks of age (Figure 4F). These results suggested that autophagic activity was unexpectedly suppressed by impairment of proteasome function in podocytes. Next, we performed a primary culture using isolated glomeruli from mice at 4 weeks age for IF staining of p62 or LC3. Isolated glomeruli were cultured for 3 days in RPMI 1640 medium. Synaptopodin-positive cellular outgrowths from glomeruli were distinguished as podocytes (Supplemental Figure 5A). The accumulation of p62 tended to increase in Rpt3 KO podocytes (Supplemental Figure 5B). Three days after starting primary culture, cultured podocytes were treated with lysosomal protease inhibitors E64d (10 μg/ml)/Pepstatin A (25 μg/ml; E/P) for 24 hours, which are commonly used for the inhibition of autophagic flux. Under the effect of E/P, the expression of LC3 tended to be lower in Rpt3 KO podocytes than in control podocytes (Supplemental Figure 5C). These results suggested autophagic activity was suppressed in podocytes with an impairment of proteasome function.
Figure 4.
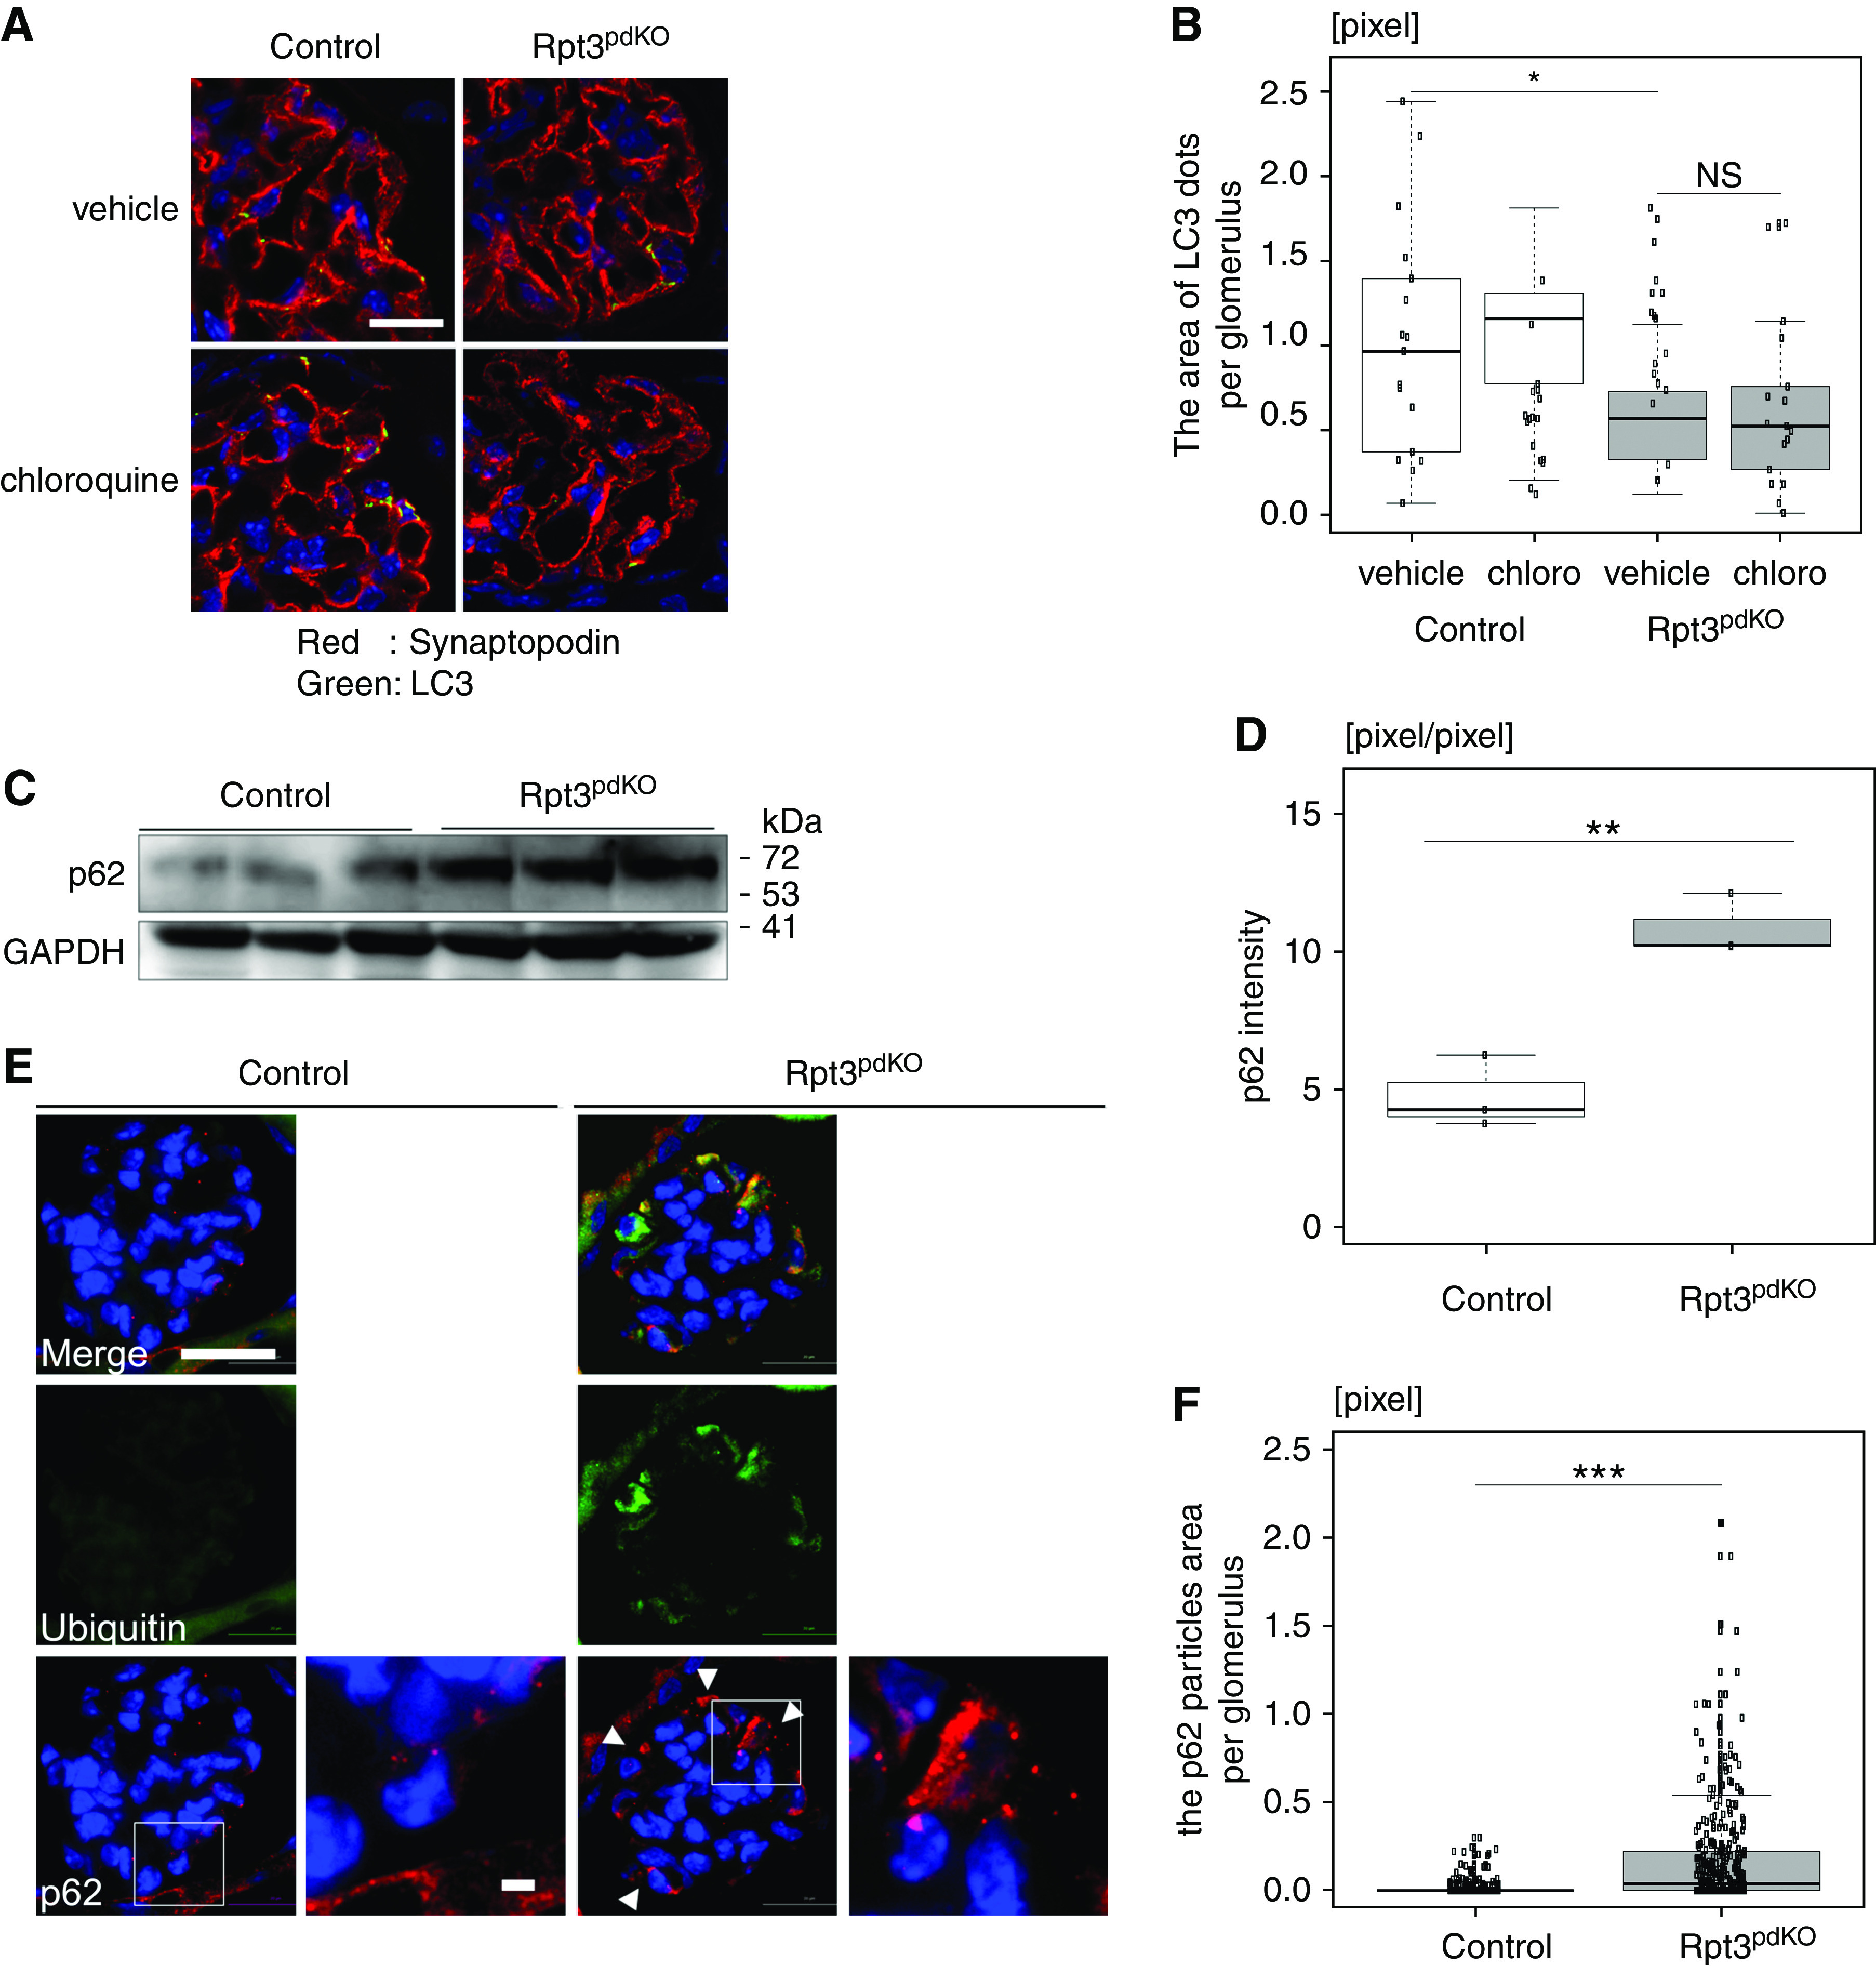
Autophagic activity was suppressed in the podocytes of Rpt3pdKO mice. (A) IF staining showed LC3 dots of Rpt3Control and Rpt3pdKO kidneys treated with vehicle (PBS) or chloroquine. Scale bar: 20 μm in A. (B) The area of LC3 dots colocalized with synaptopodin was smaller in the glomeruli of Rpt3pdKO mice than in Rpt3Control mice. The area of LC3 dots in Rpt3pdKO did not significantly change by chloroquine treatment (n=18, P=0.05 by Mann–Whitney U test). (C) The expression of p62 significantly increased in Rpt3pdKO mice in WB of glomerular lysate. (D) The densitometry quantification of p62 expression in WB shown in (C) (n=3, P=0.01 by Welch t test). (E) p62 was accumulated in the podocyte cell bodies of Rpt3pdKO mice and partially colocalized with ubiquitin at 4 weeks of age. Scale bars: 20 μm in low magnification of E; 2 μm in high magnification of E. (F) The area of p62 particles per glomerulus was significantly larger in Rpt3pdKO mice than in Rpt3Control mice at 4 weeks of age (n=3, P<0.001 by Mann–Whitney U test). *P=0.05; **P=0.01; ***P<0.001.
Proteasome Inhibition in Immortalized Mouse Podocytes Caused an Accumulation of Ubiquitinated Proteins and of Oxidative Modified Proteins, and It Induced Podocyte Apoptosis
To elucidate the mechanisms of podocyte injury caused by impairment of proteasome function, immortalized mouse podocytes were treated with 100 nM bortezomib, a proteasome inhibitor. Bortezomib altered the actin formation of podocytes in rhodamine phalloidin staining, indicating bortezomib caused podocyte injury. (Supplemental Figure 6). Six hours after treatment of bortezomib to cultured podocytes, the proteasome activity of podocytes was reduced to about 13% compared with that of DMSO-treated podocytes (Supplemental Figure 7). The average intensity of 8-OHdG fluorescence was significantly increased at 9 hours after the treatment with bortezomib (Figure 5A, Supplemental Figure 8). WB of cell lysate showed that the accumulation of ubiquitinated proteins (Figure 5, B and C) and the expression of p53 (Figure 5, B and D) significantly increased after treatment of bortezomib to cultured podocytes. The expression of cleaved caspase 8 (Figure 5, B and E), which is an initiator caspase, and cleaved caspase 3 (Figure 5, B and F) significantly increased at 15 hours after treatment of bortezomib to cultured podocytes. To investigate whether oxidative proteins induced apoptosis, we treated cultured podocytes with antioxidant apocynin. Pretreatment of 1 mM apocynin for 2 hours partially cancelled the increased expression of p53 (Figure 5, G and H) and cleaved caspase 3 (Figure 5, I and J) induced by bortezomib treatment. These results suggested that the accumulation of oxidative modified proteins was involved in the podocyte apoptosis caused by proteasome inhibition.
Figure 5.
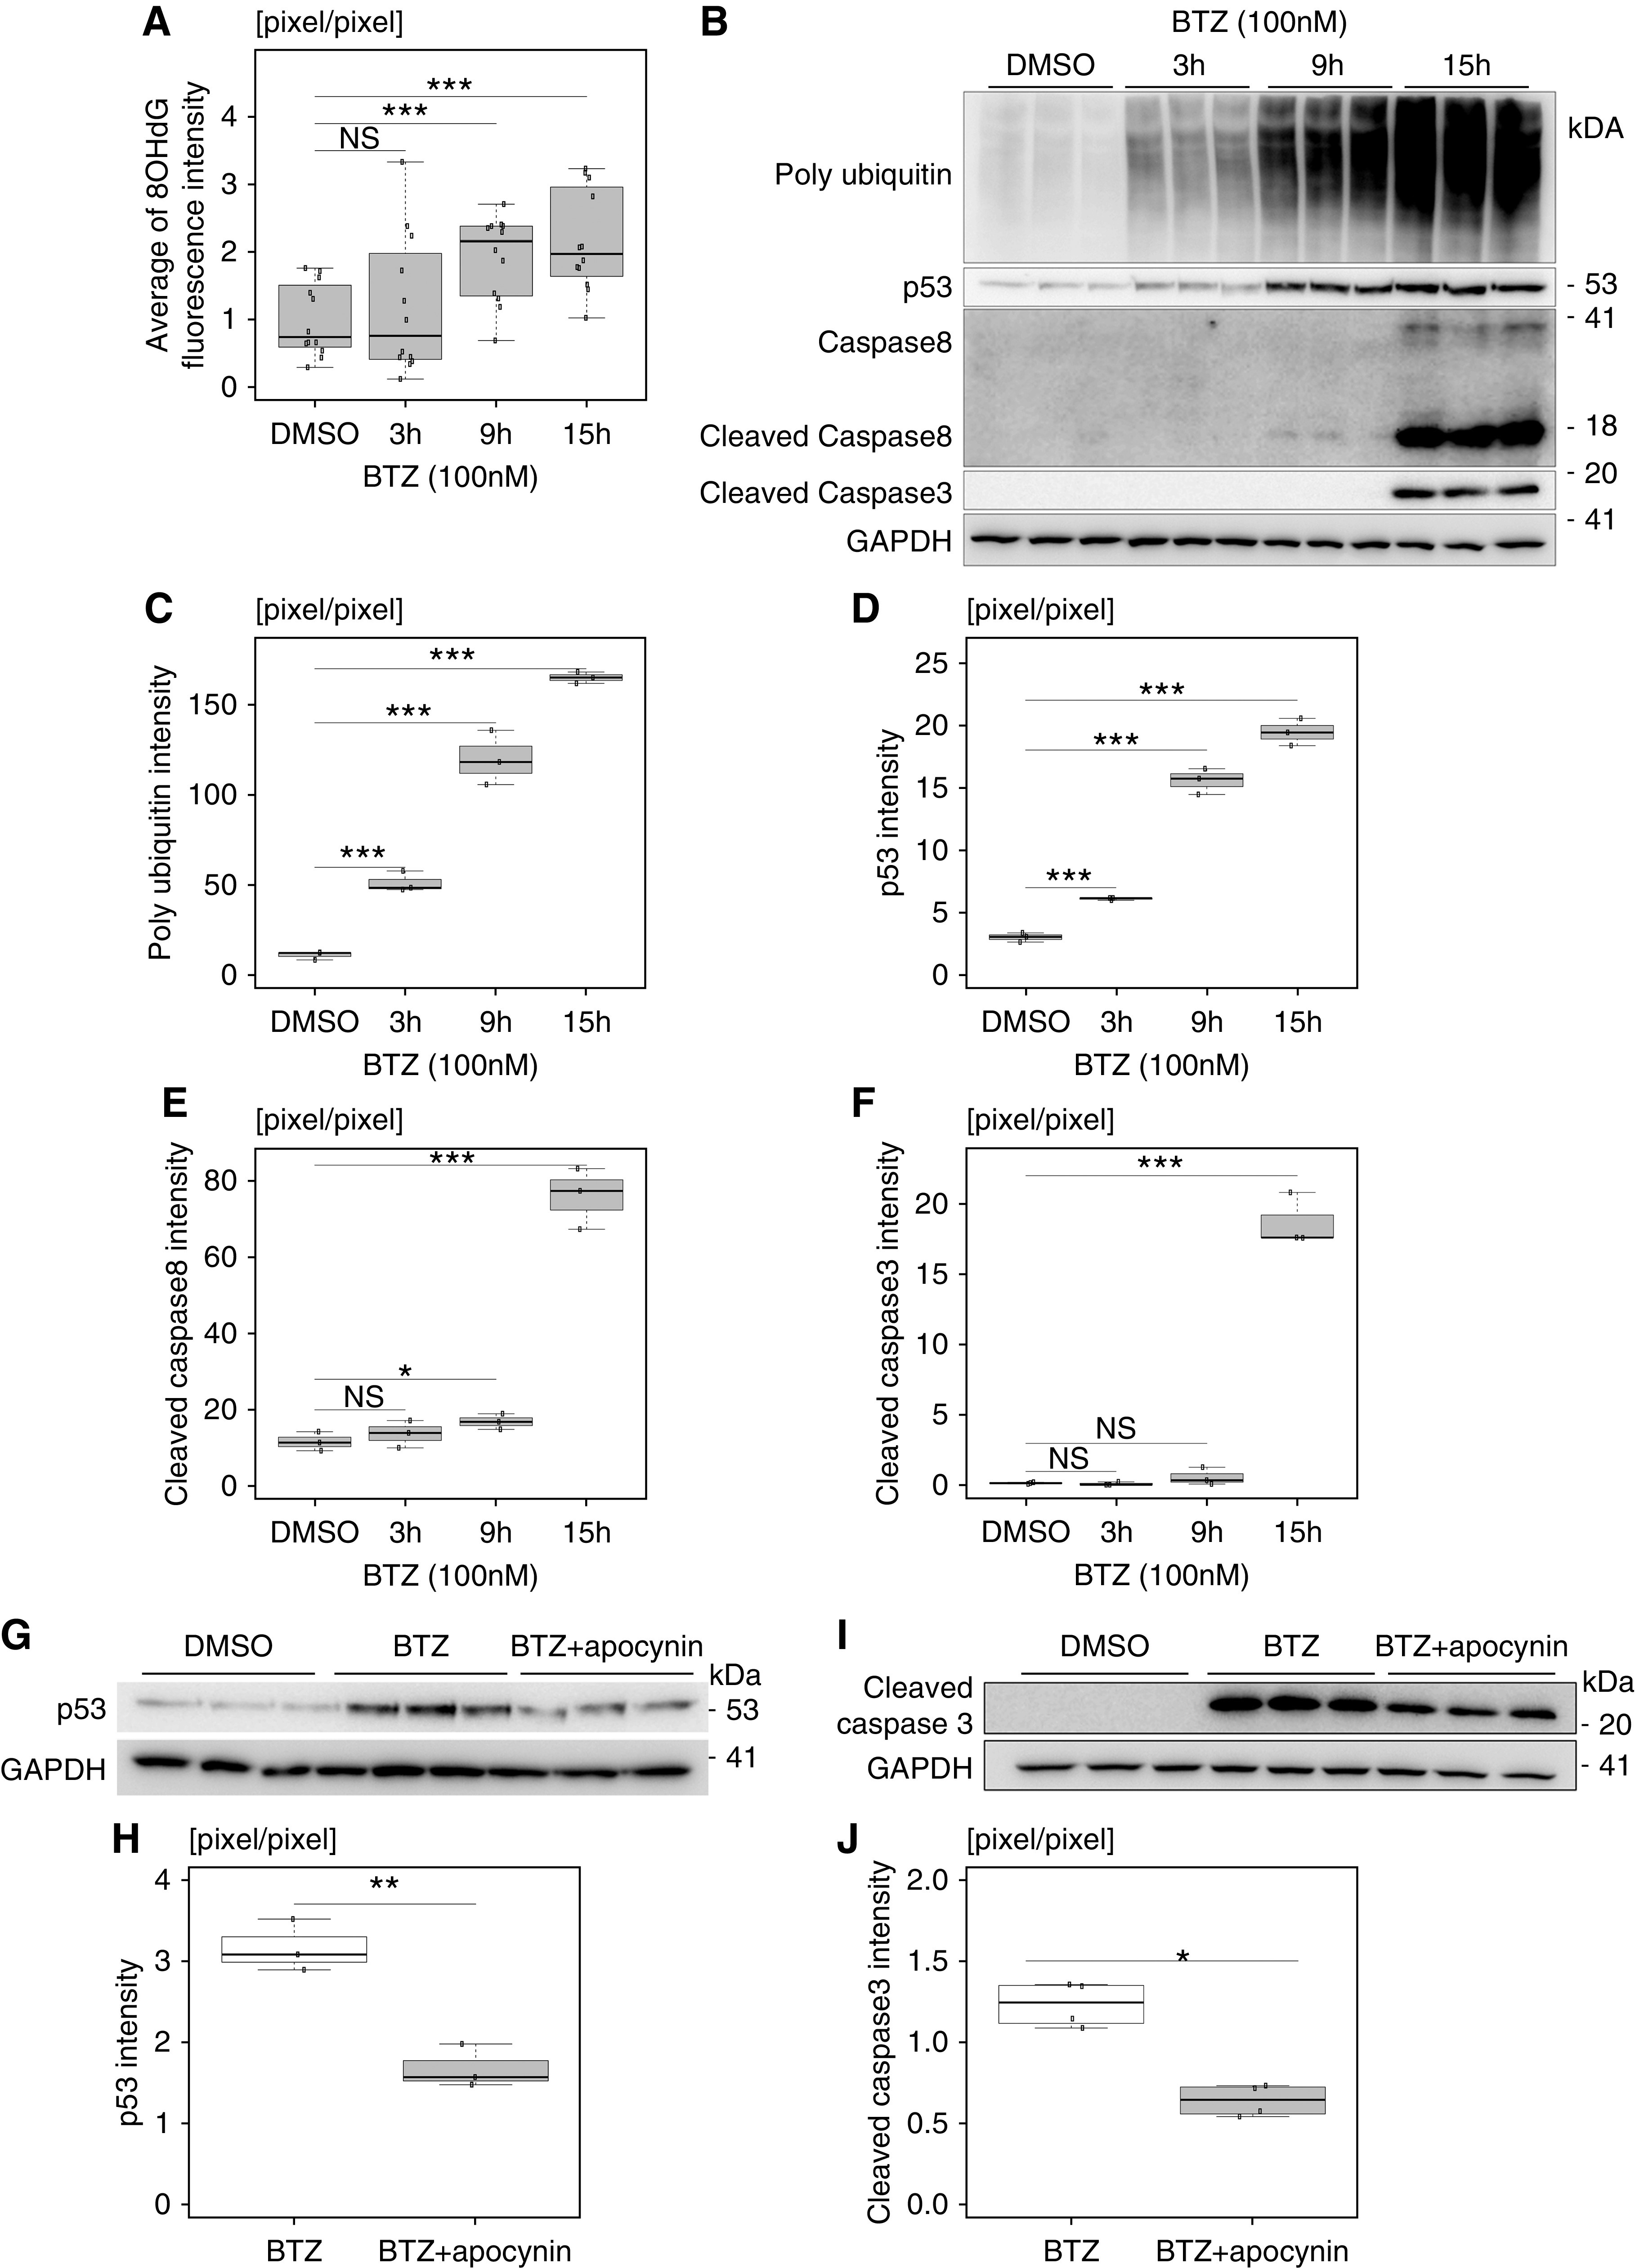
Proteasome inhibition in cultured podocytes caused an accumulation of ubiquitinated proteins and of oxidative modified proteins, and it induced podocyte apoptosis. (A) The average intensity of 8-OHdG fluorescence was significantly increased in cultured podocytes in a time-dependent manner after the treatment of bortezomib (BTZ; n=12). (B) The accumulation of ubiquitinated proteins and the expressions of p53, cleaved caspase 8, and cleaved caspase 3 were significantly increased after the treatment of BTZ. (C–F) The densitometry quantification of polyubiquitin, p53, cleaved caspase 8, and cleaved caspase 3 expression in WB, respectively, shown in (B) (n=3). (G) Pretreatment of apocynin for 2 hours partially cancelled the increased expression of p53 induced by 3 hours of treatment with BTZ. (H) The densitometry quantification of p53 expression in WB shown in (G) (n=3). (I) Pretreatment of apocynin for 2 hours partially cancelled the increased expression of cleaved caspase 3 induced by 15 hours of treatment with BTZ. (J) The densitometry quantification of cleaved caspase 3 expression in WB shown in (I) (n=3). BTZ and apocynin were used at concentrations of 100 nM and 1 mM, respectively. The conditions of the control group were set at 15 hours of treatment of DMSO. *P=0.05 by Welch t test; **P=0.01 by Welch t test; ***P<0.001 by Welch t test.
Proteasome Inhibition by Bortezomib in Immortalized Mouse Podocytes Suppressed Autophagic Activity
IF staining showed that p62 was accumulated in the cell bodies of cultured podocytes at 3 hours after treatment with 100 nM bortezomib (Figure 6A), suggesting that autophagic activity was suppressed by proteasome inhibition. We evaluated autophagic activity according to the LC3-II–LC3-I ratio under the effect of E/P. Because the degradation of LC3-II is inhibited under the effect of E/P, autophagic activity is more accurately evaluated by a change in the LC3-II–LC3-I ratio.19 Immortalized mouse podocytes were treated with bortezomib under the effect of E/P. At 6 hours after bortezomib treatment, the LC3-II–LC3-I ratio was significantly reduced with bortezomib treatment compared with DMSO (vehicle) treatment, and the ratio was unchanged with or without the effect of E/P (Figure 6, B and C). p62 was significantly accumulated with bortezomib treatment compared with DMSO treatment. The accumulation did not change with or without the effect of E/P (Figure 6, B and D). These results indicated that autophagic activity was suppressed by proteasome inhibition.
Figure 6.
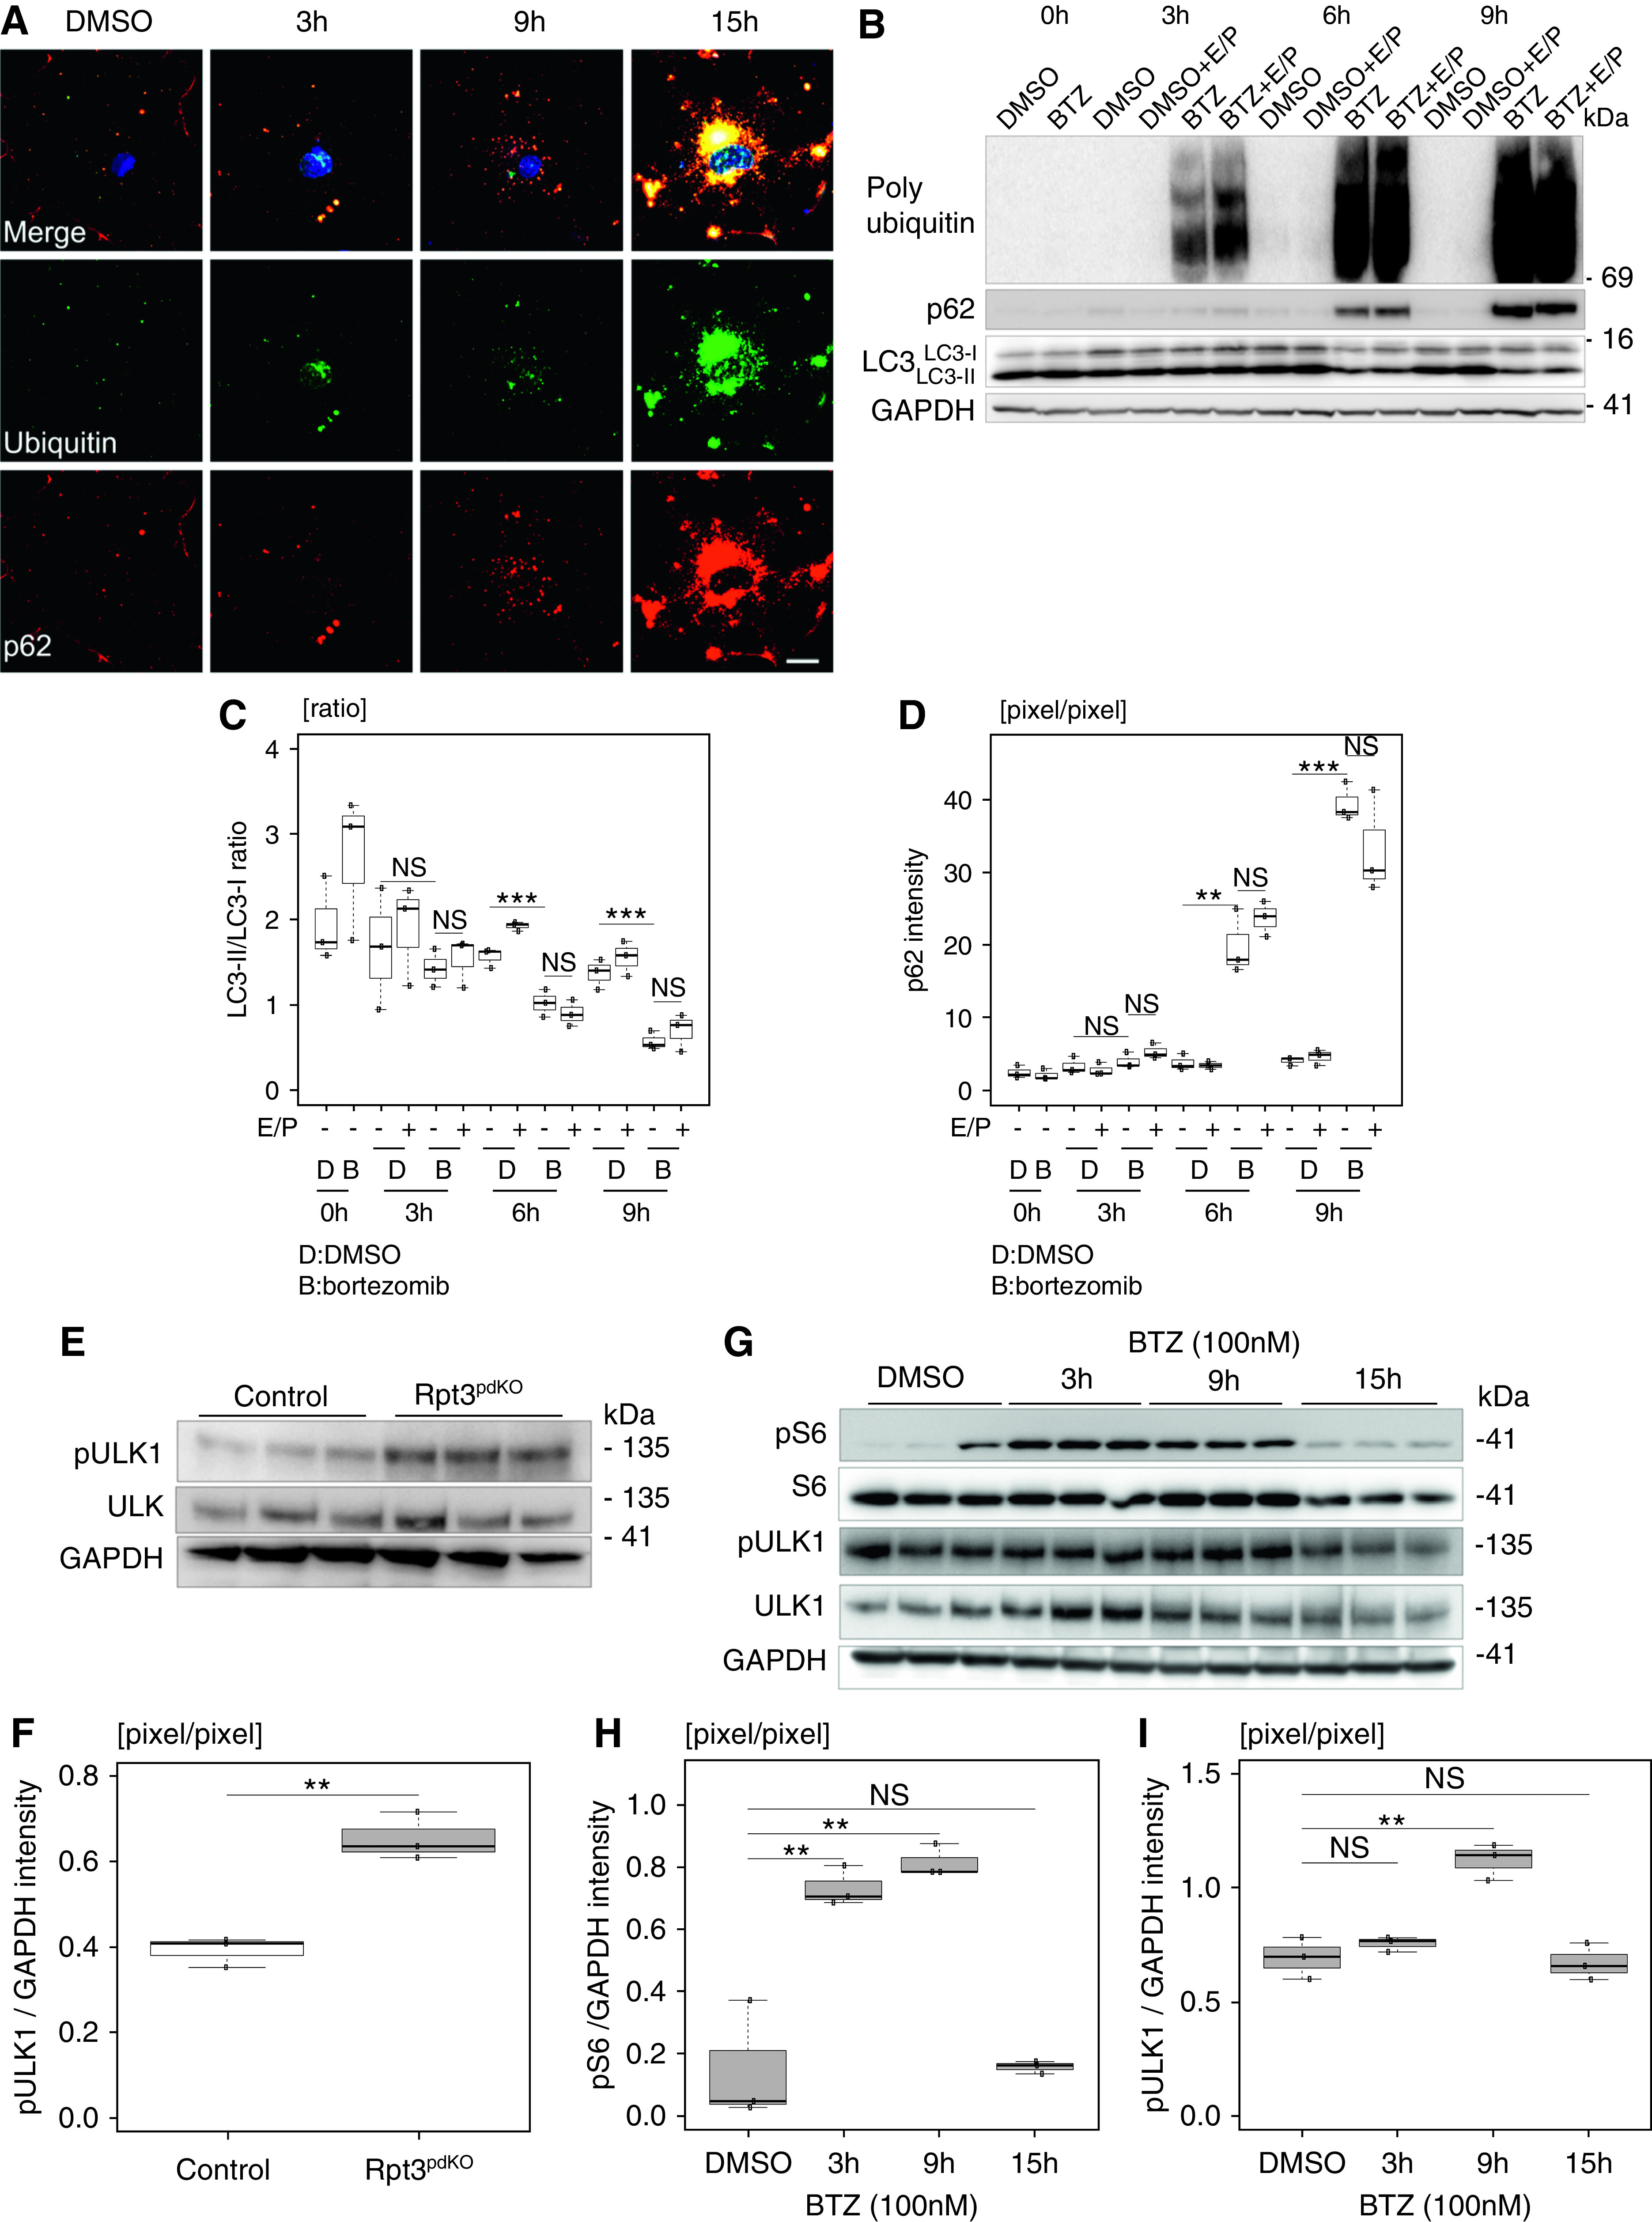
Proteasome inhibition suppressed autophagic activity mediated by mTOR activation. (A) p62 was accumulated in the cell bodies of cultured podocytes and partially colocalized with ubiquitin at 3 hours after the treatment with bortezomib (BTZ). Scale bar: 20 μm. (B and C) At 6 hours after treatment, the LC3-II–LC3-I ratio was significantly reduced with BTZ treatment compared with DMSO treatment, and the ratio was unchanged with or without the effect of E/P. (B and D) p62 was significantly accumulated with BTZ treatment compared with DMSO treatment, and the accumulation did not change with or without the effect of E/P. (C and D) The densitometry quantification of LC3-II–LC3-I and p62 expression in WB shown in (B) (n=3). (E) The expression of phosphorylated ULK (ser757) that is the mTOR-specific phosphorylation site increased in Rpt3pdKO mice compared with that in Rpt3Control mice. (F) The densitometry quantification of phosphorylated ULK expression normalized with GAPDH in WB shown in (E) (n=3). (G) The expression of phosphorylated S6 significantly increased for 3–9 hours and decreased at 15 hours, and the expression of phosphorylated ULK (ser757) increased at 9 hours and decreased at 15 hours after the treatment of BTZ to cultured podocytes (n=3). (H and I) The densitometry quantification of phosphorylated S6 and phosphorylated ULK (ser757) expression normalized with GAPDH in WB shown in (G) (n=3). BTZ was used at a concentration of 100 nM, and E/P was used at concentrations of 10 and 25 μg/ml, respectively. The conditions of the control group were set at 15 hours of DMSO treatment. **P=0.01 by Welch t test; ***P<0.001 by Welch t test.
Rapamycin Suppressed the Podocyte Apoptosis Induced by Proteasome Inhibition In Vitro and Reduced the Glomerular Injury in Rpt3pdKO Mice
Although we predicted that autophagic activity would be upregulated via compensation for the impairment of proteasome function, it was unexpectedly suppressed. Because autophagic activity is negatively regulated by mTOR, we investigated the expression of phosphorylated ULK1 (ser757) and phosphorylated ribosomal S6, a downstream effector of mTOR. Ser757 site of ULK is the mTOR-specific phosphorylation site. WB of glomerular lysate showed that the expression of phosphorylated ULK1 (ser757) normalized with GAPDH was significantly increased in Rpt3pdKO mice (Figure 6, E and F). In vitro, the expression of phosphorylated ribosomal S6 normalized with GAPDH was significantly increased for 3–9 hours and decreased at 15 hours (Figure 6, G and H), and the expression of phosphorylated ULK1 (ser757) normalized with GAPDH was increased at 9 hours and decreased at 15 hours (Figure 6, G and I) following the bortezomib treatment of cultured podocytes. These results suggest that the suppression of autophagic activity was mediated by mTOR activation. Therefore, to check whether mTOR inhibition increases autophagic activity in podocytes with impairment of proteasome function, an allosteric inhibitor of mTOR, rapamycin, was used in vitro. Cultured podocytes, under the effect of E/P, were treated with 500 nM rapamycin and bortezomib. The LC3-II–LC3-I ratio decreased by bortezomib treatment compared with DMSO treatment under the effect of E/P. Rapamycin treatment ameliorated the bortezomib-induced LC3 reduction under the effect of E/P (Figure 7, A and B). p62 was accumulated by bortezomib treatment compared with DMSO treatment. Rapamycin treatment ameliorated the bortezomib-induced p62 accumulation (Figure 7, A and C). These results indicate that autophagic activity was induced by the treatment of rapamycin. Next, we investigated whether rapamycin could reduce podocyte injury. Pretreatment with 500 nM rapamycin for 2 hours partially cancelled the increased expression of p53 (Figure 7, D and E) and cleaved caspase 3 (Figure 7, F and G) induced by bortezomib treatment. To investigate whether rapamycin exerts a protective effect against podocyte injury induced by Rpt3 KO in vivo, Rpt3pdKO mice were intraperitoneally injected with 4 mg/kg rapamycin or DMSO (vehicle) every 2 days from 3 to 8 weeks of age. The sclerotic per total glomeruli ratio in each kidney section of rapamycin-treated Rpt3pdKO mice was significantly lower than the ratio in untreated Rpt3pdKO mice (Figure 7H). Rpt3Control and Rpt3pdKO mice kidneys treated with rapamycin or DMSO (vehicle) were stained with LC3, p62, and ubiquitin. The LC3 dots in podocytes were increased by rapamycin treatment in Rpt3Control and Rpt3pdKO mice (Supplemental Figure 9, A and B). The p62 particles (Supplemental Figure 9, C and D) and the ubiquitin accumulation (Supplemental Figure 9, E and F) in podocytes were decreased by rapamycin treatment in Rpt3pdKO mice. These results indicated that rapamycin treatment induced autophagic activity of podocytes, which may have contributed to improve glomerular injury in Rpt3pdKO mice.
Figure 7.
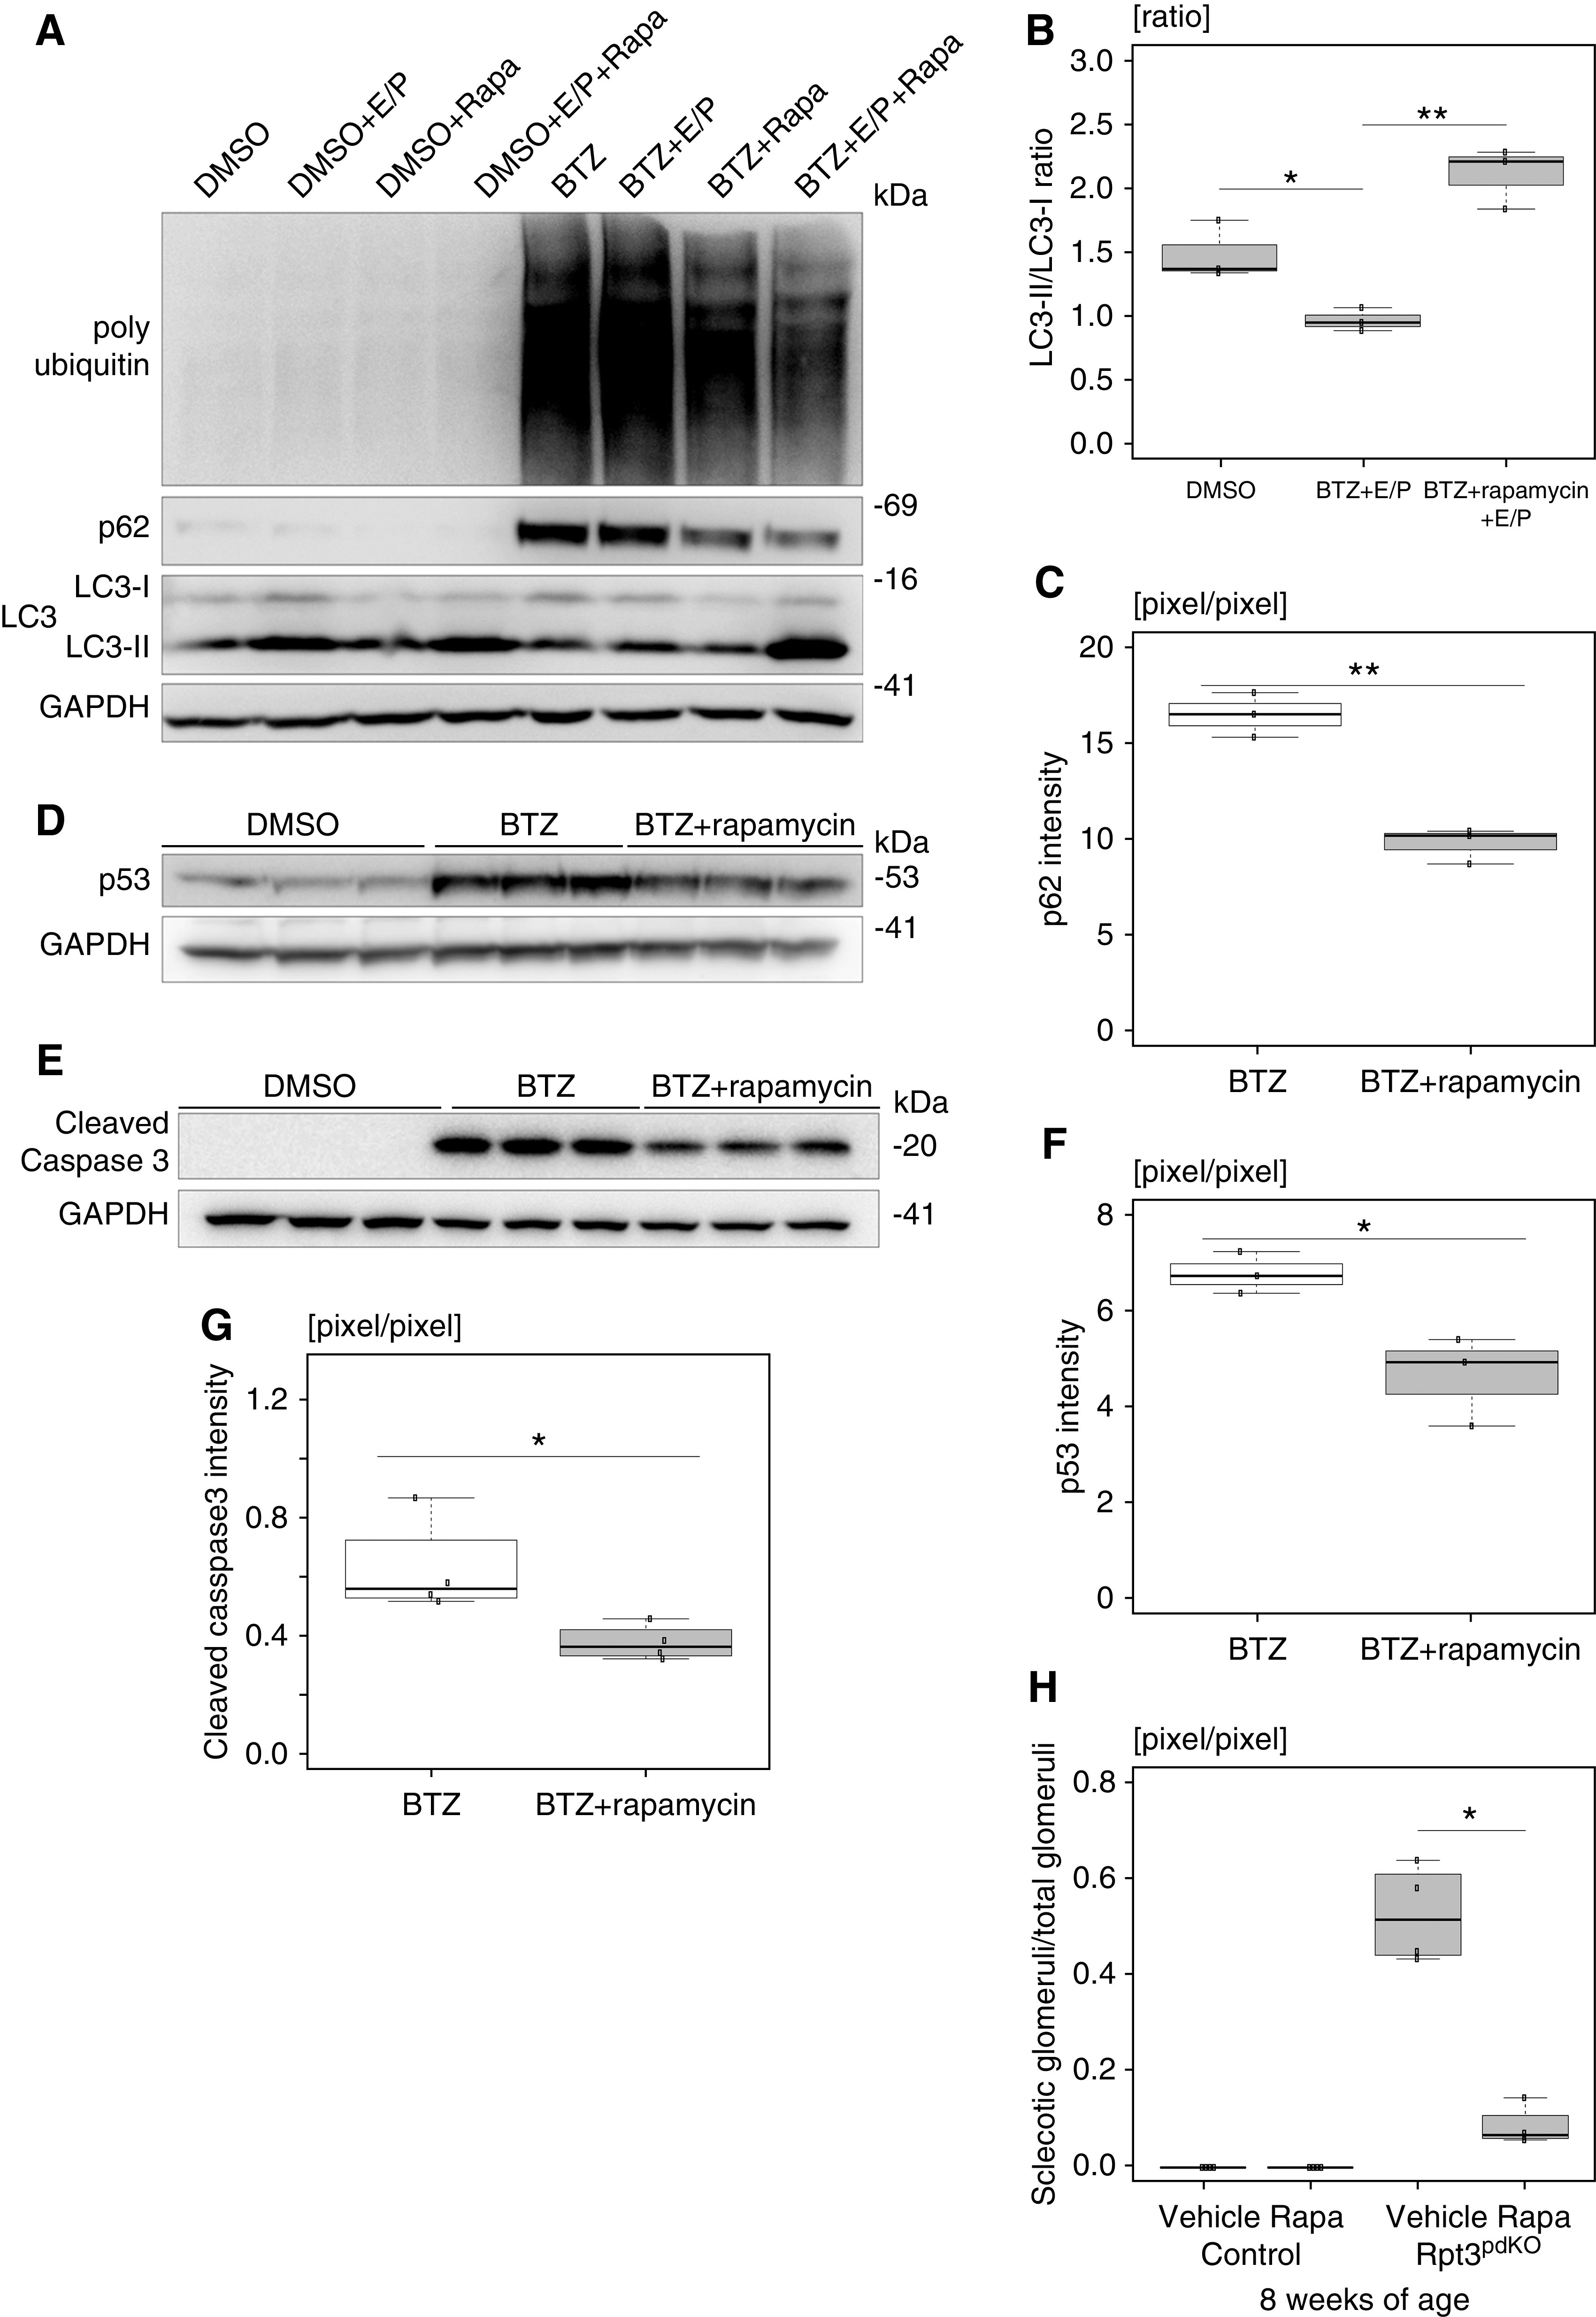
Activation of autophagy suppressed podocyte apoptosis in vitro and glomerular injury in vivo. (A) Cultured podocytes, under the effect of E/P, were treated with rapamycin and bortezomib (BTZ). The LC3-II–LC3-I ratio decreased by BTZ treatment compared with DMSO treatment under the effect of E/P. Rapamycin treatment ameliorated the bortezomib-induced LC3 reduction under the effect of E/P. p62 was accumulated by BTZ treatment compared with DMSO treatment. Rapamycin treatment ameliorated bortezomib-induced p62 accumulation. (B and C) The densitometry quantification of LC3-II–LC3-I and p62 expression in WB shown in (A). (D) Pretreatment of rapamycin for 2 hours partially cancelled the increased expression of p53 induced by 3 hours of treatment with BTZ (n=3). (E) The densitometry quantification of p53 expression in WB shown in (D). (F) Pretreatment of rapamycin for 2 hours partially cancelled the increased expression of cleaved caspase 3 induced by 15 hours of treatment of BTZ (n=3). (G) The densitometry quantification of cleaved caspase 3 expression in WB is shown in (F). (H) The sclerotic per total glomeruli ratio in each kidney section of rapamycin-treated Rpt3pdKO mice was significantly lower than the ratio in untreated Rpt3pdKO mice (0.52±0.1 versus 0.08±0.04, P=0.05, n=4). BTZ and rapamycin were used at concentrations of 100 and 500 nM, respectively, and E/P was used at concentrations of 10 and 25 μg/ml, respectively. *P=0.05 by Welch t test; **P=0.01 by Welch t test.
An Aging Marker Was Increased in Podocytes with Impairment of Proteasome Function
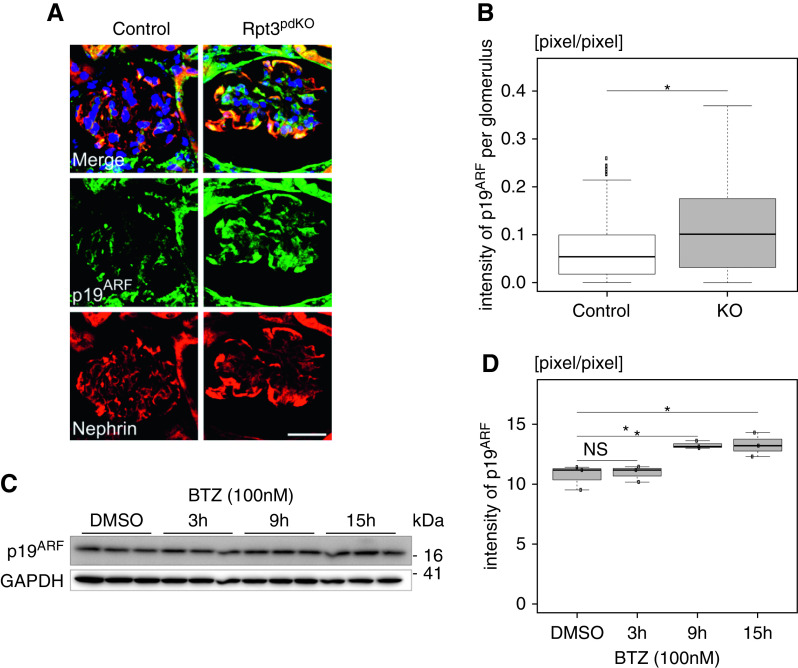
Proteasome activity declines with aging.20 The accumulations of ubiquitinated proteins and oxidatively damaged proteins are considered hallmarks of cellular aging.21 We wondered whether impairment of proteasome function in podocytes could be associated with aging. We investigated the expression of p19ARF that is commonly used as a senescence marker. The expression of p19ARF was significantly increased in the podocytes of Rpt3pdKO mice at 4 weeks of age (Figure 8, A and B). In vitro, the expression of p19ARF was significantly increased at 9 and 15 hours after treatment with bortezomib (Figure 8, C and D). These results suggested that impairment of proteasome function in podocytes promoted kidney aging.
Figure 8.
The expression of p19ARF, which is an aging marker, was increased in podocytes with impairment proteasome function in vivo and in vitro. (A) The expression of p19ARF was increased in the podocytes of Rpt3pdKO mice at 4 weeks of age. Scale bar: 20 μm. (B) The densitometry quantification of p19ARF expression in WB (n=94 [Rpt3Control], n=88 [Rpt3pdKO], Mann–Whitney U test). (C) The expression of p19ARF was increased for 9–15 hours after the treatment of 100 nM bortezomib (BTZ) to cultured podocytes. (D) The densitometry quantification of p19ARF expression in WB (n=3, Welch t test). BTZ was used at concentrations of 100 nM. *P=0.05.
Discussion
Podocytes have high levels of autophagic activity under basal conditions.1,22 Podocyte-specific autophagy-deficient mice, however, have not demonstrated an obvious natural kidney phenotype.2,3 Podocyte-specific autophagy-related gene 5 knockout induced proteasome activation in podocytes at a young age but not in old age.2 Podocyte-specific autophagy-related gene 7 knockout also resulted in the accumulation of ubiquitinated proteins and led to a transient increase in subunits of the 26S proteasome when functional and structural loads acted on the remaining kidney by unilateral nephrectomy.3 As mice age, the podocyte-specific knockout of cathepsin D, which is an autophagy proteolytic enzyme, promotes the accumulation of ubiquitinated proteins in podocytes.7 These results suggest that UPS compensates for the APLS deficiency. Our mice showed that impairment of proteasome function in podocytes resulted in podocyte apoptosis and the development of glomerulosclerosis at a young age. These results indicated that UPS plays a more important role than APLS in maintaining intracellular homeostasis in podocytes.
In this study, the expression of p53, which is considered an apoptosis-regulated protein, increased in podocytes with impairment of proteasome function. Under physiologic conditions, the expression of p53 is kept low via ubiquitination and proteasome degradation,23 and we expected an accumulation of ubiquitinated p53 in podocytes with an impairment of proteasome function. However, ubiquitinated p53 was not detected by WB (data not shown). Oxidative stress suppresses p53 ubiquitination by inhibiting the interactions of p53 and MDM2, which is a ubiquitin ligase of p53.23 Podocyte-specific MDM2 KO mice showed an increase in the expressions of p53 and apoptosis in podocytes.24 Given the result from our experiment that an antioxidant suppressed the elevation of p53 expression, it suggested that oxidative stress due to the impairment of proteasome function inhibited the p53 ubiquitination, and increased in the p53 expression in podocytes.
Because other reports showed that proteasome deficiency causes ER stress in the hepatocytes and podocytes of patients with diabetes,25–27 we evaluated the expression of BiP, which is a key regulator of ER stress. There were no significant changes in the expression of BiP by impairment of proteasome function either in vivo (Supplemental Figure 10, A and B) or in vitro (Supplemental Figure 10, C and D), which suggested ER stress did not participate in podocyte injury via the impairment of proteasome function.
The impairment of proteasome function normally induces autophagic activity.17,18 It was reported that APLS was upregulated in podocytes when a proteasome inhibitor was administered systematically to a mouse model of podocyte injury.28 When we first observed that p62 was increased in the cell body of Rpt3pdKO podocytes, we initially considered that p62 was enhanced to shuttle polyubiquitinated protein aggregates to autophagy for degradation. However, unexpectedly LC3 did not increase in the Rpt3pdKO podocytes, indicating autophagy was suppressed in the podocytes. Therefore, we concluded p62 was accumulated because autophagic activity was suppressed. Furthermore, mTOR signaling, which negatively regulates autophagy,29 was activated by the impairment of proteasome function in podocytes. Interestingly, rapamycin, which is an mTOR inhibitor, suppressed the podocyte apoptosis and glomerulosclerosis induced by the impairment of proteasome function. The protective effect of rapamycin on cell injury induced by proteasome inhibition was also reported in neuroendocrine cells,30 but the mTOR signal was not changed by proteasome inhibition. Thus far, it remains unclear how the impairment of proteasome function causes mTOR activation in podocytes. We evaluated the expression of Lamp1, which is known as a lysosomal protein. In vivo, the expression of Lamp1 tended to increase in glomeruli of Rpt3pdKO mice (data not shown). As the lysosome is degraded after fusion with the autophagosome, Lamp1 may have accumulated without degradation in vivo. We need to investigate to evaluate the lysosome system under proteasome impairment in podocyte in the future.
Proteasome activity was decreased in aging rat organs, such as heart, lung, kidney, and liver.31 The levels of ubiquitinated proteins and DNA oxidative damage increased in aging rat kidneys.32 Systemic proteasome-deficient mice showed a shortened life span and muscle atrophy, and primary fibroblastic cells from the mice showed an elevation of β-galactosidase levels, a marker of senescence.33 In our study, ubiquitinated proteins accumulated and oxidative modified proteins increased in podocytes with impairment of proteasome function. Also, p19ARF, a senescence marker, was elevated in podocytes with an impairment of proteasome function. In neurodegenerative diseases, such as Alzheimer and Parkinson, proteasome dysfunction causes an accumulation of abnormal proteins, which increases morbidity in an age-dependent manner.34,35 Several approaches for activating proteasomes were reported as therapeutic strategies for neurodegenerative diseases.36 These findings suggest that an age-dependent decrease in the proteasome activity in podocytes induced podocyte aging and glomerular injury, which ultimately resulted in CKD.
In conclusion, impairment of proteasome function causes podocytes injury, which leads to CKD and provides evidence that antioxidants and autophagy activators could be therapeutic agents for age-dependent CKD.
Disclosures
K. Asanuma, K. Mori, T. Nakagawa, and M. Yanagita received research funding from Mitsubishi Tanabe Pharmaceutical Corporation, outside the submitted work. R. Takahashi reports personal fees from Abbvie, Boeringer Ingelheim, Chugai Pharma, FP Pharma, JB, Kan Institute, Kissei Pharma, Mylan, Nihon Medi-physics, Ono Pharma, Pfizer, Sanwa Kagaku, and Tanabe Mitsubishi Pharma and grants and personal fees from Dainippon Sumitomo Pharma, Eisai Pharma, Kyowa Kirin Pharma, Otsuka Pharma, Sanofi, Takeda Pharma, and Tsumura, outside the submitted work. M. Yanagita reports grants from AMED-CREST “Innovation for Ideal Medical Treatment Based on the Understanding of Maintenance, Change and Breakdown Mechanisms of Homeostasis among Interacting Organ Systems,” AMED-CREST Understanding of Pathophysiological Processes and Discovery of Medical Technology Seeds through Spatiotemporal Research of Tissue Adaptation and Repair Mechanisms, AMED (Platform Program for Promotion of Genome Medicine), Grant-in-Aid for Challenging Exploratory Research, Grant-in-Aid for Scientific Research(B), and Grant-in-Aid for Scientific Research on Innovative Areas, outside the submitted work. All remaining authors have nothing to disclose.
Funding
This work was supported in part by Ministry of Education, Culture, Sports, Science and Technology Grants-in-Aid for Scientific Research 26670431 (to K. Asanuma), 17K19653 (to K. Asanuma), and 18H02823 (to K. Asanuma); by a research fund from the Mitsubishi Tanabe Pharma Corporation (to K. Asanuma); and by a research grant from the Astellas Foundation for Research on Metabolic Disorders (to K. Asanuma).
Supplementary Material
Acknowledgments
The authors thank Prof. Lawrence B. Holzman (University of Pennsylvania) for providing the Neph2-cre mice, Keiko Okamoto-Furuta and Haruyasu Kohda (Kyoto University) for technical assistance of the electron microscopy, Yurie Nakaya for kind support with the intellectual property, Koichiro Ichimura for technical advice about the electron microscopy data, Mitsuhiro Kikyo, Junichi Tsuchida, Chinatsu Toguchi, Yuri Ogawa, Chihiro Nakagawa and Chihiro Makino for their technical assistance, Maulana Antiyan Empitu for support with manuscript preparation, and Hidetaka Akita and Yu Sakurai for use of laboratory facilities.
K. Asanuma conceived the original idea and devised the main conceptual ideas; M. Yanagita supervised the project; S.-i. Makino, T. Miyake, J.A. Oliva Trejo, N. Shirata, H. Yamada, and K. Yamamoto-Nonaka conducted the experiments; R. Takahashi, Y. Tashiro, and H. Yamashita generated and provided the Rpt3flox/flox mice; S.-i. Makino, K. Mori, and T. Nakagawa analyzed the data; T. Miyake, J.A. Oliva Trejo, N. Shirata, H. Yamada, and K. Yamamoto-Nonaka provided the technical support, contributed to the interpretation of the results, and supported drafting; S.-i. Makino drafted the manuscript; and K. Mori and T. Nakagawa commented on the manuscript.
Footnotes
Published online ahead of print. Publication date available at www.jasn.org.
Supplemental Material
This article contains the following supplemental material online at http://jasn.asnjournals.org/lookup/suppl/doi:10.1681/ASN.2019101025/-/DCSupplemental.
Supplemental Figure 1. Periodic acid–Schiff staining of NPHS-Cre-Rpt3 flox/flox and NPHS-Cre+Rpt3 flox/WT.
Supplemental Figure 2. The expression of Rpt3 was decreased in the glomeruli of Rpt3pdKO mice at 4 weeks of age.
Supplemental Figure 3. The number of WT1 was decreased in the glomeruli of Rpt3pdKO kidneys compared with Rpt3Control kidneys.
Supplemental Figure 4. There was no significant change in the expression of LC3 between Rpt3Control and Rpt3pdKO mice.
Supplemental Figure 5. The expressions of p62 and LC3 were analyzed using primary culture podocytes.
Supplemental Figure 6. Rhodamine phalloidin staining showed that the treatment of BTZ altered the actin formation of cultured podocytes.
Supplemental Figure 7. Proteasome activity was decreased in cultured podocytes by the treatment of BTZ.
Supplemental Figure 8. Immunofluorescence intensity of 8-OHdG was increased in cultured podocytes by the treatment of BTZ.
Supplemental Figure 9. Rapamycin induced autophagic activity of podocytes in Rpt3pdKO mice.
Supplemental Figure 10. ER stress did not participate in podocyte injury via the impairment of proteasome function.
References
- 1.Asanuma K, Tanida I, Shirato I, Ueno T, Takahara H, Nishitani T, et al.: MAP-LC3, a promising autophagosomal marker, is processed during the differentiation and recovery of podocytes from PAN nephrosis. FASEB J 17: 1165–1167, 2003. 10.1096/fj.02-0580fje [DOI] [PubMed] [Google Scholar]
- 2.Hartleben B, Gödel M, Meyer-Schwesinger C, Liu S, Ulrich T, Köbler S, et al.: Autophagy influences glomerular disease susceptibility and maintains podocyte homeostasis in aging mice. J Clin Invest 120: 1084–1096, 2010. 10.1172/JCI39492 [DOI] [PMC free article] [PubMed] [Google Scholar]
- 3.Oliva Trejo JA, Asanuma K, Kim EH, Takagi-Akiba M, Nonaka K, Hidaka T, et al.: Transient increase in proteinuria, poly-ubiquitylated proteins and ER stress markers in podocyte-specific autophagy-deficient mice following unilateral nephrectomy. Biochem Biophys Res Commun 446: 1190–1196, 2014. 10.1016/j.bbrc.2014.03.088 [DOI] [PubMed] [Google Scholar]
- 4.Sakao Y, Kawai T, Takeuchi O, Copeland NG, Gilbert DJ, Jenkins NA, et al.: Mouse proteasomal ATPases Psmc3 and Psmc4: Genomic organization and gene targeting. Genomics 67: 1–7, 2000. 10.1006/geno.2000.6231 [DOI] [PubMed] [Google Scholar]
- 5.Tashiro Y, Urushitani M, Inoue H, Koike M, Uchiyama Y, Komatsu M, et al.: Motor neuron-specific disruption of proteasomes, but not autophagy, replicates amyotrophic lateral sclerosis. J Biol Chem 287: 42984–42994, 2012. 10.1074/jbc.M112.417600 [DOI] [PMC free article] [PubMed] [Google Scholar]
- 6.Moeller MJ, Sanden SK, Soofi A, Wiggins RC, Holzman LB: Podocyte-specific expression of cre recombinase in transgenic mice. Genesis 35: 39–42, 2003. 10.1002/gene.10164 [DOI] [PubMed] [Google Scholar]
- 7.Yamamoto-Nonaka K, Koike M, Asanuma K, Takagi M, Oliva Trejo JA, Seki T, et al.: Cathepsin D in podocytes is important in the pathogenesis of proteinuria and CKD. J Am Soc Nephrol 27: 2685–2700, 2016. 10.1681/ASN.2015040366 [DOI] [PMC free article] [PubMed] [Google Scholar]
- 8.Schwarz K, Simons M, Reiser J, Saleem MA, Faul C, Kriz W, et al.: Podocin, a raft-associated component of the glomerular slit diaphragm, interacts with CD2AP and nephrin. J Clin Invest 108: 1621–1629, 2001. 10.1172/JCI200112849 [DOI] [PMC free article] [PubMed] [Google Scholar]
- 9.Shirata N, Ihara K-I, Yamamoto-Nonaka K, Seki T, Makino SI, Oliva Trejo JA, et al.: Glomerulosclerosis induced by deficiency of membrane-associated guanylate kinase inverted 2 in kidney podocytes. J Am Soc Nephrol 28: 2654–2669, 2017. 10.1681/ASN.2016121356 [DOI] [PMC free article] [PubMed] [Google Scholar]
- 10.Mundel P, Reiser J, Zúñiga Mejía Borja A, Pavenstädt H, Davidson GR, Kriz W, et al.: Rearrangements of the cytoskeleton and cell contacts induce process formation during differentiation of conditionally immortalized mouse podocyte cell lines. Exp Cell Res 236: 248–258, 1997. 10.1006/excr.1997.3739 [DOI] [PubMed] [Google Scholar]
- 11.Ueno1 T, Kobayashi N, Nakayama M, Takashima Y, Ohse T, Pastan I, et al.: Aberrant Notch1-dependent effects on glomerular parietal epithelial cells promotes collapsing focal segmental glomerulosclerosis with progressive podocyte loss. Kidney Int 83: 1065–1075, 2013. 10.1038/ki.2013.48 [DOI] [PMC free article] [PubMed] [Google Scholar]
- 12.Komatsu M, Waguri S, Ueno T, Iwata J, Murata S, Tanida I, et al.: Impairment of starvation-induced and constitutive autophagy in Atg7-deficient mice. J Cell Biol 169: 425–434, 2005. 10.1083/jcb.200412022 [DOI] [PMC free article] [PubMed] [Google Scholar]
- 13.Asanuma K, Akiba-Takagi M, Kodama F, Asao R, Nagai Y, Lydia A, et al.: Dendrin location in podocytes is associated with disease progression in animal and human glomerulopathy. Am J Nephrol 33: 537–549, 2011. 10.1159/000327995 [DOI] [PubMed] [Google Scholar]
- 14.Kim YH, Goyal M, Kurnit D, Wharram B, Wiggins J, Holzman L, et al.: Podocyte depletion and glomerulosclerosis have a direct relationship in the PAN-treated rat. Kidney Int 60: 957–968, 2001. 10.1046/j.1523-1755.2001.060003957.x [DOI] [PubMed] [Google Scholar]
- 15.Macconi D, Bonomelli M, Benigni A, Plati T, Sangalli F, Longaretti L, et al.: Pathophysiologic implications of reduced podocyte number in a rat model of progressive glomerular injury. Am J Pathol 168: 42–54, 2006. 10.2353/ajpath.2006.050398 [DOI] [PMC free article] [PubMed] [Google Scholar]
- 16.Mundel P, Shankland SJ: Podocyte biology and response to injury. J Am Soc Nephrol 13: 3005–3015, 2002. 10.1097/01.ASN.0000039661.06947.FD [DOI] [PubMed] [Google Scholar]
- 17.Gavilán E, Pintado C, Gavilan MP, Daza P, Sánchez-Aguayo I, Castaño A, et al.: Age-related dysfunctions of the autophagy lysosomal pathway in hippocampal pyramidal neurons under proteasome stress. Neurobiol Aging 36: 1953–1963, 2015. 10.1016/j.neurobiolaging.2015.02.025 [DOI] [PubMed] [Google Scholar]
- 18.Pandey UB, Nie Z, Batlevi Y, McCray BA, Ritson GP, Nedelsky NB, et al.: HDAC6 rescues neurodegeneration and provides an essential link between autophagy and the UPS. Nature 447: 859–863, 2007. 10.1038/nature05853 [DOI] [PubMed] [Google Scholar]
- 19.Mizushima N, Yoshimori T: How to interpret LC3 immunoblotting. Autophagy 3: 542–545, 2007. 10.4161/auto.4600 [DOI] [PubMed] [Google Scholar]
- 20.López-Otín C, Blasco MA, Partridge L, Serrano M, Kroemer G: The hallmarks of aging. Cell 153: 1194–1217, 2013. 10.1016/j.cell.2013.05.039 [DOI] [PMC free article] [PubMed] [Google Scholar]
- 21.Chondrogianni N, Gonos ES: Proteasome dysfunction in mammalian aging: Steps and factors involved. Exp Gerontol 40: 931–938, 2005. 10.1016/j.exger.2005.09.004 [DOI] [PubMed] [Google Scholar]
- 22.Mizushima N, Yamamoto A, Matsui M, Yoshimori T, Ohsumi Y: In vivo analysis of autophagy in response to nutrient starvation using transgenic mice expressing a fluorescent autophagosome marker. Mol Biol Cell 15: 1101–1111, 2004. 10.1091/mbc.E03 [DOI] [PMC free article] [PubMed] [Google Scholar]
- 23.Kruse J-P, Gu W: Modes of p53 regulation. Cell 137: 609–622, 2009. 10.1016/j.cell.2009.04.050 [DOI] [PMC free article] [PubMed] [Google Scholar]
- 24.Thomasova D, Bruns HA, Kretschmer V, Ebrahim M, Romoli S, Liapis H, et al.: Murine double minute-2 prevents p53-overactivation-related cell death (podoptosis) of podocytes. J Am Soc Nephrol 26: 1513–1523, 2015. 10.1681/ASN.2014040345 [DOI] [PMC free article] [PubMed] [Google Scholar]
- 25.Acharya P, Engel JC, Correia MA: Hepatic CYP3A suppression by high concentrations of proteasomal inhibitors: A consequence of endoplasmic reticulum (ER) stress induction, activation of RNA-dependent protein kinase-like ER-bound eukaryotic initiation factor 2α (eIF2α)-kinase (PERK) and general control nonderepressible-2 eIF2α kinase (GCN2), and global translational shutoff. Mol Pharmacol 76: 503–515, 2009. 10.1124/mol.109.056002 [DOI] [PMC free article] [PubMed] [Google Scholar] [Retracted]
- 26.Otoda T, Takamura T, Misu H, Ota T, Murata S, Hayashi H, et al.: Proteasome dysfunction mediates obesity-induced endoplasmic reticulum stress and insulin resistance in the liver. Diabetes 62: 811–824, 2013. 10.2337/db11-1652 [DOI] [PMC free article] [PubMed] [Google Scholar]
- 27.Guo C, Liu Y, Zhao W, Wei S, Zhang X, Wang W, et al.: Apelin promotes diabetic nephropathy by inducing podocyte dysfunction via inhibiting proteasome activities. J Cell Mol Med 19: 2273–2285, 2015. 10.1111/jcmm.12619 [DOI] [PMC free article] [PubMed] [Google Scholar]
- 28.Beeken M, Lindenmeyer MT, Blattner SM, Radón V, Oh J, Meyer TN, et al.: Alterations in the ubiquitin proteasome system in persistent but not reversible proteinuric diseases. J Am Soc Nephrol 25: 2511–2525, 2014. 10.1681/ASN.201305052224722446 [Google Scholar]
- 29.Inoki K: mTOR signaling in autophagy regulation in the kidney. Semin Nephrol 34: 2–8, 2014. 10.1016/j.semnephrol.2013.11.002.mTOR [DOI] [PMC free article] [PubMed] [Google Scholar]
- 30.Pan T, Kondo S, Zhu W, Xie W, Jankovic J, Le W: Neuroprotection of rapamycin in lactacystin-induced neurodegeneration via autophagy enhancement. Neurobiol Dis 32: 16–25, 2008. 10.1016/j.nbd.2008.06.003 [DOI] [PubMed] [Google Scholar]
- 31.Keller JN, Hanni KB, Markesbery WR: Possible involvement of proteasome inhibition in aging: Implications for oxidative stress. Mech Ageing Dev 113: 61–70, 2000. 10.1016/S0047-6374(99)00101-3 [DOI] [PubMed] [Google Scholar]
- 32.Cui J, Bai XY, Shi S, Cui S, Hong Q, Cai G, et al.: Age-related changes in the function of autophagy in rat kidneys. Age (Dordr) 34: 329–339, 2012. 10.1007/s11357-011-9237-1 [DOI] [PMC free article] [PubMed] [Google Scholar]
- 33.Tomaru U, Takahashi S, Ishizu A, Miyatake Y, Gohda A, Suzuki S, et al.: Decreased proteasomal activity causes age-related phenotypes and promotes the development of metabolic abnormalities. Am J Pathol 180: 963–972, 2012. 10.1016/j.ajpath.2011.11.012 [DOI] [PubMed] [Google Scholar]
- 34.Keller JN, Hanni KB, Markesbery WR: Impaired proteasome function in Alzheimer’s disease. J Neurochem 75: 436–439, 2000. 10.1046/j.1471-4159.2000.0750436.x [DOI] [PubMed] [Google Scholar]
- 35.Jenner P: Parkinson’s disease, pesticides and mitochondrial dysfunction. Trends Neurosci 24: 245–247, 2001 [DOI] [PubMed] [Google Scholar]
- 36.Myeku N, Duff KE: Targeting the 26S proteasome to protect against proteotoxic diseases. Trends Mol Med 24: 18–29, 2018. 10.1016/j.molmed.2017.11.006.Targeting [DOI] [PMC free article] [PubMed] [Google Scholar]
Associated Data
This section collects any data citations, data availability statements, or supplementary materials included in this article.


