

Abstract
Mitophagy is an essential cellular autophagic process that selectively removes superfluous and damaged mitochondria, and it is coordinated with mitochondrial biogenesis to fine tune the quantity and quality of mitochondria. Coordination between these two opposing processes to maintain the functional mitochondrial network is of paramount importance for normal cellular and organismal metabolism. However, the underlying mechanism is not completely understood. Here we report that PGC‐1α and nuclear respiratory factor 1 (NRF1), master regulators of mitochondrial biogenesis and metabolic adaptation, also transcriptionally upregulate the gene encoding FUNDC1, a previously characterized mitophagy receptor, in response to cold stress in brown fat tissue. NRF1 binds to the classic consensus site in the promoter of Fundc1 to upregulate its expression and to enhance mitophagy through its interaction with LC3. Specific knockout of Fundc1 in BAT results in reduced mitochondrial turnover and accumulation of functionally compromised mitochondria, leading to impaired adaptive thermogenesis. Our results demonstrate that FUNDC1‐dependent mitophagy is directly coupled with mitochondrial biogenesis through the PGC‐1α/NRF1 pathway, which dictates mitochondrial quantity, quality, and turnover and contributes to adaptive thermogenesis.
Keywords: adaptive thermogenesis, brown adipose tissue, mitochondrial biogenesis, mitophagy
Subject Categories: Membrane & Intracellular Transport, Metabolism
A direct coupling of FUNDC1‐dependent mitophagy with mitochondrial biogenesis under the control of PGC‐1α/NRF1 determines mitochondrial turnover, abundance and quality in brown fat tissue, which consequently contributes to cold tolerance in mice.

Introduction
Mitochondria are highly dynamic and undergo constant turnover through two opposing processes: mitophagy, which selectively removes superfluous and damaged mitochondria by the autolysosomal pathway, and mitochondrial biogenesis, which generates fresh, functional ones (Gottlieb & Gustafsson, 2011; Palikaras & Tavernarakis, 2014; Dorn et al, 2015; Pickles et al, 2018). Mitochondrial biogenesis preserves mitochondrial function and cellular homeostasis under diverse (patho‐)physiological conditions such as physical exercise, nutrient deprivation, temperature fluctuations (Rasbach & Schnellmann, 2007; Miwa et al, 2008; Gottlieb & Carreira, 2010), and during cell differentiation (Chen et al, 2012). On the other hand, mitophagy, by removing the “old” or damaged mitochondria, reduces the source of oxidative stress (Schofield & Schafer, 2020), limits the risk of cell senescence and apoptosis (Hickson‐Bick et al, 2008), and allows the cell to undergo metabolic reprogramming during developmental and environmental stress. However, excessive mitophagy in the absence of mitochondrial biogenesis causes stress to the remaining mitochondria and leads to mitophagic cell death (Dagda et al, 2008; Kubli & Gustafsson, 2012; Gottlieb & Thomas, 2017; Manfredi et al, 2019; Pirooznia et al, 2020). Proper coordination of mitophagy and mitochondrial biogenesis is essential for the quantity and quality control of mitochondria and allows cells to change their mitochondrial mass in response to the ever‐changing cellular metabolic state and to intracellular or environmental cues (Palikaras et al, 2015a; Altshuler‐Keylin & Kajimura, 2017). An imbalance between mitochondrial degradation and biogenesis leads to functional impairment of biological systems and cell death (Ploumi et al, 2017). The significance of coordination between these processes is further underlined by evidence showing that altered mitochondrial mass is a common feature of numerous pathologic conditions (Vafai & Mootha, 2012; Dorn et al, 2015). During aging and in many diseases, gradual changes in mitochondrial mass and progressive mitochondrial dysfunction are observed (Preston et al, 2008; Artal‐Sanz & Tavernarakis, 2009; Kaeberlein, 2010; Palikaras et al, 2015a). Thus, the crosstalk between mitophagy and mitochondrial biogenesis is vital to maintain normal cellular and organismal physiology. Both mitophagy and mitochondrial biogenesis are emerging as potential targets for therapeutic interventions against diseases associated with aging (Valero, 2014; Palikaras et al, 2017).
Mitochondrial biogenesis is spatiotemporally regulated by activating different transcription factors. Among these are nuclear respiratory factors (NRF1 and NRF2) (Scarpulla, 1997, 2008), estrogen‐related receptors (ERR‐α, ERR‐β, ERR‐γ) (Fan & Evans, 2015), and myocyte enhancer factor 2 (MEF2) (Scarpulla, 2002). Their transcription activity is orchestrated by the peroxisome proliferator‐activated receptor gamma co‐activator 1‐alpha (PGC‐1α) in response to diverse stimuli, such as hormones, growth factors, fasting/feeding transition, physical exercise, and temperature fluctuations (Anderson et al, 2008; Fernandez‐Marcos & Auwerx, 2011; Miller et al, 2019). PGC‐1α acts as a sensor for different signaling pathways, which regulate its expression, phosphorylation, stability, and transcriptional activity (Kelly & Scarpulla, 2004; Dominy & Puigserver, 2013). Once activated, PGC‐1α is recruited to the chromatin where it physically interacts with or indirectly activates these transcriptional regulators, which are involved in diverse cellular functions including metabolic adaptation and mitochondrial biogenesis in a context‐dependent manner (Puigserver, 2005; Scarpulla et al, 2012). For example, in brown adipose tissue (BAT), chronic cold exposure stimulates the β‐adrenergic signaling pathway to activate PGC‐1α through post‐translational modifications and increased expression of the PGC‐1α gene (Puigserver et al, 1998; Lowell & Spiegelman, 2000; Cannon & Nedergaard, 2004). Subsequently, the activated PGC‐1α enhances the transcription activities of NRF1 along with PPARγ to drive mitochondrial biogenesis and adaptive metabolic gene programs leading to metabolic reprogramming and increased non‐shivering energy expenditure. Notably, mice deficient in PGC‐1α are extremely cold‐sensitive (Lin et al, 2004; Leone et al, 2005), and only half of PGC‐1α KO pups survive the early postnatal period and grow into adults (Lin et al, 2004). Deficiency of NRF1 caused embryonic lethality in mice (Huo & Scarpulla, 2001). These results highlight the important role of PGC‐1α and NRF1‐mediated mitochondrial biogenesis in development and metabolic adaptations.
Significant advances have been made in understanding the regulation of mitophagy, mostly based on cultured cell systems (Ashrafi & Schwarz, 2013; Liu et al, 2014). Two major pathways have been described to mediate the recruitment of the autophagic machinery for subsequent degradation of mitochondria, one depending on PINK1/Parkin and the other relying on a set of receptor proteins such as FUNDC1, NIX, BCL2L13, FKBP8, and PHB2 (Novak et al, 2010; Liu et al, 2012; Okamoto, 2014; Murakawa et al, 2015; Bhujabal et al, 2017; Wei et al, 2017; Lampert et al, 2019). Upon loss of mitochondrial membrane potential, or treatment with mitochondrial toxins or hypoxia, these pathways become activated to recruit other autophagy receptors and autophagy‐related proteins (ATGs) including ULK1 to mitochondria for formation of mitophagosomes (Corti & Brice, 2013; Zhang & Lin, 2016; Laker et al, 2017). Loss of Parkin, NIX, FUNDC1, or ULK1 leads to the accumulation of functionally compromised and swollen mitochondria, indicative of defective mitophagy (Kundu et al, 2008; Sandoval et al, 2008; McWilliams & Muqit, 2017; Li et al, 2019). Surprisingly, however, there are other reports showing that dysfunctional mitochondria caused by the specific knockout of mitochondrial transcription factor A (Tfam) do not recruit Parkin in vivo, and neither the clearance of defective mitochondria nor the neurodegeneration phenotype is affected by the absence of Parkin (Sterky et al, 2011). Also, exercise‐induced mitophagy in skeletal muscle occurs in the absence of stabilization of PINK1 on mitochondria (Drake et al, 2019). These results suggest that that Parkin and PINK1 do more than just activate mitophagy (Scarffe et al, 2014). Thus, the molecular regulation of mitophagy and its contribution to mitochondrial and cellular (patho‐)physiology and aging or aging‐related diseases requires further clarification.
Although the molecular regulation of both mitochondrial biogenesis and mitophagy is well characterized, it is less clear how these two opposing processes are coordinated to produce a functional mitochondrial network under (patho‐)physiological settings. It is interesting to note that both mitochondrial biogenesis and mito(auto‐)phagy are induced in response to (patho‐)physiological stimuli that are known to induce mito(auto‐)phagy, such as nutrient deprivation, physical exercise (Memme et al, 2019), ischemia preconditioning (Gottlieb & Pourpirali, 2016), and other stresses (Rasbach & Schnellmann, 2007; Diaz & Moraes, 2008; Gottlieb & Carreira, 2010). It appears that mito(auto‐)phagy and mitochondrial biogenesis share common signaling pathways (Jager et al, 2007; Canto & Auwerx, 2009; Birkenfeld et al, 2011). It was also suggested that mitophagy also impacts on mitochondrial biogenesis so to balance mitochondrial turnover. Knockout of NIX or BNIP3 leads to the increased mitochondrial mass (Dorn, 2010), while overexpression of Bnip3 reduces the levels of both nuclear‐ and mitochondrial‐encoded proteins owing to the stimulation of mitochondrial turnover (Rikka et al, 2011). Parkin was found to regulate mitochondrial biogenesis through the regulation of PARIS (ZFN746), a zinc finger protein and a substrate of Parkin (Shin et al, 2011). In an effort to understand the mechanism of cold‐induced mitophagy in brown fat tissue, we demonstrated that PGC‐1α/NRF1, two master regulators of mitochondrial biogenesis, also transcriptionally regulate FUNDC1. We showed that FUNDC1‐dependent mitophagy is coupled with mitochondrial biogenesis, and defective mitophagy leads to abnormal mitochondrial turnover. We suggest that this regulation of FUNDC1 by PGC‐1α/NRF1 controls mitochondrial number, quality, and turnover, thereby contributing to thermogenesis in response to cold stress.
Results
Expression of FUNDC1 is induced by cold exposure in BAT
Brown adipose tissue (BAT) has a high abundance of mitochondria, and mitochondrial biogenesis is strongly induced during cold acclimation (Puigserver et al, 1998). Indeed, when mice were kept at 4°C for 3 days, compared to control mice which were housed under thermally neutral conditions (30°C), we observed that the levels of some mitochondrial proteins, such as cytochrome c (CYCS) and TIM23, were increased 1.7‐fold (Fig 1A and B). Many of the corresponding mRNAs were also upregulated (Fig 1C). The mitochondrial uncoupling protein 1 (UCP1) was induced up to 3‐fold (Fig 1A and B), while the induction of Ucp1 mRNA was much higher than that of the protein (Fig 1C). This reflects the fact that Ucp1 is transcriptionally regulated by both PGC‐1α and PPARα (Barbera et al, 2001), and the half‐life of Ucp1 mRNA is dramatically reduced upon cold exposure (Jacobsson et al, 1987; del Mar Gonzalez‐Barroso et al, 2000; Nedergaard et al, 2001). In agreement with a previous report in rats (Watanabe et al, 2008), VDAC1 is unaffected upon cold exposure in BAT in mice. We also found that the protein level, but not the mRNA level, of HSP60 is increased upon cold exposure, which indicates that some mitochondrial protein levels are subjected to post‐transcriptional regulation in BAT. We also detected a two‐fold increase in the mtDNA copy number (Fig 1D), further supporting the notion that mitochondrial biogenesis is induced upon cold exposure. The fold increases of mRNA, protein, and mtDNA levels are different, which suggests that distinct regulatory mechanisms are involved in gene expression and protein stability. Surprisingly, we also found a robust induction of FUNDC1, a previously characterized mitophagy receptor, at both the protein (2.6‐fold) and mRNA (2.3‐fold) levels in BAT after 3 days of cold exposure (Fig 1A–C). The relative increase of mitochondrial proteins was analyzed by normalizing proteins levels to the mtDNA levels, which showed that more FUNDC1 was induced compared to the other mitochondrial proteins, such as HSP60, TIM23, and VDAC1 (Fig 1E). The levels of NIX, another reported mitophagy receptor, were not affected at either the mRNA or protein levels (Fig 1A–C). The protein and mRNA levels of Parkin were significantly reduced upon cold exposure (Fig 1A–C), consistent with a previous report that Parkin expression is repressed by thermogenic stimuli (Cairo et al, 2019). We also found that the protein level of PINK1 was increased, while the mRNA level of PINK1 was reduced upon cold exposure (Fig 1A–C), which indicates the protein level of PINK1 is regulated by post‐transcriptional mechanism (Jin et al, 2010; Greene et al, 2012; Cairo et al, 2019). Immunohistochemical analysis further confirmed the increased expression of FUNDC1 in BAT after cold exposure (Fig 1F and G).
Figure 1. Expression of FUNDC1 is induced by cold exposure in BAT.

-
A–EBATs were isolated from cold‐exposed mice (4°C, 72 h) or control mice (30°C, 72 h), then lysed, and subjected to Western blotting for analysis of the indicated proteins (A). Relative protein expression levels, normalized to actin, are shown in (B). mRNA expression levels of the indicated genes were assayed by real‐time PCR and normalized to Actb (C). Mitochondrial DNA copy numbers were determined by real‐time PCR and normalized to nuclear DNA standards (D). Relative increase of mitochondrial proteins was normalized to mtDNA copy numbers and plotted (E). Data information: n = 6 biological replicates, data are represented as the mean ± SEM. Statistical analysis was performed using two‐tailed Student's t‐test. ns: no significant difference; *P < 0.05; **P < 0.01; ***P < 0.001.
-
F, GRepresentative images showing immunohistochemical detection of FUNDC1 in sections of BATs from mice kept at 30 or 4°C for 72 h. Scale bar, 50 μm. The expression of FUNDC1 was quantified by analyzing and normalizing the average optical density of FUNDC1 staining. Data information: n = 4 biological replicates, data are represented as the mean ± SEM. Statistical analysis was performed using two‐tailed Student's t‐test. **P < 0.01.
PGC‐1α regulates FUNDC1 expression
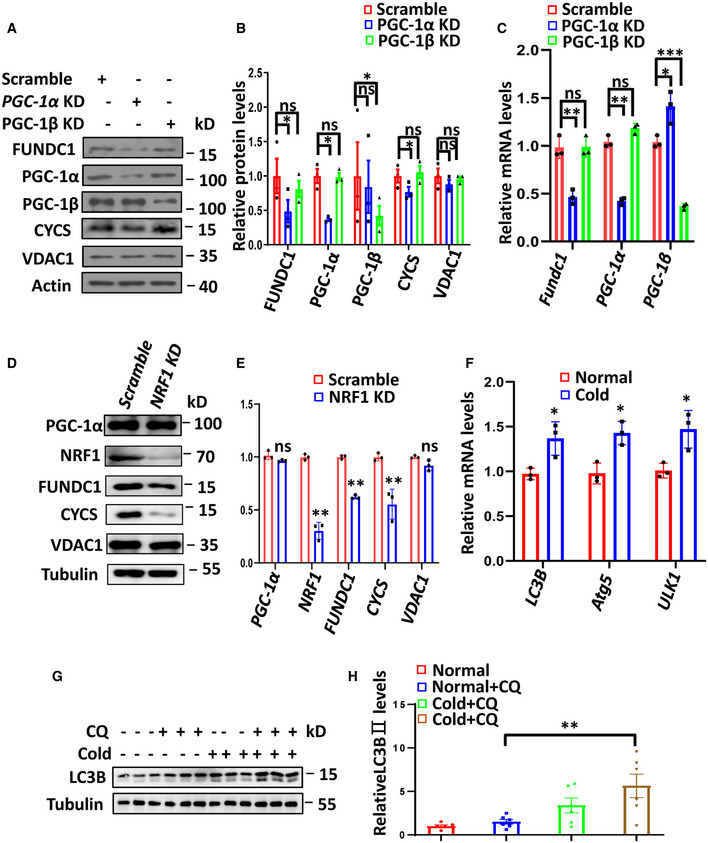
It is well established that PGC‐1α and NRF1 are responsible for mitochondrial biogenesis in BAT in response to cold acclimation (Wu et al, 1999). We were thus prompted to examine whether they are responsible for the induction of FUNDC1. Some of the commercial antibodies against PGC‐1α are not suitable for Western blotting. After several tests, we found that the mouse monoclonal antibody 4C1.3 gives a consistent result in detecting a 113‐kD PGC‐1α band in Western blots (Aquilano et al, 2010; Ruas et al, 2012; Park et al, 2015). The levels of NRF1 and PGC‐1α proteins were increased by 1.6‐ to 3.8‐fold in BAT after cold exposure (Fig 2A and B). The mRNA level of PGC‐1α was also significantly increased upon cold exposure; however, the mRNA level of NRF1 was unchanged, which suggests that the stability of NRF1 protein is increased by cold exposure or the increase of NRF1 mRNA occurs at an earlier time point (Fig 2C). It was reported that PGC‐1α expression is highly induced during brown adipocyte differentiation (Uldry et al, 2006). We thus wanted to know whether the expression of FUNDC1 is also induced during this process. We isolated brown fat preadipocytes from mice and immortalized these cells by infection with SV40 large T antigen. We found that, like UCP1 and CYCS, which are PGC‐1α‐regulated proteins, the FUNDC1 protein level was elevated when the immortalized preadipocytes were treated with an adipogenic cocktail to induce their differentiation into brown adipocytes, while the protein level of VDAC1 was unchanged during the differentiation process (Fig EV1A–C). We then infected the immortalized brown preadipocytes cells with adenoviruses encoding PGC‐1α or GFP and found that the FUNDC1 protein level was markedly enhanced along with other PGC‐1α/NRF1‐regulated gene products such as CYCS (Fig EV1D–F). The levels of other mitochondrial proteins such as TIM23 and VDAC1 were not affected by PGC‐1α re‐introduction, which indicates that the induction of FUNDC1 is not due to the overall increase of mitochondrial content induced by PGC‐1α (Fig EV1D–F). Moreover, the FUNDC1 protein level was also elevated by 2‐ to 3‐fold in HeLa and 293 cells when PGC‐1α was ectopically introduced (Fig EV1G and H), which suggests that PGC‐1α regulation of FUNDC1 is of general significance. Conversely, knockdown of PGC‐1α in the immortalized brown preadipocytes reduced the protein and mRNA levels of FUNDC1, and this effect could be rescued by reintroducing PGC‐1α into stable PGC‐1α knockdown brown preadipocytes (Fig 2D–F). We found that both in preadipocytes and in mature adipocytes, when PGC‐1α was knocked down, the level of the PGC‐1α‐regulated mitochondrial protein CYCS also decreased like FUNDC1, although the expression of another mitochondrial protein, VDAC1, was unaffected (Fig 2D–H). The regulation of FUNDC1 expression by PGC‐1α is specific, as knockdown of its close homolog PGC‐1β, which also functions in mitochondrial biogenesis and regulation of energy expenditure, had no effect on FUNDC1 expression (Fig EV2A–C). Taking these results together, we conclude that the expression of FUNDC1 is specifically regulated by PGC‐1α.
Figure 2. PGC‐1α regulates FUNDC1 expression.

-
A–CWestern blotting analysis of proteins related to mitochondrial biogenesis in BATs from mice at 30°C (Normal) or following 72 h at 4°C (Cold) (A). Relative protein expression levels were normalized to Actin (B). mRNA expression levels of the indicated genes were assayed by real‐time PCR and normalized to Actb (C). Data information: n = 6 biological replicates, data are represented as the mean ± SEM. Statistical analysis was performed using two‐tailed Student's t‐test. ns: no significant difference; *P < 0.05; **P < 0.01.
-
D–FFlag‐PGC‐1α was introduced into PGC‐1α knockdown brown preadipocytes for 24 h, and samples were collected for Western blotting analyses of the indicated proteins (D). Expression levels of the indicated proteins were quantified (E) (mean ± SEM; n = 3). Scramble, scramble shRNA. Samples were collected for real‐time PCR analysis. The expression of Fundc1 was normalized (F). Data information: Experiments were repeated three times, and data are represented as the mean ± SEM. Statistical analysis was performed using two‐tailed Student's t‐test. ns: no significant difference; *P < 0.05; **P < 0.01.
-
G, HScramble and PGC‐1α knockdown preadipocytes were induced to differentiate into mature adipocytes, and samples were collected for Western blotting analyses (G) and quantification of the indicated proteins (H). Data information: Experiments were repeated three times, and data are represented as the mean ± SEM. Statistical analysis was performed using two‐tailed Student's t‐test. ns: no significant difference; **P < 0.01.
Figure EV1. FUNDC1 is regulated by PGC‐1α.

-
A–COil red O staining (A) analysis of differentiated brown adipocytes (5 days) and Western blotting analysis (B) of brown preadipocytes (0 days) and differentiated cells (5 days), scale bar, 10 μm. The expression levels of the indicated proteins are quantified in (C). Data information: experiments were repeated three times, data are represented as the mean ± SEM. Statistical analysis was performed using two‐tailed Student's t‐test. ns: no significant difference; *P < 0.05.
-
D–FBrown fat preadipocytes were infected with control adenovirus and adenovirus expressing PGC‐1α. GFP expression was used as an indicator for cell infection, scale bar, 10 μm (D). Levels of the indicated proteins were analyzed by Western blotting and quantified (E, F). Data information: experiments were repeated three times, data are represented as the mean ± SEM. Statistical analysis was performed using two‐tailed Student's t‐test. ns: no significant difference; *P < 0.05.
-
G, HWestern blotting analysis of the indicated proteins in HeLa (G) and 293 (H) cells transfected with control vector and a Flag‐PGC‐1α expression construct. Quantification of the expression levels of the indicated proteins is shown in the panel below. Data information: Experiments were repeated three times, and data are represented as the mean ± SEM. Statistical analysis was performed using two‐tailed Student's t‐test. *P < 0.05.
Figure EV2. PGC‐1α and NRF1 are essential for expression of Fundc1, and the autophagic flux is enhanced by cold exposure in BAT.
-
A–CWestern blotting analysis of the indicated proteins in scramble, PGC‐1α knockdown, and PGC‐1β knockdown brown fat preadipocytes (A). Expression levels of the indicated proteins were quantified (B). Real‐time PCR analysis of the expression of the indicated genes in scramble, PGC‐1α knockdown, and PGC‐1β knockdown brown fat preadipocytes (C). Data information: Experiments were repeated three times, and data are represented as the mean ± SEM. Statistical analysis was performed using two‐tailed Student's t‐test. ns: no significant difference; *P < 0.05; **P < 0.01; ***P < 0.001.
-
D, EScramble and NRF1 knockdown preadipocytes were induced to differentiate into mature adipocytes, and samples were collected for Western blotting analyses and quantification of the indicated proteins. Data information: Experiments were repeated three times, and data are represented as the mean ± SEM. Statistical analysis was performed using two‐tailed Student's t‐test. ns: no significant difference; **P < 0.01.
-
FExpression of the indicated genes was analyzed by real‐time PCR in BAT before and after cold exposure (4°C) for 72 h. Data information: n = 3 biological replicates, data are represented as the mean ± SEM. Statistical analysis was performed using two‐tailed Student's t‐test. *P < 0.05.
-
G, HThe WT mice were treated with chloroquine (CQ; 30 mg/kg/day) for 72h in normal or cold conditions, and the expression of LC3B was detected by Western blotting. The expression of LC3BII was quantified and plotted (H). Data information: n = 6 biological replicates, data are represented as the mean ± SEM. Statistical analysis was performed using two‐way ANOVA test. **P < 0.01.
NRF1 transcriptionally regulates FUNDC1 expression
Since PGC‐1α stimulates mitochondrial biogenesis through NRF1 in response to cold stress, we considered the possibility that FUNDC1 is transcriptionally regulated by NRF1. To pursue this, we identified two putative NRF1 binding sites in the promoter of the Fundc1 gene using the online promoter analysis tool AliBaba2.1. These sites are located at ‐1315/‐1305 and ‐186/‐176 (Fig 3A). Deletion and mutation analysis identified that the ‐186/‐176 NRF1 binding element is functional (Fig 3A and B). This site is identical to the sequence previously identified in the VSNL1 promoter (Fu et al, 2009) and is required for Fundc1 promoter activity (Fig 3A and B). To determine whether NRF1 directly binds to the Fundc1 promoter, we performed electrophoretic mobility shift assay (EMSA) analysis with nuclear proteins extracted from HeLa cells. Firstly, we synthesized a positive control oligonucleotide probe according to the NRF1 binding site sequence in the VSNL1 promoter (Fu et al, 2009) and compared it to an oligonucleotide probe containing the NRF1 binding sequence in the Fundc1 promoter (Fundc1 probe). The biotinylated Fundc1 probe but not the mutant Fundc1 probe was retarded in the same way as the positive control probe in the presence of HeLa nuclear proteins (Fig 3C). Furthermore, the retarded band was competitively blocked by a cold oligonucleotide but not by a mutant oligonucleotide (Fig 3D). A super‐shifted band was observed when an NRF1 antibody was added, which indicates that NRF1 binds to the Fundc1 promoter (Fig 3D). We further performed ChIP‐PCR analysis with the NRF1 antibody on the Fundc1 promoter to verify NRF1 binding to the Fundc1 promoter in HeLa cells (Fig 3E). Additionally, in the immunoprecipitate of Flag‐PGC‐1α‐transfected cells, we were able to detect the region of the Fundc1 promoter containing the NRF1 binding element, which indicates cobinding of PGC‐1α and NRF1 on the Fundc1 promoter in HeLa cells (Fig 3F). Next, we asked whether NRF1 was responsible for the expression of FUNDC1 in cells. The protein level of FUNDC1 was reduced in NRF1 stable knockdown HeLa cells, and this reduction was rescued by reintroducing NRF1 (Fig 3G). We also confirmed that the expression of FUNDC1 was also regulated by NRF1 in mature adipocytes, while the level of the FUNDC1 protein decreased when NRF1 was knocked down (Fig EV2D and E). Also, the induction of FUNDC1 by PGC‐1α was partially suppressed by knockdown of NRF1 (Fig 3H). Finally, by ChIP‐PCR, we showed that PGC‐1α binding on the Fundc1 promoter was also compromised in NRF1 stable knockdown cells (Fig 3I). Together, these data demonstrated that the PGC‐1α/NRF1 axis is responsible for transcriptional regulation of the expression of FUNDC1.
Figure 3. NRF1 transcriptionally regulates FUNDC1 expression.

-
ASchematic representation of human Fundc1 promoter deletion constructs and two putative NRF1 binding sites were marked in blue and red and the corresponding luciferase activity expressed as the activity relative to the 2,000 bp promoter. Data information: Experiments were repeated three times, and data are represented as the mean ± SEM.
-
BLuciferase activity stimulated by the human Fundc1 promoter. The activity of Fundc1 promoter fragments, either wild type (WT) or with a mutation in the potential NRF1 binding site, was assayed using a dual‐luciferase reporter system. Data information: Experiments were repeated three times, and data are represented as the mean ± SEM.
-
C, DEMSA assay using biotinylated oligonucleotide probes containing the predicted NRF1 binding site or mutant NRF1 binding site in the promoter of Fundc1 (F1 probe or mut F1 probe), the confirmed NRF1 binding site in the promoter of VSNL1 (positive probe). The probes were incubated with HeLa nuclear extracts and then run on a gel (C). A super‐shifted band (asterisk) is detected in the presence of an anti‐NRF1 antibody (D). Labeled probe: biotin‐labeled wild‐type Fundc1 probe; Cold probe: wild‐type Fundc1 probe; Mut probe: NRF1 binding site mutant Fundc1 probe; asterisk indicates the super‐shifted band generated with antibody to NRF1.
-
E, FChIP assay to analyze the interaction of NRF1 (E) or PGC‐1α (F) proteins with the Fundc1 promoter.
-
GNRF1‐myc was introduced into NRF1 shRNA knockdown cells for 24 h, and scramble cells were used as control, and samples were collected for Western blotting with the indicated antibodies.
-
HScramble and NRF1 shRNA knockdown cells were transfected with vector and PGC‐1α‐Flag for 24 h, and samples were collected for Western blotting with the indicated antibodies.
-
IChIP analysis of the interaction of PGC‐1α protein with the Fundc1 promoter in scramble or NRF1 shRNA knockdown cells.
Cold exposure induces mitophagy and the interaction between FUNDC1 and LC3
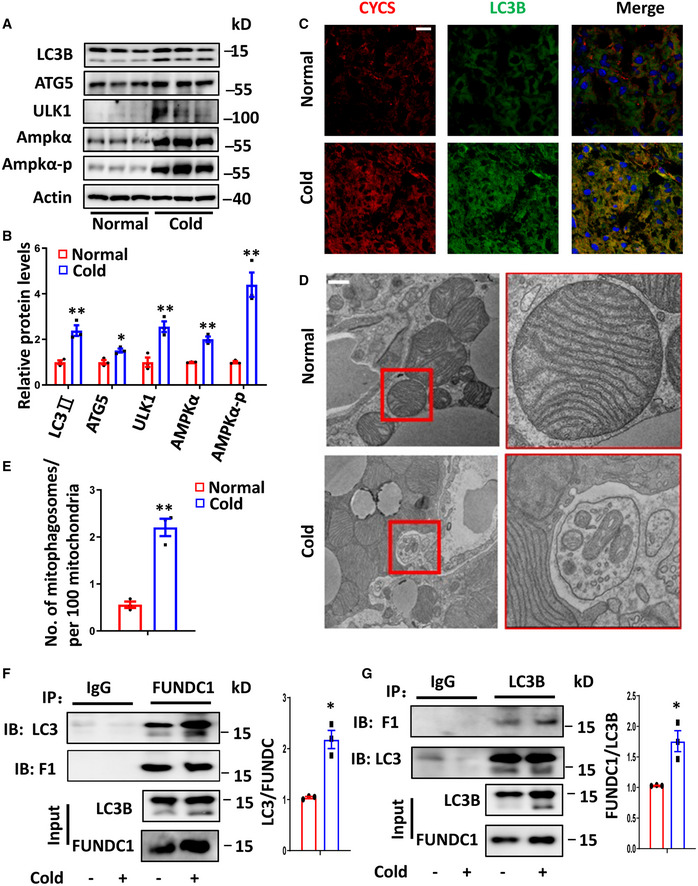
The robust induction of FUNDC1 in BAT after cold exposure prompted us to examine whether mitophagy is also induced in a FUNDC1‐dependent manner. Early studies suggested that cold suppresses autophagy (Cairo et al, 2016). However, recent studies showed that some (if not all) ATG genes are induced upon cold exposure (Martinez‐Lopez et al, 2016; Lu et al, 2018). Western blotting analysis showed that several autophagy marker proteins, including ATG5, ULK1, LC3B (Kabeya et al, 2000), and the lipidated form of LC3B (LC3BII) (He & Klionsky, 2009), were drastically elevated in BAT upon cold challenge (Fig 4A and B). The mRNA levels of the corresponding ATG genes were also moderately increased (Fig EV2F). We found that the protein levels of both AMPKα and phosphorylated AMPKα (at Thr172) are enhanced upon cold exposure, which suggests that activation of AMPKα is involved in the induction of autophagic flux by cold (Fig 4A and B). Immunostaining further confirmed that expression of the autophagy marker LC3B was induced in BAT after cold exposure (Fig 4C). Next, we treated mice with chloroquine for 72h and found that the LC3B‐II levels upon cold exposure were significantly higher than that treated with chloroquine at 30 °C, indicating the induction of autophagic flux upon cold exposure (Fig EV2G and H). To ascertain that mitophagy occurs, we acquired electron microscope (EM) images to assess the ultrastructure of BAT mitochondria and mitophagosomes from mice subjected to 4 °C (cold) versus 30 °C (normal) for 3 days. We clearly observed that some mitochondria with typical cristae were engulfed by autophagosomes in the cold‐exposed BAT (Fig 4D). Compared to controls, the number of mitophagosomes was significantly increased upon cold challenge (Fig 4D and E). These results indicate that mitophagy is significantly increased in cold‐exposed BAT.
Figure 4. Cold exposure induces mitophagy and the interaction between FUNDC1 and LC3.
-
A, BWestern blotting analyses of the levels of autophagy‐related proteins in BAT from mice at the normal temperature (30°C) or at 4°C for 72 h (A). Expression of the indicated proteins was analyzed before and after 72 h cold exposure (4°C) (B). Data information: n = 3 biological replicates, data are represented as the mean ± SEM. Statistical analysis was performed using two‐tailed Student's t‐test. *P < 0.05; **P < 0.01.
-
CRepresentative images from immunofluorescence staining of LC3B and CYCS in BAT from mice at the normal temperature (30°C) or 4°C for 72 h.
-
D, ERepresentative transmission electron microscope (TEM) images of BAT cells isolated from mice at the normal temperature (30°C) or 4°C for 72 h. Scale bar, 1 μm (D).The number of mitophagosomes per 100 mitochondria was counted and normalized (E). Data information: n = 3 biological replicates, data are represented as the mean ± SEM. Statistical analysis was performed using two‐tailed Student's t‐test. ** P < 0.01.
-
F, GBATs from mice exposed to normal conditions (30°C) or cold (4°C) were lysed and immunoprecipitated with antibodies against FUNDC1, LC3B, or IgG and then immunoblotted with the indicated antibodies. The ratio between immunoprecipitated LC3B to FUNDC1 or FUNDC1 to LC3B was quantified and plotted (G). Data information: Experiments were repeated three times, and data are represented as the mean ± SEM. Statistical analysis was performed using two‐tailed Student's t‐test. *P < 0.05.
As both FUNDC1 and LC3B are induced in cold‐challenged BAT, we next wanted to know whether the interaction between FUNDC1 and LC3B is enhanced upon cold exposure. By using co‐immunoprecipitation, we found that about double the amount of LC3B protein was immunoprecipitated by FUNDC1 and 1.7‐fold of FUNDC1 protein was immunoprecipitated by LC3B during cold exposure (Fig 4F and G). This suggests that the interaction between FUNDC1 and LC3B was increased in mouse BAT under cold conditions (Fig 4F and G).
FUNDC1 is required for cold‐induced mitophagy in mouse BAT
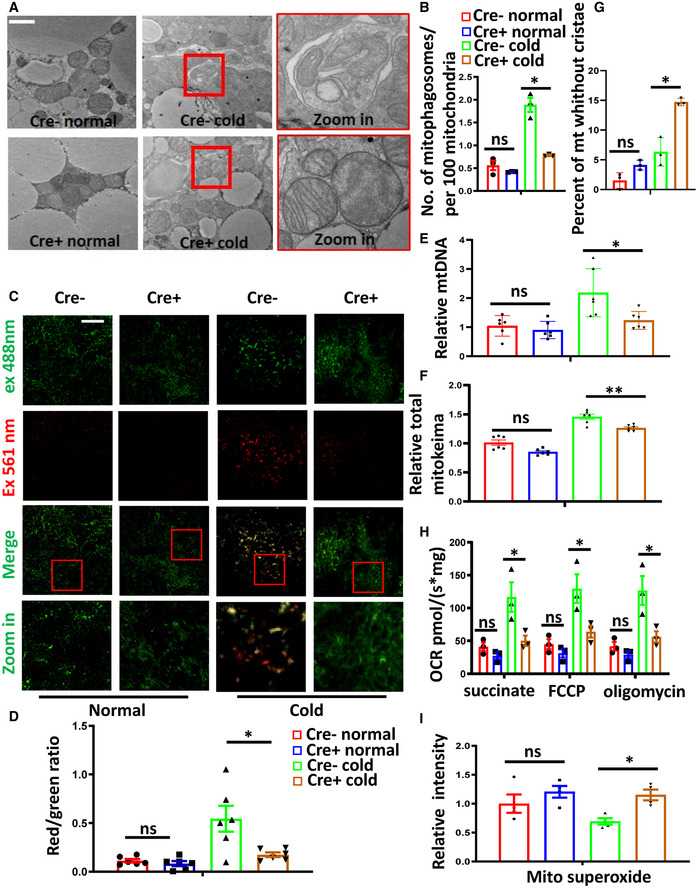
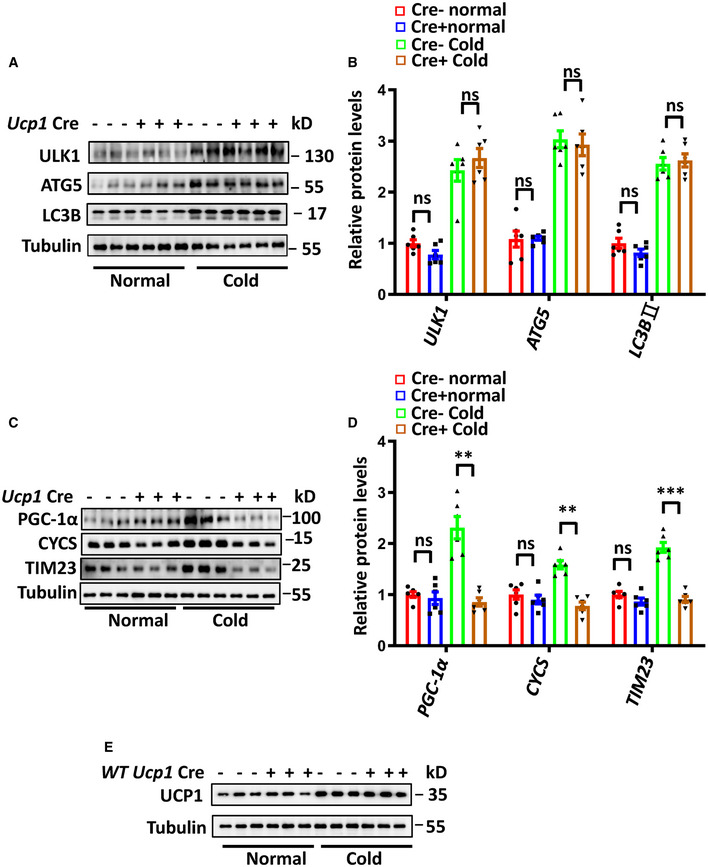
To determine the contribution of FUNDC1 to mitophagy in BAT, we generated brown adipocyte‐specific Fundc1 knockout mice by crossing Fundc1 fl/fl mice with a Ucp1 cre+ transgenic mouse (Kong et al, 2014). The genotypes of these mice were identified by PCR, and specific knockout of Fundc1 in brown adipose tissue was verified by Western blotting (Fig EV3A). The BAT‐specific Fundc1 knockout mice were normal, and there was no significant difference in O2 consumption and CO2 production rates between control (Cre−) and BAT‐specific Fundc1 knockout mice when the animals were maintained at 30°C (Fig EV3B and C). EM analysis revealed that the appearance of mitophagosomes was suppressed in BAT of cold‐exposed Fundc1 fl/fl/Ucp1 cre+ mice (Fig 5A and B), which supports the idea that FUNDC1 plays a role in cold‐induced mitophagy. We also found that the increase in autophagy proteins upon cold exposure was unaffected by FUNDC1 deficiency, indicating that FUNDC1 is mainly responsible for mitophagy in BAT (Fig EV4A and B). To firmly establish that mitophagy is indeed activated along with mitochondrial biogenesis in vivo, we generated adipocyte‐specific Fundc1 knockout mice expressing mito‐Keima by crossing Fundc1 fl/fl/Adiponectin cre+ mice (Fig EV3D) with a mito‐Keima transgenic mouse, in which the pH‐dependent mitochondrion‐targeted fluorescent protein mito‐Keima was ubiquitously expressed. This protein is known to undergo a shift to longer‐wavelength excitation when mitochondria are enclosed by acidic lysosomes, which occurs during mitophagy (Sun et al, 2015). When the Fundc1 fl/fl/Adiponectin cre−/mito‐Keima + mice were exposed to cold for 3 days, the red mito‐Keima signal in BAT was drastically increased (Fig 5C and D). In comparison, red mito‐Keima puncta were rarely observed in BAT of Fundc1 fl/fl/Adiponectin cre+/mito‐Keima + mice upon the identical treatment (Fig 5C and D). It is technically challenging to obtain quantitative data from fresh BAT, but the significantly reduced mito‐Keima signals in Fundc1‐depleted BAT strongly suggest that FUNDC1 was largely responsible for the increased mitophagy in cold conditions. We found that the mtDNA copy numbers were equivalent between control and Fundc1 knockout BAT under normal unstressed conditions, and cold exposure significantly increased the mtDNA copy numbers in control mice by two‐fold (Fig 5E). Unexpectedly, in the absence of FUNDC1, cold treatment did not greatly increase the mtDNA copy number, and the level of mtDNA was similar to that in controls at 30°C. The increase of total mito‐keima signals (green signals) induced by cold exposure was also blunted in Fundc1 knockout BAT (Fig 5F). The precise mechanism underlying this phenomenon warrants further investigation, and one possibility is that knockout of Fundc1 may have a negative feedback effect on mitochondrial biogenesis. Indeed, we observed that both the PGC‐1α level and mitochondrial biogenesis are reduced in FUNDC1‐deficient BAT upon cold exposure compared to the controls (Fig EV4C and D). We noticed that in our EM images, FUNDC1‐deficient BAT contained a relatively high proportion of mitochondria without cristae compared to controls. Cold exposure further exacerbated the appearance of mitochondria without cristae in Fundc1 fl/fl/Ucp1 cre+ BAT (Fig 5G). These data suggest that deletion of Fundc1 results in the accumulation of functionally compromised mitochondria and much reduced mitochondrial turnover. To further substantiate this, we next performed the oxygen consumption rate (OCR) assay to measure mitochondrial functions. We found that the basal and FCCP‐stimulated maximal OCRs of Fundc1‐deficient BAT did not significantly increase upon cold exposure (Fig 5H) compared to control BAT. Despite this, mitochondrial superoxide levels were higher in Fundc1 fl/fl/Ucp1 cre+ BAT than in Fundc1 fl/fl/Ucp1 cre− BAT upon cold exposure (Fig 5I). This provides further supporting evidence that mitochondria are stressed in the absence of FUNDC1. Decreased OCR, lower ATP production, and elevated mitochondrial superoxide were also observed in Fundc1‐deficient brown fat preadipocytes (Fig EV5A–C), although the differentiation ability of Fundc1‐deficient brown fat preadipocytes is largely undisturbed (Fig EV5D). Collectively, these results indicate that FUNDC1‐dependent mitophagy is essential for mitochondrial turnover and quality control in response to cold stress.
Figure EV3. Generation of mice with brown adipocyte‐specific or adipocyte‐specific knockout of Fundc1 .

- Western blot analysis of FUNDC1 in different tissues in Fundc1 fl/fl/Ucp1 cre− (Ucp1 Cre‐) and Fundc1 fl/fl/Ucp1 cre+ (Ucp1 Cre+) mice. BAT, brown adipose tissue; iWAT, inguinal white adipose tissue.
- Rates of O2 consumption (VO2) and CO2 production (VCO2) were measured in Fundc1 fl/fl/Ucp1 cre− (Cre−) and Fundc1 fl/fl/Ucp1 cre+ (Cre+) mice. Data information: n = 5 biological replicates, data are represented as the mean ± SEM.
- Respiratory exchange rate (RER) of Fundc1 fl/fl/Ucp1 cre− (Cre−) and Fundc1 fl/fl/Ucp cre+ (Cre+) mice. Data information: n = 5 biological replicates, data are represented as the mean ± SEM. Statistical analysis was performed using two‐tailed Student's t‐test. ns: no significant difference.
- Western blot analysis of FUNDC1 in different tissues in Fundc1 fl/fl/Adiponectin cre− (Adiponectin Cre−) and Fundc1 fl/fl/Adiponectin cre+ (Adiponectin Cre+) mice.
Figure 5. FUNDC1 is required for cold‐induced mitophagy in mouse BAT.
-
A, BBATs isolated from Fundc1 fl/fl/Ucp1 cre− (Cre−) and Fundc1 fl/fl/Ucp1 cre+ (Cre+) mice at 30°C or following 72 h at 4°C were analyzed by transmission electron microscopy. Representative images are shown, scale bar, 1 μm (A). The number of mitophagosomes per 100 mitochondria was counted and normalized (B). Data information: n = 3 biological replicates, data are represented as the mean ± SEM. Statistical analysis was performed using two‐way ANOVA test. ns: no significant difference; *P < 0.05.
-
C, DRepresentative fluorescence images of BAT sections from Fundc1 fl/fl/Adiponectin cre− (Cre−) and Fundc1 fl/fl/Adiponectin cre+ (Cre+) mito‐Keima mice at normal conditions (30°C) or 4°C for 72 h. Scale bar, 50 μm (C). Quantification of the ratio between red and green signals (D). Data information: n = 6 biological replicates, data are represented as the mean ± SEM. Statistical analysis was performed using two‐way ANOVA test. ns: no significant difference; *P < 0.05.
-
EFundc fl/fl/Ucp1 cre− (Cre−) and Fundc fl/fl/Ucp cre+ (Cre+) mice were maintained at 30°C (Normal) or exposed to 4°C for 72 h (Cold). Mitochondrial DNA copy numbers were analyzed by real‐time PCR and normalized to nuclear DNA standards. Data information: n = 6 biological replicates, data are represented as the mean ± SEM. Statistical analysis was performed using two‐way ANOVA test. ns: no significant difference; *P < 0.05.
-
FThe relative total mito‐keima signal (green signal ) in Fundc1 deficiency and control mito‐keima mice under normal condition or cold exposure were quantified and plotted. Data information: n = 6 biological replicates, data are represented as the mean ± SEM. Statistical analysis was performed using two‐way ANOVA test. ns: no significant difference; **P < 0.01.
-
GBATs isolated from Fundc1 fl/fl/Ucp1 cre− (Cre−) and Fundc1 fl/fl/Ucp1 cre+ (Cre+) at 30°C or following 72 h at 4°C were analyzed by transmission electron microscopy. The percent of mitochondria without cristae is shown in the histogram. Data information: n = 3 biological replicates, data are represented as the mean ± SEM. Statistical analysis was performed using two‐way ANOVA test. ns: no significant difference; *P < 0.05.
-
H, IOxygen consumption rate (OCR) (H) and mitochondrial superoxide (I) were measured in BAT from Fundc1 fl/fl/Ucp1 cre− (Cre−) and Fundc1 fl/fl/Ucp cre+ (Cre+) mice kept at 30°C or at 4°C for 72 h. Data information: n = 3 or 4 biological replicates, data are represented as the mean ± SEM. Statistical analysis was performed using two‐way ANOVA test. ns: no significant difference; *P < 0.05
Figure EV4. Ablation of Fundc1 suppresses mitochondrial biogenesis without affecting autophagy proteins.
-
A–DUcp1 Cre‐ and Ucp1 Cre+ mice were exposed to 4°C for 72 h and control mice were kept at 30°C. Autophagy‐related protein (A) and mitochondrial protein (C) levels were analyzed by Western blotting. Protein expression levels were quantified and normalized to tubulin and plotted (B, D). Data information: n = 6 biological replicates, data are represented as the mean ± SEM. Statistical analysis was performed using two‐way ANOVA test. ns: no significant difference; **P < 0.01; *** P < 0.001.
-
EWild‐type (WT) and Ucp1 Cre+ WT mice were exposed to 4°C for 72 h (Cold), and control mice were kept at 30°C (Normal). Western blotting analysis of UPC1 protein levels.
Figure EV5. FUNDC1‐dependent mitophagy controls mitochondrial quality.
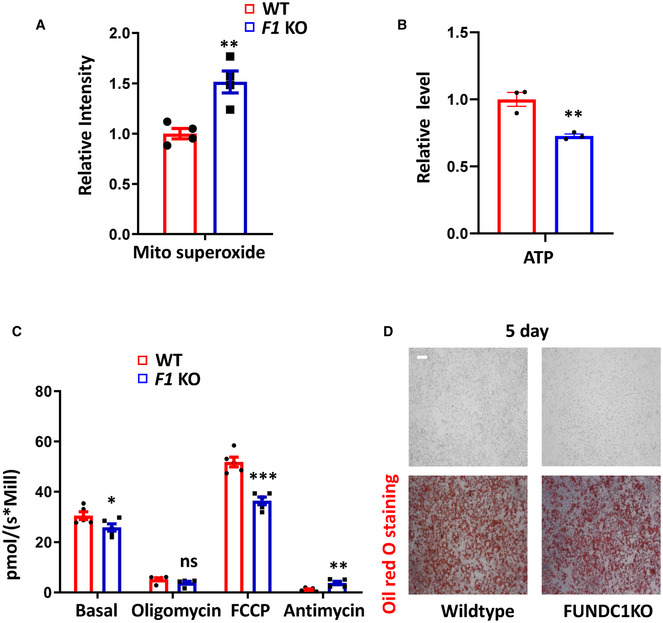
- Mitochondrial ROS levels were measured by Mito‐Sox staining in WT and Fundc1 knockout (F1 KO) brown fat preadipocytes. Data information: Experiments were repeated four times, and data are represented as the mean ± SEM. Statistical analysis was performed using two‐tailed Student's t‐test. **P < 0.01.
- ATP levels were measured with a luciferase assay kit in WT and Fundc1 KO preadipocytes. Data information: Experiments were repeated three times, and data are represented as the mean ± SEM. Statistical analysis was performed using two‐tailed Student's t‐test. **P < 0.01.
- OCR was measured in WT and Fundc1 KO preadipocytes. Data information: Experiments were repeated four times, and data are represented as the mean ± SEM. Statistical analysis was performed using two‐tailed Student's t‐test. *P < 0.05; **P < 0.01; ***P < 0.001.
- Oil red O staining analysis of wild‐type and Fundc1 KO brown fat cells after differentiation for 5 days, scale bar, 10 μm.
FUNDC1 regulates adaptive thermogenesis and contributes to cold tolerance
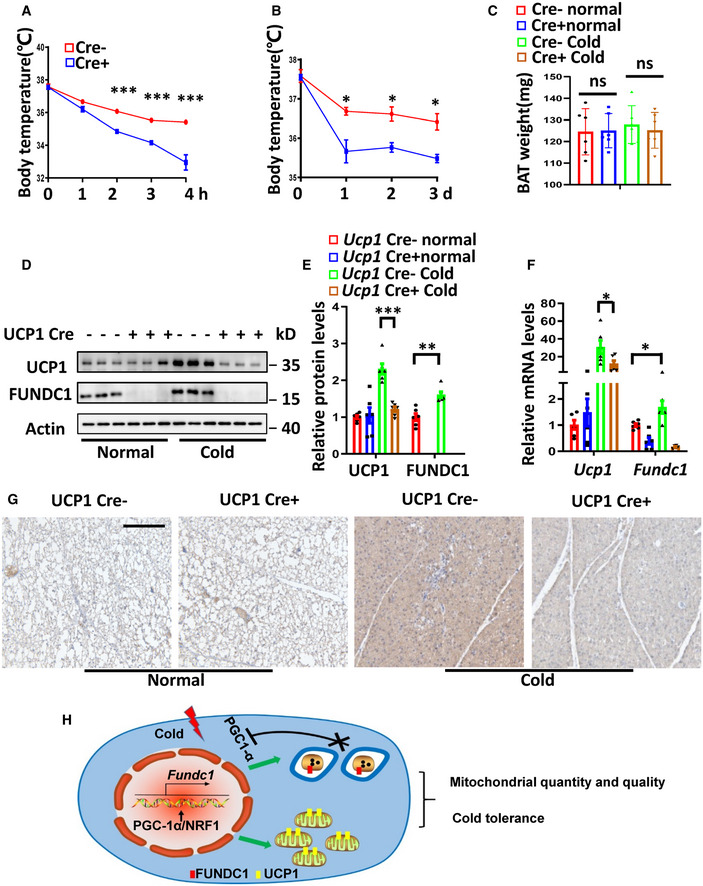
The increased mitochondrial biogenesis during cold acclimation creates a large capacity for oxidative phosphorylation, which can be used to generate heat through the action of the uncoupling protein UCP1. As FUNDC1‐regulated mitophagy affects both mitochondrial quality and mitochondrial turnover, leading to compromised mitochondrial respiration, we speculated that the thermogenic function of BAT might also be compromised in FUNDC1‐deficient mice. When Fundc1 fl/fl/Ucp1 cre− and Fundc1 fl/fl/Ucp1 cre+ mice were maintained at 30°C, there was no significant difference in their baseline body temperature (Fig 6A). However, when the mice were subjected to acute cold exposure (4°C for 4 h), we observed more severe hypothermia (body temperature < 33°C) in the Fundc1 fl/fl/Ucp1 cre+ mice than in the controls (Fig 6A). Furthermore, the body temperature of Fundc1 fl/fl/Ucp1 cre+ mice was lower than control mice after 72‐h cold acclimation, confirming the cold intolerance in Fundc1 fl/fl/Ucp1 cre+ mice (Fig 6B). There was no significant difference in the weight of BAT in Fundc1 fl/fl/Ucp1 cre− and Fundc1 fl/fl/Ucp1 cre+ mice in the presence or absence of cold exposure for 72 h (Fig 6C). The basal levels of Ucp1 mRNA and protein expression are similar between Fundc1 fl/fl/Ucp1 cre− and Fundc1 fl/fl/Ucp1 cre+ mice. However, the induction of Ucp1 mRNA and protein expression upon cold exposure is increased by 31‐fold and 2.3‐fold, respectively, in Fundc1 fl/fl/Ucp1 cre− BAT (Fig 6D–F). This induction is blunted (12‐fold and 1.2‐fold) in Fundc1 fl/fl/Ucp1 cre+ mice. The expression of Ucp1 Cre alone has no effect on the cold‐induced increase of UCP1 in Ucp1 cre+ mice (Fig EV4E). Immunohistochemical analysis further confirmed that the expression of UCP1 protein was strongly induced in control mice, and it was blunted in the BAT of Fundc1 fl/fl/Ucp1 cre+ mice upon cold exposure (Fig 6G). These results are consistent with the data above showing that mitochondrial biogenesis and quality are compromised (Fig 5), although the precise mechanism remains to be explored. Nevertheless, our data demonstrate that the protein level of FUNDC1 is regulated by PGC‐1α in an NRF1‐dependent manner, and FUNDC1 is essential for mitochondrial quality control in mitochondrial biogenesis. In Fundc1‐knockout BAT, both mitophagy and mitochondrial quality and mitochondrial biogenesis are impaired, leading to cold intolerance in mice (Fig 6H).
Figure 6. FUNDC1 regulates adaptive thermogenesis and contributes to cold tolerance.
-
ABody temperature measurements in Fundc1 fl/fl/Ucp1 cre− (Cre−) and Fundc1 fl/fl/Ucp1 cre+ (Cre+) fasting male mice before and during cold exposure (4°C) for the indicated time. Data information: n = 6 biological replicates, data are represented as the mean ± SEM. Statistical analysis was performed using repeated measures ANOVA. ***P < 0.001
-
B, CBody temperature (B) and BAT tissue weight (C) measurements before and after 72‐h cold exposure (4°C) of Cre− and Cre+ male mice. Data information: n = 6 biological replicates, data are represented as the mean ± SEM. Statistical analysis was performed using repeated measures ANOVA or two‐way ANOVA test. ns: no significant difference; *P < 0.05; ***P < 0.001.
-
D–FFundc1 fl/fl/Ucp cre− and Fundc1 fl/fl/Ucp1 cre+ mice were exposed to 4°C for 72 h (Cold), and control mice were kept at 30°C (Normal). Western blotting analysis of BAT protein levels (D). Protein expression levels were normalized to Actin (E). Levels of mRNAs encoding Fundc1 and Ucp1 were measured by real‐time PCR and normalized to Actb (F). Data information: n = 6 biological replicates, data are represented as the mean ± SEM. Statistical analysis was performed using two‐way ANOVA test. *P < 0.05; **P < 0.01; ***P < 0.001.
-
GRepresentative images of UCP1 immunohistochemistry of BAT sections from Cre− or Cre+ mice in normal conditions (30°C) or following 72 h at 4°C. Scale bar, 50 μm.
-
HSchematic model of PGC‐1α‐NRF1‐FUNDC1 axis in mitochondrial quality and quantity control and adaptive thermogenesis.
Discussion
Novel mechanism of coordination between mitophagy and biogenesis
It is well established that mitochondrial biogenesis is highly regulated through the PGC‐1α‐NRF1 pathway. Notably, PGC‐1α senses nutrimental, environmental, and developmental signals to activate NRF1 and other transcriptional factors to promote mitochondrial biogenesis and metabolic adaptations. It is widely speculated that PGC‐1α‐dependent mitochondrial biogenesis should be tightly coordinated with mitophagy to maintain an optimal number of high‐quality mitochondria, thus maintaining normal mitochondrial respiration, mitochondrial inheritance, and cellular functions (Kubli & Gustafsson, 2012; Palikaras & Tavernarakis, 2014). In the current study, we provide evidence to show that PGC‐1α/NRF1 transcriptionally regulate FUNDC1, a well‐characterized mitophagy receptor, to enhance mitophagy, and to promote mitochondrial turnover. It is somewhat surprising that PGC‐1α and NRF1, the master regulators of mitochondrial biogenesis, directly regulate a mitophagy receptor. Thus, our results suggest a novel mechanism that coordinates mitochondrial biogenesis and mitophagy. By accelerating mitophagy during mitochondrial biogenesis, PGC‐1α/NRF1 regulation of FUNDC1‐dependent mitophagy may prevent over‐burdening or over‐crowding of the cell with excessive mitochondria, thus maintaining normal mitochondrial and organismal physiology. Such a mechanism provides an ideal scenario for regulating mitochondrial turnover by simultaneously activating the two opposing processes to promote mitochondrial turnover and maintain the functional mitochondrial network. Enhanced turnover also accompanies FUNDC1 induction during preadipocyte differentiation. Similarly, mitophagy induced by both NIX and FUNDC1, but not Parkin, is found to reprogram the metabolic network during cardiomyocyte differentiation (Lampert et al, 2019). Simultaneous activation of mitophagy and mitochondrial biogenesis may also occur in many other conditions such as physical exercise and nutrient deprivation, as it is well documented that the AMPK and mTOR pathways regulate both PGC‐1α‐mediated mitochondrial biogenesis and mito(auto‐)phagy (Jager et al, 2007; Canto & Auwerx, 2009; Morita et al, 2013). Adipocyte AMPK is required for the adaptive response to thermogenesis and the browning program (Mottillo et al, 2016). We are not suggesting that PGC‐1α/NRF1 per se determine mitophagy, because the activity of PGC‐1α and its downstream events is mediated by an incredibly complicated network of transcriptional and post‐translational modifications. Also, as we previously suggested, FUNDC1 is subjected to phosphorylation and other modifications that determine its interaction with LC3 for mitophagy. For example, an early study has shown that cold stress also induces cAMP‐dependent activation of Src kinase (Fredriksson et al, 2000), and we have demonstrated that Src kinase phosphorylates FUNDC1 and prevents FUNDC1 interacting with LC3 (Liu et al, 2012). We argue that induction of FUNDC1 by PGC‐1α/NRF1 sets a new mitophagy threshold to maintain the mitochondrial network, and this is likely independent of PINK1 or Parkin activity (Liu et al, 2012; McWilliams et al, 2016; Whitworth & Pallanck, 2017; Lee et al, 2018; McWilliams et al, 2018). The regulation of mitochondrial homeostasis in mammalian systems appears to be different from that in C. elegans. In worms, which lack PGC‐1α, genetic depletion of DCT‐1, the homolog of mammalian BNIP3 and BNIP3L/NIX, induces oxidative stress that activates SKN‐1 (nuclear factor erythroid 2‐related factor 2), which is completely different from NRF1, to promote mitochondrial biogenesis (Palikaras et al, 2015b).
Mitophagy in BAT
It was previously suggested that to maintain the higher mitochondrial content in BAT for thermogenesis, auto(mito‐)phagy is strongly suppressed during cold stress‐induced mitochondrial biogenesis in BAT (Ferhat et al, 2019; Kim et al, 2019). Specifically, short‐term cold exposure of mice resulted in a significant reduction in the expression of autophagy genes in BAT, although thermogenic gene expression was elevated (Cairo et al, 2016). In response to cold or β3‐AR stimulation, PKA directly phosphorylates mTOR and its binding partner, regulatory‐associated protein of mTOR (RAPTOR), to stimulate the activity of mTORC1, a major regulator of autophagy (Stephan et al, 2009; Liu et al, 2016). PKA was shown to inhibit autophagy and mitophagy by modulating the expression of transcription factor genes or by inhibiting PINK1/Parkin‐mediated mitophagy via phosphorylation of the mitochondrial membrane protein mitofilin (Akabane et al, 2016). However, these findings are in sharp contrast with recent reports showing that cold exposure or administration of beta‐adrenergic agonists increases the level of autophagy and mitophagy (Lu et al, 2018). Our genetic, morphological, and biochemical evidence shows that physiological stimuli, such as cold, can activate mitophagy via FUNDC1, along with other ATG genes such as ATG5, LC3, and ULK1 (Fig 4A and Fig EV2F). We found that cold stress increased the expression of both FUNDC1 and LC3, induced the dephosphorylation of FUNDC1, and enhanced the FUNDC1‐LC3 interaction, thus promoting mitophagy (Liu et al, 2012; Chen et al, 2014). It should be noted that it is technically challenging to measure mitophagy or mitochondrial turnover in vivo under physiological conditions. Early studies used protein labeling and mitochondrial protein degradation to measure mitochondrial turnover (Miwa et al, 2008; Gospodarska et al, 2015). It is now recognized that mitochondrial proteins are subjected to incredibly complex regulation at the molecular, sub‐organellar, and organellar levels. Similarly, mitophagy can be mediated by a variety of mechanisms, such as those based on mitochondrial derived vesicles (MDVs), piecemeal mitophagy, or organellar mitophagy, that degrade mitochondria partly or wholly (Sugiura et al, 2014). mtDNA copy number has also been used to estimate mitochondrial content. It is thus not surprising that different measurements (of mRNA levels, mitochondrial proteins, and mtDNA copy number) yield discordant results. Given the complex regulation of all mitochondrial constituents, it is important to employ integrated approaches, both in vitro and in vivo, to show that mitophagy regulates the functional network of mitochondria. Based on such a comprehensive analysis, our data suggest that PGC‐1α/NRF1 transcriptionally regulate a number of genes including Fundc1 to dictate mitochondrial quantity, quality, and turnover, which are essential aspects of mitochondrial homeostasis.
How do enhanced mitophagy and turnover benefit BAT and organisms?
We further suggest that the coupling of mitochondrial biogenesis with FUNDC1‐dependent mitophagy contributes to adaptive thermogenesis. Activating mitophagy along with mitochondrial biogenesis will maintain mitochondrial health, which is vital for thermogenesis in BAT. Good‐quality mitochondria are essential for generating energy from carbohydrate in the form of pyruvate and fatty acids (for example, palmitoyl carnitine) (Cannon & Nedergaard, 2010). In unstressed conditions, mitochondrial homeostasis and mitochondrial functions, as reflected by oxygen consumption and thermogenesis, were largely maintained when Fundc1 was deleted, likely due to compensation by yet‐to‐be‐identified mechanisms. However, upon cold exposure, mitochondrial functions and the thermogenic gene program, including induction of the thermogenic gene Ucp1, were all compromised in brown fat tissue, and the BAT‐specific Fundc1 knockout mice were unable to maintain their body temperature. It is also interesting to note that under normal conditions, mtDNA copy numbers are comparable between control BAT and BAT in which Fundc1 is specifically knocked out (Fig 5). However, in response to cold stress, the mtDNA copy numbers are lower in Fundc1 knockout BAT, reflecting the possibility that mitochondrial biogenesis is reduced. It is likely that the absence of FUNDC1 slows down (if not completely shuts down) the removal of “old” or “exhausted” mitochondria, leading to compromised mitochondrial turnover, which exacerbates the impairments in mitochondrial functions, UCP1 expression, mitochondrial metabolism, and physiology. This mitophagy defect is further confounded with the possible feedback regulation of mitochondrial biogenesis by mitophagy, leading to compromised mitochondrial function, reduced mitochondrial number and turnover, and subsequently defective thermogenesis and cold intolerance. We have previously shown that mice lacking Fundc1 develop more severe obesity and insulin resistance when fed a high‐fat diet (HFD) (Wu et al, 2019), although mice with skeletal muscle‐specific ablation of Fundc1 were protected against high‐fat diet‐induced obesity with improved systemic insulin sensitivity and glucose tolerance despite reduced muscle mitochondrial bioenergetics (Fu et al, 2018). These results further demonstrate that FUNDC1‐dependent mitophagy plays a critical role in cold and metabolic adaptations. In contrast, Parkin is strongly repressed when BAT is activated and its induction is blunted during BAT thermogenesis (Cairo et al, 2019). It is suggested that Parkin‐dependent mitophagy plays a role in deacclimation (Cairo et al, 2019), the process by which cold‐adapted mice return to a thermoneutral temperature. It is possible that FUNDC1‐mediated mitophagy and Parkin‐mediated mitophagy play distinct roles under different stress conditions, such as acclimation versus deacclimation, to maintain mitochondrial functions and homeostasis as previously suggested (Wei et al, 2015). Further work is needed to dissect the cooperative mechanisms between distinct mitophagy machineries and the crosstalk between mitophagy and mitochondrial biogenesis. Our finding that FUNDC1‐dependent mitophagy is directly coupled with mitochondrial biogenesis offers a new understanding of the molecular regulation of mitochondrial turnover and metabolism in BAT. Our results further imply that enhancing PGC‐1α/NRF1 activity and FUNDC1‐dependent mitochondrial turnover may be a useful therapeutic approach to fight mitochondrial, metabolic, and aging‐related diseases.
Materials and Methods
Mice
Animal experiments were performed according to procedures approved by the Ethics Committee of the Institute of Zoology, Chinese Academy of Sciences. Fundc1 fl/fl mice and Adiponectin cre+ mice and C57BL/6J mice were obtained from the Model Animal Research Center of Nanjing University. Ucp1 cre+ mice were obtained from Jackson Laboratories (stock #024670). The brown adipocyte‐specific or adipocyte‐specific Fundc1 knockout mice were generated by crossing female Fundc1 fl/fl mice with corresponding Cre mice. Littermate male Fundc1 fl/fl Cre‐ mice were control mice. Male mito‐Keima Fundc1 knockout mice (Fundc1 fl/fl/Adiponectin cre+/mito‐Keima +) were generated by crossing female Fundc1 fl/fl/Adiponectin cre+ with male Fundc1 fl/Y/Adiponectin cre−/mito‐Keima + mice. All mice were housed at 30°C with a 12‐h light/12‐h dark cycle and given free access to water and food. The cold test experiment was performed by housing mice at 4°C for the indicated time, then measuring rectal body temperature.
Indirect calorimetry
Energy expenditure was evaluated by measuring oxygen consumption with a TSE Systems Indirect Gas Calorimetry system. The difference in CO2 and O2 concentrations was measured with CO2 and O2 sensors, and the respiratory exchange ratio (RER) was calculated using the VCO2/VO2 ratio. Mice were housed individually and maintained at 30°C under a 12‐h light/12‐h dark cycle. Food and water were available ad libitum.
Cell culture and transfection
Interscapular brown fat pads from fetal wild‐type or Fundc1 germline knockout mice were isolated rapidly and minced. The fat mince was digested with 1.5 mg/ml Collagenase A at 37°C with constant agitation for 40 min. Five milliliter DMEM medium supplemented with 20% FBS was added, and the cells were pelleted by centrifugation at 500 g for 10 min. Then, the preadipocyte suspension was filtered through a 100 μm filter, resuspended, and plated in a sterile Petri dish containing DMEM medium supplemented with 20% FBS. Preadipocytes were immortalized by infection with the retroviral vector pBabe encoding SV40 large T antigen and then selected with puromycin (1 μg/ml) for 7 days. Preadipocytes were grown to confluence in culture medium supplemented with 20 nM insulin and 1 nM T3 (differentiation medium; day 0). Brown adipocyte differentiation was induced by treating confluent cells for 48 h in differentiation medium further supplemented with 0.5 mM isobutylmethylxanthine, 0.5 mM dexamethasone, and 0.125 mM indomethacin. After this induction period (day 2), the medium was washed out and cells were incubated for a further 5 days in differentiation medium, which was changed every 2 days. Full differentiation was achieved after 5 days. PGC‐1α and PGC‐1β knockdown cell lines were generated using retroviral‐mediated expression of shRNA specific for PGC‐1α and PGC‐1β and scramble shRNA as a control. Infected cells were selected with puromycin (1 μg/ml) for 7 days. For adenoviral infections, preadipocytes were transduced overnight with GFP or PGC‐1α expression virus and cells were harvested after 48 h. All cells were grown in DMEM with 10% FBS and 1% penicillin–streptomycin at 37°C under 5% CO2. The target sequence in PGC‐1α for RNA interference is 5′‐GACGGATTGCCCTCATTTG; the target sequence in PGC‐1β is 5′‐CCTTCCAATATGTTTACGTTT; the target sequence in NRF1 is 5′‐CACATGGCTACCATAGAAG; and the scramble RNA interference sequence is 5′‐GACATTTGTAACGGGATTC. Primers for shRNA were cloned into pSuper‐retro‐puro or pSicoR vectors. ShRNA expression viruses were packaged by transfecting the vector into HEK‐293T cells. To establish stable cell lines, cells were transduced with the corresponding vectors and selected with puromycin or sorted by flow cytometry.
Antibodies and reagents
The following antibodies were used: anti‐TIM23 monoclonal antibody, anti‐Cytochrome c monoclonal antibody (BD Biosciences); anti‐PINK1 monoclonal antibody (Abgent), anti‐LC3B polyclonal antibody (MBL), anti‐Actin monoclonal antibody, anti‐UCP1 polyclonal antibody, anti‐Flag monoclonal antibody (Sigma); anti‐VDAC1 monoclonal antibody (Abcam); anti‐NRF1 polyclonal antibody (Santa Cruz); anti‐PGC‐1α polyclonal and monoclonal antibody (Merck); anti‐PGC‐1β polyclonal antibody (Proteintech); anti‐PARKIN polyclonal antibody, anti‐TFAM polyclonal antibody, anti‐ATG5 polyclonal antibody, anti‐ULK1 polyclonal antibody; and anti‐HSP60 polyclonal antibody, anti‐NIX polyclonal (CST). Polyclonal antibodies against FUNDC1 were generated by immunizing rabbits with recombinant FUNDC1 (delta TM domain) protein produced in Escherichia coli using PGEX4T1 expression vector. The fluorescent secondary antibodies were goat anti‐mouse IgG Cy3 and goat anti‐rabbit FITC IgG (DAKO).
The following reagents were used: TMRE , Mito‐SOX, EMSA/Gel Shift kit (Thermo Fisher); ATP detection kit, chromatin immunoprecipitation (CHIP) Assay kit (Beyotime); Dual‐Luciferase Reporter (DLR™) Assay System (Promega); and Tissue DNA extraction kit (Tiagene).
Real‐time PCR analysis
RNA was prepared using TRIzol Reagent (Invitrogen). The cDNA was synthesized using a cDNA synthesis kit (Takara). Real‐time PCR was carried out using a One Step qRT‐PCR (Probe) Kit (Tiangen) and a CFX96 real‐time PCR detection system (Bio‐Rad). Relative abundance of mRNA was calculated after normalization to Actb expression.
For real‐time PCR, primers were as follows:
| Fundc1 | 5′‐AGACACCACTGGTGGAATCGAG (F) |
| 5′‐CCTTCTGGAATAAAAATCCTGCAC(R) | |
| PARKIN | 5′‐TGTCCCAACTCCCTGATTAAAG (F) |
| 5′‐ACAGCACACCTCCCATTTG (R) | |
| PINK1 | 5′‐CGACAACATCCTTGTGGAGTGG (F) |
| 5′‐CATTGCCACCACGCTCTACACT (R) | |
| TFAM | 5′‐GAGGCAAAGGATGATTCGGCTC (F) |
| 5′‐CGAATCCTATCATCTTTAGCAAGC (R) | |
| PGC‐1α | 5′‐CCCTGCCATTGTTAAGACC (F) |
| 5′‐TGCTGCTGTTCCTGTTTTC (R) | |
| NRF1 | 5′‐GGCAACAGTAGCCACATTGGCT (F) |
| 5′‐GTCTGGATGGTCATTTCACCGC (R) | |
| Tim23 | 5′‐GGTGCAGAAGATGACCTCAACAC (F) |
| 5′‐GCATAGAGACTGGTGAGTGTCAG (R) | |
| HSP60 | 5′‐TGCTCATCGGAAGCCATTGGTC (F) |
| 5′‐TTGACTGCCACAACCTGAAGACC (R) | |
| VDAC1 | 5′‐ AGTGACCCAGAGCAACTTCGCA (F) |
| 5′‐CAGGCGAGATTGACAGCAGTCT (R) | |
| Nix | 5′‐GCATGAGGAAGAGTGGAGCCAT (F) |
| 5′‐AAGGTGTGCTCAGTCGTTTTCCA (R) | |
| UCP1 | 5′‐ GCTTTGCCTCACTCAGGATTGG (F) |
| 5′‐CCAATGAACACTGCCACACCTC (R) | |
| CYCS | 5′‐GAGGCAAGCATAAGACTGGACC (F) |
| 5′‐ACTCCATCAGGGTATCCTCTCC (R) | |
| LC3B | 5′‐GTCCTGGACAAGACCAAGTTCC (F) |
| 5′‐CCATTCACCAGGAGGAAGAAGG (R) | |
| Atg5 | 5′‐CTTGCATCAAGTTCAGCTCTTCC (F) |
| 5′‐AAGTGAGCCTCAACCGCATCCT (R) | |
| ULK1 | 5′‐GCAGCAAAGACTCCTGTGACAC (F) |
| 5′‐CCACTACACAGCAGGCTATCAG (R) | |
| Actb | 5′‐GGCGCTTTTGACTCAGGATT (F) |
| 5′‐GGGATGTTTGCTCCAACCAA (R) |
Transmission electron microscopy (TEM)
BAT was freshly isolated from the indicated mice and then cut into small pieces (1 mm3) in 2.5% glutaraldehyde. The samples were fixed at 37°C in 2.5% glutaraldehyde for 1 h, then dehydrated in a graded series of ethanol, and embedded in Epon 812 resin. Ultrathin sections were cut and observed under a Tecnai G2 F20 TWIN TMP EM. The electron micrographs were captured at 5,000× magnification, and the numbers of mitophagosomes were counted and normalized. The data are presented as number of mitophagosomes per 100 mitochondria. The numbers of mitochondria without cristae and normal mitochondria were counted, and the percentage of mitochondria without cristae was calculated. For each animal, at least 20 micrographs were captured.
SDS–PAGE and Western blotting
Cells or homogenized tissue were lysed in lysis buffer (20 mM Tris, pH 7.4, 2 mM EGTA, 1% NP‐40, protease inhibitors). The total protein concentration was determined by the Bradford method. Equivalent protein quantities were subjected to SDS–PAGE and transferred to nitrocellulose membranes. Membranes were probed with the corresponding primary antibodies, followed by the appropriate HRP‐conjugated secondary antibodies (KPL). Immunoreactive bands were visualized with a chemiluminescence kit (Pierce) and quantified by Image J software.
Mito‐superoxide measurement
Cells were harvested, resuspended in PBS containing 5 μM mitochondrial superoxide indicator Mito‐SOX, and stained for 30 min at 37°C in the dark. The cells were then washed with ice‐cold PBS twice and analyzed with flow cytometry.
ATP measurement
ATP levels in cultured cells and fresh tissues were measured using an ATP determination kit following the manufacturer's protocol (Beyotime Biotechnology). Briefly, 106 cells or 10 mg homogenized fresh tissues were lysed. After centrifugation at 13,000 g for 15 min, the supernatant was collected and the protein concentration was determined. Equivalent amounts of supernatants were used for measurement, and luminescence was recorded by an illuminometer. The relative ATP level was normalized by calculating the ratios between the luminescence intensities of the corresponding proteins with control samples.
Measurement of mitochondrial oxygen consumption rate
Freshly isolated BAT was weighed, and 5 mg of tissue was homogenized in respiration medium B (0.5 mM EGTA, 3 mM MgCl2.6H2O, 20 mM taurine, 10 mM KH2P04, 20 mM HEPES, 0.1% BSA, 60 mM potassium lactobionate, 110 mM mannitol, 0.3 mM dithiothreitol, pH 7.1) with succinate as the substrate. Uncoupled and maximal OCR were determined using oligomycin (10 μM) and FCCP (10 μM). For measurement of OCR in cells, the cells were harvested and resuspended in assay buffer (50 mM KCl, 4 mM KH2PO4, 5 mM HEPES, 1 mM EGTA, 4% BSA, 10 mM pyruvate, 5 mM malate). Uncoupled and maximal OCR were determined using oligomycin (10 μM) and FCCP (10 μM). Antimycin A was used to inhibit Complex III‐related respiration. OCR in homogenized tissue and cells was determined using an Oxygraph 2K. The OCR was finally standardized to the cell number or tissue weight.
Measurement of mitochondrial DNA copy number
Total DNA was extracted from freshly isolated tissues with a tissue DNA extraction kit. Ten nanogram DNA from each sample was used to quantify the mitochondrial DNA copy number by real‐time PCR. The mtDNA quantity was corrected by simultaneous measurement of nuclear DNA standards. The primers were published previously (Vernia et al, 2014). Primers for mtDNA were CytBF 5′‐ATTCCTTCATGTCGGACGAG, CytBR 5′‐ACTGAGAAGCCCCCTCAAAT, and the primers for nuclear DNA were H19F 5′‐GTCCACGAGACCAATGACTG, H19R 5′‐GTACCCACCTGTCGTCC.
Mito‐Keima assay
For mito‐Keima assays in tissues, brown adipose tissues were rapidly isolated and cut into small pieces (100 mm3). The tissue pieces were placed in confocal dishes, and images were captured with a Nikon confocal microscope. Mito‐Keima fluorescence was captured in two channels via two sequential excitations (488‐nm, green; 561‐nm, red) using the same 620‐nm emission. The mito‐Keima fluorescent signal from 561‐nm laser excitation was depicted in red, and the signal from 488‐nm laser excitation was in green. The fluorescence intensities of 561‐nm and 488‐nm excited Mito‐Keima signals were measured by Image J software, and the 561‐nm:488‐nm ratios were calculated.
Immunohistochemistry
Fresh fat tissues were rapidly isolated, fixed with 4% paraformaldehyde in phosphate‐buffered saline (PBS), and embedded in paraffin. The fixed fat samples were sectioned at thicknesses of 5–10 μm. The samples were then stained with the indicated primary antibody overnight and with the secondary antibody for 30 min at room temperature (RT). Images were captured by a Vectra Automated Quantitative Pathology Imaging System.
Electrophoretic mobility shift assay
The following biotin‐labeled NRF1 oligonucleotides and NRF1 binding domain mutant oligonucleotides were used. F1 5′‐TTTCGCGCCTGCGCAGAAGG (F) and 5′‐GCCTTCTGCGCAGGCGCGAA. (R); Mut F1 5′‐TTTCGCGGCATTCCAGAAGG (F) and 5′‐GCCTTCTGGAATGCCGCGAA (R). The positive control oligonucleotides were TCGCGCGCCTGCGCATCCAG (F) and 5′‐GCTGGATGCGCAGGCGCGCG (R). The competitor‐mutant oligonucleotides were 5′‐TTTCGCGGCATTCCAGAAGG (F) and 5′‐GCCTTCTGGAATGCCGCGAA (R). Equal amounts of the forward and reverse oligonucleotides were annealed. DNA binding was performed at RT for 20 min in a mixture containing 10 μg of nuclear extract, 5 × gel shift binding buffer, and 1 μl of biotin‐labeled probe. In the competition experiment, 100 × unlabeled double‐stranded oligonucleotides were used and incubated with nuclear extract and binding buffer for 10 min following addition of biotin‐labeled probe for 20 min at RT. In super‐shift assays, the NRF1 antibody was also incubated with the reaction mixture at RT for 30 min before the addition of the biotin‐labeled probe. Finally, the reaction mixtures were mixed with 10 × loading buffer and analyzed on a 4% DNA retardation gel at 10 V/cm on ice for 1.5 h.
Chromatin immunoprecipitation
Proteins were cross‐linked to DNA by incubating 5 × 10⁶ cells with 1% formaldehyde for 10 min at 37°C. The cell pellets were resuspended in 200 μl SDS lysis buffer followed by DNA sonication for a total of five times (10 s each time at 30% of maximal power) using an Ultrasonic Processor. Immunocomplexes were captured from the rest of the lysates with 2 μg of the corresponding antibodies. PCR was performed using 1% of the immunoprecipitate. Primers for the Fundc1 promoter were: 5′‐GAAGGCAACGGACTACAA (F), 5′‐GATGGAAGTCTATGGTCTCTT (R). The following PCR program was used: 95°C for 5 min followed by 35 cycles of 95°C for 30 s, 56°C for 30 s, 72°C for 30 s, and finally 72°C for 10 min.
Statistical analysis
Statistical analysis was performed using Student's t‐test or ANOVA test. P < 0.05 was considered statistically significant. *P < 0.05, **P < 0.01, and ***P < 0.001 versus the corresponding controls are indicated. All statistical calculations were performed with GraphPad Prism and SPSS software.
Author contributions
LL and QC designed the experiments. LL, QC, XL, and ZY wrote and revised the manuscript. LL performed most of the experiments with the help of YL, JW, DZ, HW, WL, HW, NT, YF, and YL. XP provided mito‐keima mice. XW and JW provided technical support for the project. All authors provided intellectual input and read the manuscript.
Conflict of interest
The authors declare that they have no conflict of interest.
Supporting information
Expanded View Figures PDF
Review Process File
Source Data for Expanded View
Acknowledgements
We wish to thank Professor Shengcai Lin from Xiamen University and Professor Xiangdong Fu from UCSD for their critical comments on the manuscript and also Isabel Hanson for her English editing. We thank Dr. Yiguo Wang from Tsinghua University for providing the PGC‐1α and control GFP adenoviruses. We wish to thank Dr. Wanzhu Jin and Dr. Hanlin Zhang from the Institute of Zoology for their assistance with mouse temperature measurements. We wish to thank Dr. Guo‐peng Wang from the Core Facilities at the School of Life Sciences, Peking University, as well as Yinzi Ma and Pengyan Xia from the Electron Microscope Center, State Key Laboratory of Membrane Biology, Institute of Zoology, for their assistance with transmission electron microscopy work. This research was supported by the National Natural Science Foundation of China (31790404, 91849201, 91854105, 31671446, 31520203904) and Grants 2019YFA0508601 and 2016YFA0500201 from the Ministry of Science and Technology of China.
EMBO reports (2021) 22: e50629
Contributor Information
Lei Liu, Email: liulei@ioz.ac.cn.
Quan Chen, Email: chenq@nankai.edu.cn, Email: chenq@ioz.ac.cn.
Data availability
This study includes no data deposited in external repositories.
References
- Akabane S, Uno M, Tani N, Shimazaki S, Ebara N, Kato H, Kosako H, Oka T (2016) PKA regulates PINK1 stability and parkin recruitment to damaged mitochondria through phosphorylation of MIC60. Mol Cell 62: 371–384 [DOI] [PubMed] [Google Scholar]
- Altshuler‐Keylin S, Kajimura S (2017) Mitochondrial homeostasis in adipose tissue remodeling. Sci Signal 10: eaai9248 [DOI] [PMC free article] [PubMed] [Google Scholar]
- Anderson RM, Barger JL, Edwards MG, Braun KH, O'Connor CE, Prolla TA, Weindruch R (2008) Dynamic regulation of PGC‐1alpha localization and turnover implicates mitochondrial adaptation in calorie restriction and the stress response. Aging Cell 7: 101–111 [DOI] [PMC free article] [PubMed] [Google Scholar]
- Aquilano K, Vigilanza P, Baldelli S, Pagliei B, Rotilio G, Ciriolo MR (2010) Peroxisome proliferator‐activated receptor gamma co‐activator 1alpha (PGC‐1alpha) and sirtuin 1 (SIRT1) reside in mitochondria: possible direct function in mitochondrial biogenesis. J Biol Chem 285: 21590–21599 [DOI] [PMC free article] [PubMed] [Google Scholar]
- Artal‐Sanz M, Tavernarakis N (2009) Prohibitin couples diapause signalling to mitochondrial metabolism during ageing in C. elegans . Nature 461: 793–797 [DOI] [PubMed] [Google Scholar]
- Ashrafi G, Schwarz TL (2013) The pathways of mitophagy for quality control and clearance of mitochondria. Cell Death Differ 20: 31–42 [DOI] [PMC free article] [PubMed] [Google Scholar]
- Barbera MJ, Schluter A, Pedraza N, Iglesias R, Villarroya F, Giralt M (2001) Peroxisome proliferator‐activated receptor alpha activates transcription of the brown fat uncoupling protein‐1 gene. A link between regulation of the thermogenic and lipid oxidation pathways in the brown fat cell. J Biol Chem 276: 1486–1493 [DOI] [PubMed] [Google Scholar]
- Bhujabal Z, Birgisdottir AB, Sjottem E, Brenne HB, Overvatn A, Habisov S, Kirkin V, Lamark T, Johansen T (2017) FKBP8 recruits LC3A to mediate Parkin‐independent mitophagy. EMBO Rep 18: 947–961 [DOI] [PMC free article] [PubMed] [Google Scholar]
- Birkenfeld AL, Lee HY, Guebre‐Egziabher F, Alves TC, Jurczak MJ, Jornayvaz FR, Zhang D, Hsiao JJ, Martin‐Montalvo A, Fischer‐Rosinsky A et al (2011) Deletion of the mammalian INDY homolog mimics aspects of dietary restriction and protects against adiposity and insulin resistance in mice. Cell Metab 14: 184–195 [DOI] [PMC free article] [PubMed] [Google Scholar]
- Cairo M, Villarroya J, Cereijo R, Campderros L, Giralt M, Villarroya F (2016) Thermogenic activation represses autophagy in brown adipose tissue. Int J Obes (Lond) 40: 1591–1599 [DOI] [PubMed] [Google Scholar]
- Cairo M, Campderros L, Gavalda‐Navarro A, Cereijo R, Delgado‐Angles A, Quesada‐Lopez T, Giralt M, Villarroya J, Villarroya F (2019) Parkin controls brown adipose tissue plasticity in response to adaptive thermogenesis. EMBO Rep 20: e46832 [DOI] [PMC free article] [PubMed] [Google Scholar]
- Cannon B, Nedergaard J (2004) Brown adipose tissue: function and physiological significance. Physiol Rev 84: 277–359 [DOI] [PubMed] [Google Scholar]
- Cannon B, Nedergaard J (2010) Metabolic consequences of the presence or absence of the thermogenic capacity of brown adipose tissue in mice (and probably in humans). Int J Obes (Lond) 34(Suppl 1): S7–S16 [DOI] [PubMed] [Google Scholar]
- Canto C, Auwerx J (2009) PGC‐1 alpha, SIRT1 and AMPK, an energy sensing network that controls energy expenditure. Curr Opin Lipidol 20: 98–105 [DOI] [PMC free article] [PubMed] [Google Scholar]
- Chen CT, Hsu SH, Wei YH (2012) Mitochondrial bioenergetic function and metabolic plasticity in stem cell differentiation and cellular reprogramming. Biochim Biophys Acta 1820: 571–576 [DOI] [PubMed] [Google Scholar]
- Chen G, Han Z, Feng D, Chen Y, Chen L, Wu H, Huang L, Zhou C, Cai X, Fu C et al (2014) A regulatory signaling loop comprising the PGAM5 phosphatase and CK2 controls receptor‐mediated mitophagy. Mol Cell 54: 362–377 [DOI] [PubMed] [Google Scholar]
- Corti O, Brice A (2013) Mitochondrial quality control turns out to be the principal suspect in parkin and PINK1‐related autosomal recessive Parkinson's disease. Curr Opin Neurobiol 23: 100–108 [DOI] [PubMed] [Google Scholar]
- Dagda RK, Zhu J, Kulich SM, Chu CT (2008) Mitochondrially localized ERK2 regulates mitophagy and autophagic cell stress: implications for Parkinson's disease. Autophagy 4: 770–782 [DOI] [PMC free article] [PubMed] [Google Scholar]
- del Mar Gonzalez‐Barroso G‐B, Pecqueur C, Gelly C, Sanchis D, Alves‐Guerra MC, Bouillaud F, Ricquier D, Cassard‐Doulcier AM (2000) Transcriptional activation of the human ucp1 gene in a rodent cell line. Synergism of retinoids, isoproterenol, and thiazolidinedione is mediated by a multipartite response element. J Biol Chem 275: 31722–31732 [DOI] [PubMed] [Google Scholar]
- Diaz F, Moraes CT (2008) Mitochondrial biogenesis and turnover. Cell Calcium 44: 24–35 [DOI] [PMC free article] [PubMed] [Google Scholar]
- Dominy JE, Puigserver P (2013) Mitochondrial biogenesis through activation of nuclear signaling proteins. Cold Spring Harb Perspect Biol 5: a015008 [DOI] [PMC free article] [PubMed] [Google Scholar]
- Dorn GW 2nd (2010) Mitochondrial pruning by Nix and BNip3: an essential function for cardiac‐expressed death factors. J Cardiovasc Transl Res 3: 374–383 [DOI] [PMC free article] [PubMed] [Google Scholar]
- Dorn GW 2nd, Vega RB, Kelly DP (2015) Mitochondrial biogenesis and dynamics in the developing and diseased heart. Genes Dev 29: 1981–1991 [DOI] [PMC free article] [PubMed] [Google Scholar]
- Drake JC, Laker RC, Wilson RJ, Zhang M, Yan Z (2019) Exercise‐induced mitophagy in skeletal muscle occurs in the absence of stabilization of Pink1 on mitochondria. Cell Cycle 18: 1–6 [DOI] [PMC free article] [PubMed] [Google Scholar]
- Fan W, Evans R (2015) PPARs and ERRs: molecular mediators of mitochondrial metabolism. Curr Opin Cell Biol 33: 49–54 [DOI] [PMC free article] [PubMed] [Google Scholar]
- Ferhat M, Funai K, Boudina S (2019) Autophagy in adipose tissue physiology and pathophysiology. Antioxid Redox Signal 31: 487–501 [DOI] [PMC free article] [PubMed] [Google Scholar]
- Fernandez‐Marcos PJ, Auwerx J (2011) Regulation of PGC‐1alpha, a nodal regulator of mitochondrial biogenesis. Am J Clin Nutr 93: 884S–890 [DOI] [PMC free article] [PubMed] [Google Scholar]
- Fredriksson JM, Lindquist JM, Bronnikov GE, Nedergaard J (2000) Norepinephrine induces vascular endothelial growth factor gene expression in brown adipocytes through a beta ‐adrenoreceptor/cAMP/protein kinase A pathway involving Src but independently of Erk1/2. J Biol Chem 275: 13802–13811 [DOI] [PubMed] [Google Scholar]
- Fu J, Zhang J, Jin F, Patchefsky J, Braunewell KH, Klein‐Szanto AJ (2009) Promoter regulation of the visinin‐like subfamily of neuronal calcium sensor proteins by nuclear respiratory factor‐1. J Biol Chem 284: 27577–27586 [DOI] [PMC free article] [PubMed] [Google Scholar]
- Fu T, Xu Z, Liu L, Guo Q, Wu H, Liang X, Zhou D, Xiao L, Liu L, Liu Y et al (2018) Mitophagy directs muscle‐adipose crosstalk to alleviate dietary obesity. Cell Rep 23: 1357–1372 [DOI] [PubMed] [Google Scholar]
- Gospodarska E, Nowialis P, Kozak LP (2015) Mitochondrial turnover: a phenotype distinguishing brown adipocytes from interscapular brown adipose tissue and white adipose tissue. J Biol Chem 290: 8243–8255 [DOI] [PMC free article] [PubMed] [Google Scholar]
- Gottlieb RA, Carreira RS (2010) Autophagy in health and disease. 5. Mitophagy as a way of life. Am J Physiol Cell Physiol 299: C203–C210 [DOI] [PMC free article] [PubMed] [Google Scholar]
- Gottlieb RA, Gustafsson AB (2011) Mitochondrial turnover in the heart. Biochim Biophys Acta 1813: 1295–1301 [DOI] [PMC free article] [PubMed] [Google Scholar]
- Gottlieb RA, Pourpirali S (2016) Lost in translation: miRNAs and mRNAs in ischemic preconditioning and ischemia/reperfusion injury. J Mol Cell Cardiol 95: 70–77 [DOI] [PMC free article] [PubMed] [Google Scholar]
- Gottlieb RA, Thomas A (2017) Mitophagy and mitochondrial quality control mechanisms in the heart. Curr Pathobiol Rep 5: 161–169 [DOI] [PMC free article] [PubMed] [Google Scholar]
- Greene AW, Grenier K, Aguileta MA, Muise S, Farazifard R, Haque ME, McBride HM, Park DS, Fon EA (2012) Mitochondrial processing peptidase regulates PINK1 processing, import and Parkin recruitment. EMBO Rep 13: 378–385 [DOI] [PMC free article] [PubMed] [Google Scholar]
- He C, Klionsky DJ (2009) Regulation mechanisms and signaling pathways of autophagy. Annu Rev Genet 43: 67–93 [DOI] [PMC free article] [PubMed] [Google Scholar]
- Hickson‐Bick DL, Jones C, Buja LM (2008) Stimulation of mitochondrial biogenesis and autophagy by lipopolysaccharide in the neonatal rat cardiomyocyte protects against programmed cell death. J Mol Cell Cardiol 44: 411–418 [DOI] [PubMed] [Google Scholar]
- Huo L, Scarpulla RC (2001) Mitochondrial DNA instability and peri‐implantation lethality associated with targeted disruption of nuclear respiratory factor 1 in mice. Mol Cell Biol 21: 644–654 [DOI] [PMC free article] [PubMed] [Google Scholar]
- Jacobsson A, Cannon B, Nedergaard J (1987) Physiological activation of brown adipose tissue destabilizes thermogenin mRNA. FEBS Lett 224: 353–356 [DOI] [PubMed] [Google Scholar]
- Jager S, Handschin C, St‐Pierre J, Spiegelman BM (2007) AMP‐activated protein kinase (AMPK) action in skeletal muscle via direct phosphorylation of PGC‐1alpha. Proc Natl Acad Sci USA 104: 12017–12022 [DOI] [PMC free article] [PubMed] [Google Scholar]
- Jin SM, Lazarou M, Wang C, Kane LA, Narendra DP, Youle RJ (2010) Mitochondrial membrane potential regulates PINK1 import and proteolytic destabilization by PARL. J Cell Biol 191: 933–942 [DOI] [PMC free article] [PubMed] [Google Scholar]
- Kabeya Y, Mizushima N, Ueno T, Yamamoto A, Kirisako T, Noda T, Kominami E, Ohsumi Y, Yoshimori T (2000) LC3, a mammalian homologue of yeast Apg8p, is localized in autophagosome membranes after processing. EMBO J 19: 5720–5728 [DOI] [PMC free article] [PubMed] [Google Scholar]
- Kaeberlein M (2010) Lessons on longevity from budding yeast. Nature 464: 513–519 [DOI] [PMC free article] [PubMed] [Google Scholar]
- Kelly DP, Scarpulla RC (2004) Transcriptional regulatory circuits controlling mitochondrial biogenesis and function. Genes Dev 18: 357–368 [DOI] [PubMed] [Google Scholar]
- Kim D, Kim JH, Kang YH, Kim JS, Yun SC, Kang SW, Song Y (2019) Suppression of brown adipocyte autophagy improves energy metabolism by regulating mitochondrial turnover. Int J Mol Sci 20: 3520 [DOI] [PMC free article] [PubMed] [Google Scholar]
- Kong X, Banks A, Liu T, Kazak L, Rao RR, Cohen P, Wang X, Yu S, Lo JC, Tseng YH et al (2014) IRF4 is a key thermogenic transcriptional partner of PGC‐1alpha. Cell 158: 69–83 [DOI] [PMC free article] [PubMed] [Google Scholar]
- Kubli DA, Gustafsson AB (2012) Mitochondria and mitophagy: the yin and yang of cell death control. Circ Res 111: 1208–1221 [DOI] [PMC free article] [PubMed] [Google Scholar]
- Kundu M, Lindsten T, Yang CY, Wu JM, Zhao FP, Zhang J, Selak MA, Ney PA, Thompson CB (2008) Ulk1 plays a critical role in the autophagic clearance of mitochondria and ribosomes during reticulocyte maturation. Blood 112: 1493–1502 [DOI] [PMC free article] [PubMed] [Google Scholar]
- Laker RC, Drake JC, Wilson RJ, Lira VA, Lewellen BM, Ryall KA, Fisher CC, Zhang M, Saucerman JJ, Goodyear LJ et al (2017) Ampk phosphorylation of Ulk1 is required for targeting of mitochondria to lysosomes in exercise‐induced mitophagy. Nat Commun 8: 548 [DOI] [PMC free article] [PubMed] [Google Scholar]
- Lampert MA, Orogo AM, Najor RH, Hammerling BC, Leon LJ, Wang BJ, Kim T, Sussman MA, Gustafsson AB (2019) BNIP3L/NIX and FUNDC1‐mediated mitophagy is required for mitochondrial network remodeling during cardiac progenitor cell differentiation. Autophagy 15: 1182–1198 [DOI] [PMC free article] [PubMed] [Google Scholar]
- Lee JJ, Sanchez‐Martinez A, Zarate AM, Beninca C, Mayor U, Clague MJ, Whitworth AJ (2018) Basal mitophagy is widespread in Drosophila but minimally affected by loss of Pink1 or parkin. J Cell Biol 217: 1613–1622 [DOI] [PMC free article] [PubMed] [Google Scholar]
- Leone TC, Lehman JJ, Finck BN, Schaeffer PJ, Wende AR, Boudina S, Courtois M, Wozniak DF, Sambandam N, Bernal‐Mizrachi C et al (2005) PGC‐1alpha deficiency causes multi‐system energy metabolic derangements: muscle dysfunction, abnormal weight control and hepatic steatosis. PLoS Biol 3: e101 [DOI] [PMC free article] [PubMed] [Google Scholar]
- Li W, Li Y, Siraj S, Jin H, Fan Y, Yang X, Huang X, Wang X, Wang J, Liu L et al (2019) FUN14 domain‐containing 1‐mediated mitophagy suppresses hepatocarcinogenesis by inhibition of inflammasome activation in mice. Hepatology 69: 604–621 [DOI] [PubMed] [Google Scholar]
- Lin J, Wu PH, Tarr PT, Lindenberg KS, St‐Pierre J, Zhang CY, Mootha VK, Jager S, Vianna CR, Reznick RM et al (2004) Defects in adaptive energy metabolism with CNS‐linked hyperactivity in PGC‐1alpha null mice. Cell 119: 121–135 [DOI] [PubMed] [Google Scholar]
- Liu L, Feng D, Chen G, Chen M, Zheng Q, Song P, Ma Q, Zhu C, Wang R, Qi W et al (2012) Mitochondrial outer‐membrane protein FUNDC1 mediates hypoxia‐induced mitophagy in mammalian cells. Nat Cell Biol 14: 177–185 [DOI] [PubMed] [Google Scholar]
- Liu L, Sakakibara K, Chen Q, Okamoto K (2014) Receptor‐mediated mitophagy in yeast and mammalian systems. Cell Res 24: 787–795 [DOI] [PMC free article] [PubMed] [Google Scholar]
- Liu D, Bordicchia M, Zhang C, Fang H, Wei W, Li JL, Guilherme A, Guntur K, Czech MP, Collins S (2016) Activation of mTORC1 is essential for beta‐adrenergic stimulation of adipose browning. J Clin Invest 126: 1704–1716 [DOI] [PMC free article] [PubMed] [Google Scholar]
- Lowell BB, Spiegelman BM (2000) Towards a molecular understanding of adaptive thermogenesis. Nature 404: 652–660 [DOI] [PubMed] [Google Scholar]
- Lu Y, Fujioka H, Joshi D, Li Q, Sangwung P, Hsieh P, Zhu J, Torio J, Sweet D, Wang L et al (2018) Mitophagy is required for brown adipose tissue mitochondrial homeostasis during cold challenge. Sci Rep 8: 8251 [DOI] [PMC free article] [PubMed] [Google Scholar]
- Manfredi LH, Ang J, Peker N, Dagda RK, McFarlane C (2019) G protein‐coupled receptor kinase 2 regulates mitochondrial bioenergetics and impairs myostatin‐mediated autophagy in muscle cells. Am J Physiol Cell Physiol 317: C674–C686 [DOI] [PMC free article] [PubMed] [Google Scholar]
- Martinez‐Lopez N, Garcia‐Macia M, Sahu S, Athonvarangkul D, Liebling E, Merlo P, Cecconi F, Schwartz GJ, Singh R (2016) Autophagy in the CNS and periphery coordinate lipophagy and lipolysis in the brown adipose tissue and liver. Cell Metab 23: 113–127 [DOI] [PMC free article] [PubMed] [Google Scholar]
- McWilliams TG, Prescott AR, Allen GFG, Tamjar J, Munson MJ, Thomson C, Muqit MMK, Ganley IG (2016) mito‐QC illuminates mitophagy and mitochondrial architecture in vivo . J Cell Biol 214: 333–345 [DOI] [PMC free article] [PubMed] [Google Scholar]
- McWilliams TG, Muqit MMK (2017) PINK1 and Parkin: emerging themes in mitochondrial homeostasis. Curr Opin Cell Biol 45: 83–91 [DOI] [PubMed] [Google Scholar]
- McWilliams TG, Prescott AR, Montava‐Garriga L, Ball G, Singh F, Barini E, Muqit MMK, Brooks SP, Ganley IG (2018) Basal mitophagy occurs independently of PINK1 in mouse tissues of high metabolic demand. Cell Metab 27: 439–449 [DOI] [PMC free article] [PubMed] [Google Scholar]
- Memme JM, Erlich AT, Phukan G, Hood DA (2019) Exercise and mitochondrial health. J Physiol 10.1113/JP278853 [DOI] [PubMed] [Google Scholar]
- Miller KN, Clark JP, Anderson RM (2019) Mitochondrial regulator PGC‐1a‐modulating the modulator. Curr Opin Endocr Metab Res 5: 37–44 [DOI] [PMC free article] [PubMed] [Google Scholar]
- Miwa S, Lawless C, von Zglinicki T (2008) Mitochondrial turnover in liver is fast in vivo and is accelerated by dietary restriction: application of a simple dynamic model. Aging Cell 7: 920–923 [DOI] [PMC free article] [PubMed] [Google Scholar]
- Morita M, Gravel SP, Chenard V, Sikstrom K, Zheng L, Alain T, Gandin V, Avizonis D, Arguello M, Zakaria C et al (2013) mTORC1 controls mitochondrial activity and biogenesis through 4E‐BP‐dependent translational regulation. Cell Metab 18: 698–711 [DOI] [PubMed] [Google Scholar]
- Mottillo EP, Desjardins EM, Crane JD, Smith BK, Green AE, Ducommun S, Henriksen TI, Rebalka IA, Razi A, Sakamoto K et al (2016) Lack of adipocyte AMPK exacerbates insulin resistance and hepatic steatosis through brown and beige adipose tissue function. Cell Metab 24: 118–129 [DOI] [PMC free article] [PubMed] [Google Scholar]
- Murakawa T, Yamaguchi O, Hashimoto A, Hikoso S, Takeda T, Oka T, Yasui H, Ueda H, Akazawa Y, Nakayama H et al (2015) Bcl‐2‐like protein 13 is a mammalian Atg32 homologue that mediates mitophagy and mitochondrial fragmentation. Nat Commun 6: 7527 [DOI] [PMC free article] [PubMed] [Google Scholar]
- Nedergaard J, Golozoubova V, Matthias A, Asadi A, Jacobsson A, Cannon B (2001) UCP1: the only protein able to mediate adaptive non‐shivering thermogenesis and metabolic inefficiency. Biochim Biophys Acta 1504: 82–106 [DOI] [PubMed] [Google Scholar]
- Novak I, Kirkin V, McEwan DG, Zhang J, Wild P, Rozenknop A, Rogov V, Lohr F, Popovic D, Occhipinti A et al (2010) Nix is a selective autophagy receptor for mitochondrial clearance. EMBO Rep 11: 45–51 [DOI] [PMC free article] [PubMed] [Google Scholar]
- Okamoto K (2014) Organellophagy: eliminating cellular building blocks via selective autophagy. J Cell Biol 205: 435–445 [DOI] [PMC free article] [PubMed] [Google Scholar]
- Palikaras K, Tavernarakis N (2014) Mitochondrial homeostasis: the interplay between mitophagy and mitochondrial biogenesis. Exp Gerontol 56: 182–188 [DOI] [PubMed] [Google Scholar]
- Palikaras K, Lionaki E, Tavernarakis N (2015a) Balancing mitochondrial biogenesis and mitophagy to maintain energy metabolism homeostasis. Cell Death Differ 22: 1399–1401 [DOI] [PMC free article] [PubMed] [Google Scholar]
- Palikaras K, Lionaki E, Tavernarakis N (2015b) Coordination of mitophagy and mitochondrial biogenesis during ageing in C. elegans . Nature 521: 525–528 [DOI] [PubMed] [Google Scholar]
- Palikaras K, Daskalaki I, Markaki M, Tavernarakis N (2017) Mitophagy and age‐related pathologies: development of new therapeutics by targeting mitochondrial turnover. Pharmacol Ther 178: 157–174 [DOI] [PubMed] [Google Scholar]
- Park JH, Kang HJ, Lee YK, Kang H, Kim J, Chung JH, Chang JS, McPherron AC, Lee SB (2015) Inactivation of EWS reduces PGC‐1alpha protein stability and mitochondrial homeostasis. Proc Natl Acad Sci USA 112: 6074–6079 [DOI] [PMC free article] [PubMed] [Google Scholar]
- Pickles S, Vigie P, Youle RJ (2018) Mitophagy and quality control mechanisms in mitochondrial maintenance. Curr Biol 28: R170–R185 [DOI] [PMC free article] [PubMed] [Google Scholar]
- Pirooznia SK, Yuan C, Khan MR, Karuppagounder SS, Wang L, Xiong Y, Kang SU, Lee Y, Dawson VL, Dawson TM (2020) PARIS induced defects in mitochondrial biogenesis drive dopamine neuron loss under conditions of parkin or PINK1 deficiency. Mol Neurodegener 15: 17 [DOI] [PMC free article] [PubMed] [Google Scholar]
- Ploumi C, Daskalaki I, Tavernarakis N (2017) Mitochondrial biogenesis and clearance: a balancing act. FEBS J 284: 183–195 [DOI] [PubMed] [Google Scholar]
- Preston CC, Oberlin AS, Holmuhamedov EL, Gupta A, Sagar S, Syed RH, Siddiqui SA, Raghavakaimal S, Terzic A, Jahangir A (2008) Aging‐induced alterations in gene transcripts and functional activity of mitochondrial oxidative phosphorylation complexes in the heart. Mech Ageing Dev 129: 304–312 [DOI] [PMC free article] [PubMed] [Google Scholar]
- Puigserver P, Wu ZD, Park CW, Graves R, Wright M, Spiegelman BM (1998) A cold‐inducible coactivator of nuclear receptors linked to adaptive thermogenesis. Cell 92: 829–839 [DOI] [PubMed] [Google Scholar]
- Puigserver P (2005) Tissue‐specific regulation of metabolic pathways through the transcriptional coactivator PGC1‐alpha. Int J Obes (Lond) 29(Suppl 1): S5–S9 [DOI] [PubMed] [Google Scholar]
- Rasbach KA, Schnellmann RG (2007) Signaling of mitochondrial biogenesis following oxidant injury. J Biol Chem 282: 2355–2362 [DOI] [PubMed] [Google Scholar]
- Rikka S, Quinsay MN, Thomas RL, Kubli DA, Zhang X, Murphy AN, Gustafsson AB (2011) Bnip3 impairs mitochondrial bioenergetics and stimulates mitochondrial turnover. Cell Death Differ 18: 721–731 [DOI] [PMC free article] [PubMed] [Google Scholar]
- Ruas JL, White JP, Rao RR, Kleiner S, Brannan KT, Harrison BC, Greene NP, Wu J, Estall JL, Irving BA et al (2012) A PGC‐1alpha isoform induced by resistance training regulates skeletal muscle hypertrophy. Cell 151: 1319–1331 [DOI] [PMC free article] [PubMed] [Google Scholar]
- Sandoval H, Thiagarajan P, Dasgupta SK, Schumacher A, Prchal JT, Chen M, Wang J (2008) Essential role for Nix in autophagic maturation of erythroid cells. Nature 454: 232–U266 [DOI] [PMC free article] [PubMed] [Google Scholar]
- Scarffe LA, Stevens DA, Dawson VL, Dawson TM (2014) Parkin and PINK1: much more than mitophagy. Trends Neurosci 37: 315–324 [DOI] [PMC free article] [PubMed] [Google Scholar]
- Scarpulla RC (1997) Nuclear control of respiratory chain expression in mammalian cells. J Bioenerg Biomembr 29: 109–119 [DOI] [PubMed] [Google Scholar]
- Scarpulla RC (2002) Nuclear activators and coactivators in mammalian mitochondrial biogenesis. Biochim Biophys Acta 1576: 1–14 [DOI] [PubMed] [Google Scholar]
- Scarpulla RC (2008) Nuclear control of respiratory chain expression by nuclear respiratory factors and PGC‐1‐related coactivator. Ann N Y Acad Sci 1147: 321–334 [DOI] [PMC free article] [PubMed] [Google Scholar]
- Scarpulla RC, Vega RB, Kelly DP (2012) Transcriptional integration of mitochondrial biogenesis. Trends Endocrin Met 23: 459–466 [DOI] [PMC free article] [PubMed] [Google Scholar]
- Schofield JH, Schafer ZT (2020) Mitochondrial ROS and mitophagy: a complex and nuanced relationship. Antioxid Redox Signal 10.1089/ars.2020.8058 [DOI] [PubMed] [Google Scholar]
- Shin JH, Ko HS, Kang H, Lee Y, Lee YI, Pletinkova O, Troconso JC, Dawson VL, Dawson TM (2011) PARIS (ZNF746) repression of PGC‐1alpha contributes to neurodegeneration in Parkinson's disease. Cell 144: 689–702 [DOI] [PMC free article] [PubMed] [Google Scholar]
- Stephan JS, Yeh YY, Ramachandran V, Deminoff SJ, Herman PK (2009) The Tor and PKA signaling pathways independently target the Atg1/Atg13 protein kinase complex to control autophagy. Proc Natl Acad Sci USA 106: 17049–17054 [DOI] [PMC free article] [PubMed] [Google Scholar]
- Sterky FH, Lee S, Wibom R, Olson L, Larsson NG (2011) Impaired mitochondrial transport and Parkin‐independent degeneration of respiratory chain‐deficient dopamine neurons in vivo . Proc Natl Acad Sci USA 108: 12937–12942 [DOI] [PMC free article] [PubMed] [Google Scholar]
- Sugiura A, McLelland GL, Fon EA, McBride HM (2014) A new pathway for mitochondrial quality control: mitochondrial‐derived vesicles. EMBO J 33: 2142–2156 [DOI] [PMC free article] [PubMed] [Google Scholar]
- Sun N, Yun J, Liu J, Malide D, Liu C, Rovira II, Holmstrom KM, Fergusson MM, Yoo YH, Combs CA et al (2015) Measuring In Vivo Mitophagy. Mol Cell 60: 685–696 [DOI] [PMC free article] [PubMed] [Google Scholar]
- Uldry M, Yang W, St‐Pierre J, Lin J, Seale P, Spiegelman BM (2006) Complementary action of the PGC‐1 coactivators in mitochondrial biogenesis and brown fat differentiation. Cell Metab 3: 333–341 [DOI] [PubMed] [Google Scholar]
- Vafai SB, Mootha VK (2012) Mitochondrial disorders as windows into an ancient organelle. Nature 491: 374–383 [DOI] [PubMed] [Google Scholar]
- Valero T (2014) Mitochondrial biogenesis: pharmacological approaches. Curr Pharm Des 20: 5507–5509 [DOI] [PubMed] [Google Scholar]
- Vernia S, Cavanagh‐Kyros J, Garcia‐Haro L, Sabio G, Barrett T, Jung DY, Kim JK, Xu J, Shulha HP, Garber M et al (2014) The PPARalpha‐FGF21 hormone axis contributes to metabolic regulation by the hepatic JNK signaling pathway. Cell Metab 20: 512–525 [DOI] [PMC free article] [PubMed] [Google Scholar]
- Watanabe M, Yamamoto T, Kakuhata R, Okada N, Kajimoto K, Yamazaki N, Kataoka M, Baba Y, Tamaki T, Shinohara Y (2008) Synchronized changes in transcript levels of genes activating cold exposure‐induced thermogenesis in brown adipose tissue of experimental animals. Biochim Biophys Acta 1777: 104–112 [DOI] [PubMed] [Google Scholar]
- Wei H, Liu L, Chen Q (2015) Selective removal of mitochondria via mitophagy: distinct pathways for different mitochondrial stresses. Biochim Biophys Acta 1853: 2784–2790 [DOI] [PubMed] [Google Scholar]
- Wei Y, Chiang WC, Sumpter R Jr, Mishra P, Levine B (2017) Prohibitin 2 is an inner mitochondrial membrane mitophagy receptor. Cell 168: 224–238 [DOI] [PMC free article] [PubMed] [Google Scholar]
- Whitworth AJ, Pallanck LJ (2017) PINK1/Parkin mitophagy and neurodegeneration‐what do we really know in vivo? Curr Opin Genet Dev 44: 47–53 [DOI] [PubMed] [Google Scholar]
- Wu Z, Puigserver P, Andersson U, Zhang C, Adelmant G, Mootha V, Troy A, Cinti S, Lowell B, Scarpulla RC et al (1999) Mechanisms controlling mitochondrial biogenesis and respiration through the thermogenic coactivator PGC‐1. Cell 98: 115–124 [DOI] [PubMed] [Google Scholar]
- Wu H, Wang Y, Li W, Chen H, Du L, Liu D, Wang X, Xu T, Liu L, Chen Q (2019) Deficiency of mitophagy receptor FUNDC1 impairs mitochondrial quality and aggravates dietary‐induced obesity and metabolic syndrome. Autophagy 15: 1882–1898 [DOI] [PMC free article] [PubMed] [Google Scholar]
- Zhang CS, Lin SC (2016) AMPK promotes autophagy by facilitating mitochondrial fission. Cell Metab 23: 399–401 [DOI] [PubMed] [Google Scholar]
Associated Data
This section collects any data citations, data availability statements, or supplementary materials included in this article.
Supplementary Materials
Expanded View Figures PDF
Review Process File
Source Data for Expanded View
Data Availability Statement
This study includes no data deposited in external repositories.