Abstract
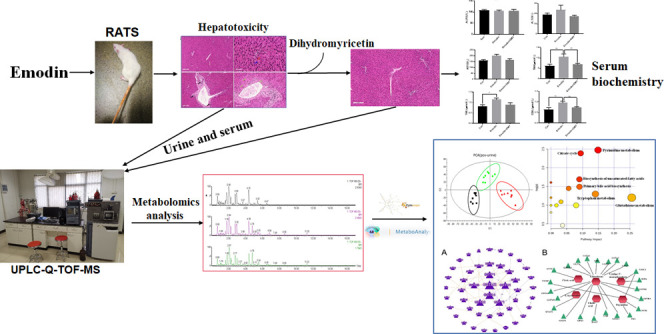
Dihydromyricetin (DMY), an important flavanone found in Ampelopsis grossedentata, plays a protective role in liver injury. Our previous research found that DMY protected L02 cells against hepatotoxicity caused by emodin. In this study, serum, urine, and liver samples from rats were systematically used for biochemical analysis, pathological observation, and nontargeted metabolomics to evaluate the toxicity of emodin and DMY intervention. After oral administration of DMY, DMY may alleviate liver injury by improving liver metabolism. Approximately, 8 of 15 metabolites in rat urine and serum were significantly regulated by DMY. Metabolic pathway analysis showed that glutathione metabolism, pyrimidine metabolism, and tryptophan metabolism were the most affected pathways, and 18 proteins were predicted to be potential targets of DMY during the alleviation of liver injury induced by emodin. This research is of great significance in confirming the liver-protective effect of DMY, especially during acute liver injury caused by traditional Chinese medicine.
Introduction
Ampelopsis grossedentata is a health drink that people in the southwest region of China often imbibe as a tea. Dihydromyricetin (DMY) is the most active component in A. grossedentata and its content is as high as 30% in young stalks and leaves.1 DMY has remarkable antioxidative, anticancer, anti-inflammatory, and enhanced immunity characteristics.2,3 DMY improved the glucose and lipid metabolism, and played an anti-inflammatory role in nonalcoholic fatty liver disease.4 Moreover, DMY can improve the symptoms of liver dysfunction caused by acute liver injury. DMY not only alleviates the liver injury induced by acetaminophen through the regulation intervention of acetaminophen transformation, lipid metabolic homeostasis, hepatocyte death, and p53-related regeneration5 but also shows protective effects on triptolide-induced acute liver injury, and its mechanism is related to the activation of the Nrf2 pathway to alleviate the oxidative stress of triptolide-induced acute liver injury.6 In addition, DMY showed significant liver-protective effects in rats with CCl4-induced acute liver injury and in mice with d-galactosamine- and endotoxin-induced acute liver injury.7
Liver injury caused by traditional Chinese medicine (TCM) has attracted much attention in recent years. Polygonum multiflorum Thunb. is a common tonic in TCM. It has the effects of tonifying kidney, replenishing Qi, and blackening hair, but the main side effect is acute liver injury.8 Our previous studies have shown that the initial side effect of P. multiflorum is acute liver injury, and the kidney also exhibits varying degrees of damage over time.9 Emodin is the main toxic component of Polygonum multiflorum Thunb. Several studies have reported that emodin can cause obvious liver injury.10−13
Metabonomics has become a recognized research method for pharmacological and toxicological mechanism of TCM. Liquid chromatography-mass spectrometry (LC/MS) possesses advantages with wide dynamic ranges and chemical coverage, making it a suitable tool for nontargeted metabolomics research studies.14−16 Metabolic syndrome, characterized by an imbalance of a substance and energy balance, is a risk factor for hepatotoxicity. Metabolic biomarkers, with biological characteristics of hepatotoxicity and hepatic protection, can be used for drug development and clinical research design. Studies on hepatotoxicity of emodin have been reported. The toxicity of emodin against HepG2 hepatocytes was studied by nuclear magnetic resonance (NMR) spectroscopy,17 and Xiao et al. used metabonomics technology to study the toxicity of emodin against HL-7702 hepatocytes.18 Our previous study found that DMY protected hepatocytes (L02) against the toxicity caused by emodin, which showed that cell viability increased in a dose-dependent manner. This hepatocyte protection might occur through the activation of Nrf2 to resist oxidation, decrease CYP7A1, and inhibit Ba synthesis.19 However, the protective effect exerted by DMY on emodin-induced acute liver injury in vivo has not been studied.
For these reasons, in this study, serum, urine, and liver samples were systematically used for pathological observation, biochemical analysis, and nontargeted metabolomics research to reveal the toxicity of emodin and intervention with DMY. The metabolism of urine and serum was analyzed to screen potential biomarkers of liver injury. Combined with biochemical indexes and metabolic results, the metabolic pathway of DMY in liver injury and the metabolites related to protein targets were explored and the mechanism of DMY in liver injury was elucidated.
Results
Biochemical Analysis
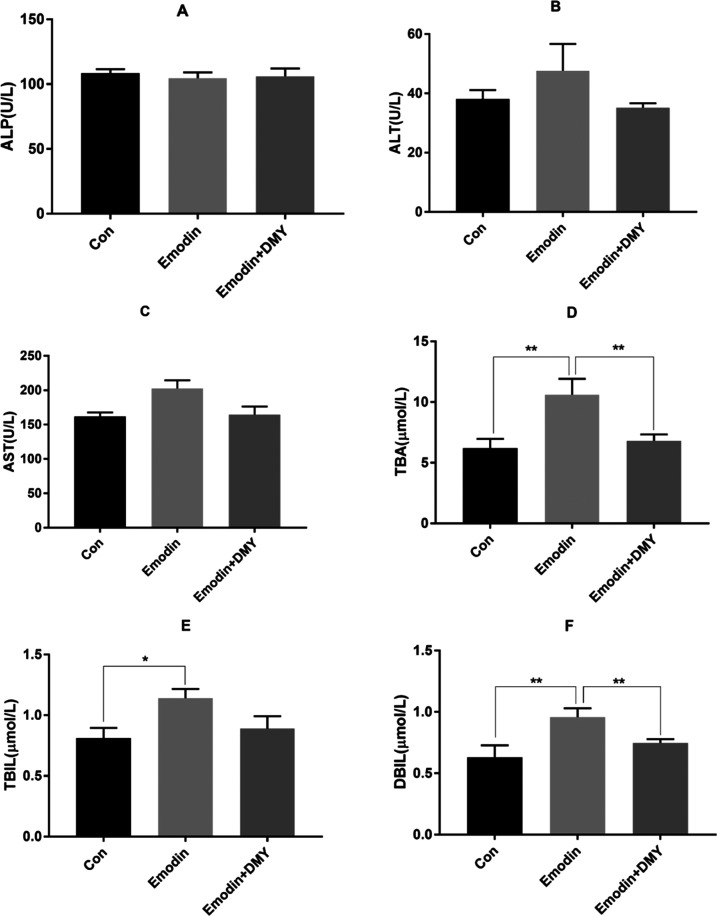
The results of alkaline phosphatase (ALP), alanine aminotransferase (ALT), aspartate aminotransferase (AST), total bile acid (TBA), total bilirubin (TBIL), and direct bilirubin (DBIL) are shown in Figure 1A–F. The concentrations of ALP in the three groups were not significantly different. Compared with those of group I, the concentrations of TBIL, DBIL, and TBA in group II were significantly increased (P < 0.05 and <0.01), and the concentrations of DBIL and TBA in group III were significantly decreased (P < 0.01). However, other biochemical indicators, such as serum ALT and AST, changed slightly between groups II and III (P > 0.05).
Figure 1.
Levels of ALP (A), ALT (B), AST (C), TBA (D), TBIL (E), and DBIL (F) in serum (n = 8). * Represents P < 0.05, ** represents P < 0.01. One-way analysis of variance (ANOVA) was used to calculate the significant differences. Group I: con; group II: emodin; group III: emodin + DMY.
Histopathological Results
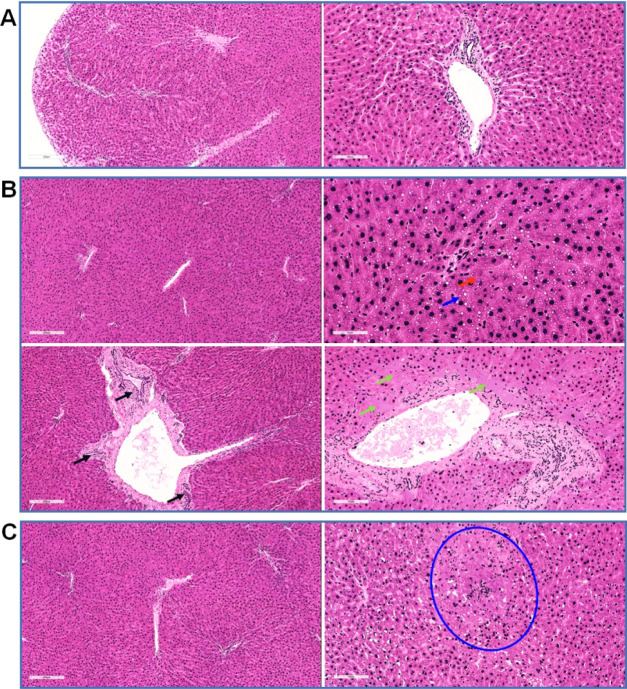
The hepatic lobules were evenly distributed together with a clear structure, regular arrangement of the hepatic cords, complete and clear structure of the portal area, and a smooth membrane in group I.
In group II, the structure of the hepatic lobules was clear and the arrangement of the hepatic cords was regular. Cholestasis and mild steatosis were found in hepatocytes. Bridging necrosis of hepatocytes was seen at the focal boundary plate. In addition, sheet necrosis of hepatocytes around the portal area, proliferation of small bile ducts in the portal area, and congestion of some static veins were observed.
In group III, the distribution of hepatic lobules was uniform, the structure was clear, the arrangement of hepatic cords was regular, and only one focus of hepatocyte necrosis was found in this group (Figure 2).
Figure 2.
Representative light photomicrographs of rat liver specimens for hematoxylin and eosin (H&E) analysis (n = 5). (A) Group I: the hepatic lobules were evenly distributed and the structure was clear. (B) Group II: cholestasis in hepatocytes (red arrow, brown granules in cells), mild steatosis (blue arrow, cytoplasmic vacuoles), sheet necrosis of hepatocytes around the portal area (green arrow, no nuclear region), proliferation of small bile ducts in the portal area (black arrow), and congestion of some veins. (C) Group III: the liver lobules were distributed evenly, the structure was clear, the liver cord was arranged in a regular way, and only one focus of liver cell necrosis was observed (shown in the blue circle, in which the cell structure was disordered and nuclear fragments were visible).
Multivariate Statistical Analysis Results and Potential Biomarker Prediction
Urinary and serum were analyzed by UPLC-Q-TOF-MS in both positive and negative ion modes. Multivariate statistical analysis was used to investigate the metabolites (Figure S1) to reveal the metabolic differences among three groups.
Principal component analysis (PCA) was used to visualize the similarities and differences of metabolic profiles among the three groups. The scatter plot of the PCA score is displayed in Figure 3A–D. Good separation among groups I, II, and III indicated that emodin significantly altered the endogenous metabolite levels in urine and serum samples. In addition, the separation between groups II and III was good, suggesting that the perturbed metabolites in urine and serum could be brought back to a normal level with DMY.
Figure 3.
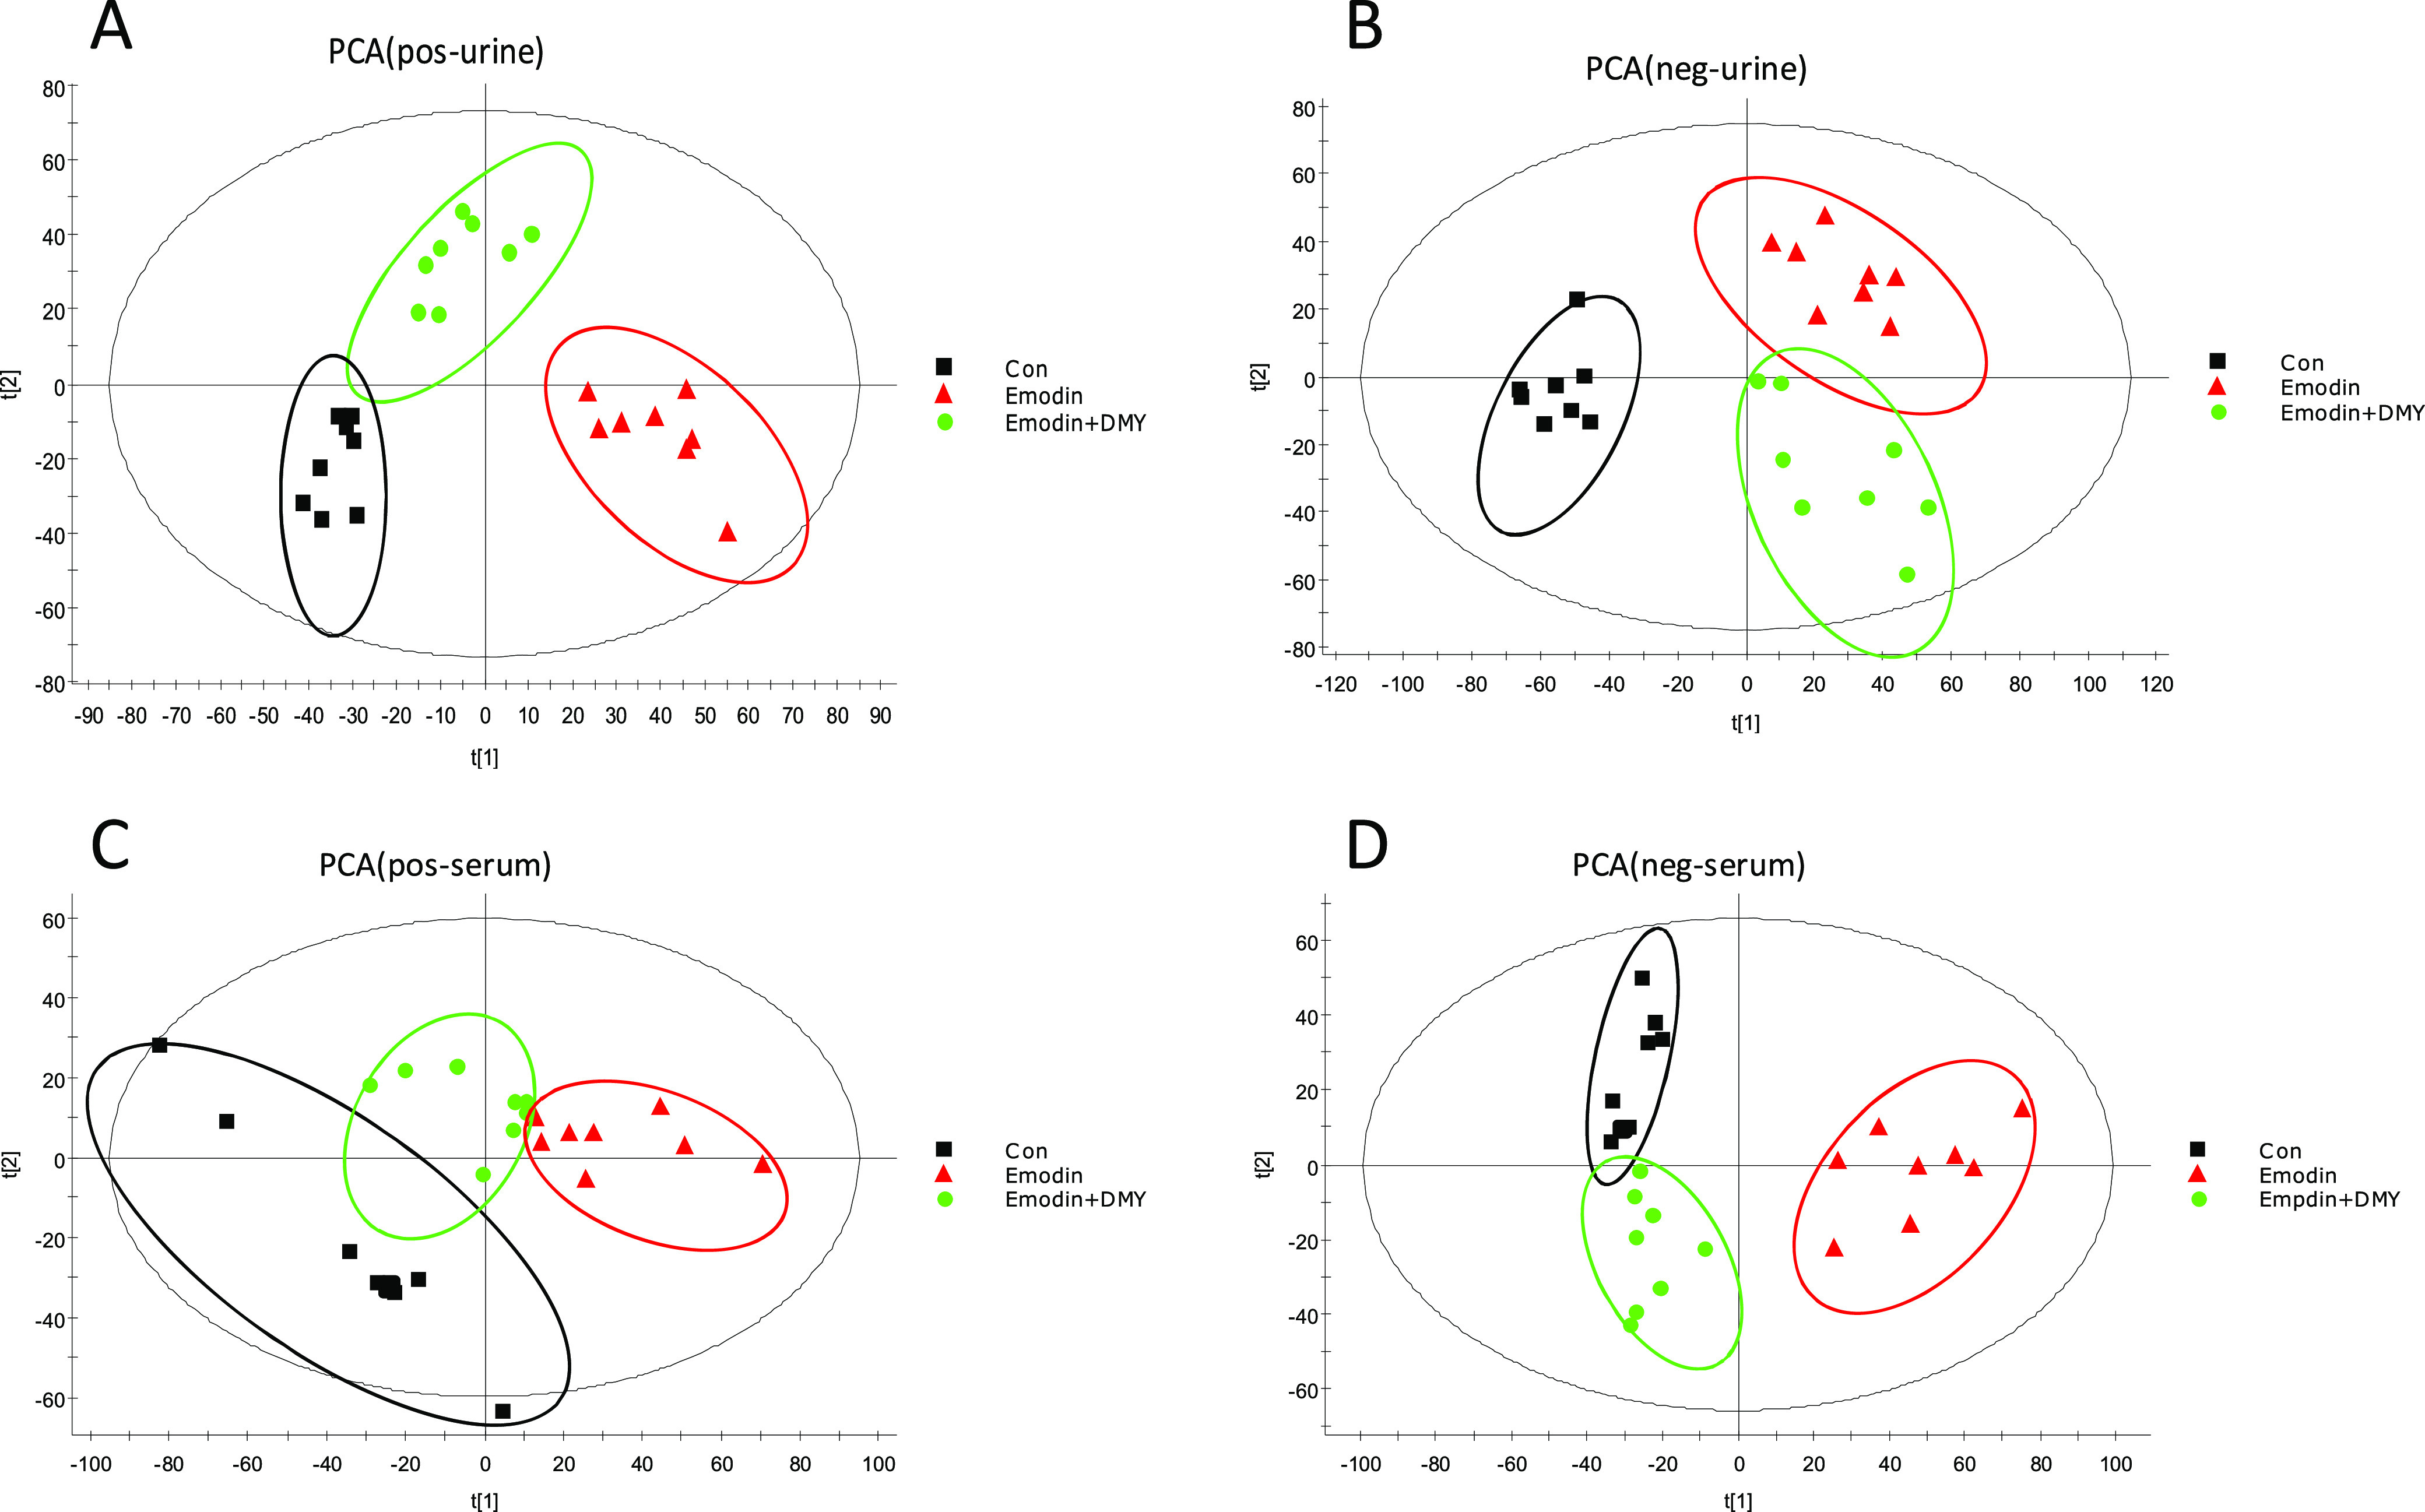
PCA plots of urine and serum samples in an electrospray ionization (ESI) mode. (A): ESI+—urine, (B): ESI–—urine, (C): ESI+—serum, (D): ESI–—serum. Group I: con; group II: emodin; and group III: emodin + DMY.
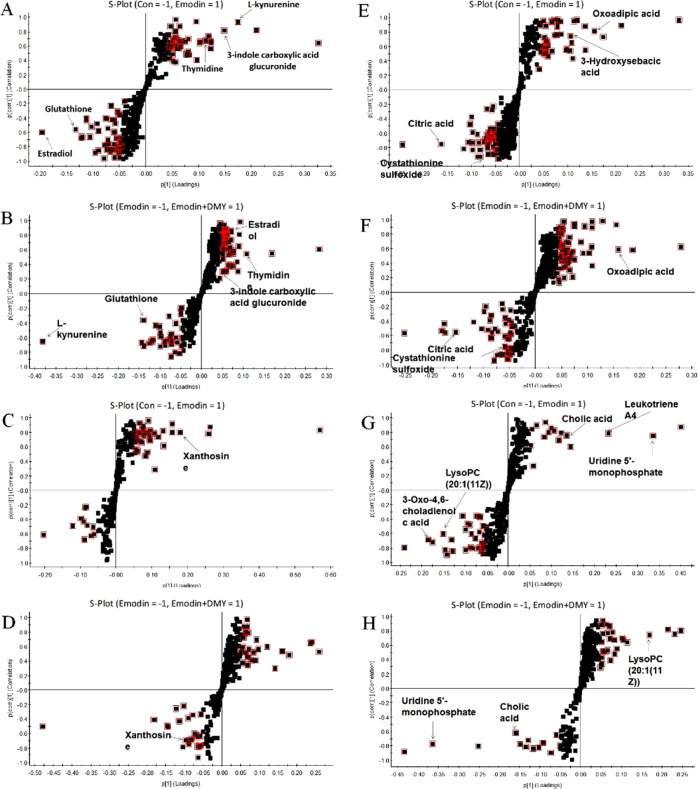
To study the liver injury caused by emodin and the regulation of DMY, the orthogonal projections to latent structures discriminant analysis (OPLS-DA) model was used to identify the potential biomarkers. The comparisons of groups I and II and groups II and III were applied to find differences between groups. The OPLS-DA models derived from ESI+ and ESI– analysis data are shown in Figure 4A–H.
Figure 4.
S-plot of OPLS-DA for group I (con) versus group II (emodin) and group II (emodin) versus group III (emodin + DMY) in an ESI+ mode (A–D) and ESI– mode (E–H). The metabolites (variables with importance parameter (VIP) >1) were marked in a red square.
The following clear differences were obtained. The urine sample in the ESI+ mode: group I versus group II, cumulative R2Y at 0.992 and Q2 at 0.945 (Figure 4A); group II versus group III, cumulative R2Y at 0.999 and Q2 at 0.901 (Figure 4B). The urine sample in the ESI– mode: group I versus group II, cumulative R2Y at 0.988 and Q2 at 0.964 (Figure 4E); group II versus group III, cumulative R2Y at 0.998 and Q2 at 0.818 (Figure 4F).
The serum sample in the ESI+ mode: group I versus group II, cumulative R2Y at 0.998 and Q2 at 0.959 (Figure 4C); group II versus group III, cumulative R2Y at 0.995 and Q2 at 0.834 (Figure 4D). The urine sample in the ESI– mode: group I versus group II, cumulative R2Y at 0.997 and Q2 at 0.952 (Figure 4G); group II versus group III, cumulative R2Y at 0.999 and Q2 at 0.936 (Figure 4H).
Potential Biomarkers and Their Changing Trends
The metabolites were identified with the combination of online database information and standard sample spectra. Differential metabolites with VIP > 1 were selected for further t-tests or ANOVA using Progenesis QI software. Biomarkers were identified with P < 0.05 and fold change >1.5 among the three groups. The potential biomarkers of emodin-induced liver injury and DMY reversal were screened out. According to the standard reference substances, the accurate mass-to-charge ratio in the METLIN database, and HMDB database, 15 metabolites were then selected as potential biomarkers to characterize the liver injury model of emodin, as shown in Table 1.
Table 1. Potential Biomarker Identificationa.
| no | RT (min) | mass-to-charge ratio | type | sample | identified compound | trend |
|
|---|---|---|---|---|---|---|---|
| group II versus group I | group III versus group II | ||||||
| 1 | 1.87 | 338.0814 | M + H | urine | 3-indole carboxylic acid glucuronide | ↑** | ↓ |
| 2 | 3.34 | 237.0826 | M – H | urine | cystathionine sulfoxide | ↑** | ↓ |
| 3 | 3.43 | 323.0629 | M – H | serum | uridine 5′-monophosphate | ↓** | ↑## |
| 4 | 3.44 | 159.1062 | M – H | urine | oxoadipic acid | ↑** | ↓## |
| 5 | 4.06 | 217.0212 | M – H | urine | 3-hydroxysebacic acid | ↓* | |
| 6 | 4.20 | 273.1535 | M + H | urine | estradiol | ↓** | ↑ |
| 7 | 4.25 | 191.1064 | M – H | urine | citric acid | ↑** | ↓## |
| 8 | 4.70 | 307.0663 | M + Na | serum | xanthosine | ↑** | ↓ |
| 9 | 4.82 | 369.2309 | M – H | serum | 3-oxo-4,6-choladienoic acid | ↓** | |
| 10 | 5.57 | 209.1193 | M + H | urine | l-kynurenine | ↓** | ↑## |
| 11 | 5.70 | 243.1032 | M + H | urine | thymidine | ↑** | ↓## |
| 12 | 6.21 | 407.2895 | M – H | serum | cholic acid | ↑* | ↓# |
| 13 | 9.11 | 317.2158 | M – H | serum | leukotriene A4 | ↓** | |
| 14 | 11.56 | 594.3764 | M + FA – H | serum | lysoPC (20:1(11Z)) | ↓** | ↑# |
| 15 | 13.57 | 308.0930 | M + H | urine | glutathione | ↑** | ↓## |
Compared to group I: *P < 0.05 and **P < 0.01; compared to group II: #P < 0.05 and ##P < 0.01.
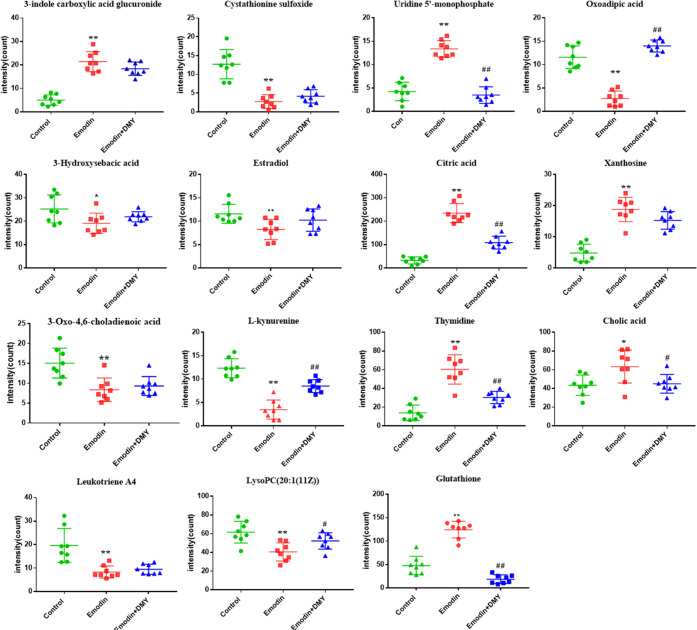
Specifically, 7 of 15 metabolites were elevated in the liver injury model with emodin, including 3-indole carboxylic acid glucuronide, uridine 5′-monophosphate (UMP), citric acid, xanthosine, thymidine, cholic acid, and glutathione (GSH). Other metabolites were downregulated, namely, cystathionine sulfoxide, oxoadipic acid, 3-hydroxysebacic acid, estradiol, 3-oxo-4,6-choladienoic acid, l-kynurenine, leukotriene A4, and lysoPC (20:1(11Z)).
In addition, DMY significantly regulated 8 of 15 metabolites in rat urine and serum, including glutathione, uridine 5′-monophosphate, thymidine, l-kynurenine, oxoadipic acid, cholic acid, lysoPC (20:1(11Z)), and citric acid. This finding suggests that these metabolites may play a key role in alleviating liver injury induced by emodin (Figure 5).
Figure 5.
Peak intensities of biomarkers in rat serum and urine samples. The y-axis shows a specific metabolite’s peak intensity. n = 8, *P < 0.05, **P < 0.01, emodin (group II) versus control (group I); #P < 0.05, ##P < 0.01, emodin + DMY (group III) versus emodin (group II).
Biochemical Interpretation and Pathway Analysis
The concentration changes of biomarkers suggested that emodin caused metabolic disorder after liver injury, while DMY reversed these metabolites and affected the related metabolic pathways. The pathways with an impact value >0.1 and significance levels of the metabolic pathway (−log P) > 1 were regarded as the most significant pathways. Therefore, the most affected pathways were glutathione metabolism, pyrimidine metabolism, and tryptophan metabolism. In addition, bile acid biosynthesis, unsaturated fatty acids biosynthesis, and the citrate cycle were identified (Figure 6A).
Figure 6.
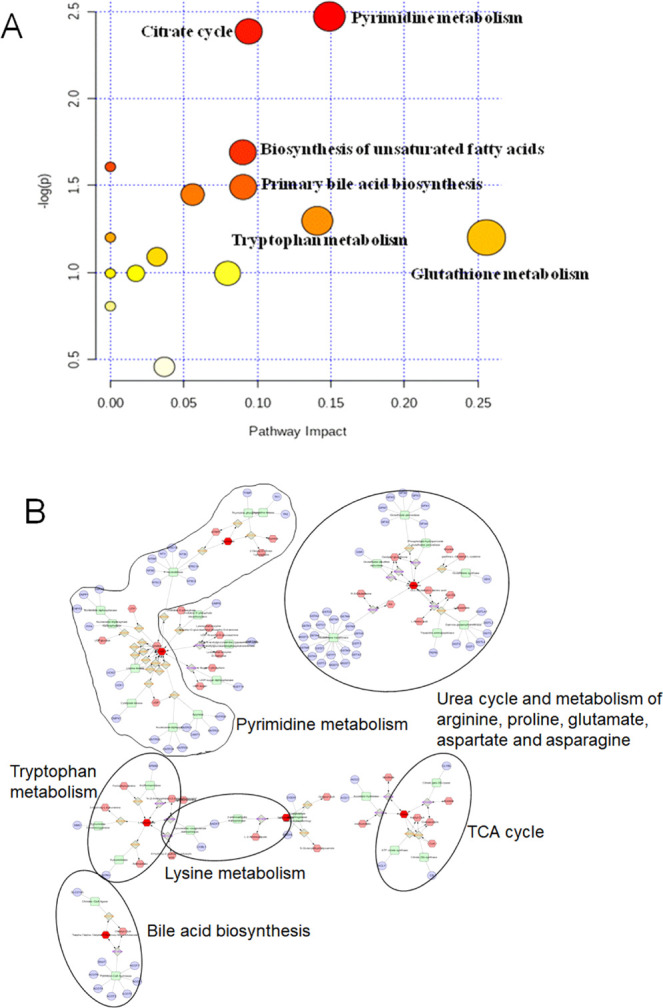
Metabolic pathway of potential biomarkers related to emodin-induced liver injury and protection of DMY. (A) Impact value that was calculated from the pathway topology analysis. Pathways with an impact value above 0.1 were screened out as potential target pathways. (B) Hexagon: metabolites; round rectangle: enzyme; ellipse: gene; diamond: reaction.
Metabolic Correlation with Predicted Protein Results
Metabolite–protein correlation analysis was performed using Cytoscape 3.7.1., and the result is shown in Figure 6B. The related pathways mainly involved tryptophan metabolism, pyrimidine metabolism, lysine metabolism, tricarboxylic acid (TCA) cycle, bile acid biosynthesis, urea cycle, and metabolism of arginine, proline, glutamate, aspartate, and asparagine.
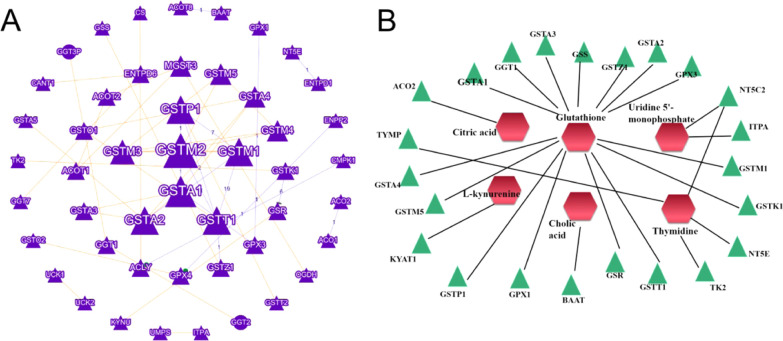
Potential proteins related to metabolic biomarkers were discovered. About 18 proteins (GSTK1, GSTM1, GSTT1, GSR, GSTP1, GPX1, GSTA1, GPX3, GGT1, GSTA2, GSTZ1, GSS, GSTA3, NT5E, TYMP, GSTM5, KYAT1, GSTA4, NT5C2, ITPA, BAAT, ACO2, and TK2) were considered potential markers of DMY in alleviating liver injury induced by emodin (the full names of these proteins are shown in Table 2). The connections of proteins and metabolite-potential marker are exhibited in Figure 7.
Table 2. Full Names of the Potential Protein Targets.
| name abbreviation | full name | name abbreviation | full name |
|---|---|---|---|
| GSTK1 | glutathione S-transferase kappa 1 | GSTA3 | glutathione S-transferase α 3 |
| GSTM1 | glutathione S-transferase mu 1 | NT5E | 5′-nucleotidase |
| GSTT1 | glutathione S-transferase theta 1 | TYMP | thymidine phosphorylase |
| GSR | glutathione reductase | GSTM5 | glutathione S-transferase mu 5 |
| GSTP1 | glutathione S-transferase pi 1 | GSS | glutathione synthetase |
| GPX1 | glutathione peroxidase 1 | GSTA4 | glutathione S-transferase α 4 |
| GSTA1 | glutathione S-transferase α 1 | NT5C2 | 5′-nucleotidase, cytosolic II |
| GPX3 | glutathione peroxidase 3 | ITPA | inosine triphosphatase (nucleoside triphosphate pyrophosphatase) |
| GGT1 | γ-glutamyltransferase 1 | BAAT | bile acid coenzyme A |
| GSTA2 | glutathione S-transferase α 2 | ACO2 | aconitase 2, mitochondrial |
| GSTZ1 | glutathione transferase zeta 1 | TK2 | thymidine kinase 2, mitochondrial |
Figure 7.
Predicted metabolic correlation proteins and connections between proteins (A) and metabolite–potential marker correlations. (B) Hexagon: metabolites; triangle: proteins.
Discussion
A. grossedentata grows wild in southwest China. A health tea beverage made from its stems and leaves has a long history in southwest China and is used to treat common fever, especially jaundice hepatitis.20 DMY is one of the most important flavonoids and it is isolated from the stems and leaves of A. grossedentata.21 DMY has a variety of biological activities, such as antioxidative, anti-inflammatory, hepatoprotective, and antitumor properties.4,20 DMY and A. grossedentata can also interfere with hyperlipidemia induced by a high-fat diet through a variety of metabolic pathways.22
Dihydromyricetin ameliorated liver I/R injury via induction of FOXO3a-mediated autophagy,5 and alleviated acetaminophen-induced liver injury via the regulation of transformation, lipid homeostasis, cell death, and regeneration.5 In addition, DMY protects the liver via regulation of lipid metabolism and ethanol metabolism.23 In particular, DMY can protect against acute liver injury caused by Tripterygium wilfordii through the Nrf2 signaling pathway and the bile acid metabolism network.6 However, the mechanism by which DMY alleviates emodin-induced acute liver injury has not been studied. In this study, acute liver injury occurred after oral administration of emodin in rats, while DMY played a protective role in the liver.
The extent of hepatocyte damage is directly reflected in the changes of serum ALT, AST, and ALP. The levels of AST and ALT increased after emodin administration in this study, which indicated some hepatocyte damage to a certain extent. The content of TBA indirectly reflects the synthesis and resorption of the liver. After liver injury induced by emodin administration for 8 weeks, TBA could not be absorbed in the intestine effectively, and its level increased. In addition, Wang et al. found that emodin could cause bilirubin accumulation by inhibiting uridine diphosphate (UDP)-glucuronosyltransferase 1A1 (UGT1A1) enzymes, which resulted in increased bilirubin.24,25 Our study also found that DBIL and TBIL were increased in emodin-induced liver injury in rats, which indicated that emodin administration damaged the liver by affecting liver metabolism and probably aggravated the inhibition of UGT1A1 enzymes. However, after oral administration of DMY, the levels of ALT, AST, TBA, and TBIL were significantly reduced, indicating that DMY may alleviate liver injury by improving liver metabolism.
Glutathione (GSH) is composed of glutamic acid, cysteine, and glycine and contains three sulfhydryl peptides. GSH in hepatocytes can participate in biotransformation, thus transforming harmful poisons into harmless substances and excreting them out of the body.26−28 In this study, we found that the glutathione level of rats after emodin administration increased significantly and decreased significantly after oral administration of DMY, indicating that DMY may significantly interfere with the glutathione metabolism pathway. In addition, our previous study found that DMY alleviated hepatocyte damage induced by emodin through the Nrf2 pathway.19 Nrf2 participates in maintaining mitochondrial redox homeostasis by providing a reduction in GSH. The Nrf2/GSH axis plays a central role in cryoprotection in biological systems.29,30 As shown in Figure 8, we found approximately 15 potential GSH-related protein targets (except BAAT) that showed direct or indirect relationships with Nrf2. Glutathione S-transferases (GSTs) are multifunctional proteins that constitute the principal superfamily of phase II enzymes that commonly occur in humans and animals.31 For example, GSTA1 catalyzes the conjugation of GSH with drugs against oxidative stress, which plays an important role in protection against oxidative stress injury.32 Liu et al.33 found that GSTA1 could predict an early diagnosis of acute hepatic injury, and early detection of GSTA1 was an accurate and sensitive indicator of acute hepatic injury. Based on the current prediction results, whether DMY can play a role by regulating GSTA1 or its upstream and downstream needs further study.
Figure 8.
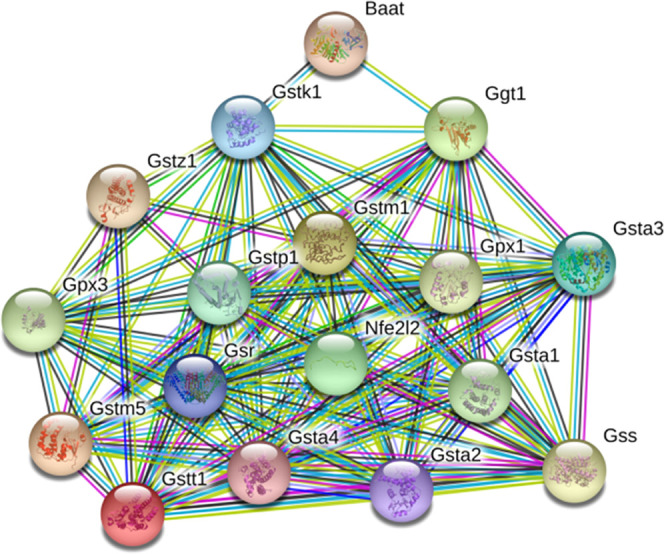
Protein–protein interaction (PPI) enrichment between Nrf2 (nef2l2) and other protected proteins.
Some drugs may cause an increase in pyrimidine metabolites in the blood or urine, thus causing disorders of pyrimidine metabolism.34−36 In this study, we found that two metabolites of pyrimidine metabolism, namely, uridine 5′-monophosphate and thymidine, were disturbed in the emodin group. Uridine 5′-monophosphate, a pyrimidine mononucleotide, is involved in several metabolic disorders, some of which include dihydropyrimidinase deficiency, UMP synthase deficiency, and β-ureidopropionase deficiency. Thymidine, a pyrimidine deoxynucleoside, is the DNA nucleoside T, which pairs with deoxyadenosine (A) in double-stranded DNA. DMY treatment may inhibit the disorder of pyrimidine metabolism induced by emodin by regulating the levels of uridine 5′-monophosphate and thymidine.
l-Kynurenine and oxoadipic acid are two important metabolites involved in the tryptophan metabolism pathway.37l-Kynurenine is the intermediate metabolite of tryptophan. Some studies have shown that thioacetamide-induced liver fibrosis is closely related to tryptophan.38,39 In the tryptophan metabolism pathway, tryptophan can be transformed to l-kynurenine by indoleamine 2,3-dioxygenase or tryptophan 2,3-dioxygenase, and then l-kynurenine can produce kynurenic acid under the action of kynurenine aminitric oxide transferase. The decrease in l-kynurenine causes liver dysfunction.40 Oxoadipic acid, also known as 2-oxoadipate, is produced from lysine in the cytosol of cells via the saccharopine and pipecolic acid pathways. Some studies have found that certain traditional Chinese medicines cause acute liver injury, which can result in an increase in oxoadipic acid. However, DMY can reverse the trend of these two metabolites, which suggests that DMY may play a role in protecting the liver by regulating tryptophan metabolism.
In addition, after DMY intervention, the three metabolites, cholic acid, lysoPC (20:1(11Z)), and citric acid, also showed significant changes. Cholic acid is a major primary bile acid produced in the liver and is usually conjugated with glycine or taurine. It facilitates fat absorption and cholesterol excretion.41,42 LysoPC (20:1(11Z)) is a kind of lysophospholipid (LyP). LysoPC (20:1(11Z)), in particular, consists of one chain of eicosenoic acid at the C-1 position. When the liver is injured, it causes an increase in cholic acid and interferes with fat metabolism, which causes an increase in lysophospholipids in the blood.43,44 Similar to the regulation of lipid dysregulation after liver injury,23 DMY intervention can significantly redress the unnormal trends of lipids after emodin administration, indicating that its protective effect may involve the regulation of lipid metabolism. Citric acid is a weak acid that formed in the tricarboxylic acid cycle. We found that citric acid increased significantly in the urine of rats after emodin administration. It has been reported that citric acid is increased in urine when renal tubules are poisoned,45,46 which suggests that emodin may be a key factor in renal damage. Based on the results showing that DMY significantly reduced the content of citric acid in rats with liver injury, DMY increased the level of citric acid and reversed the side effects of emodin.
Conclusions
In this study, we first investigated the liver protection of DMY after emodin administration by measuring serum biochemistry and histopathology. Then, we acquired urine and serum metabolic profiles and biomarkers of liver injury induced by emodin in Sprague–Dawley (SD) rats. Finally, eight metabolites were changed after DMY administration and were mainly involved in tryptophan metabolism, lipid metabolism, and the tricarboxylic acid cycle. This research is of great significance for the liver-protective effect of DMY, especially for liver injury caused by traditional Chinese medicine. Taking A. grossedentata as a healthcare product may improve drug-induced mild liver injury to some extent.
Materials and Methods
Chemicals and Reagents
Acetonitrile, methanol, and formic acid were MS grade and were purchased from Fisher Co. (Pittsburg, PA). Ultrapure water was prepared using a Milli-Q system (Millipore, Bedford, MA). Emodin (lot no. CDHS-B-707554) and DMY (lot no. Ctec20180118) with over 98% purity (by high-performance liquid chromatography (HPLC)) were purchased from Shannxi Jiahe Phytochem Co. Ltd. (Xi’an, Shannxi Province, China). The standards of cholic acid (81-25-4), l-kynurenine (2922-83-0), and citric acid (77-92-9) were purchased from Stanford Chemicals (Lake Forest, CA).
Animal Treatments and Sample Collection
All procedures involving animals were approved by the Animal Care and Use Committee of Dongfang Hospital of Beijing University of Chinese Medicine Animal Experiment Center to ensure ethical use and humane treatment of the animals. Beijing Vital River Laboratory Animal Technology Co., Ltd. provided 30 adult male Sprague–Dawley rats weighing 220–250 g, with the permission number SCXK (JING) 2016-006. All animals were kept in an animal room under a 12 h light/dark cycle at 25 °C and 45 ± 5% humidity with free drinking water and standard laboratory chow. The rats were divided randomly into three groups: group I (control), eight rats were orally administered with an equivalent volume of distilled water; group II, eight rats were treated with 1500 mg/kg emodin once per day for 8 weeks; and group III, eight rats were treated with 1500 mg/kg emodin once per day and 1000 mg/kg DMY once per day for 8 weeks.
Collection and Handling of Animal Samples
After 8 weeks, each rat was placed in a single metabolic cage to collect urine for 24 h. After 12 h of the last administration, rats were anesthetized with sodium pentobarbital (50 mg/kg, i.p.). Blood collection tubes containing sodium citrate (0.38%) collected blood samples from the abdominal aorta after a midline abdominal incision. The blood samples were stored at 37 °C for 30 min. All blood and urine samples were centrifuged at 3000 rpm for 10 min, and the supernatants were transferred into clean EP tubes and immediately stored at −80 °C prior to biochemical and metabolomics analysis. The liver tissues were taken from the rats immediately for histopathological analysis.
Serum Biochemistry and Histopathological Analysis
The serum hepatotoxicity index (including aspartate aminotransferase (AST), alanine aminotransferase (ALT), total bile acid (TBA), alkaline phosphatase (ALP), total bilirubin (TBIL), and direct bilirubin (DBIL)) was measured using an automatic biochemistry analyzer (Hitachi 17080, Tokyo, Japan). The liver tissue used for histopathological examination was fixed in 4% paraformaldehyde. The tissues were then further processed, embedded in paraffin, and stained with hematoxylin and eosin.
Urine and Serum Sample Handling for Metabolomics Analysis
Prior to analysis, 200 μL aliquots of urine samples were thawed at 4 °C followed by the addition of 800 μL of methanol to precipitate the proteins. The resulting solution mixture was vortexed for 30 s and centrifuged at 13 000 rpm for 15 min at 4 °C. The supernatant (800 μL) was transferred to an EP tube and evaporated to dryness at 36 °C under a stream of nitrogen. The residue was dissolved in 100 μL of methanol followed by vortexing for 60 s and centrifuging at 13 000 rpm for 15 min. The clear supernatant (50 μL) was transferred to a sampling vial for ultraperformance liquid chromatography-quadrupole-time-of-flight-mass spectrometry (UPLC-Q-TOF-MS) analysis. A quality control sample was prepared by pooling aliquots from all samples collected in the course of the study. The handling of serum samples was the same as that for urine.
Chromatography and MS Conditions
A UPLC-Q-TOF/MS (Synapt G2, Waters Corporation, Milford, MA) was used for metabolomics analysis. Chromatographic separation conditions are shown below. An Acquity UPLC HSS C18 column (1.7 μm, 2.1 × 100 mm2) was used at 40 °C. The mobile phase consisted of 0.1% formic acid–water (A) and 0.1% formic acid–acetonitrile (B). The UPLC elution conditions were 0–1.5 min, 10.0–20.0% B; 1.5–4.0 min, 20.0–40.0% B; 4.1–13.0 min, 40.0–90.0% B; 13.1–14.0 min, 90.0% B; and 14.1–17.0 min, 10.0% B. The flow rate was set at 0.4 mL/min and the injection volume was 4 μL. The autosampler was maintained at 10 °C.
The UPLC-Q-TOF/MS acquisition was used in the MSe mode. This mode can scan the primary and secondary mass spectra simultaneously. Mass spectrometry (MS) analysis was performed in positive and negative ion modes equipped with an electrospray ionization (ESI) source. Leucine–enkephalin (ESI+, m/z 556.2771; ESI–, m/z 554.2615) was used as a standard for quality determination and lock mass solution. The positive ion detection mode: capillary 2.7 kV, source temperature 120 °C, desolvation temperature 500 °C, cone gas flow 50 L/h, desolvation gas flow 800 L/h, and collision energy 25–50 eV. The negative ion detection mode had the same settings as the positive ion detection mode described above, except for the capillary was negative at 2.1 kV. The mass spectrum was collected in a profile mode ranging from 50 to 1000 m/z.
Multivariate Data Analysis
The data format (centroid) files were obtained from Masslynx Software version 4.0 (Waters Corporation), which were processed and analyzed in Progenesis QI (Waters Corporation, Milford, MA), including nonlinear retention time alignment, peak discrimination, filtering, alignment, matching, and identification. The retention time and the mass-to-ratio data pairs were used as the parameters for each ion. The data were processed by unit variance scaling and the mean-centered method, followed by multivariate analysis, including principal component analysis (PCA). An orthogonal partial least-squares discriminate analysis (OPLS-DA) algorithm was further constructed using the permutation test to prevent overfitting. Variables with importance parameter values higher than 1 (VIP > 1) in the OPLS-DA model were selected as potential variables in discriminating between groups. Meanwhile, Progenesis QI software was used to perform Student’s t-test and one-way analysis of variance (ANOVA) for these variables. Metabolites with P < 0.05 (ANOVA and t-test) and fold change >1.5 were considered to be statistically significant.
Biomarker Identification and Metabolic Pathway Analysis
The possible metabolites were screened and identified using certain online databases, such as the Human Metabolome Database (http://www.hmdb.ca/), METLIN (http://metlin.scripps.edu), and SMPD (http://www.smpdb.ca/). In the next step, the spectra were compared with the MS/MS information from the above databases to verify the structure of the putative metabolites. Finally, the metabolites were identified via comparison of the retention times and fragments of metabolites with the reference samples. MetaboAnalyst 5.0 (http://www.metaboanalyst.ca/) was used for biomarkers related to pathway analysis.
The pathways of potential biomarkers were analyzed using MetaboAnalyst 5.0 (http://www.metaboanalyst.ca/). Rattus norvegicus was selected for the pathway path library for pathway enrichment and topological analysis, and the other parameters were set at default.
Metabolic Correlation Protein Prediction
Metabolic correlation protein analysis and potential protein targets prediction were carried out via Cytoscape 3.7.2 and Genclip 3.0 (http://ci.smu.edu.cn/genclip3/analysis.php/). Pathways closely related to biomarkers were summarized for further discussion. The identified potential biomarkers were transferred to Cytoscape, and potential protein targets related to hepatotoxicity were predicted with GenClip 3.0.
Acknowledgments
This work was supported by the Beijing Science and Technology Development Fund Project of Traditional Chinese Medicine (JJ-2020-39) and the Independent Subject Selection of Basic Scientific Research Business Fees of Beijing University of Traditional Chinese Medicine (Young Teachers Project) (2019-JYB-JS-163). The authors are grateful to these institutions for the financial support.
Supporting Information Available
The Supporting Information is available free of charge at https://pubs.acs.org/doi/10.1021/acsomega.0c05488.
UPLC-Q-TOF-MS representative base peak intensity (BPI) chromatogram of the positive and negative ions in urine and serum samples (Figure S1) (PDF)
Author Contributions
∥ J.G. and N.S. contributed equally to this work.
The authors declare no competing financial interest.
Supplementary Material
References
- Li D.; Wang X. L.; Ye T. J.; Yan X. F.; Hu X. D. Research Progress on pharmacological mechanism of dihydromyricetin in liver disease. Chin. J. Integr. Tradit. West Med. Liver Dis. 2019, 29, 190–192. [Google Scholar]
- Li H. L.; Li Q. S.; Liu Z. W.; Yang K.; Chen Z. X.; Cheng Q. L.; Wu L. H. The Versatile Effects of Dihydromyricetin in Health. Evidence-Based Complementary Altern. Med. 2017, 2017, 1–10. 10.1155/2017/1053617. [DOI] [PMC free article] [PubMed] [Google Scholar]
- Chen Y. B.; Lv L. Z.; Pi H. F.; Qin W. J.; Chen J. W.; Guo D. F.; Lin J. Y.; Chi X. B.; Jiang Z. L.; Yang H. J.; Jiang Y. Dihydromyricetin protects against liver ischemia/reperfusion induced apoptosis via activation of FOXO3a-mediated autophagy. Oncotarget 2016, 7, 76508–76522. 10.18632/oncotarget.12894. [DOI] [PMC free article] [PubMed] [Google Scholar]
- Chen S.; Zhao X.; Wan J.; Ran L.; Qin Y.; Wang X.; Gao Y.; Shu F.; Zhang Y.; Liu P.; Zhang Q.; Zhu J.; Mi M. Dihydromyricetin improves glucose and lipid metabolism and exerts antiinflammatory effects in nonalcoholic fatty liver disease: A randomized controlled trial. Pharmacol. Res. 2015, 99, 74–81. 10.1016/j.phrs.2015.05.009. [DOI] [PubMed] [Google Scholar]
- Dong S. J.; Ji J. B.; Hu L. Y.; Wang H. N. Dihydromyricetin alleviates acetaminophen-induced liver injury via the regulation of transformation, lipid homeostasis, cell death and regeneration. Life Sci. 2019, 227, 20–29. 10.1016/j.lfs.2019.04.019. [DOI] [PubMed] [Google Scholar]
- Deng Y.; Zhang B. K.; Yan M.; Fan P. F.; Cai H. L.; Cao L. J.; Li H. D. L. In Evaluation on Hepatoprotection in Acute Liver Injure by Dihydromyricetin Based on Analysis of Nrf2 Pathway and Bile Acids, China Pharmaceutical Congress and the 16th Chinese Pharmacist Week, 2016; pp 1–14.
- Hase K.; Ohsugi M.; Xiong Q.; Basnet P.; Kadota S.; Namba T. Hepatoprotective effect of Hovenia dulcis THUNB. on experimental liver injuries induced by carbon tetrachloride or D-galactosamine/lipopolysaccharide. Biol. Pharm. Bull. 1997, 20, 381–385. 10.1248/bpb.20.381. [DOI] [PubMed] [Google Scholar]
- Lin L. F.; Ni B. R.; Lin H. M.; Zhang M.; Li X. C.; Yin X. B.; Qu C. H.; Ni J. Traditional usages, botany, phytochemistry, pharmacology and toxicology of Polygonum multiflorum Thunb.: a review. J. Ethnopharmacol. 2015, 159, 158–183. 10.1016/j.jep.2014.11.009. [DOI] [PMC free article] [PubMed] [Google Scholar]
- Yan Y.; Shi N.; Han X. Y.; Li G. D.; Wen B. Y.; Gao J. UPLC/MS/MS-Based Metabolomics Study of the Hepatotoxicity and Nephrotoxicity in Rats Induced by Polygonum multiflorum Thunb. ACS Omega 2020, 5, 10489–10500. 10.1021/acsomega.0c00647. [DOI] [PMC free article] [PubMed] [Google Scholar]
- Can T.; Dan G.; Li X. F.; Li C. Y.; Li R. S.; Zhao Y. L.; Li N.; Jia G. L. C.; Pang J. Y.; Cui H. R. Inflammatory stress potentiates emodin-induced liver injury in rats. Front. Pharmacol. 2015, 6, 233 10.3389/fphar.2015.00233. [DOI] [PMC free article] [PubMed] [Google Scholar]
- Wu L. L.; Han W. C.; Chen Y. L.; Zhang T.; Liu J. J.; Zhong S. L.; Liu H.; Han C. C.; Zhang Z. Y.; Liu S. W.; Tang L. Gender differences in the hepatotoxicity and toxicokinetics of emodin: The potential mechanisms mediated by UGT2B7 and MRP2. Mol. Pharmaceutics 2018, 15, 3931–3945. 10.1021/acs.molpharmaceut.8b00387. [DOI] [PubMed] [Google Scholar]
- Yang X. W.; Zhang Y. H.; Liu Y.; Chen C.; Xu W. J.; Xiao H. B. Emodin induces liver injury by inhibiting the key enzymes of FADH/NADPH transport in rat liver. Toxicol. Res. 2018, 7, 888–896. 10.1039/C7TX00307B. [DOI] [PMC free article] [PubMed] [Google Scholar]
- Wang Q.; Yang J. B.; Liu Y.; Wen H. R.; Ma S. S. Study on the hepatotoxicity of emodin based on the inhibition of UGT1A1 enzyme. Chin. J. Pharm. Anal. 2019, 39, 1177–1184. [Google Scholar]
- Ji H. Y.; Liu Y.; He F.; An R.; Du Z. Z. LC-MS based urinary metabolomics study of the intervention effect of aloe-emodin on hyperlipidemia rats. J. Pharm. Biomed. Anal. 2018, 156, 104–115. 10.1016/j.jpba.2018.04.015. [DOI] [PubMed] [Google Scholar]
- Zhang C. E.; Niu M.; Li Q.; Zhao Y. L.; Ma Z. J.; Xiong Y.; Dong X. P.; Li R. Y.; Feng W. W.; Dong Q.; et al. Urine metabolomics study on the liver injury in rats induced by raw and processed Polygonum multiflorum integrated with pattern recognition and pathways analysis. J. Ethnopharmacol. 2016, 194, 299–306. 10.1016/j.jep.2016.09.011. [DOI] [PubMed] [Google Scholar]
- Sun X. W.; Xu W.; Zeng Y.; Hou Y. R.; Guo L.; Zhao X. Y.; Sun C. H. Metabonomics evaluation of urine from rats administered with phorate under long-term and low-level exposure by ultra-performance liquid chromatography-mass spectrometry. J. Appl. Toxicol. 2014, 34, 176–183. 10.1002/jat.2848. [DOI] [PubMed] [Google Scholar]
- Chen C.; Gao J.; Wang T. S.; Guo C.; Yan Y. J.; Mao C. Y.; Gu L. W.; Yang Y.; Li Z. F.; Liu A. NMR-based Metabolomic Techniques Identify the Toxicity of Emodin in HepG2 Cells. Sci. Rep. 2018, 8, 9379 10.1038/s41598-018-27359-4. [DOI] [PMC free article] [PubMed] [Google Scholar]
- Liu X. Y.; Liu Y. Q.; Cheng M. C.; Xiao H. B. Metabolomic Responses of Human Hepatocytes to Emodin, Aristolochic Acid, and Triptolide: Chemicals Purified from Traditional Chinese Medicines. J. Biochem. Mol. Toxicol. 2015, 29, 533–543. 10.1002/jbt.21724. [DOI] [PubMed] [Google Scholar]
- Yan Y.; Wang K.; Tang X.; Gao J. F.; Wen B. Y. Phytochemicals protect L02 cells against hepatotoxicity induced by emodin via the Nrf2 signaling pathway. Toxicol. Res. 2019, 8, 1028–1034. 10.1039/c9tx00220k. [DOI] [PMC free article] [PubMed] [Google Scholar]
- Le L.; Jiang B. P.; Wan W. T.; Zhai W.; Xu L. J.; Hu K. P.; Xiao P. G. Metabolomics reveals the protective of Dihydromyricetin on glucose homeostasis by enhancing insulin sensitivity. Sci. Rep. 2016, 6, 36184 10.1038/srep36184. [DOI] [PMC free article] [PubMed] [Google Scholar]
- Hu H. C.; Luo F.; Wang M. J.; Fu Z. H.; Shu X. G. New Method for Extracting and Purifying Dihydromyricetin from Ampelopsis grossedentata. ACS Omega 2020, 5, 13955–13962. 10.1021/acsomega.0c01222. [DOI] [PMC free article] [PubMed] [Google Scholar]
- Fan L. L.; Qu X. S.; Yi T.; Peng Y.; Jiang M. J.; Miao J. H.; Xiao P. G. Metabolomics of the Protective Effect of Ampelopsis grossedentata and Its Major Active Compound Dihydromyricetin on the Liver of High-Fat Diet Hamster. Evidence-Based Complementary Altern. Med. 2020, 2020, 3472578 10.1155/2020/3472578. [DOI] [PMC free article] [PubMed] [Google Scholar]
- Silva J.; Yu X.; Moradian R.; Folk C.; Spatz M. H.; Kim P.; Bhatti A. A.; Davies D. L.; Liang J. Dihydromyricetin Protects the Liver via Changes in Lipid Metabolism and Enhanced Ethanol Metabolism. Alcohol.: Clin. Exp. Res. 2020, 44, 1046–1060. 10.1111/acer.14326. [DOI] [PMC free article] [PubMed] [Google Scholar]
- Wang Q.; Wang Y. D.; Li Y.; Wen B. Y.; Dai Z.; Ma S. C.; Zhang Y. J. Identification and characterization of the structure–activity relationships involved in UGT1A1 inhibition by anthraquinone and dianthrone constituents of Polygonum multiflorum. Sci Rep. 2017, 7, 17952 10.1038/s41598-017-18231-y. [DOI] [PMC free article] [PubMed] [Google Scholar]
- Wang Q.; Dai Z.; Wen B. Y.; Ma S. C.; Zhang Y. J. Estimating the Differences of UGT1A1 Activity in Recombinant UGT1A1 Enzyme, Human Liver Microsomes and Rat Liver Microsome Incubation Systems in Vitro. Biol. Pharm. Bull. 2015, 38, 1910–1917. 10.1248/bpb.b15-00513. [DOI] [PubMed] [Google Scholar]
- Björnsson E.; Davidsdottir L. The long-term follow-up after idiosyncratic drug-induced liver injury with jaundice. J. Hepatol. 2009, 50, 511–517. 10.1016/j.jhep.2008.10.021. [DOI] [PubMed] [Google Scholar]
- Hunter E. B.; Johnston P. E.; Tanner G.; Pinson C. W.; Awad J. A. Bromfenac (Duract)-associated hepatic failure requiring liver transplantation. Am. J. Gastroenterol. 1999, 94, 2299–2301. 10.1111/j.1572-0241.1999.01321.x. [DOI] [PubMed] [Google Scholar]
- Xie C.; Zhong D. F.; Chen X. Y. A fragmentation-based method for the differentiation of glutathione conjugates by high-resolution mass spectrometry with electrospray ionization. Anal. Chim. Acta 2013, 788, 89–98. 10.1016/j.aca.2013.06.022. [DOI] [PubMed] [Google Scholar]
- de Oliveira M. R.; de Souza I. C. C.; Fürstenau C. R. Promotion of mitochondrial protection by naringenin in methylglyoxal-treated SH-SY5Y cells: Involvement of the Nrf2/GSH axis. Chem.-Biol. Interact. 2019, 310, 1–9. 10.1016/j.cbi.2019.108728. [DOI] [PubMed] [Google Scholar]
- Fürstenau C. R.; de Souza I. C. C.; de Oliveira M. R. Tanshinone I Induces Mitochondrial Protection by a Mechanism Involving the Nrf2/GSH Axis in the Human Neuroblastoma SH-SY5Y Cells Exposed to Methylglyoxal. Neurotoxic. Res. 2019, 36, 491–502. 10.1007/s12640-019-00091-1. [DOI] [PubMed] [Google Scholar]
- Strange R. C.; Spiteri M. A.; Ramachandran S.; Fryer A. A. Glutathione-S-transferase family of enzymes. Mutat. Res. 2001, 482, 21–26. 10.1016/S0027-5107(01)00206-8. [DOI] [PubMed] [Google Scholar]
- Gravina P.; Spoletini I.; Masini S.; Valentini A.; Vanni D.; Paladini E.; Bossù P.; Caltagirone C.; Federici G.; Spalletta G.; Bernardini S. Genetic polymorphisms of glutathione S-transferases GSTM1, GSTT1, GSTP1 and GSTA1 as risk factors for schizophrenia. Psychiatry Res. 2011, 187, 454–456. 10.1016/j.psychres.2010.10.008. [DOI] [PubMed] [Google Scholar]
- Liu F. P.; Lin Y. X.; Li Z.; Ma X.; Han Q.; Liu Y. S.; Zhou Q.; Liu J. L.; Li R.; Li J. C.; Gao L. Glutathione S-transferase A1 (GSTA1) release, an early indicator of acute hepatic injury in mice. Food Chem. Toxicol. 2014, 71, 225–230. 10.1016/j.fct.2014.06.011. [DOI] [PubMed] [Google Scholar]
- Yang Y.; Li F.; Wei S.; Liu X.; Wang Y.; et al. Metabolomics profiling in a mouse model reveals protective effect of Sancao granule on Con A-Induced liver injury. J. Ethnopharmacol. 2019, 238, 1–9. 10.1016/j.jep.2019.111838. [DOI] [PubMed] [Google Scholar]
- Peters G. J.; Veerkamp J. H.. Pyrimidine Metabolism in Rat Brain Cortex and Liver. In Purine Metabolism in Man-IV; De Bruyn C. H. M. M.et al. , Eds.; Advances in Experimental Medicine and Biology; Springer, 1984; Vol. 165, pp 531–534. [DOI] [PubMed] [Google Scholar]
- Zhao J.; Xie C.; Wang K. L.; Takahashi S.; Krausz K. W.; Lu D. S.; Wang Q.; Luo Y. H.; Gong X. Q.; Mu X. Y.; Wang Q.; Su S. W.; Gonzalez F. J. Comprehensive analysis of transcriptomics and metabolomics to understand triptolide-induced liver injury in mice. Toxicol. Lett. 2020, 333, 290–302. 10.1016/j.toxlet.2020.08.007. [DOI] [PMC free article] [PubMed] [Google Scholar]
- Gál E. M.; Sherman A. D. L-Kynurenine Its synthesis and possible regulatory function in brain. Neurochem. Res. 1980, 5, 223–239. 10.1007/BF00964611. [DOI] [PubMed] [Google Scholar]
- Wei D. D.; Wang J. S.; Wang P. R.; Li M. H.; Yang M. H.; Kong L. Y. Toxic effects of chronic low-dose exposure of thioacetamide on rats based on NMR metabolic profiling. J. Pharm. Biomed. Anal. 2014, 98, 334–338. 10.1016/j.jpba.2014.05.035. [DOI] [PubMed] [Google Scholar]
- An Z. L.; Li C.; Lv Y. L.; Li P. F.; Wu C.; Liu L. H. Metabolomics of Hydrazine-Induced Hepatotoxicity in Rats for Discovering Potential Biomarkers. Dis. Markers 2018, 2018, 1–12. 10.1155/2018/8473161. [DOI] [PMC free article] [PubMed] [Google Scholar]
- Wang Q. X.; Liu D. X.; Song P.; Zou M. H. Tryptophan-kynurenine pathway is dysregulated in inflammation, and immune activation. Front. Biosci. 2015, 20, 1116–1143. 10.2741/4363. [DOI] [PMC free article] [PubMed] [Google Scholar]
- Dong Q.; Li N.; Li Q.; Zhang C. E.; Feng W. W.; Li G. Q.; Li R. Y.; Tu C.; Han X.; Bai Z. F.; Zhang Y. M.; Niu M.; Ma Z. J.; Xiao X. H.; Wang J. B. Screening for biomarkers of liver injury induced by Polygonum multiflorum: a targeted metabolomic study. Front. Pharmacol. 2015, 6, 217 10.3389/fphar.2015.00217. [DOI] [PMC free article] [PubMed] [Google Scholar]
- Ferslew B. C.; Xie G. X.; Johnston C. K.; Su M. M.; Stewart P. W.; Jia W.; Brouwer K. L.; Barritt A. S. 4th. Altered Bile Acid Metabolome in Patients with Nonalcoholic Steatohepatitis. Dig. Dis. Sci. 2015, 60, 3318–3328. 10.1007/s10620-015-3776-8. [DOI] [PMC free article] [PubMed] [Google Scholar]
- Ma Z. J.; Li Q.; Zhao K. J.; Wang J. B.; Xiao X. H. Dynamic serum metabolomics study of liver injury in rats caused by Polygonum multifulorum. Zhongguo Zhong Yao Za Zhi 2017, 42, 152–156. 10.19540/j.cnki.cjcmm.20161222.00. [DOI] [PubMed] [Google Scholar]
- Gonzalez E.; Liempd S. V.; Conde-Vancells J.; Juan G. D.; Perez-Cormenzana M.; Mayo R.; Berisa A.; Alonso C.; Marquez C. A.; Barr J.; et al. Serum UPLC-MS/MS metabolic profiling in an experimental model for acute-liver injury reveals potential biomarkers for hepatotoxicity. Metabolomics 2012, 8, 997–1011. 10.1007/s11306-011-0329-9. [DOI] [PMC free article] [PubMed] [Google Scholar]
- Zhao Y. Y.; Tang D. D.; Chen H.; Mao J. R.; Bai X.; Cheng X. H.; Xiao X. Y. Urinary metabolomics and biomarkers of aristolochic acid nephrotoxicity by UPLC-QTOF/HDMS. Bioanalysis 2015, 7, 685–700. 10.4155/bio.14.309. [DOI] [PubMed] [Google Scholar]
- Li M. J.; Wang X. F.; Aa J. Y.; Qin W. S.; Zha W.; et al. GC/TOFMS analysis of metabolites in serum and urine reveals metabolic perturbation of TCA cycle in db/db mice involved in diabetic nephropathy. Am. J. Physiol.: Renal Physiol. 2013, 304, F1317–F1324. 10.1152/ajprenal.00536.2012. [DOI] [PubMed] [Google Scholar]
Associated Data
This section collects any data citations, data availability statements, or supplementary materials included in this article.


