

Abstract
Per- and polyfluoroalkyl substances (PFAS), polybrominated diphenyl ethers (PBDEs), and organophosphate esters (OPEs) are found in building materials and associated with thyroid disease, infertility, and impaired development. This study’s objectives were to 1) compare levels of PFAS, PBDEs, and OPEs in dust from spaces with conventional versus “healthier” furniture and carpet, and 2) identify other product sources of flame retardants in situ. We measured 15 PFAS, 8 PBDEs, and 19 OPEs in dust from offices, common areas, and classrooms having undergone either no intervention (conventional rooms in older buildings meeting strict fire codes; n=12), full “healthier” materials interventions (rooms with “healthier” materials in buildings constructed more recently or gut-renovated; n=7), or partial interventions (other rooms with at least “healthier” foam furniture but more potential building contamination; n=28). We also scanned all materials for bromine and phosphorus as surrogates of PBDEs and OPEs respectively, using x-ray fluorescence. In multilevel regression models, rooms with full “healthier” materials interventions had 78% lower levels of PFAS (p<0.01). Rooms with full “healthier” interventions also had 65% lower OPE levels in dust than rooms with no intervention (p<0.01) and 45% lower PBDEs than rooms with only a partial intervention (p<0.10), adjusted for covariates related to insulation, electronics, and furniture. Bromine loadings from electronics in rooms were associated with PBDE concentrations in dust (p<0.05), and the presence of exposed insulation was associated with OPE dust concentrations (p<0.001). Full “healthier” materials renovations successfully reduced chemical classes in dust. Future interventions should address electronics, insulation, and building cross-contamination.
Keywords: buildings, products, chemicals, flame retardants, dust, offices
1. Introduction
The products that furnish buildings contain complex mixtures of chemicals (Lucattini et al., 2018). Many chemicals can migrate out of products and into indoor environments (Mitro et al., 2016; Rauert et al., 2014; Tokranov et al., 2018), exposing people via dust ingestion, inhalation, and dermal sorption (Johnson-Restrepo and Kannan, 2009; Kim et al., 2019; Poothong et al., 2020). Several studies have linked the concentrations in dust and air to higher body burdens of these chemicals (Cequier et al., 2015; Frederiksen et al., 2010; Koponen et al., 2018; Watkins et al., 2011). Thus, the pathway from source to environmental media, exposure, and body burden has been well established for chemicals used in building products. An upstream intervention on the product sources of harmful chemical classes presents a public health opportunity to reduce exposure. Recently, some organizations have incorporated the science on toxic chemical classes into their product procurement practices and moved towards purchasing “healthier” materials, but there is still a lack of peer-reviewed evidence on the exposure reduction benefits of using these materials. Per- and polyfluoroalkyl substances (PFAS) and chemical flame retardants (FRs) are two classes of chemicals found in building furnishings that are of particular concern.
PFAS are a class of extremely persistent, highly fluorinated aliphatic chemicals widely used as stain- and water-repellant coatings in furniture, carpet, clothing, disposable food packaging, non-stick pans, and building materials (Sunderland et al., 2018). Research has found PFAS exposure to be associated with thyroid disease, impairment of fetal development, immune system suppression, high cholesterol, and possibly obesity, diabetes, kidney cancer, and testicular cancer (Barry et al., 2013; Liew et al., 2018; Lin et al., 2019; Rappazzo et al., 2017; Stanifer et al., 2018; Sunderland et al., 2018; Xiao et al., 2019).
Polybrominated diphenyl ethers (PBDEs) are a class of 209 congeners used as chemical flame retardants in foam furniture, carpet, electronics, and insulation to comply with fire codes (Cooper et al., 2016; Jinhui et al., 2017; Kemmlein et al., 2003). The increasing use of PBDEs in foam products across the U.S. market was catalyzed by California’s first flammability standard for interior foam filling in upholstered furniture (Technical Bulletin [TB] 117) passed in 1975 (Dodson et al., 2017; Petreas et al., 2016). In 1991, a new standard, TB 133, required even stricter flammability tests for furniture in publicly occupied spaces (Dodson et al., 2017). Human exposure to PBDEs is associated with adverse health effects on thyroid function, reproductive success, and reproductive and brain development (Allen et al., 2016; Boas et al., 2012; Choi et al., 2019; Czerska et al., 2013; Johnson et al., 2013; Linares et al., 2015; Mumford et al., 2015; Vuong et al., 2018).
Even when certain chemicals in the PFAS and PBDE classes were found to be harmful and were largely removed from production, they have often been replaced with other similar chemicals with human health concerns. For example, two of the most well-known PFAS, perfluorooctanoate (PFOA) and perfluorooctane sulfonate (PFOS), were voluntarily phased out by manufacturers in the early 2000s in the U.S. (Wang et al., 2015a). However, new replacement PFAS, including short-chain alternatives and precursors that break down into legacy PFAS, may be just as concerning for health (Wang et al., 2015b, 2013; Z. Wang et al., 2017). In fact, over 4,700 different PFAS are currently available (OECD, 2018). Due to the health concerns of PBDEs, two commercial flame retardant mixtures, penta-BDE and octa-BDE, were also voluntarily phased out in the U.S. in 2004, followed by deca-BDE in 2013 (Dodson et al., 2012). Similar to the substitution of legacy PFAS, PBDEs were often simply replaced with other organohalogenated flame retardants and organophosphate esters (OPEs), which have been found in recent research to be associated with similar adverse effects on thyroid function, pregnancy outcomes and fertility, and development (Carignan et al., 2018, 2017; Doherty et al., 2019a, 2019b; Meeker and Stapleton, 2010; Messerlian et al., 2018; Preston et al., 2017; Wang et al., 2019).
PFAS, PBDEs, and OPEs have been used ubiquitously in building furnishings and have been found in the blood or urine of over 90% of Americans as a result (Calafat et al., 2007; Ospina et al., 2018; Sjödin et al., 2008). Despite widespread concerns about these chemical classes, to our knowledge there have been no studies assessing interventions to reduce PFAS indoors. Only a few research studies have been able to evaluate interventions on flame retardants. Stubbings et al. found that several OPEs were significantly reduced in dust after swapping in FR-free nap mats in childcare centers (Stubbings et al., 2018). Another study reported a significant decline in FRs on hand wipes of gymnasts after replacing pit foam with FR-free alternatives (Dembsey et al., 2019). Recently, the loosening of TB 117 to the less strict TB 117–2013 (effective as of 2014) and the repeal of TB 133 in 2019 have laid the foundation to enable reductions in chemical flame retardant use in upholstered furniture (State of California, 2019, 2013).
One of the limitations with previous studies of interventions was the inability to nondestructively screen chemicals in products in situ in order to identify important driving product sources and to inform future interventions. Research has shown that handheld x-ray fluorescence (XRF) instruments can measure elemental bromine as a way to reliably screen products for the total potential content of PBDEs and other brominated FRs (Allen et al., 2008a; Gallen et al., 2014; Petreas et al., 2016; Stapleton et al., 2011). In fact, XRF-measured bromine levels in furniture and/or electronics have been significantly associated with PBDE concentrations in house dust (Allen et al., 2008a) and human blood (Imm et al., 2009). Similarly, XRF-measured phosphorus may also serve as a useful surrogate for total OPE levels in products, although there has been less research and validation of this method (Petreas et al., 2016).
For this study, we evaluated a chemical class-based “healthier” materials intervention at a university which, since 2017, has renovated over a dozen buildings with furniture, carpet, and other products specified by manufacturers as free of the entire classes of PFAS and flame retardants (often customized as so for the first time). The objectives of this study were to: 1) measure levels of 42 PFAS, PBDEs, and OPEs in indoor dust from spaces with “healthier” materials compared to analogous samples from conventional spaces, and 2) identify important sources of flame retardants in the buildings using XRF product screening for bromine and phosphorus.
2. Methods
2.1. Study Design
We sampled indoor dust in 47 rooms from 21 buildings at a university in the northeastern U.S. Specifically, we studied six office suites, 23 common rooms, and 18 classrooms.
We first selected as many rooms as possible that were renovated with “healthier” materials (n=22), including furniture and carpet specified by manufacturers in product purchasing agreements as free of all PFAS and chemical FRs. “Healthier” furniture included most non-fixed furnishings, except electronics or any existing furniture that was kept. Trace contamination thresholds for “healthier” product procurement agreements were 100 ppm for PFAS and 1000 ppm for FRs by weight (the same FR threshold as TB 117–2013). The furniture also could not contain over 1% polyvinyl chloride. The interventions were conducted in 2017 through 2019, mostly in pre-existing buildings (86%).
We selected an equivalent set of carpeted room types that did not undergo “healthier” materials interventions and were refurnished as recently as possible (n=25). In five cases, we were able to sample a conventional room in a building that had a “healthier” room on a different floor in order to maximize comparability. Occasionally sampling multiple rooms within a building, if different enough in function or characteristics, also helped increase the sample size of available “healthier” rooms and recently renovated conventional spaces.
Construction years were similar for “healthier” rooms (median 1970; range 1863–2018) and conventional rooms (median 1965; range 1863–2017). Years of last refurnishing ranged from 2017 to 2019 (median 2018) for “healthier” and 2001 to 2019 (median 2016) for conventional rooms. Rooms were vacuumed at least twice weekly and never had stain-repellant coatings applied to carpets. Only two conventional rooms were naturally, not mechanically, ventilated.
2.2. “Healthier” Materials Intervention Classifications
Given the spectra of “healthier” materials statuses in the studied rooms, we decided to categorize the spaces into three groups: no intervention, partial intervention, and full “healthier” materials intervention. We avoided more than three categories to ensure reasonable sample sizes within each group and parsimony for statistical modeling.
“No intervention” = rooms in older buildings constructed before the 2004 phase-out of most PBDEs and that had foam furniture meeting historically stringent flammability standards (TB 117 or 133).
“Full ‘healthier’ materials intervention” = rooms that were 1) renovated with furniture and carpet specified as free of PFAS and FRs, and 2) in buildings built after the 2004 PBDE phase-out or that had renovated the entire floor to be “healthier” (i.e. no adjacent contamination from conventional spaces).
“Partial intervention” = All other rooms, including 1) conventional spaces built after the 2004 PBDE phase-out or likely with fewer FRs in foam furniture (under the TB 117–2013 option), and 2) rooms with “healthier” materials with potential cross contamination from the old building and connection to adjacent conventional spaces.
Note than none of the buildings were constructed between 2002 and 2006, so any transition period after the 2004 phase-out for manufacturers to sell old stocks of products would likely not impact our classifications of buildings.
2.3. Dust Sample Collection
We collected a dust sample in each room between January and March 2019, at least two months after any intervention. We asked custodial crews to leave the space unvacuumed for 2–3 days to increase dust mass. For each sample, we vacuumed floor dust (including underneath furniture) for 10 minutes using a vacuum cleaner (Dyson CY18) with an attached crevice tool that housed a cellulose extraction thimble (secured with a nitrile rubber o-ring) to collect dust. Dust only came into contact with crevice tools, which were cleaned with isopropyl alcohol and tap water between samples. Our sampling followed published protocols (Allen et al., 2008b; Fraser et al., 2013). After vacuuming, the thimbles were stored in polypropylene centrifuge tubes in polyethylene bags in a −13°C freezer. We collected five field blanks by carrying unopened centrifuge tubes on multiple different sampling days.
2.4. PFAS and FRs in Dust
Dust samples and field blanks were analyzed for 15 PFAS, eight PBDEs, and 19 OPEs, following previously published methods (Johnson-Restrepo and Kannan, 2009; Kim and Kannan, 2007; Kim et al., 2019, 2017). The PFAS analytes included PFOS, PFOA, perfluorohexanoate (PFHxA), perfluorohexane sulfonate (PFHxS), perfluorooctane sulfonamide (FOSA), perfluoroheptanoate (PFHpA), perfluoropentanoate (PFPeA), perfluorononanoate (PFNA), perfluorobutane sulfonate (PFBS), perfluorodecane sulfonate (PFDS), perfluorobutanoate (PFBA), perfluorodecanoate (PFDA), perfluoroundecanoate (PFUnDA), perfluorododecanoate (PFDoDA), and n-methyl perfluorooctane sulfonamidoacetic acid (N-MeFOSAA). The PBDE analytes included congeners 28, 47, 99, 100, 153, 154, 183, and 209. The OPE analytes included tris(2-butoxyethyl) phosphate (TBOEP), tris(1-chloro-2-propyl) phosphate (TCIPP), tris(1,3-dichloro-2-propyl) phosphate (TDCIPP), triphenyl phosphate (TPHP), tris(2-chloroethyl) phosphate (TCEP), 2-ethylhexyl diphenyl phosphate (EHDPP), isodecyl diphenyl phosphate (IDDP), tri-iso-butyl phosphate (TIBP), tripropyl phosphate (TPP), cresyl diphenyl phosphate (CDPP), tert-butylphenyl diphenyl phosphate (BPDP), tri-n-butyl phosphate (TNBP), tetrakis(2-chloroethyl) dichloroisopentyl diphosphate (V6), bisphenol a bis(diphenyl phosphate) (BDP), resorcinol bis(diphenyl phosphate) (RDP), tris(2-ethylhexyl) phosphate (TEHP), tris(methylphenyl) phosphate (TMPP), triethyl phosphate (TEP), and tris(p-tert-butylphenyl) phosphate (TBPHP).
PFAS concentrations were measured using high-performance liquid chromatography (HPLC) coupled with electrospray triple quadrupole tandem mass spectrometry (ESI-MS/MS) and monitored by multiple reaction monitoring mode under negative ionization. OPEs were measured with HPLC coupled with ESI-MS/MS, using electrospray positive ionization multiple reaction monitoring. PBDEs were measured with a gas chromatographer coupled with a mass spectrometer (GC-MS) using electronic impact ionization mode. The limits of detection (LODs) ranged from 0.1–0.8 ng/g for OPEs, 0.09–4.5 ng/g for PBDEs, and 0.06–1.5 ng/g for PFAS.
Before instrumental analysis, the dust samples were first sieved through a 150-μm stainless steel mesh. The samples (with masses ranging from 0.2 to 0.5 g) were then spiked with 30 ng each of labeled surrogate standard mixture. The samples were extracted with methanol (3 mL) under mechanical oscillation (1 h) followed by ultrasonication (30 min). Then, the dust extracts were centrifuged (3500g, 10 min) and transferred into new polypropylene tubes. The extraction was repeated twice with acetonitrile (3 mL) and ethyl acetate (3 mL), after which the extracts were combined and evaporated to 3 mL under a gentle stream of nitrogen. The extracts were split into three aliquots for the measurement of PFAS, PBDEs, and OPEs. The extracts evaporated to near dryness and were then reconstituted with 200 μL of solvents: methanol for PFAS, hexane for PBDEs, and water/methanol (4/6; v/v) for OPEs. Before instrumental analysis, the sample extracts were filtered through a 0.2 μm nylon filter into glass vials.
All field blanks either had values below the LOD or detected concentrations well below the levels in samples. The spiked recovery results were 67.4–104% for PFAS, 59.0–128% for OPEs, and 101–115% for PBDEs, respectively. We split and analyzed duplicates of seven dust samples in the same batch using the same method for quality assurance and quality control (QA/QC) and calculated median relative percent differences of 0% (range: −62–190%) for PFAS, −3.2% (range: −50–80%) for PBDEs, and 0% (range: −96–52%) for OPEs. There was some variability in chemical levels in the duplicates, likely due to the natural heterogeneity of dust. Detailed QA/QC data and typical chromatograms of target analytes are provided in Tables S1–S3 and Figures S1–S3 in the Supplemental Materials.
2.5. Screening Products for Bromine and Phosphorus
We returned to all rooms between September and October 2019 to characterize potential sources of FRs and corroborate differences in content of conventional versus “healthier” products. Only two of the 47 rooms had a few missing furniture pieces since the earlier dust sampling. We noted the counts and surface areas of all product types. For upholstered foam furniture, we recorded its compliance to a particular flammability standard (if tag was present).
We screened the materials within each room for bromine and phosphorus content (as surrogates for PBDEs and OPEs, respectively) using two handheld, non-destructive XRF instruments. XRF has been reliably used in numerous previous studies to measure bromine as a surrogate for PBDEs (Allen et al., 2008a; Gallen et al., 2014; Imm et al., 2009; Petreas et al., 2016; Stapleton et al., 2011), By contrast, XRF-measured phosphorus as a surrogate for OPEs in products has been less studied and should be interpreted with more caution. One study analyzed phosphorus in furniture using XRF and advised against classifying a product as OPE-free based on XRF data alone (Petreas et al., 2016). However, phosphorus measurements should be a useful surrogate to statistically model patterns in sources of OPEs because exposure misclassification issues arise from models relying on raw counts of furniture and electronics in rooms (Allen et al., 2008a). Fluorine (a PFAS surrogate) was too light an element to be detectable.
The Olympus Innov-x XRF with a consumer product (RoHS) testing mode was used to measure bromine but could not detect phosphorus. We took minimum 15-second measurements with this instrument by holding it still against the product. The more sensitive Thermo Fisher Scientific Niton xl3t GOLDD+ XRF was used to measure phosphorus. We could only use the TestAllGeo mode (hereby referred to as “geo”) designed for geological samples. Spectral data from this instrument can also be analyzed for bromine, and post-hoc we found extremely strong correlations between the two instruments/modes, even when measured on different spots of the products, which suggests the geo mode did not produce significant interference in modeling (foam furniture: Spearman r=0.91, p<0.0001; all products: r=0.65, p<0.0001). We programmed the Niton XRF to collect measurements with 15 seconds in the main element range and 30 seconds in the light element range (an advanced feature to capture phosphorus). The XRF measurements penetrate deep enough to capture concentrations inside foam filling of furniture. The LODs were expected to be approximately 10 ppm for bromine and 20 ppm for phosphorus.
We took at least one measurement (on each XRF) for most products in the rooms, but focused on foam furniture, carpet, insulation, and electronics as FR sources. For carpet and televisions, we measured two different spots for up to two different items of each model. Measurements of electronics were taken on the external plastic housing (when possible). For foam furniture, we also measured two different spots (on both the seat cushion and seatback) for up to two items. Some products on ceilings (e.g. insulation, routers, speakers) could not be reached for scanning.
2.6. Statistical Analyses
We blank-corrected the concentrations of chemicals in dust by subtracting the average field blank value. Concentrations below the LOD in dust were substituted with half the LOD (Hornung and Reed, 1990). For statistical models, we log-transformed the concentration data (due to non-normal distributions in histograms and Shapiro-Wilk tests). First, we performed principal component analysis on scaled and centered PBDE concentrations to identify congener groupings according to commercial flame-retardant mixtures. We evaluated principal components together explaining at least 70% of the variance.
For modeling covariates, we calculated room loadings of bromine and phosphorus from foam furniture and electronics separately by taking the sum of each unique product type’s mean element concentration multiplied by its surface area and count, following Equation 1 and a previous protocol (Allen et al., 2008a). For foam furniture loadings, we included chairs, armchairs, couches, foam ottomans, pillows, and foam drawer tops. Electronics included televisions, computers, projector systems and screens, routers, keyboards, computer mice, telephones, speakers, TV remotes, tablets, power strips, plug ports, printers, portable scanners, floor outlets, server kits, audio radiators, and DVD or video game players. Non-detect XRF measurements were conservatively substituted with zero for loading calculations, but we added one to all concentrations so we could log-transform the non-normally distributed data for modeling. Occasionally when some ceiling electronics (such as routers) were not able to be measured, we borrowed the result for an identical product elsewhere in the building.
| Equation 1. |
We conducted multilevel models for the chemical classes in dust, with a random intercept for the building because some rooms were sampled within the same building. As covariates, we included the three-category “healthier” materials intervention status (conducted with the reference as “none” and as “partial” based on interpretability and largest sample size, respectively), a binary variable for exposed insulation in or immediately adjacent to the room (reference=no), tertiles of element loadings from foam furniture (reference=low), and tertiles of element loadings from electronics (reference=low). We did not use an element loading variable for insulation because insulated pipes on ceilings were not always accessible for measurement. To present model results, we transformed estimates back to the linear scale and reported them as percent differences (since the dependent variables were log-transformed).
To model the association between furniture characteristics and element concentrations in products, we conducted multilevel models with two random intercepts for the room and specific product (to account for expected correlation between products within a room and between replicate items or cushions of the same product). We included three categorical covariates: the flammability standard the furniture was labeled to comply with (reference=“healthier”; TB 117–2013 with no added FRs; TB 117 or 117–2013 with added FRs; TB 133; and unlabeled), type of foam furniture (reference=chair; fully upholstered armchair; couch; ottoman), and measurement spot (reference=seat; seatback cushion). We evaluated statistical significance at α=0.05 and suggestive evidence at α=0.10. All statistical analyses were performed in R (version 3.3.1).
3. Results
3.1. Per- and Polyfluoroalkyl Substances in Dust
PFAS were detected in 100% of our dust samples (n=47) from offices, common areas, and classrooms (Table S4). The most frequently detected PFAS were PFHxA at 98%, PFOS at 98%, PFOA at 75%, PFHxS at 64%, FOSA at 60%, and PFHpA at 51%. Tables S4 and S5 present summary statistics by intervention and room type.
The total concentrations of PFAS in dust tended to be the lowest in the rooms with full “healthier” materials interventions and highest in rooms with no interventions (Figure 1). The geometric mean total Σ15PFAS concentrations were 262 ng/g (range: 18.1–8,310 ng/g) overall, 481 ng/g (225–1,140 ng/g) in rooms with no interventions, 252 ng/g (18.1–8,310 ng/g) in rooms with partial “healthier” materials interventions, and 108 ng/g (43.6–243 ng/g) in rooms with full “healthier” materials interventions (Table S4). PFHxA, PFOS, and PFOA dominated the geometric mean profiles of PFAS analytes in dust across intervention statuses, although concentrations were much lower in the “healthier” rooms (Figure 2).
Figure 1.
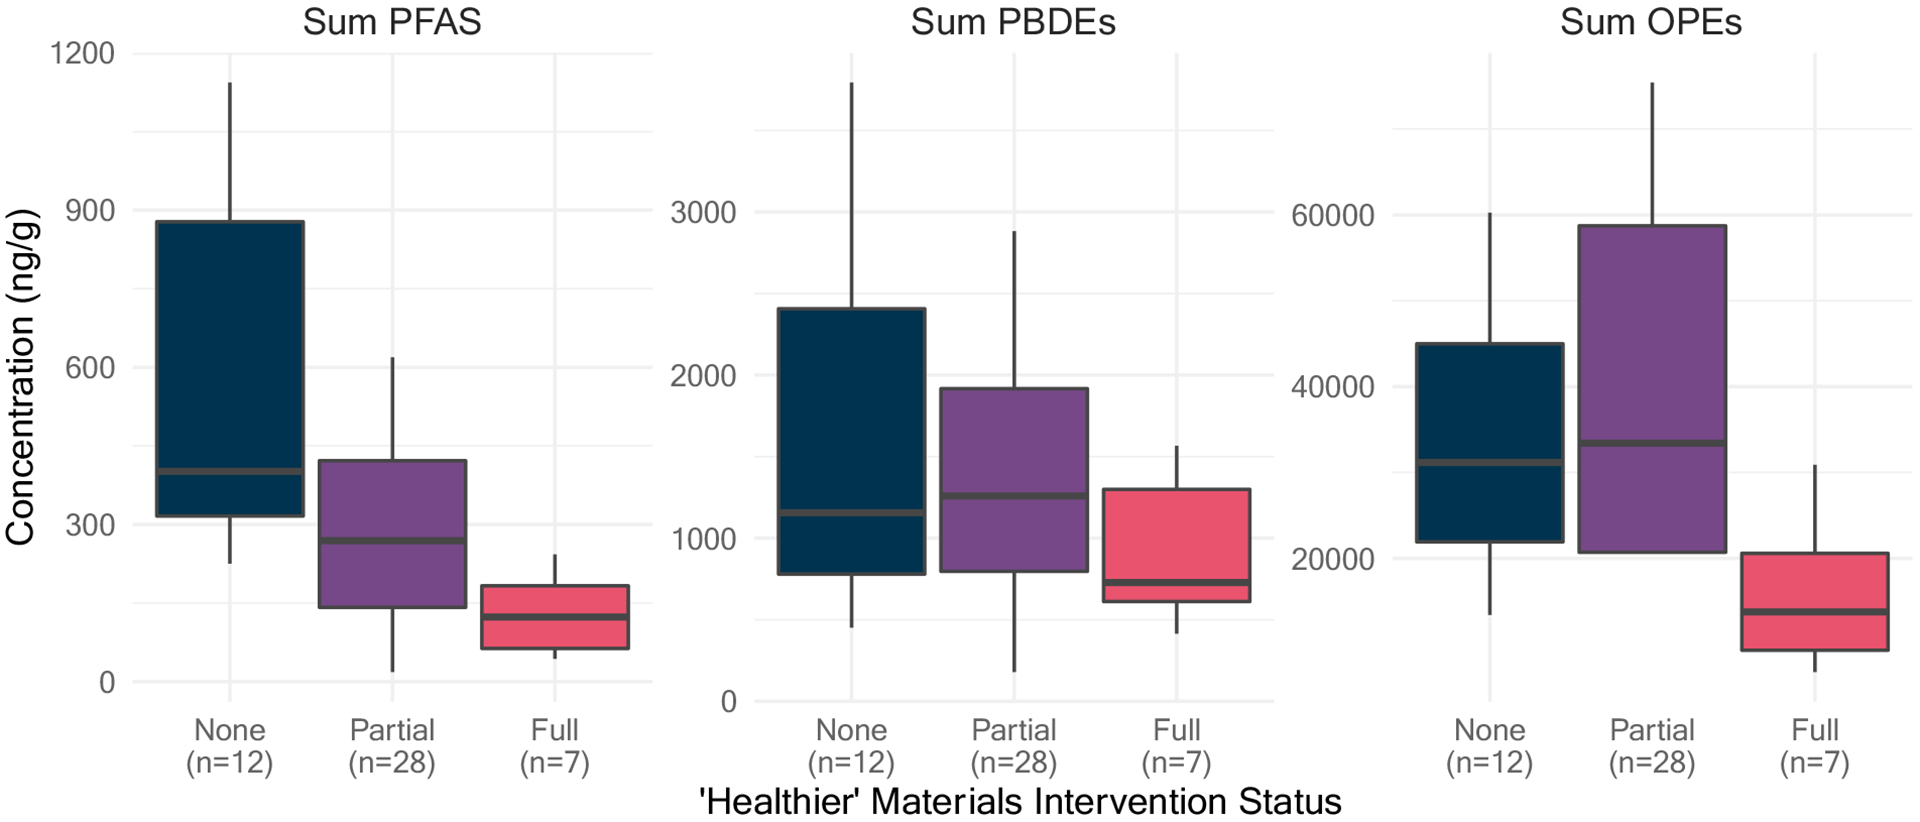
Boxplots of concentrations (ng/g) of Σ15PFAS, Σ8PBDEs, and Σ19OPEs in indoor dust samples by “healthier” materials intervention status, with outliers excluded to obtain tighter y-axis scales (n=47).
Figure 2.
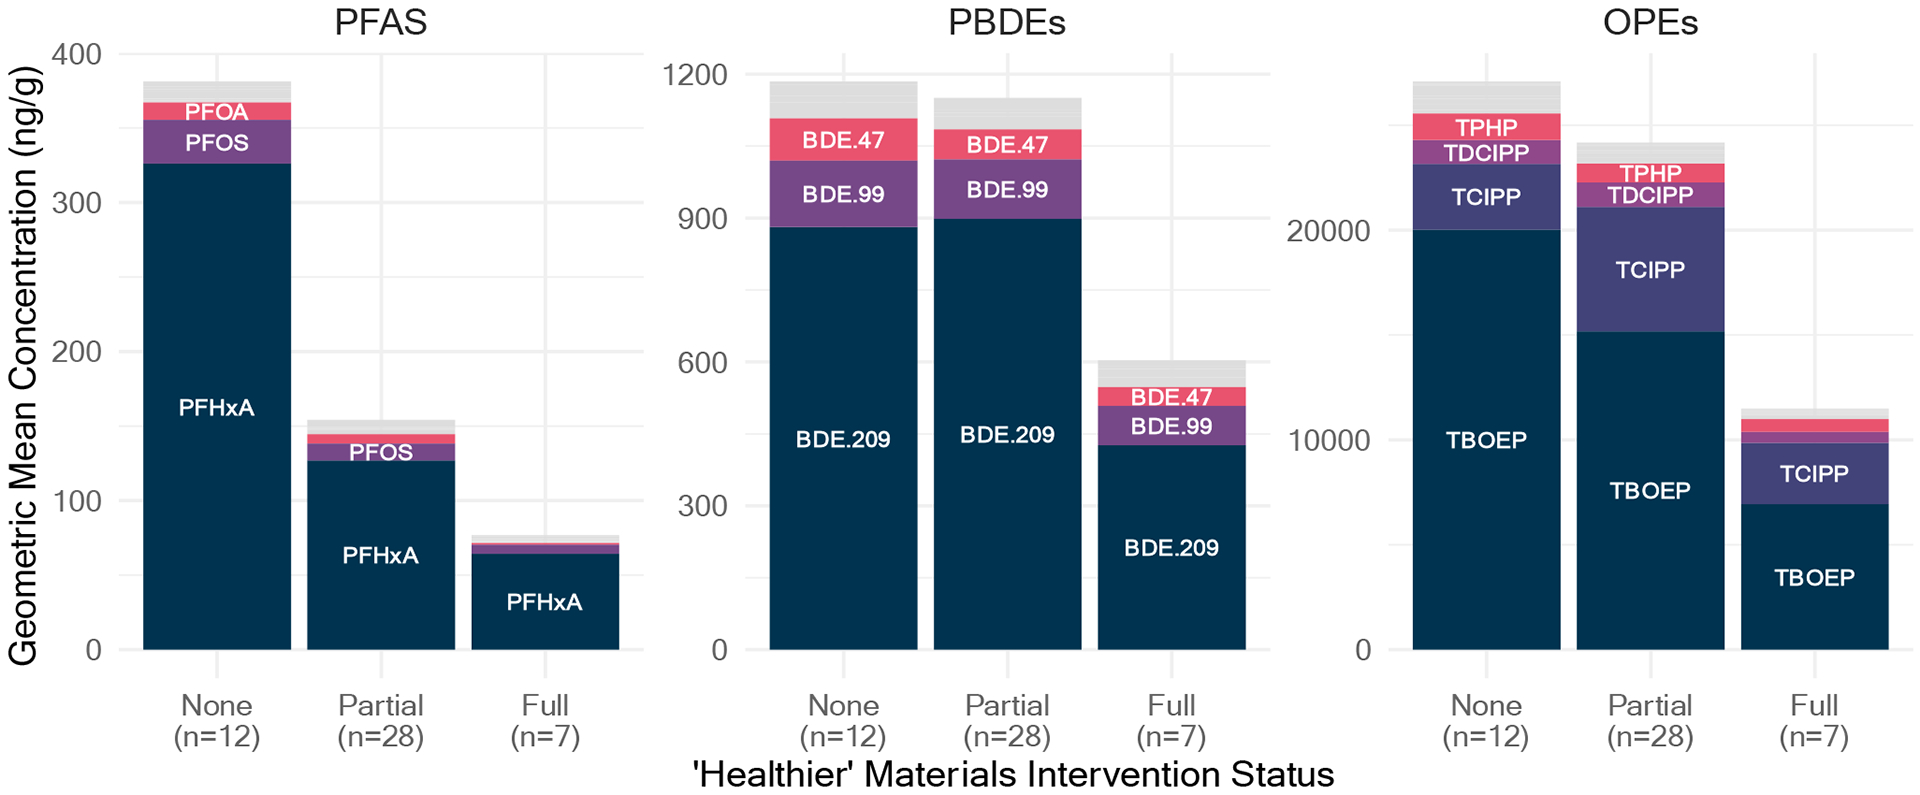
Geometric mean concentrations (ng/g) of each main PFAS, PBDE, and OPE analyte in indoor dust samples (n=47) by “healthier” materials intervention status.
Note: chemicals that had relatively very small geometric mean concentrations were shaded grey and not distinguished.
In a multilevel regression model, rooms with full “healthier” materials interventions had 78% (95% CI: 38–92%) lower Σ15PFAS concentrations in dust than rooms with no interventions (p=0.006) (Table 1). The spaces with full “healthier” materials interventions even had 68% (95% CI: 15–88%) lower Σ15PFAS concentrations in dust than rooms with partial interventions (p=0.02). About 71% of the variability in log PFAS concentrations was attributable to differences between rooms within a building as opposed to differences across buildings.
Table 1.
Results from multilevel models of the impact of “healthier” materials intervention status, presence of exposed insulated pipes, flame retardant-related element loadings in furniture, and element loadings in electronics (bromine [Br] for PBDEs; phosphorus [P] for OPEs) on total concentrations (ng/g) of 15 PFAS, 8 PBDEs, and 19 OPEs in indoor dust samples (n=47).
| n | Sum of 15 PFAS | Sum of 8 PBDEs | Sum of 19 OPEs | ||||
|---|---|---|---|---|---|---|---|
| ‘Healthier’ Materials Intervention Status | |||||||
| 12 | 47% (0.3) | −33.7% (0.2) | 7.93% (0.7) | ||||
| 28 | Referenceb | Referenceb | Referenceb | ||||
| 7 | −67.5% (0.02) * | −45.2% (0.09) . | −62.2% (<0.001) *** | ||||
| Exposed Insulation in Room | |||||||
| 41 | Not included | Reference | Reference | ||||
| 6 | Not included | 24.8% (0.5) | 176% (<0.001) *** | ||||
| Br or P Loadingc from Foam Furniture | For bromine: | For phosphorus: | |||||
| 16 | Not included | Reference | Reference | ||||
| 15 | Not included | −12.6% (0.6) | −26.8% (0.2) | ||||
| 16 | Not included | 86.2% (0.04) * | 0.393% (1.0) | ||||
| Br or P Loadingc from Electronics | |||||||
| 16 | Not included | Reference | Reference | ||||
| 15 | Not included | 42.1% (0.2) | 43.9% (0.09) . | ||||
| 16 | Not included | 169% (<0.001) *** | −3.32% (0.9) | ||||
PFAS = per- and polyfluoroalkyl substances; PBDEs = polybrominated diphenyl ethers; OPEs = organophosphate esters.
Chemical concentrations were log-transformed in the multilevel models, but estimates are presented as the percent change on the linear scale.
The models were conducted a second time with ‘partial intervention’ as the reference category in order to assess any improvements of the full intervention over the partial one and to increase statistical power by using the group with the largest sample size.
Loadings were calculated as the sum across foam furniture or electronics products of the average element concentration of each unique product type multiplied by its surface area and count in the space.
p < 0.10
p < 0.05
p < 0.01
p < 0.001
3.2. Polybrominated Diphenyl Ethers in Dust
BDE-209, BDE-100, BDE-99, and BDE-47 were each detected in 100% of our dust samples (Table S4). The other four PBDE congeners were detected in at least 80.9% of samples. The PBDE congeners grouped into three principal components that aligned well with commercial flame retardant mixture formulas: penta-BDE (congeners 28, 47, 99, 100, and 153), octa-BDE (congeners 154 and 183), and deca-BDE (congener 209) (Figure S4). The geometric mean profiles of PBDEs in dust were mostly influenced by deca-BDE, followed by congeners BDE-47 and BDE-99 commonly used in penta-BDE (Figure 2).
Total PBDE dust concentrations were similar between rooms with no interventions and rooms with partial interventions, but the full “healthier” rooms had lower levels (Figure 1). Geometric mean concentrations of Σ8PBDEs in dust were 1,360 ng/g (range: 452–5,930 ng/g) in rooms with no interventions, 1,390 ng/g (179–14,200 ng/g) in rooms with partial “healthier” interventions, and 839 ng/g (414–1,570 ng/g) in rooms with full “healthier” materials interventions (Table S4).
In the multilevel model adjusted for exposed insulation, bromine loading from foam furniture, and bromine loading from electronics (Table 1), there was suggestive evidence that rooms with full “healthier” materials interventions had 45% (95% CI: −1.7–71%) lower Σ8PBDEs concentrations compared to rooms with only partial interventions (p=0.09). The rooms with full interventions also had 17% lower Σ8PBDEs concentrations in dust than rooms with no interventions, but this did not reach statistical significance (p=0.68), perhaps because of the lower sample size of the no-intervention reference group. The rooms with partial versus no interventions also did not have significantly different Σ8PBDE dust levels (p=0.16). The PBDE concentrations in dust were significantly associated with bromine loadings from both electronics and from foam furniture. Rooms with high bromine loadings in electronics had 169% (95% CI: 51–362%) higher levels of Σ8PBDEs in dust than rooms with low electronic loadings (p=0.0008). Rooms with high bromine loadings in foam furniture had 86% (95% CI: 2–226) higher Σ8PBDEs concentrations in dust than rooms with low loadings (p=0.04). Differences between rooms within a building (as opposed to between buildings) explained 83% of the variability in log PBDE concentrations in dust.
Two buildings in the study were built after the 2013 voluntary phase-out of BDE-209. In the new building with full “healthier” materials interventions, three sampled rooms had detectable levels of BDE-209 in dust between 52.9 and 1,340 ng/g. In the new building with partial interventions, three rooms had dust concentrations of BDE-209 between 369 and 2,680 ng/g.
3.3. Organophosphate Esters in Dust
Nine OPEs were detected in 100% of dust samples, and another eight were detected in at least 91% of samples (Table S4). TBOEP, TCIPP, TDCIPP, and TPHP made up the vast majority of geometric mean profiles of OPEs (Figure 2).
The OPE concentrations were generally lowest in dust from the full “healthier” rooms, while the rooms with no or partial interventions had similar concentrations to each other (Figure 1). Geometric mean concentrations of Σ19OPEs in dust were 30,400 ng/g (range: 13,400–60,300 ng/g) in rooms with no interventions, 37,500 ng/g (10,300–182,000 ng/g) in rooms with partial interventions, and 14,000 ng/g (6,760–30,900 ng/g) in rooms with full “healthier” materials interventions (Table S4).
In a multilevel model controlling for exposed insulation, furniture phosphorus loading, and electronics phosphorus loading, rooms with full “healthier” materials interventions had 65% (95% CI: 37–80%) lower total levels of OPEs in dust than rooms with no interventions (p=0.0006) (Table 1). Rooms with only partial interventions did not have significantly lower Σ19 OPEs concentrations in dust than rooms with no interventions (p=0.7). Rooms with exposed insulation had 176% higher Σ19OPEs levels in dust than rooms without visible insulation (95% CI: 55–396%; p=0.0005), adjusted for intervention status, furniture loading, and electronics loading. There was suggestive evidence that rooms with medium phosphorus loadings from electronics, compared to rooms with low loadings, had 43.9% higher Σ19OPEs concentrations in dust (95% CI: −7–118%; p=0.09). Phosphorus loadings in foam furniture were not statistically significant predictors of Σ19OPEs concentrations. All (100%) of the variability in log OPE concentrations could be attributed to differences between rooms within a building, so between-building differences did not play a significant role.
3.4. Product Sources of Bromine and Phosphorus
Foam furniture, carpet, electronics, and exposed insulation (mostly hot water pipes) were four primary product sources of XRF-measured bromine and phosphorus in the rooms, and the “healthier” materials usually had lower levels than conventional materials. Table 2 provides summary statistics of element concentrations by intervention status and product type, with additional products summarized in Table S6.
Table 2.
Summary of concentrations (μg/g) of bromine and phosphorus in different product types in the 47 studied spaces, as measured using portable x-ray fluorescence (XRF).
| Product Type | Bromine (μg/g) | Phosphorus (μg/g) | ||
|---|---|---|---|---|
| XRF in product mode | XRF in geo mode | |||
| n | Median [Range] | n | Median [Range] | |
| Upholstered foam furniturea | 293 | 21.5 [ND, 79240] | 284 | 585.8 [ND, 22880] |
| By flammability standard | ||||
| ’Healthier’: no added FRs (or PFAS) | 122 | 10.05 [ND, 4820] | 114 | 457.4 [ND, 4827] |
| Conventional: TB 117–2013 with no added FRs | 39 | 7.7 [ND, 848] | 40 | 732 [ND, 18430] |
| Conventional: FRs at TB 117 or 117–2013 | 25 | 27.2 [5.9, 46120] | 25 | 915.9 [ND, 2416] |
| Conventional: FRs at TB 133 | 30 | 917 [2.6, 65910] | 30 | 493 [ND, 22880] |
| Conventional: unlabeled | 77 | 141 [2.2, 79240] | 75 | 1124 [ND, 13140] |
| By product type | ||||
| Chair with cushioned seat | 75 | 25.8 [ND, 38440] | 73 | 491 [ND, 4450] |
| Armchair | 126 | 14.95 [ND, 76270] | 120 | 864.1 [ND, 18430] |
| Couch | 62 | 94.6 [2, 79240] | 61 | 557.7 [ND, 22880] |
| Ottoman | 30 | 9.9 [2, 55510] | 30 | 512.6 [ND, 13010] |
| Carpet | 91 | 10.6 [0.2, 305] | 91 | ND [ND, 1840] |
| ’Healthier’: no added FRs (or PFAS) | 44 | 7.6 [0.2, 153.1] | 44 | 99.12 [ND, 1840] |
| Conventional | 47 | 21.2 [1.9, 305] | 47 | ND [ND, 1835] |
| Electronicsb | 240 | 20.35 [ND, 147800] | 229 | 719 [ND, 128800] |
| Televisions | 51 | 26 [ND, 133500] | 50 | 2025 [ND, 42680] |
| Computer monitors | 30 | 57.2 [ND, 965] | 28 | 917.2 [ND, 128800] |
| Projector systems | 13 | 2.4 [0.4, 5285] | 12 | 25230 [887.8, 34740] |
| Keyboards | 32 | 381.5 [ND, 2931] | 32 | 202.6 [ND, 878] |
| Mouses | 24 | 247.4 [0.9, 821] | 23 | 426.9 [ND, 5941] |
| Telephones | 12 | 9.05 [1.1, 395] | 12 | 412 [239.9, 1183] |
| Audio/video devices | 15 | 2.3 [ND, 147800] | 13 | 711.8 [154.8, 44780] |
| Printers/copiers | 5 | 7.3 [1, 224] | 6 | 39790 [17030, 43250] |
| Routers/modems | 16 | 0.5 [ND, 108100] | 14 | 25020 [ND, 39450] |
| Floor outlets | 11 | 4.7 [ND, 23820] | 9 | 668.6 [ND, 1458] |
| Projector screens | 3 | ND [ND, ND] | 3 | 11490 [ND, 48350] |
| Foam pillows | 12 | 5.45 [0.7, 106] | 13 | 418 [ND, 10240] |
| Foam drawer tops | 5 | 10.2 [1.7, 12.8] | 6 | 652.1 [551, 883.6] |
| Exposed insulation | 10 | 16080 [5.4, 21030] | 10 | ND [ND, 1308] |
ND = not detected
n = number of XRF measurements, including duplicates on same product. By contrast, the number of unique items measured were 105 upholstered foam furniture pieces, 54 carpets, and 170 electronic products.
Including only chairs, armchairs, couches, and ottomans with foam filling.
Including the specifically mentioned product types, as well as DVD players, tablets, power strips, scanners, TV remotes, audio radiators, plug ports, monitor-free computer systems, and one server kit.
In an unadjusted multilevel regression model, conventional carpet had 210% (95% CI: 65–484%) higher bromine levels than “healthier” carpet specified as free of chemical flame retardants (p=0.001). Phosphorus concentrations in conventional and “healthier” carpets were not significantly different.
Foam seating furniture that met the most stringent flammability standard, TB 133, had 2,940% (95% CI: 458–16,200%) higher levels of bromine than “healthier” furniture specified by manufacturers as free of all chemical flame retardants (p=0.0002), adjusted for furniture type and measurement spot (Table 3). Foam seating furniture that met other stringent flammability standards (TB 117 or TB 117–2013 with added chemical FRs) had 922% (95% CI: 45–7,210%) higher bromine levels than “healthier” furniture (p=0.026). As expected, conventional furniture labeled under the newest TB 117–2013 standard to not contain chemical FRs above 1000 ppm did not have significantly different bromine content compared to the university’s “healthier” furniture that followed the same FR restrictions. The furniture product with the highest bromine level under the “healthier” category was labeled in the manufacturer’s specification to be “FR-free” and “bromine-free” but to contain recycled content.
Table 3.
Results from multilevel models of the impact of flammability standard, furniture type, and type of cushion measured on concentrations (μg/g) of bromine and phosphorus in foam furniture in 47 studied spaces as measured with a portable x-ray fluorescence (XRF) instrument.
| % Change (p value)a | |||
|---|---|---|---|
| Covariate | n | Bromine | Phosphorus |
| Intervention | |||
| ‘Healthier’: no added FRs (or PFAS) | 125 | Reference | Reference |
| Conventional: TB 117–2013 with no added FRs | 40 | −25.2% (0.7) | 2200% (0.001) ** |
| Conventional: FRs at TB 117 or 117–2013 | 25 | 922% (0.03) * | 566% (0.1) |
| Conventional: FRs at TB 133 | 30 | 2940% (<0.001) *** | 103% (0.5) |
| Conventional: unlabeled | 77 | 1510% (<0.001) *** | 495% (0.02) * |
| Foam Furniture | |||
| Chair | 75 | Reference | Reference |
| Armchair | 129 | −17.2% (0.7) | 28.3% (0.7) |
| Couch | 63 | 632% (0.004)** | 58.3% (0.6) |
| Ottoman | 30 | 56.1% (0.5) | −45.3% (0.5) |
| Spot Measured | |||
| Seat Cushion | 199 | Reference | Reference |
| Seatback Cushion | 98 | −11.9% (0.4) | −59.9% (<0.001) *** |
FRs = flame retardants; TB = technical bulletin of California furniture flammability standard.
Element concentrations were log-transformed in the multilevel models, but estimates are presented as the percent change on the linear scale.
p < 0.05.
p < 0.01.
p < 0.00.
For phosphorus, median concentrations were lowest in “healthier” foam seating furniture items, followed by items labeled under the historical, stringent standard TB 133 (Table 2). Conventional furniture with no flammability standard tag or labeled to have no added flame retardants under the TB 117–2013 option had 495% (95% CI: 48–2,300%; p=0.02) or 2,200% (95% CI: 309–12,800%; p=0.001) higher phosphorus levels than “healthier” furniture, respectively (Table 3). About 60% of the variability in phosphorus levels and 83% in bromine levels for foam furniture were attributable to differences between product types across rooms as opposed to differences in repeated measurements on different spots or items of a product type in the room.
The 1000 μg/g limit for PBDEs would be equivalent to at most 833 μg/g of bromine (based conservatively on the most brominated congener, BDE-209), so the bromine concentrations in TB 117–2013 furniture with ‘no added FRs’ seem to mostly be below that regulatory limit, unlike the furniture meeting stricter regulations (Table 2). The 1000 μg/g limit would be equivalent to up to 170 μg/g phosphorus for our OPE analytes (specifically TEP). Geometric mean concentrations of phosphorus for all furniture standards were above that limit, although organophosphate chemicals may also be present in the products as plasticizers.
4. Discussion
Among 47 university offices, classrooms, and common rooms, “healthier” furniture and carpet interventions were associated with substantially lower total levels of PFAS, PBDEs, and OPEs in dust relative to conventional spaces.
4.1. Per- and Polyfluoroalkyl Substances
Compared to rooms with no intervention, PFAS were 78% lower in dust in rooms with full “healthier” materials interventions, which included carpet and furniture specified by manufacturers to be free of all PFAS and chemical flame retardants. The specific PFAS detected in dust mostly included PFHxA, PFOS, and PFOA. These three chemicals have all been used as coatings on furniture and carpet, so their substantial reductions in dust align with the “healthier” materials that were intervened on.
Dust concentrations of two historically widely used legacy chemicals, PFOS and PFOA, were mostly much lower than in previous studies of indoor dust in the U.S. (Figure 3). Some residual contamination of these two legacy PFAS still persists in the studied buildings despite their voluntary phase-out by major manufacturers in the early 2000s (Wang et al., 2015a, 2013), suggesting that products with long life spans as well as materials inherent to the building continue to be used even after phase-outs.
Figure 3.
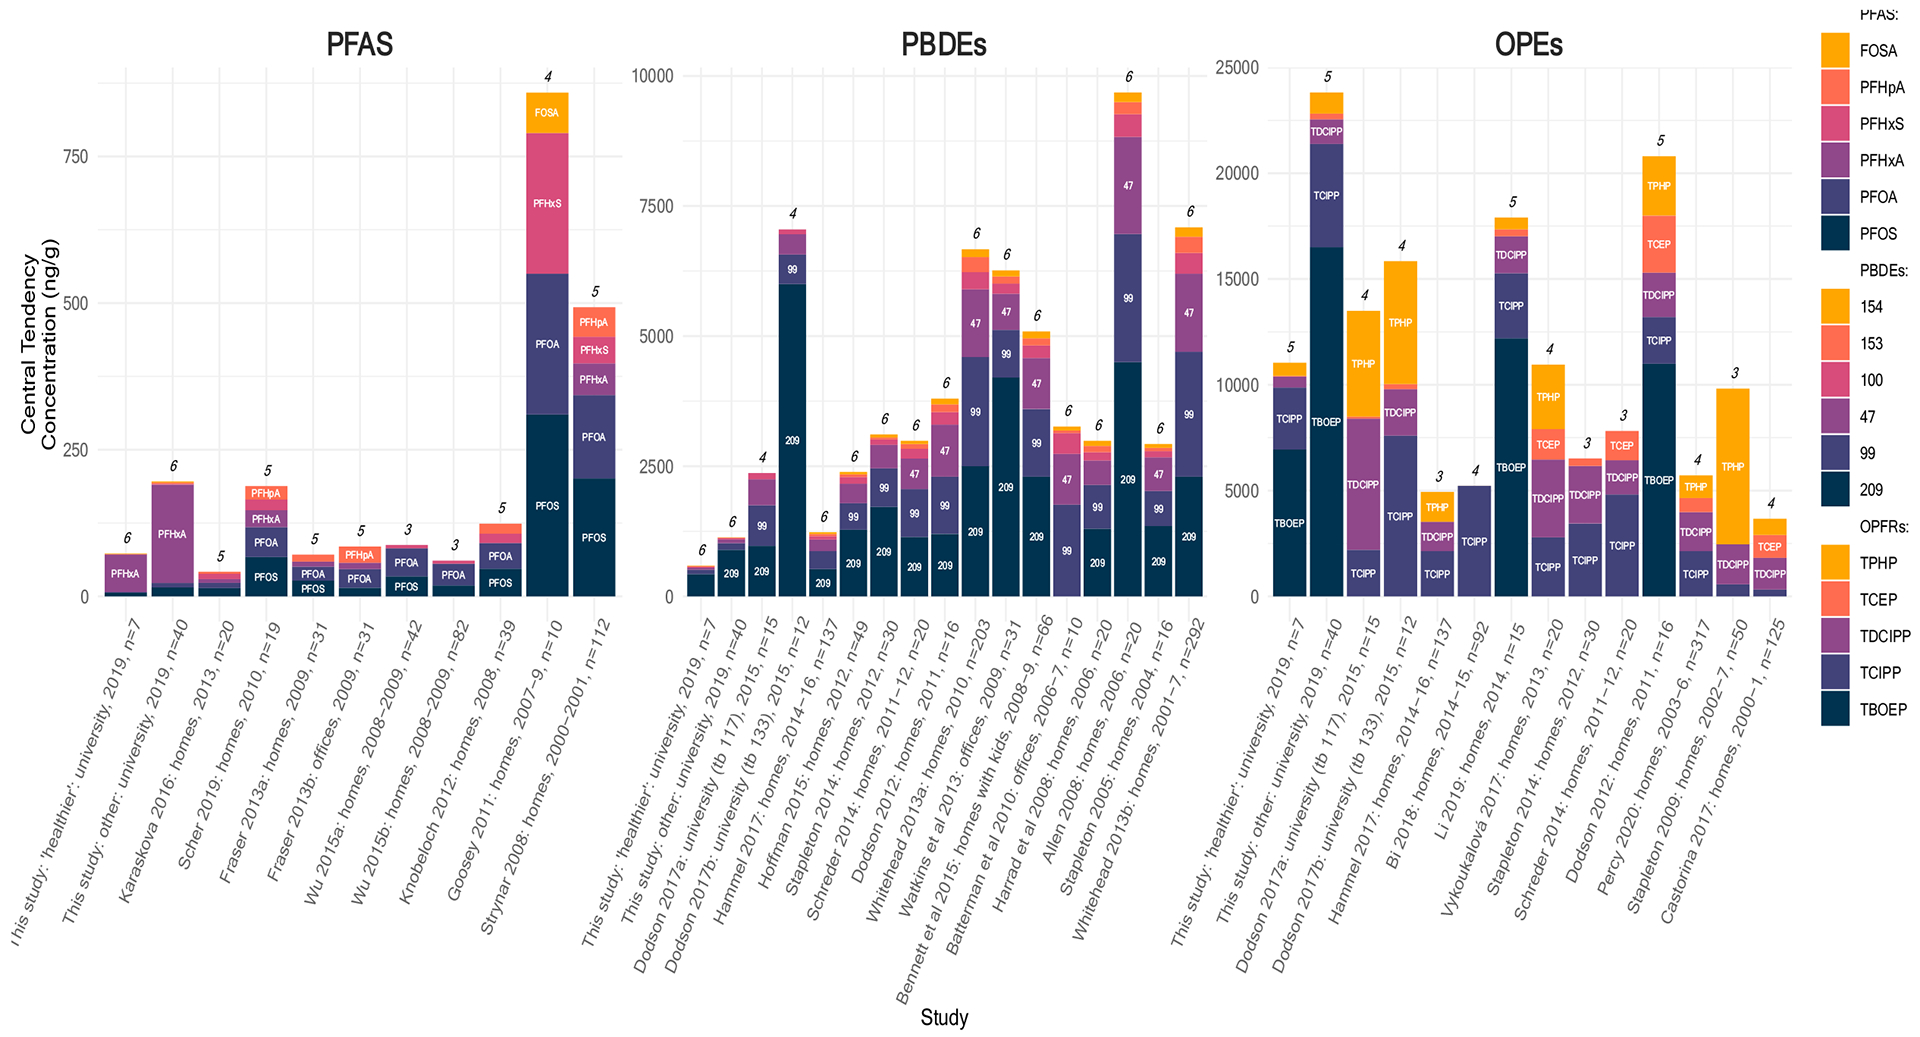
Central tendency concentrations (medians or geometric means) of select PFAS, PBDE, and OPE analytes (ng/g) in indoor dust in this study (the two bars on the left for full “healthier” spaces versus other spaces), compared to select previous studies of dust in the United States, sorted chronologically by sampling year.
Note: Numbers on top of stacked bars indicate the number of the selected analytes that were measured in the study (a few studies did not measure all visualized chemicals).
References:Allen et al. 2008a; Batterman et al. 2010; Bennett et al. 2015; Bi et al. 2018; Castorina et al. 2017; Dodson et al. 2012, 2017; Fraser et al. 2013; Goosey and Harrad 2011; Hammel et al. 2017; Harrad et al. 2008; Hoffman et al. 2015; Karaskova et al. 2016; Knobeloch et al. 2012; Li et al. 2019a; Percy et al. 2020; Scher et al. 2019; Schreder and La Guardia 2014; Stapleton et al. 2005, 2009, 2014; Strynar and Lindstrom 2008; Vykoukalová et al. 2017; Watkins et al. 2013; Whitehead et al. 2013; Wu et al. 2015.
At the same time, the newer, short-chain replacement chemical PFHxA tended to be found at higher dust concentrations in our study (even in “healthier” rooms) than have been previously measured in dust collected from homes or offices in the U.S. between 2000 and 2013 (Figure 3). The higher levels are likely due to the increasing use of PFHxA over time and our sampling of mostly recently refurnished buildings (unlike the case for many homes). It’s possible our studied university buildings also had higher densities of furniture and carpeting than homes. PFHxA contamination was still found in the rooms with “healthier” furniture and carpet, likely from other types of building materials that were not intervened on, furnishings from any adjacent conventional spaces, and consumer products that people carry in. Other than upholstered furniture and carpet, PFHxA (and/or PFOA and PFOS) has been found in clothing, disposable food packaging, floor waxes, wood sealants, paints, and other products with water-repellant or stain-repellant coatings (Herzke et al., 2012; Janousek et al., 2019; Kotthoff et al., 2015; Liu et al., 2014; Tokranov et al., 2018). Overall, the comparisons of our study to previous studies reflect the phase-out of legacy PFAS and the emerging substitution of other PFAS chemicals like PFHxA.
4.2. Polybrominated Diphenyl Ethers
We found suggestive evidence that PBDE levels in dust were 45% lower in rooms renovated with full “healthier” materials interventions that those with only partial interventions. BDE-209 was the congener detected at the highest geometric mean concentrations by far and with the highest absolute reduction due to the full “healthier” materials intervention, which reflects its relatively recent phase-out by manufacturers a decade after the other measured PBDEs.
The PBDE dust concentrations were significantly higher in rooms with high bromine loadings from foam furniture compared to rooms with low loadings, indicating that upholstered foam furniture is indeed an important source of FRs. The XRF measurements of products in the rooms verified that there were very low levels of bromine, a surrogate for PBDEs, in most “healthier” furniture specified by manufacturers to be free of all chemical FRs. In fact, foam furniture meeting the historic, most stringent flammability standard (TB 133) had substantially higher bromine levels than “healthier” furniture. Similarly, “healthier” carpet specified as FR-free had significantly lower bromine levels than conventional carpet. The mean bromine concentrations in “healthier” foam furniture and carpet in this study were lower than a few previous studies that employed XRF measurements (Abbasi et al., 2016; Allen et al., 2008a; Gallen et al., 2014; Imm et al., 2009). The intervention on “healthier” furniture and carpet was associated with lower levels of a PBDE surrogate in the materials as well as lower resulting levels of PBDEs in dust.
Other sources besides furniture and carpet likely contributed to PBDEs in dust, which motivates the need to continue developing interventions on other product categories. For one, plastic electronics like televisions in the rooms often had very high bromine levels compared to foam furniture. In addition, rooms with high bromine loadings from electronics had higher PBDE levels in dust than those with low loadings. Since PBDEs have been added to electronics as additive (not reactive) FRs, they are not covalently bound to the polymer and can migrate out of products during normal use (Rauert et al., 2014; Rauert and Harrad, 2015; Webster et al., 2009).
The building itself, and the materials behind its walls, may be an important source of PBDE contamination, not just the furnishings inside it. PBDEs, especially BDE-209, have been historically used in polyurethane foam wall insulation, insulated hot water pipes, and other construction materials (Duan et al., 2016; Vojta et al., 2017). Although we may not have had enough statistical power to evaluate the impact of visibly exposed insulation in six of the studied rooms on dust levels of PBDEs, we did measure high levels of bromine in the insulation that were comparable to concentrations in conventional foam furniture. In addition, we did not see a significant difference between rooms with no interventions and rooms with only partial interventions; PBDEs were only lower in dust in the spaces with a full intervention (“healthier” materials and either located in a newer building or not connected to conventional rooms). Furthermore, we found that 17% of the variability in log PBDE concentrations could be explained by differences across buildings as opposed to between different rooms within a building, suggesting that the building does play a role. By contrast, 0% was explained by between-building differences for OPEs, which are relatively newer substitute flame retardants as well as plasticizers.
The geometric mean PBDE levels in dust samples from this study’s recently refurnished conventional or “healthier” rooms were substantially lower than most previous studies of homes or offices in the U.S. (sampled between 2000 and 2015), reflecting voluntarily reductions in manufacturing of these chemicals (Figure 3). However, in two newly constructed buildings in our study that opened a few years after the 2013 phase-out of BDE-209, the dust concentrations were still detectable at up to 2,680 ng/g. So, there were residual PBDEs in even the newest buildings that theoretically should not be contaminated. Despite phase-outs, PBDEs may take some time to be replaced with new products in warehouse stocks, can persist in older materials and buildings, and may be carried over into new materials through the recycling of older plastics (Abbasi et al., 2015; Y. Li et al., 2019; Turner and Filella, 2017; Vojta et al., 2017). Thus, these flame retardants will likely contaminate buildings at some level for years to come.
4.3. Organophosphate Esters
OPEs in dust were significantly lower (65%) in spaces with full “healthier” materials interventions than rooms with none. The presence of exposed insulation in the rooms was also significantly associated with OPE contamination in dust, and phosphorus-containing electronics in the rooms may be another contributing source too. Our findings are supported by what we know of product sources of these chemicals. The main OPE chemicals present in the dust samples were TBOEP, TCIPP, TDCIPP, and TPHP, which are used as flame retardants in upholstered foam furniture, carpet, electronics, and/or building insulation (Abbasi et al., 2016; Bello et al., 2018; Kajiwara et al., 2011; Kemmlein et al., 2003; Stapleton et al., 2012; van der Veen and de Boer, 2012; Zheng et al., 2017). Rooms with only partial interventions did not significantly differ from those with no intervention, demonstrating the importance of cross-contamination of “healthier” single rooms from adjacent conventional spaces and/or the contributions from other materials besides FR-free foam furniture in partially renovated rooms.
Phosphorus loadings from foam furniture in the rooms were not statistically significant predictors of OPE levels in dust. However, the intervention on “healthier” furniture (and carpet) was associated with a significant reduction in OPEs in dust. In addition, XRF product measurements did confirm that the “healthier” furniture items had relatively low phosphorus levels, although XRF-measured phosphorus as a surrogate for OPEs has not been as studied or well-established as bromine. In fact, the conventional foam furniture items meeting TB 117–2013 without added FRs still had significantly higher levels of phosphorus than the “healthier” furniture specified by manufacturers to not contain FRs. This difference could arise from the additional avoidance of polyvinyl chloride (and thus plasticizers) to at least below 1% in the “healthier” furniture. The conventional furniture meeting older, more stringent flammability standards did not have statistically higher phosphorus levels than “healthier” foam furniture (except for the ‘unlabeled’ group), which is likely due to the historic preference towards PBDEs, which were only more recently substituted with OPEs. Furthermore, the mean (476 ppm) and maximum (4,830 ppm) XRF-measured phosphorus levels in the “healthier” foam furniture items were lower than were found in furniture by one previous study using a different instrument (mean: 2,060; max: 8,830 ppm) (Petreas et al., 2016).
We also may not have seen a statistically significant impact of phosphorus loadings from foam furniture on OPE dust levels because there are so many more product sources (with added FRs or plasticizers) than for PBDEs. This may also explain why the studied rooms had significantly higher OPE concentrations compared to previous studies of home indoor dust in the U.S., although we studied non-residential buildings that may have higher densities of furniture and more recent renovations than many homes (Figure 3). Compared to previous research of homes sampled between 2000 and 2015, our study did have lower geometric mean or median levels of TDCIPP, which has been suggested to be phased out in favor of TCIPP in foam products after TDCIPP was recently added as a carcinogen to California’s Proposition 65 list (Cooper et al., 2016). TBOEP was the most dominant analyte in our study, and it may be a flame-retardant substitute (or plasticizer) increasing in use, too. Although many prior studies did not measure TBOEP, median levels of TBOEP in dust in our studied rooms, excluding the full “healthier” rooms, were higher than three previous studies of home dust collected between 2011 and 2015 (Figure 3) (Bi et al., 2018; Dodson et al., 2012; W. Li et al., 2019). TBOEP is used in furniture, floor finishes, rubber, plastic, lacquers/paints, and wallpaper (van der Veen and de Boer, 2012; Y. Wang et al., 2017).
4.4. Alternative Strategies to PFAS and Flame Retardants
Because PFAS and flame-retardant chemicals are usually non covalently bound additives, they can be removed as ingredients without sacrificing the functional integrity of the product. In addition, the costs of the furniture to the university were reported to be lower when chemical flame retardants were not added. There is even evidence that disputes the hypothesized effectiveness of using chemical flame retardants in furniture foam filling to protect against residential fires (Rodgers et al., 2019; Shaw et al., 2010; US Consumer Product Safety Commission, 2012). At the building level, public spaces often have extensive measures to protect against fires, including smoke detectors, smoking prohibitions, and sprinkler systems. At the ignition source level, self-extinguishing cigarettes and fire-safe candles can help prevent fires from starting (Rodgers et al., 2019; Shaw et al., 2010). At the furniture level, safer flame retardants, other filling materials, naturally fire-resistant fabrics (such as wool), and fire barriers between the fabric and foam filling have been investigated as alternative strategies (Nazaré and Davis, 2012; Shaw et al., 2010; US Consumer Product Safety Commission, 2012). One carpet manufacturer reported to use aluminum hydroxide (ATH) as a non-halogenated mineral filler flame retardant to meet fire codes. ATH is generally thought to be safer than chemical flame retardants, although there are limited studies (National Research Council, 2000).
A carpet manufacturer also described to us their approach to alter the ionic charge and microscopic geometry of the nylon fibers to achieve long-term stain repellence without the need for PFAS. Water-repellant alternatives on the market may include paraffin, silicone, dendrimer, and polyurethane chemistries (Danish Ministry of the Environment, 2015). Before implementing any potential alternative solution, especially a substitute chemical, health risks should be carefully studied and balanced.
4.5. Strengths and Limitations
A key, unique strength was the university’s holistic, chemical class-based “healthier” building materials intervention to remove three classes of chemicals in a practical, scalable solution. Our thousands of portable XRF measurements enabled us to assess the importance of different product categories and to characterize sources of phosphorus for the first time.
There were a few study limitations. First, the “healthier” materials interventions did not address all materials in a given room and were often conducted in rooms next to conventional spaces. Our categorization of rooms into no, partial, or full interventions captured some of these nuances. Second, the sample size was relatively small, although we sampled as many “healthier” rooms as available and possible. This limited our statistical power and prevented us from developing more complex models. We also could not feasibly measure all chemicals in each class, of which some could be unknown substitutes, although manufacturers specified the “healthier” materials as free of the entire classes. Another limitation is that some OPEs are used as plasticizers, so we could not disentangle these separate OPE functions in buildings. However, we did observe significant reductions in OPEs in dust due to the intervention that focused mainly on their elimination as FRs. In addition, the natural heterogeneity of dust could have limited our statistical power to detect certain effects (Rauert and Harrad, 2015). For XRF product scanning, phosphorus is not a perfect indicator of OPEs in a particular product, however, phosphorus loadings were useful for evaluating differences in furniture by flammability standard and assessing overall product sources in statistical models to reduce exposure misclassification that arises from using raw counts of products in rooms. Bromine and phosphorus have an advantage of reflecting even unknown chemicals in a class, but this may have limited statistical power to relate elements in products to the individual chemical analytes in dust. Other sources of phosphorus besides OPEs include soil, pesticides, fertilizers, nerve agents, pharmaceuticals, industrial solvents, and fuel additives, but we do not expect these chemicals to differ in furniture products or by intervention status in dust (Liu et al., 2020; Naughton and Terry, 2018). Similarly, other sources of bromine besides PBDEs could include other brominated FR (which should also be reduced in the intervention), biocides, fuel additives, pharmaceuticals, polymers, halons, rubber, and dyes (Ioffe and Frim, 2011; Saikia et al., 2016), but these should not significantly interfere with our results, and bromine has been shown to highly correlate with FRs for indoor sources (Allen et al., 2008a).
5. Conclusions
This study demonstrates the effectiveness of a chemical class-based “healthier” furniture and carpet intervention on reducing levels of PFAS and flame retardants in dust indoors. The scanning of products in situ for element surrogates using XRF proved helpful to identify electronics and exposed insulation as additional important sources of FRs in buildings. Future interventions should target more product categories and consider strategies to limit the use of, or reduce occupant exposures to, legacy materials of the building. Overall, we observed significant indoor chemical reduction benefits from the use of “healthier” materials in buildings.
Supplementary Material
Highlights.
Healthier furnishings reduced flame-retardant and stain-repellant chemicals in dust
X-ray fluorescence instruments can screen products for flame retardants in situ
Electronics, exposed insulation, and other products should be intervened on next
6. Acknowledgments
We would like to thank Managing Director Heather Henriksen, John Ullman, and Brandon Geller from the Harvard Office for Sustainability for their support of the study. We are grateful to Jose Vallarino, Emily Jones, Marianne Lahaie Luna, Erika Eitland, Maya Bliss, Parichehr Salimifard, Ben Jones, and Sydney Robinson for their help with field sampling. This research was made possible by the Harvard Campus Sustainability Innovation Fund, NIH Grant P30ES000002, NIOSH Grant T42 OH008416, and NIOSH Grant 1K01 OH011648. The authors declare no competing financial interest.
Footnotes
Publisher's Disclaimer: This is a PDF file of an unedited manuscript that has been accepted for publication. As a service to our customers we are providing this early version of the manuscript. The manuscript will undergo copyediting, typesetting, and review of the resulting proof before it is published in its final form. Please note that during the production process errors may be discovered which could affect the content, and all legal disclaimers that apply to the journal pertain.
Declaration of interests
The authors declare that they have no known competing financial interests or personal relationships that could have appeared to influence the work reported in this paper.
References
- Abbasi G, Buser AM, Soehl A, Murray MW, Diamond ML, 2015. Stocks and Flows of PBDEs in Products from Use to Waste in the U.S. and Canada from 1970 to 2020. Environ. Sci. Technol 49, 1521–1528. 10.1021/es504007v [DOI] [PubMed] [Google Scholar]
- Abbasi G, Saini A, Goosey E, Diamond ML, 2016. Product screening for sources of halogenated flame retardants in Canadian house and office dust. Sci. Total Environ 545–546, 299–307. 10.1016/j.scitotenv.2015.12.028 [DOI] [PubMed] [Google Scholar]
- Allen JG, Gale S, Zoeller RT, Spengler JD, Birnbaum L, McNeely E, 2016. PBDE flame retardants, thyroid disease, and menopausal status in U.S. women Environ. Health; 15, 60. 10.1186/s12940-016-0141-0 [DOI] [PMC free article] [PubMed] [Google Scholar]
- Allen JG, McClean MD, Stapleton HM, Webster TF, 2008a. Linking PBDEs in House Dust to Consumer Products using X-ray Fluorescence. Environ. Sci. Technol 42, 4222–4228. 10.1021/es702964a [DOI] [PubMed] [Google Scholar]
- Allen JG, McClean MD, Stapleton HM, Webster TF, 2008b. Critical factors in assessing exposure to PBDEs via house dust. Environ. Int 34, 1085–1091. 10.1016/j.envint.2008.03.006 [DOI] [PubMed] [Google Scholar]
- Barry V, Winquist A, Steenland K, 2013. Perfluorooctanoic acid (PFOA) exposures and incident cancers among adults living near a chemical plant. Environ. Health Perspect 121, 1313–1318. 10.1289/ehp.1306615 [DOI] [PMC free article] [PubMed] [Google Scholar]
- Batterman S, Godwin C, Chernyak S, Jia C, Charles S, 2010. Brominated flame retardants in offices in Michigan, USA. Environ. Int 36, 548–556. 10.1016/j.envint.2010.04.008 [DOI] [PMC free article] [PubMed] [Google Scholar]
- Bello A, Carignan CC, Xue Y, Stapleton HM, Bello D, 2018. Exposure to organophosphate flame retardants in spray polyurethane foam applicators: Role of dermal exposure. Environ. Int 113, 55–65. 10.1016/j.envint.2018.01.020 [DOI] [PubMed] [Google Scholar]
- Bennett DH, Moran RE, Wu XM, Tulve NS, Clifton MS, Colon M, Weathers W, Sjodin A, Jones R, Hertz-Picciotto I, 2015. Polybrominated diphenyl ether (PBDE) concentrations and resulting exposure in homes in California: relationships among passive air, surface wipe and dust concentrations, and temporal variability. Indoor Air 25, 220–229. 10.1111/ina.12130 [DOI] [PMC free article] [PubMed] [Google Scholar]
- Bi C, Maestre JP, Li H, Zhang G, Givehchi R, Mahdavi A, Kinney KA, Siegel J, Horner SD, Xu Y, 2018. Phthalates and organophosphates in settled dust and HVAC filter dust of U.S. low-income homes: Association with season, building characteristics, and childhood asthma. Environ. Int 121, 916–930. 10.1016/j.envint.2018.09.013 [DOI] [PubMed] [Google Scholar]
- Boas M, Feldt-Rasmussen U, Main KM, 2012. Thyroid effects of endocrine disrupting chemicals. Mol. Cell. Endocrinol 355, 240–248. 10.1016/j.mce.2011.09.005 [DOI] [PubMed] [Google Scholar]
- Calafat AM, Wong LY, Kuklenyik Z, Reidy JA, Needham LL, 2007. Polyfluoroalkyl chemicals in the U.S. population: Data from the national health and nutrition examination survey (NHANES) 2003–2004 and comparisons with NHANES 1999–2000. Environ. Health Perspect 115, 1596–1602. 10.1289/ehp.10598 [DOI] [PMC free article] [PubMed] [Google Scholar]
- Carignan CC, Mínguez-Alarcón L, Butt CM, Williams PL, Meeker JD, Stapleton HM, Toth TL, Ford JB, Hauser R, 2017. Urinary concentrations of organophosphate flame retardant metabolites and pregnancy outcomes among women undergoing in vitro fertilization for the EARTH study team. Environ. Health Perspect 125, 8. 10.1289/EHP1021 [DOI] [PMC free article] [PubMed] [Google Scholar]
- Carignan CC, Minguez-Alarcon L, Williams PL, Meeker JD, Stapleton HM, Butt CM, Toth TL, Ford JB, Hauser R, 2018. Paternal urinary concentrations of organophosphate flame retardant metabolites, fertility measures, and pregnancy outcomes among couples undergoing in vitro fertilization. Environ. Int 111, 232–238. 10.1016/j.envint.2017.12.005 [DOI] [PMC free article] [PubMed] [Google Scholar]
- Castorina R, Butt C, Stapleton HM, Avery D, Harley KG, Holland N, Eskenazi B, Bradman A, 2017. Flame retardants and their metabolites in the homes and urine of pregnant women residing in California (the CHAMACOS cohort). Chemosphere 179, 159–166. 10.1016/j.chemosphere.2017.03.076 [DOI] [PMC free article] [PubMed] [Google Scholar]
- Cequier E, Sakhi AK, Marce RM, Becher G, Thomsen C, 2015. Human exposure pathways to organophosphate triesters - a biomonitoring study of mother-child pairs. Environ. Int 75, 159–165. 10.1016/j.envint.2014.11.009 [DOI] [PubMed] [Google Scholar]
- Choi G, Wang Y-B, Sundaram R, Chen Z, Barr DB, Buck Louis GM, Smarr MM, 2019. Polybrominated diphenyl ethers and incident pregnancy loss: The LIFE Study. Environ. Res 168, 375–381. 10.1016/j.envres.2018.09.018 [DOI] [PMC free article] [PubMed] [Google Scholar]
- Cooper EM, Kroeger G, Davis K, Clark CR, Ferguson PL, Stapleton HM, 2016. Results from Screening Polyurethane Foam Based Consumer Products for Flame Retardant Chemicals: Assessing Impacts on the Change in the Furniture Flammability Standards. Environ. Sci. Technol 50, 10653–10660. 10.1021/acs.est.6b01602 [DOI] [PMC free article] [PubMed] [Google Scholar]
- Czerska M, Zielinski M, Kaminska J, Ligocka D, 2013. Effects of polybrominated diphenyl ethers on thyroid hormone, neurodevelopment and fertility in rodents and humans. Int. J. Occup. Med. Environ. Health 26, 498–510. 10.2478/s13382-013-0138-7 [DOI] [PubMed] [Google Scholar]
- Danish Ministry of the Environment, 2015. Alternatives to perfluoroalkyl and polyfluoroalkyl substances (PFAS) in textiles.
- Dembsey NA, Brokaw FM, Stapleton HM, Dodson RE, Onasch J, Jazan E, Carignan CC, 2019. Intervention to reduce gymnast exposure to flame retardants from pit foam: A case study. Environ. Int 127, 868–875. 10.1016/j.envint.2019.01.084 [DOI] [PubMed] [Google Scholar]
- Dodson RE, Perovich LJ, Covaci A, Van den Eede N, Ionas AC, Dirtu AC, Brody JG, Rudel RA, 2012. After the PBDE Phase-Out: A Broad Suite of Flame Retardants in Repeat House Dust Samples from California. Environ. Sci. Technol 46, 13056–13066. 10.1021/es303879n [DOI] [PMC free article] [PubMed] [Google Scholar]
- Dodson RE, Rodgers KM, Carey G, Cedeno Laurent JG, Covaci A, Poma G, Malarvannan G, Spengler JD, Rudel RA, Allen JG, 2017. Flame Retardant Chemicals in College Dormitories: Flammability Standards Influence Dust Concentrations. Environ. Sci. Technol 51, 4860–4869. 10.1021/acs.est.7b00429 [DOI] [PubMed] [Google Scholar]
- Doherty BT, Hoffman K, Keil AP, Engel SM, Stapleton HM, Goldman BD, Olshan AF, Daniels JL, 2019a. Prenatal exposure to organophosphate esters and cognitive development in young children in the Pregnancy, Infection, and Nutrition Study. Environ. Res 169, 33–40. 10.1016/j.envres.2018.10.033 [DOI] [PMC free article] [PubMed] [Google Scholar]
- Doherty BT, Hoffman K, Keil AP, Engel SM, Stapleton HM, Goldman BD, Olshan AF, Daniels JL, 2019b. Prenatal exposure to organophosphate esters and behavioral development in young children in the Pregnancy, Infection, and Nutrition Study. Neurotoxicology 73, 150–160. 10.1016/j.neuro.2019.03.007 [DOI] [PMC free article] [PubMed] [Google Scholar]
- Duan H, Yu D, Zuo J, Yang B, Zhang Y, Niu Y, 2016. Characterization of brominated flame retardants in construction and demolition waste components: HBCD and PBDEs. Sci. Total Environ 572, 77–85. 10.1016/j.scitotenv.2016.07.165 [DOI] [PubMed] [Google Scholar]
- Fraser AJ, Webster TF, Watkins DJ, Strynar MJ, Kato K, Calafat AM, Vieira VM, McClean MD, 2013. Polyfluorinated compounds in dust from homes, offices, and vehicles as predictors of concentrations in office workers’ serum. Environ. Int 60, 128–136. 10.1016/j.envint.2013.08.012 [DOI] [PMC free article] [PubMed] [Google Scholar]
- Frederiksen M, Thomsen C, Froshaug M, Vorkamp K, Thomsen M, Becher G, Knudsen LE, 2010. Polybrominated diphenyl ethers in paired samples of maternal and umbilical cord blood plasma and associations with house dust in a Danish cohort. Int. J. Hyg. Environ. Health 213, 233–242. 10.1016/j.ijheh.2010.04.008 [DOI] [PubMed] [Google Scholar]
- Gallen C, Banks A, Brandsma S, Baduel C, Thai P, Eaglesham G, Heffernan A, Leonards P, Bainton P, Mueller JF, 2014. Towards development of a rapid and effective non-destructive testing strategy to identify brominated flame retardants in the plastics of consumer products. Sci. Total Environ 491–492, 255–265. 10.1016/j.scitotenv.2014.01.074 [DOI] [PubMed] [Google Scholar]
- Goosey E, Harrad S, 2011. Perfluoroalkyl compounds in dust from Asian, Australian, European, and North American homes and UK cars, classrooms, and offices. Environ. Int 37, 86–92. 10.1016/j.envint.2010.08.001 [DOI] [PubMed] [Google Scholar]
- Hammel SC, Hoffman K, Lorenzo AM, Chen A, Phillips AL, Butt CM, Sosa JA, Webster TF, Stapleton HM, 2017. Associations between flame retardant applications in furniture foam, house dust levels, and residents’ serum levels. Environ. Int 107, 181–189. 10.1016/j.envint.2017.07.015 [DOI] [PMC free article] [PubMed] [Google Scholar]
- Harrad S, Ibarra C, Diamond M, Melymuk L, Robson M, Douwes J, Roosens L, Dirtu AC, Covaci A, 2008. Polybrominated diphenyl ethers in domestic indoor dust from Canada, New Zealand, United Kingdom and United States. Environ. Int 34, 232–238. 10.1016/j.envint.2007.08.008 [DOI] [PubMed] [Google Scholar]
- Herzke D, Olsson E, Posner S, 2012. Perfluoroalkyl and polyfluoroalkyl substances (PFASs) in consumer products in Norway - a pilot study. Chemosphere 88, 980–987. 10.1016/j.chemosphere.2012.03.035 [DOI] [PubMed] [Google Scholar]
- Hewitt F, Hull TR, 2017. Mineral Filler Fire Retardants BT - Fillers for Polymer Applications, in: Rothon R(Ed.), . Springer International Publishing, Cham, pp. 329–354. 10.1007/978-3-319-28117-9_2 [DOI] [Google Scholar]
- Hoffman K, Garantziotis S, Birnbaum LS, Stapleton HM, 2015. Monitoring indoor exposure to organophosphate flame retardants: hand wipes and house dust. Environ. Health Perspect 123, 160–165. 10.1289/ehp.1408669 [DOI] [PMC free article] [PubMed] [Google Scholar]
- Hornung RW, Reed LD, 1990. Estimation of Average Concentration in the Presence of Nondetectable Values. Appl. Occup. Environ. Hyg 5, 46–51. 10.1080/1047322X.1990.10389587 [DOI] [Google Scholar]
- Imm P, Knobeloch L, Buelow C, Anderson HA, 2009. Household exposures to polybrominated diphenyl ethers (PBDEs) in a Wisconsin Cohort. Environ. Health Perspect 117, 1890–1895. 10.1289/ehp.0900839 [DOI] [PMC free article] [PubMed] [Google Scholar]
- Ioffe D, Frim R, 2011. Bromine, Organic Compounds. Kirk-Othmer Encycl. Chem. Technol., Major Reference Works 10.1002/0471238961.0218151325150606.a01.pub2 [DOI] [Google Scholar]
- Janousek RM, Lebertz S, Knepper TP, 2019. Previously unidentified sources of perfluoroalkyl and polyfluoroalkyl substances from building materials and industrial fabrics. Environ. Sci. Process. Impacts 10.1039/c9em00091g [DOI] [PubMed] [Google Scholar]
- Jinhui L, Yuan C, Wenjing X, 2017. Polybrominated diphenyl ethers in articles: a review of its applications and legislation. Environ. Sci. Pollut. Res. Int 24, 4312–4321. 10.1007/s11356-015-4515-6 [DOI] [PubMed] [Google Scholar]
- Johnson-Restrepo B, Kannan K, 2009. An assessment of sources and pathways of human exposure to polybrominated diphenyl ethers in the United States. Chemosphere 76, 542–548. 10.1016/j.chemosphere.2009.02.068 [DOI] [PubMed] [Google Scholar]
- Johnson PI, Stapleton HM, Mukherjee B, Hauser R, Meeker JD, 2013. Associations between brominated flame retardants in house dust and hormone levels in men. Sci. Total Environ 445–446, 177–184. 10.1016/j.scitotenv.2012.12.017 [DOI] [PMC free article] [PubMed] [Google Scholar]
- Kajiwara N, Noma Y, Takigami H, 2011. Brominated and organophosphate flame retardants in selected consumer products on the Japanese market in 2008. J. Hazard. Mater 192, 1250–1259. 10.1016/j.jhazmat.2011.06.043 [DOI] [PubMed] [Google Scholar]
- Karaskova P, Venier M, Melymuk L, Becanova J, Vojta S, Prokes R, Diamond ML, Klanova J, 2016. Perfluorinated alkyl substances (PFASs) in household dust in Central Europe and North America. Environ. Int 94, 315–324. 10.1016/j.envint.2016.05.031 [DOI] [PubMed] [Google Scholar]
- Kemmlein S, Hahn O, Jann O, 2003. Emissions of organophosphate and brominated flame retardants from selected consumer products and building materials. Atmos. Environ 37, 5485–5493. 10.1016/j.atmosenv.2003.09.025 [DOI] [Google Scholar]
- Kim S-K, Kannan K, 2007. Perfluorinated acids in air, rain, snow, surface runoff, and lakes: relative importance of pathways to contamination of urban lakes. Environ. Sci. Technol 41, 8328–8334. 10.1021/es072107t [DOI] [PubMed] [Google Scholar]
- Kim U-J, Wang Y, Li W, Kannan K, 2019. Occurrence of and human exposure to organophosphate flame retardants/plasticizers in indoor air and dust from various microenvironments in the United States. Environ. Int 125, 342–349. 10.1016/j.envint.2019.01.065 [DOI] [PubMed] [Google Scholar]
- Kim UJ, Oh JK, Kannan K, 2017. Occurrence, removal, and environmental emission of organophosphate flame retardants/plasticizers in a wastewater treatment plant in New York State. Environ. Sci. Technol 51, 7872–7880. 10.1021/acs.est.7b02035 [DOI] [PubMed] [Google Scholar]
- Knobeloch L, Imm P, Anderson H, 2012. Perfluoroalkyl chemicals in vacuum cleaner dust from 39 Wisconsin homes. Chemosphere 88, 779–783. 10.1016/j.chemosphere.2012.03.082 [DOI] [PubMed] [Google Scholar]
- Koponen J, Winkens K, Airaksinen R, Berger U, Vestergren R, Cousins IT, Karvonen AM, Pekkanen J, Kiviranta H, 2018. Longitudinal trends of per- and polyfluoroalkyl substances in children’s serum. Environ. Int 121, 591–599. 10.1016/j.envint.2018.09.006 [DOI] [PubMed] [Google Scholar]
- Kotthoff M, Muller J, Jurling H, Schlummer M, Fiedler D, 2015. Perfluoroalkyl and polyfluoroalkyl substances in consumer products. Environ. Sci. Pollut. Res. Int 22, 14546–14559. 10.1007/s11356-015-4202-7 [DOI] [PMC free article] [PubMed] [Google Scholar]
- Lau C, Anitole K, Hodes C, Lai D, Pfahles-Hutchens A, Seed J, 2007. Perfluoroalkyl acids: A review of monitoring and toxicological findings. Toxicol. Sci 99, 366–394. 10.1093/toxsci/kfm128 [DOI] [PubMed] [Google Scholar]
- Li W, Wang Y, Asimakopoulos AG, Covaci A, Gevao B, Johnson-Restrepo B, Kumosani TA, Malarvannan G, Moon H-B, Nakata H, Sinha RK, Tran TM, Kannan K, 2019. Organophosphate esters in indoor dust from 12 countries: Concentrations, composition profiles, and human exposure. Environ. Int 133, 105178. 10.1016/j.envint.2019.105178 [DOI] [PubMed] [Google Scholar]
- Li Y, Chang Q, Duan H, Liu Y, Zhang J, Li J, 2019. Occurrence, levels and profiles of brominated flame retardants in daily-use consumer products on the Chinese market. Environ. Sci. Process. Impacts 21, 446–455. 10.1039/c8em00483h [DOI] [PubMed] [Google Scholar]
- Liew Z, Goudarzi H, Oulhote Y, 2018. Developmental Exposures to Perfluoroalkyl Substances (PFASs): An Update of Associated Health Outcomes. Curr. Environ. Heal. reports 5, 1–19. 10.1007/s40572-018-0173-4 [DOI] [PMC free article] [PubMed] [Google Scholar]
- Lin P-ID, Cardenas A, Hauser R, Gold DR, Kleinman KP, Hivert M-F, Fleisch AF, Calafat AM, Webster TF, Horton ES, Oken E, 2019. Per- and polyfluoroalkyl substances and blood lipid levels in pre-diabetic adults-longitudinal analysis of the diabetes prevention program outcomes study. Environ. Int 129, 343–353. 10.1016/j.envint.2019.05.027 [DOI] [PMC free article] [PubMed] [Google Scholar]
- Linares V, Belles M, Domingo JL, 2015. Human exposure to PBDE and critical evaluation of health hazards. Arch. Toxicol 89, 335–356. 10.1007/s00204-015-1457-1 [DOI] [PubMed] [Google Scholar]
- Liu D, Zheng C, Qiu Q, Tang J, Xu Y, 2020. Global pattern of studies on phosphorus at watershed scale. Environ. Sci. Pollut. Res 10.1007/s11356-020-07771-y [DOI] [PubMed] [Google Scholar]
- Liu X, Guo Z, Krebs KA, Pope RH, Roache NF, 2014. Concentrations and trends of perfluorinated chemicals in potential indoor sources from 2007 through 2011 in the US. Chemosphere 98, 51–57. 10.1016/j.chemosphere.2013.10.001 [DOI] [PubMed] [Google Scholar]
- Lucattini L, Poma G, Covaci A, de Boer J, Lamoree MH, Leonards PEG, 2018. A review of semi-volatile organic compounds (SVOCs) in the indoor environment: occurrence in consumer products, indoor air and dust. Chemosphere 201, 466–482. 10.1016/j.chemosphere.2018.02.161 [DOI] [PubMed] [Google Scholar]
- Meeker JD, Stapleton HM, 2010. House dust concentrations of organophosphate flame retardants in relation to hormone levels and semen quality parameters. Environ. Health Perspect 118, 318–323. 10.1289/ehp.0901332 [DOI] [PMC free article] [PubMed] [Google Scholar]
- Messerlian C, Williams PL, Minguez-Alarcon L, Carignan CC, Ford JB, Butt CM, Meeker JD, Stapleton HM, Souter I, Hauser R, 2018. Organophosphate flame-retardant metabolite concentrations and pregnancy loss among women conceiving with assisted reproductive technology. Fertil. Steril 110, 1137–1144.e1. 10.1016/j.fertnstert.2018.06.045 [DOI] [PMC free article] [PubMed] [Google Scholar]
- Mitro SD, Dodson RE, Singla V, Adamkiewicz G, Elmi AF, Tilly MK, Zota AR, 2016. Consumer Product Chemicals in Indoor Dust: A Quantitative Meta-analysis of U.S. Studies. Environ. Sci. Technol 50, 10661–10672. 10.1021/acs.est.6b02023 [DOI] [PMC free article] [PubMed] [Google Scholar]
- Mumford SL, Kim S, Chen Z, Gore-Langton RE, Boyd Barr D, Buck Louis GM, 2015. Persistent organic pollutants and semen quality: The LIFE Study. Chemosphere 135, 427–435. 10.1016/j.chemosphere.2014.11.015 [DOI] [PMC free article] [PubMed] [Google Scholar]
- National Research Council, 2000. Toxicological risks of selected flame-retardant chemicals. National Academies Press. [PubMed] [Google Scholar]
- Naughton SX, Terry AVJ, 2018. Neurotoxicity in acute and repeated organophosphate exposure. Toxicology 408, 101–112. 10.1016/j.tox.2018.08.011 [DOI] [PMC free article] [PubMed] [Google Scholar]
- Nazaré S, Davis RD, 2012. A review of fire blocking technologies for soft furnishings. Fire Sci. Rev 1, 1. 10.1186/2193-0414-1-1 [DOI] [Google Scholar]
- OECD, 2018. Toward a New Comprehensive Global Database of Per- and Polyfluoroalkyl Substances (PFASs). [Google Scholar]
- Ospina M, Jayatilaka NK, Wong L-Y, Restrepo P, Calafat AM, 2018. Exposure to organophosphate flame retardant chemicals in the U.S. general population: Data from the 2013–2014 National Health and Nutrition Examination Survey. Environ. Int 110, 32–41. 10.1016/j.envint.2017.10.001 [DOI] [PMC free article] [PubMed] [Google Scholar]
- Percy Z, La Guardia MJ, Xu Y, Hale RC, Dietrich KN, Lanphear BP, Yolton K, Vuong AM, Cecil KM, Braun JM, Xie C, Chen A, 2020. Concentrations and loadings of organophosphate and replacement brominated flame retardants in house dust from the home study during the PBDE phase-out. Chemosphere 239, 124701. 10.1016/j.chemosphere.2019.124701 [DOI] [PMC free article] [PubMed] [Google Scholar]
- Petreas M, Gill R, Takaku-Pugh S, Lytle E, Parry E, Wang M, Quinn J, Park J-S, 2016. Rapid methodology to screen flame retardants in upholstered furniture for compliance with new California labeling law (SB 1019). Chemosphere 152, 353–359. 10.1016/j.chemosphere.2016.02.102 [DOI] [PubMed] [Google Scholar]
- Poothong S, Papadopoulou E, Padilla-Sánchez JA, Thomsen C, Haug LS, 2020. Multiple pathways of human exposure to poly- and perfluoroalkyl substances (PFASs): From external exposure to human blood. Environ. Int 134, 105244. 10.1016/j.envint.2019.105244 [DOI] [PubMed] [Google Scholar]
- Preston EV, McClean MD, Claus Henn B, Stapleton HM, Braverman LE, Pearce EN, Makey CM, Webster TF, 2017. Associations between urinary diphenyl phosphate and thyroid function. Environ. Int 101, 158–164. 10.1016/j.envint.2017.01.020 [DOI] [PMC free article] [PubMed] [Google Scholar]
- Rappazzo KM, Coffman E, Hines EP, 2017. Exposure to Perfluorinated Alkyl Substances and Health Outcomes in Children: A Systematic Review of the Epidemiologic Literature. Int. J. Environ. Res. Public Health 14. 10.3390/ijerph14070691 [DOI] [PMC free article] [PubMed] [Google Scholar]
- Rauert C, Harrad S, 2015. Mass transfer of PBDEs from plastic TV casing to indoor dust via three migration pathways--A test chamber investigation. Sci. Total Environ 536, 568–574. 10.1016/j.scitotenv.2015.07.050 [DOI] [PubMed] [Google Scholar]
- Rauert C, Lazarov B, Harrad S, Covaci A, Stranger M, 2014. A review of chamber experiments for determining specific emission rates and investigating migration pathways of flame retardants. Atmos. Environ 82, 44–55. 10.1016/j.atmosenv.2013.10.003 [DOI] [Google Scholar]
- Rodgers KM, Swetschinski LR, Dodson RE, Alpert HR, Fleming JM, Rudel RA, 2019. Health Toll From Open Flame and Cigarette-Started Fires on Flame-Retardant Furniture in Massachusetts, 2003–2016. Am. J. Public Health 109, 1205–1211. 10.2105/AJPH.2019.305157 [DOI] [PMC free article] [PubMed] [Google Scholar]
- Saikia I, Borah AJ, Phukan P, 2016. Use of Bromine and Bromo-Organic Compounds in Organic Synthesis. Chem. Rev 116, 6837–7042. 10.1021/acs.chemrev.5b00400 [DOI] [PubMed] [Google Scholar]
- Scher DP, Kelly JE, Huset CA, Barry KM, Yingling VL, 2019. Does soil track-in contribute to house dust concentrations of perfluoroalkyl acids (PFAAs) in areas affected by soil or water contamination? J. Expo. Sci. Environ. Epidemiol 29, 218–226. 10.1038/s41370-018-0101-6 [DOI] [PubMed] [Google Scholar]
- Schreder ED, La Guardia MJ, 2014. Flame retardant transfers from U.S. households (dust and laundry wastewater) to the aquatic environment. Environ. Sci. Technol 48, 11575–11583. 10.1021/es502227h [DOI] [PubMed] [Google Scholar]
- Shaw SD, Blum A, Weber R, Kannan K, Rich D, Lucas D, Koshland CP, Dobraca D, Hanson S, Birnbaum LS, 2010. Halogenated flame retardants: do the fire safety benefits justify the risks? Rev. Environ. Health 25, 261–305. [DOI] [PubMed] [Google Scholar]
- Sjödin A, Wong L-Y, Jones RS, Park A, Zhang Y, Hodge C, DiPietro E, McClure C, Turner W, Needham LL, Patterson DG, 2008. Serum Concentrations of Polybrominated Diphenyl Ethers (PBDEs) and Polybrominated Biphenyl (PBB) in the United States Population: 2003–2004. Environ. Sci. Technol 42, 1377–1384. 10.1021/es702451p [DOI] [PubMed] [Google Scholar]
- Stanifer JW, Stapleton HM, Souma T, Wittmer A, Zhao X, Boulware LE, 2018. Perfluorinated Chemicals as Emerging Environmental Threats to Kidney Health: A Scoping Review. Clin. J. Am. Soc. Nephrol 13, 1479–1492. 10.2215/CJN.04670418 [DOI] [PMC free article] [PubMed] [Google Scholar]
- Stapleton HM, Dodder NG, Offenberg JH, Schantz MM, Wise SA, 2005. Polybrominated diphenyl ethers in house dust and clothes dryer lint. Environ. Sci. Technol 39, 925–931. 10.1021/es0486824 [DOI] [PubMed] [Google Scholar]
- Stapleton HM, Klosterhaus S, Eagle S, Fuh J, Meeker JD, Blum A, Webster TF, 2009. Detection of Organophosphate Flame Retardants in Furniture Foam and U.S. House Dust. Environ. Sci. Technol 43, 7490–7495. 10.1021/es9014019 [DOI] [PMC free article] [PubMed] [Google Scholar]
- Stapleton HM, Klosterhaus S, Keller A, Ferguson PL, van Bergen S, Cooper E, Webster TF, Blum A, 2011. Identification of flame retardants in polyurethane foam collected from baby products. Environ. Sci. Technol 45, 5323–5331. 10.1021/es2007462 [DOI] [PMC free article] [PubMed] [Google Scholar]
- Stapleton HM, Misenheimer J, Hoffman K, Webster TF, 2014. Flame retardant associations between children’s handwipes and house dust. Chemosphere 116, 54–60. 10.1016/j.chemosphere.2013.12.100 [DOI] [PMC free article] [PubMed] [Google Scholar]
- Stapleton HM, Sharma S, Getzinger G, Ferguson PL, Gabriel M, Webster TF, Blum A, 2012. Novel and High Volume Use Flame Retardants in US Couches Reflective of the 2005 PentaBDE Phase Out. Environ. Sci. Technol 46, 13432–13439. 10.1021/es303471d [DOI] [PMC free article] [PubMed] [Google Scholar]
- State of California, 2019. In re: Bureau of Electronic and Appliance Repair, Home Furnishings and Thermal Insulation: Amended notice of approval of regulatory action.
- State of California, 2013. Technical Bulletin 117–2013: Requirements, Test Procedure and Apparatus for Testing the Smolder Resistance of Materials Used in Upholstered Furniture. Department of Consumer Affairs, Sacramento, CA. [Google Scholar]
- State of California, 1975. Technical Bulletin 117: Requirements, Test Procedure and Apparatus for Testing the Flame Retardance of Resilient Filling Materials Used in Upholstered Furniture. Department of Consumer Affairs, North Highlands, CA. [Google Scholar]
- Strynar MJ, Lindstrom AB, 2008. Perfluorinated compounds in house dust from Ohio and North Carolina, USA. Environ. Sci. Technol 42, 3751–3756. 10.1021/es7032058 [DOI] [PubMed] [Google Scholar]
- Stubbings WA, Schreder ED, Thomas MB, Romanak K, Venier M, Salamova A, 2018. Exposure to brominated and organophosphate ester flame retardants in U.S. childcare environments: Effect of removal of flame-retarded nap mats on indoor levels. Environ. Pollut 238, 1056–1068. 10.1016/j.envpol.2018.03.083 [DOI] [PubMed] [Google Scholar]
- Sunderland EM, Hu XC, Dassuncao C, Tokranov AK, Wagner CC, Allen JG, 2018. A review of the pathways of human exposure to poly- and perfluoroalkyl substances (PFASs) and present understanding of health effects. J. Expo. Sci. Environ. Epidemiol 10.1038/s41370-018-0094-1 [DOI] [PMC free article] [PubMed] [Google Scholar]
- Tokranov AK, Nishizawa N, Amadei CA, Zenobio JE, Pickard HM, Allen JG, Vecitis CD, Sunderland EM, 2018. How Do We Measure Poly- and Perfluoroalkyl Substances (PFASs) at the Surface of Consumer Products? Environ. Sci. Technol. Lett 6, acs.estlett.8b00600. 10.1021/acs.estlett.8b00600 [DOI] [PMC free article] [PubMed] [Google Scholar]
- Turner A, Filella M, 2017. Bromine in plastic consumer products - Evidence for the widespread recycling of electronic waste. Sci. Total Environ 601–602, 374–379. 10.1016/j.scitotenv.2017.05.173 [DOI] [PubMed] [Google Scholar]
- US Consumer Product Safety Commission, 2012. Upholstered furniture full scale chair tests – open flame ignition resluts and analysis. Bethesda, MD. [Google Scholar]
- van der Veen I, de Boer J, 2012. Phosphorus flame retardants: Properties, production, environmental occurrence, toxicity and analysis. Chemosphere 88, 1119–1153. 10.1016/j.chemosphere.2012.03.067 [DOI] [PubMed] [Google Scholar]
- Vojta Š, Bečanová J, Melymuk L, Komprdová K, Kohoutek J, Kukučka P, Klánová J, 2017. Screening for halogenated flame retardants in European consumer products, building materials and wastes. Chemosphere 168, 457–466. 10.1016/j.chemosphere.2016.11.032 [DOI] [PubMed] [Google Scholar]
- Vuong AM, Yolton K, Dietrich KN, Braun JM, Lanphear BP, Chen A, 2018. Exposure to polybrominated diphenyl ethers (PBDEs) and child behavior: Current findings and future directions. Horm. Behav 101, 94–104. 10.1016/j.yhbeh.2017.11.008 [DOI] [PubMed] [Google Scholar]
- Vykoukalová M, Venier M, Vojta Š, Melymuk L, Bečanová J, Romanak K, Prokeš R, Okeme JO, Saini A, Diamond ML, Klánová J, 2017. Organophosphate esters flame retardants in the indoor environment. Environ. Int 106, 97–104. 10.1016/j.envint.2017.05.020 [DOI] [PubMed] [Google Scholar]
- Wang S, Romanak KA, Hendryx M, Salamova A, Venier M, 2019. Association between Thyroid Function and Exposures to Brominated and Organophosphate Flame Retardants in Rural Central Appalachia. Environ. Sci. Technol 10.1021/acs.est.9b04892 [DOI] [PubMed] [Google Scholar]
- Wang Y, Hou M, Zhang Q, Wu X, Zhao H, Xie Q, Chen J, 2017. Organophosphorus Flame Retardants and Plasticizers in Building and Decoration Materials and Their Potential Burdens in Newly Decorated Houses in China. Environ. Sci. Technol 51, 10991–10999. 10.1021/acs.est.7b03367 [DOI] [PubMed] [Google Scholar]
- Wang Z, Cousins IT, Scheringer M, Hungerbuehler K, 2015a. Hazard assessment of fluorinated alternatives to long-chain perfluoroalkyl acids (PFAAs) and their precursors: Status quo, ongoing challenges and possible solutions. Environ. Int 75, 172–179. 10.1016/j.envint.2014.11.013 [DOI] [PubMed] [Google Scholar]
- Wang Z, Cousins IT, Scheringer M, Hungerbuehler K, 2015b. Hazard assessment of fluorinated alternatives to long-chain perfluoroalkyl acids (PFAAs) and their precursors: Status quo, ongoing challenges and possible solutions. Environ. Int 75, 172–179. 10.1016/j.envint.2014.11.013 [DOI] [PubMed] [Google Scholar]
- Wang Z, Cousins IT, Scheringer M, Hungerbühler K, 2013. Fluorinated alternatives to long-chain perfluoroalkyl carboxylic acids (PFCAs), perfluoroalkane sulfonic acids (PFSAs) and their potential precursors. Environ. Int 60, 242–248. 10.1016/j.envint.2013.08.021 [DOI] [PubMed] [Google Scholar]
- Wang Z, Dewitt JC, Higgins CP, Cousins IT, 2017. A Never-Ending Story of Per- and Polyfluoroalkyl Substances (PFASs)? Environ. Sci. Technol 51, 2508–2518. 10.1021/acs.est.6b04806 [DOI] [PubMed] [Google Scholar]
- Watkins DJ, McClean MD, Fraser AJ, Weinberg J, Stapleton HM, Sjodin A, Webster TF, 2011. Exposure to PBDEs in the office environment: evaluating the relationships between dust, handwipes, and serum. Environ. Health Perspect 119, 1247–1252. 10.1289/ehp.1003271 [DOI] [PMC free article] [PubMed] [Google Scholar]
- Watkins DJ, McClean MD, Fraser AJ, Weinberg J, Stapleton HM, Webster TF, 2013. Associations between PBDEs in office air, dust, and surface wipes. Environ. Int 59, 124–132. 10.1016/j.envint.2013.06.001 [DOI] [PMC free article] [PubMed] [Google Scholar]
- Webster TF, Harrad S, Millette JR, Holbrook RD, Davis JM, Stapleton HM, Allen JG, McClean MD, Ibarra C, Abdallah MA-E, Covaci A, 2009. Identifying Transfer Mechanisms and Sources of Decabromodiphenyl Ether (BDE 209) in Indoor Environments Using Environmental Forensic Microscopy. Environ. Sci. Technol 43, 3067–3072. 10.1021/es803139w [DOI] [PMC free article] [PubMed] [Google Scholar]
- Whitehead TP, Brown FR, Metayer C, Park J-S, Does M, Petreas MX, Buffler PA, Rappaport SM, 2013. Polybrominated diphenyl ethers in residential dust: sources of variability. Environ. Int. 57–58, 11–24. 10.1016/j.envint.2013.03.003 [DOI] [PMC free article] [PubMed] [Google Scholar]
- Wu Q, Kannan K, 2019. Perfluoroalkyl Substances (PFASs) in Foodstuffs and Human Dietary Exposure, in: Gomara B, Marina M (Eds.), Advances in the Determination of Xenobiotics in Food. Bentham Science Publishers, pp. 258–311. [Google Scholar]
- Wu XM, Bennett DH, Calafat AM, Kato K, Strynar M, Andersen E, Moran RE, Tancredi DJ, Tulve NS, Hertz-Picciotto I, 2015. Serum concentrations of perfluorinated compounds (PFC) among selected populations of children and adults in California. Environ. Res 136, 264–273. 10.1016/j.envres.2014.09.026 [DOI] [PMC free article] [PubMed] [Google Scholar]
- Xiao C, Grandjean P, Valvi D, Nielsen F, Jensen TK, Weihe P, Oulhote Y, 2019. Associations of exposure to perfluoroalkyl substances with thyroid hormone concentrations and birth size. J. Clin. Endocrinol. Metab 10.1210/clinem/dgz147 [DOI] [PMC free article] [PubMed] [Google Scholar]
- Xu F, Giovanoulis G, van Waes S, Padilla-Sanchez JA, Papadopoulou E, Magner J, Haug LS, Neels H, Covaci A, 2016. Comprehensive Study of Human External Exposure to Organophosphate Flame Retardants via Air, Dust, and Hand Wipes: The Importance of Sampling and Assessment Strategy. Environ. Sci. Technol 50, 7752–7760. 10.1021/acs.est.6b00246 [DOI] [PubMed] [Google Scholar]
- Zheng X, Sun R, Qiao L, Guo H, Zheng J, Mai B, 2017. Flame retardants on the surface of phones and personal computers. Sci. Total Environ 609, 541–545. 10.1016/j.scitotenv.2017.07.202 [DOI] [PubMed] [Google Scholar]
Associated Data
This section collects any data citations, data availability statements, or supplementary materials included in this article.