

SUMMARY
Neutrophils are the most abundant peripheral immune cells and thus, are continually replenished by bone marrow-derived progenitors. Still, how newly identified neutrophil subsets fit into the bone marrow neutrophil lineage remains unclear. Herein, we use mass cytometry to show that two recently defined human neutrophil progenitor populations contain a homogeneous progenitor subset we term ‘early neutrophil progenitor (eNeP)’ (Lin-CD66b+CD117+CD71+). Surface marker- and RNA-expression analyses, together with in vitro colony formation and in vivo adoptive humanized mouse transfers, indicate that eNeP are the earliest human neutrophil progenitors. Furthermore, we identified CD71 as a marker associated with the earliest neutrophil developmental stages. Expression of CD71 marks proliferating neutrophils, which were expanded in the blood of melanoma patients and detectable in blood and tumors from lung cancer patients. In summary, we establish CD117+CD71+ eNeP as the inceptive human neutrophil progenitor and propose a refined model of the neutrophil developmental lineage in bone marrow.
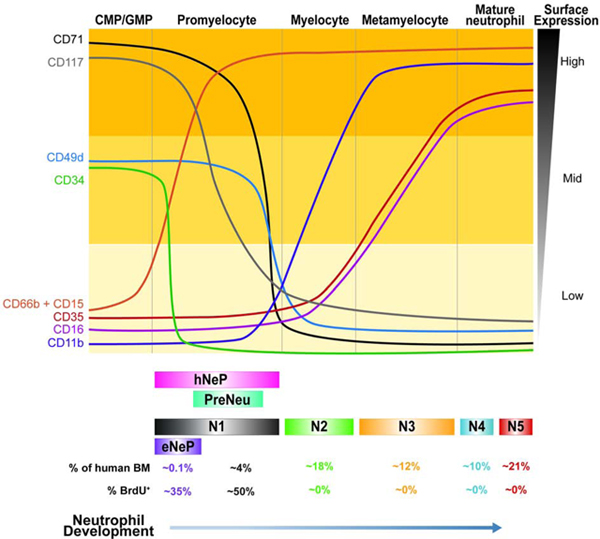
Graphical Abstract
INTRODUCTION
Neutrophils are short-lived immune cells that play crucial roles in host defense and inflammation (Summers et al. 2010; Clark et al. 2007; Sierro et al. 2017; Ley et al. 2018). Due to their abundance and short lifespan in blood (Lahoz-Beneytez et al. 2016), these cells are constantly replenished from progenitors in the bone marrow and have long been considered a homogenous population. Likewise, our current paradigm for understanding neutrophil development in human bone marrow has existed for decades (Bainton, Ullyot, and Farquhar 1971) and has lacked critical reassessment (Hidalgo et al. 2019). The introduction of technologies for high-dimensional characterization of cell populations such as mass cytometry (cytometry by time-of-flight; CyTOF) and single-cell RNA-sequencing (scRNA-seq) makes evaluation of neutrophil heterogeneity possible. Neutrophils have received much attention because of their considerable immunosuppressive functions as granulocytic myeloid-derived suppressor cells in cancer (Talmadge and Gabrilovich 2013). A high density of neutrophils within the tumor microenvironment is associated with reduced patient survival (Gentles et al. 2015), making these cells attractive targets for cancer immunotherapy.
The current model of neutrophil differentiation in human bone marrow describes several developmental stages, each with distinct gene-expression signatures (Ng, Ostuni, and Hidalgo 2019). First, multipotent granulocyte-monocyte-progenitor (GMP), which develop from the common-myeloid-progenitors (CMP), give rise to neutrophil and monocyte precursors. Promyelocytes then arise immediately downstream of GMP and express the neutrophil lineage marker CD66b (Hidalgo et al. 2019). Subsequent neutrophil development occurs through stepwise lineage and morphological maturation stages (Cowland and Borregaard 2016). Following upregulation of CD11b and CD16 expression, promyelocytes differentiate through myelocytes and metamyelocytes into banded and segmented neutrophils. Over the past decade, work has redefined CMP and GMP and their ability to generate downstream subsets (Mori et al. 2009; Yáñez et al. 2017; Drissen et al. 2019, 2016; Mori et al. 2015). Moreover, the dogma of hierarchical developmental stages in hematopoiesis has recently been challenged with a redefined model, in which adult human bone marrow contains only multipotent and unipotent progenitor cells (Notta et al. 2016).
We previously identified a neutrophil progenitor population in human bone marrow, termed ‘human neutrophil progenitors’ or ‘hNeP’ (Lin−CD66b+CD117+) (Zhu et al. 2018). These cells constitute 1–3% of bone marrow neutrophils and contain a CD34− and CD34+ population. When transferred into humanized NSG-SGM3 mice that support re-engraftment of human hematopoietic cells, both CD34− and CD34+ hNeP produce only neutrophils, confirming their status as neutrophil progenitors. Evrard and colleagues have described a proliferative bone marrow neutrophil population in both mice and humans, termed ‘preNeu’ (Evrard et al. 2018). These cells are Lin−CD66bCD34−CD49d+ and constitute approximately 5% of total bone marrow neutrophils. PreNeu differentiate into non-proliferating, immature and mature neutrophils.
However, the relationship between hNeP and preNeu, and their respective placement in the bone marrow neutrophil lineage, remains unclear. Herein, we aimed to clarify the relationship between these recently-defined neutrophil progenitors using mass cytometry. Specifically, we identified 5 neutrophil subsets, one of which was defined by expression of CD71, contained proliferating cells, and resembled both preNeu and promyelocytes in terms of morphology and surface marker expression. Furthermore, we identified within CD71+ neutrophils a distinct CD117+ subset as an inceptive progenitor of the neutrophil lineage. Our data support a developmental path for neutrophils from eNeP through downstream stages; thereby reconciling previously incompatible findings and introducing a unified model of neutrophil development in human bone marrow.
RESULTS
CyTOF profiling of human bone marrow neutrophils reveals 5 clusters with distinct surface markers
To define neutrophil heterogeneity in human bone marrow, we used CyTOF to profile 35 protein surface markers (Fig. 1A) across bone marrow from 5 healthy donors (Table S1). Applying a nonlinear dimensionality-reduction method, we projected 2,540,175 CD45+ live cells (Table S1) onto a 2-dimensional map via the uniform manifold approximation and projection (UMAP) method (Becht et al. 2018). Clustering analysis using PhenoGraph (Levine et al. 2015; H. Chen et al. 2016) resulted in the identification of known immune cell types (Fig. 1B, Fig. S1) (Fig. 1C-D). Neutrophils made up nearly 90 % of live cells in human bone marrow, consistent with previous reports (Evrard et al. 2018; Zhu et al. 2018).
Figure 1. Study of human bone marrow neutrophil heterogeneity by mass cytometry.

A) CyTOF antibody panel of human immune cell lineage markers and proteins associated with neutrophil function and maturation. CyTOF was performed on fresh human bone marrow from healthy donors (n=5).
B) Two-dimensional visualization of major leukocyte populations in human bone marrow (random sampling a total 50,000 cells in which 10,000 cells from each of 5 samples) using UMAP. Major populations were defined by PhenoGraph clustering of 2,540,175 CD45+ live cells and classified based on expression of lineage-specific surface markers. Please also see Fig. S1.
C) Single-cell expression of lineage surface markers Siglec-8 (eosinophils), CD66b (neutrophils), CD3/CD127 (NK/T cells), and CD14 (monocytes) used to define major leukocyte populations.
D) Single-cell expression of neutrophil surface markers CD49d, CD14, CD11b, and CD16 highlights distinct expression within neutrophil clusters.
Next, we selected neutrophils (CD66b+Siglec8−) for further clustering by Phenograph, producing 18 clusters (Fig. S2A). Statistical evaluation based on relative changes (delta cutoff <0.1, Fig. S2B) in the area under cumulative distribution function (CDF) curve for each number of clusters from 2 to 15 (Wilkerson and Hayes 2010) identified 5 meta clusters (N1-N5) from these Phenograph clusters (Fig. 2A). Each meta-cluster exhibited a distinct combination of marker expression (Fig. 2B). Subset N1 expressed a marker associated with neutrophil precursors CD49d (Evrard et al. 2018) and lacked maturation markers including CD11b, CD16, CD101, and CD10. The defining marker of subset N1 was CD71, a protein involved in iron metabolism (Aisen 2004), previously not associated with neutrophils. Dimensionality reduction using diffusion map (Coifman et al. 2005) suggested a potential neutrophil lineage trajectory from N1 toward N5 (Fig. 2C) along the first diffusion component. As expected, expression of maturation markers (CD10, CD16) was consistent with the diffusion map-inferred lineage, while CD71 was exclusively expressed in the earliest neutrophil subset N1 (Fig. 2D-E). Together, these data indicate that subset N1 contains neutrophils at very early stages of neutrophil development compared to the other 4 identified clusters. Expression of markers associated with distinct neutrophil developmental stages defined subsets N2 and N3 as immature neutrophils due to their lack of CD10 and CD16 expression. In contrast, subsets N4 and N5 expressed CD10 and CD16, identifying these subsets as mature neutrophils. Surface marker expression of subset N1 overlapped with the conventionally accepted definition of promyelocytes, based on the absence of CD11b and CD16 expression. Furthermore, subset N1 also overlapped with preNeu, based on their shared expression of CD49d. Thus, our subset N1 shared unmistakable similarities with promyelocytes and preNeu according to surface marker expression and frequency within bone marrow neutrophils. Moreover, CD35, complement receptor type 1, is a marker of blood neutrophils in both healthy donors and in subjects with infectious diseases (Pliyev et al. 2012). Here, we show that CD35 was exclusively expressed on mature neutrophil subsets and was absent on the neutrophil precursor subset N1 as well as N2 (Fig. 2D-E). Thus, CD35 can be used as a marker to characterize neutrophil maturation states in human bone marrow.
Figure 2. Human bone marrow neutrophil heterogeneity identified by unbiased clustering (see also Fig. S2).

A) Consensus clustering of PhenoGraph clusters identified 5 merged subsets of CD66b+ neutrophils (labeled as N1-N5) visualized by UMAP projection of total CD66b+ neutrophils.
B) Heatmap depicting average surface marker expression of neutrophils, highlighting expression of subset-specific markers, such as CD71 on subset N1.
C) Dimensionality reduction by diffusion map of CyTOF data revealed neutrophil lineage trajectory. Random samplings of 500 cells from each cluster N1-N5 were plotted on two diffusion components.
D) Single-cell expression of early neutrophil marker CD71 and maturation markers CD35, CD10, and CD16 on human bone marrow neutrophils.
E) Cell ordering inferred by diffusion map analysis represented by the first diffusion map component for early and mature markers (CD71, CD35, CD10, CD16).
F) Comparison of the frequencies of N1-N5 among healthy human bone marrow donors reveals minimal inter-donor heterogeneity. N1-N5 neutrophil subsets were present in all donors (n=5).
To analyze inter-donor variability, we determined the frequencies of the 5 neutrophil subsets in each individual donor. We found that all 5 clusters had similar frequencies in each donor, with N1 consistently representing the smallest population (approximately 5%) (Fig. 2F). Thus, using high-dimensional analysis we identified 5 neutrophil bone marrow subsets and their defining surface markers, including previously unappreciated patterns of CD71 and CD35 expression. Furthermore, subset N1 strongly resembled both promyelocytes and preNeu cells.
CyTOF-identified clusters align with bone marrow neutrophil maturation stages
In order to isolate the 5 bone marrow neutrophil populations for further investigation, we devised a flow cytometry gating strategy based on the top 3 most differentially expressed surface markers (CD71, CD16 and CD10) (Fig. 2B, Fig. 3A). We defined subset N1 as CD16−CD10− CD71+, subset N2 as CD16−CD10−CD71−, subset N3 as CD16+CD10−, subset N4 as CD16+CD10int and subset N5 as CD16+CD10hl. Biaxial gating of our CyTOF data based on these 3 markers (Fig. S2C, S2D) recapitulated our UMAP analysis (Fig. 2A), validating our gating strategy. The frequency of these 5 subsets, as analyzed by flow cytometry in the bone marrow of 5 healthy donors, showed similar frequencies across individuals (Fig. 3B). Importantly, the surface marker expression pattern associated with each subset and frequencies of subsets N1-N5 were very similar in a heterogeneous cohort of 10 different healthy donors (Supplemental Table S1). Moreover, neutrophil subset frequencies were similar when two independent cohorts of 5 donors were assessed by either flow cytometry or CyTOF (Fig. 2E, 3B), suggesting that this gating strategy was universally applicable. Furthermore, flow cytometry revealed similar expression of the surface markers utilized in the CyTOF panel on the 5 neutrophil bone marrow subsets (Fig. 3C). For example, subset N1 and subset N2 not only differed in CD71 expression, but also in CD101 expression, a surface marker for neutrophil maturation (Evrard et al. 2018). Importantly, flow cytometry also confirmed that CD71 expression was restricted to subset N1. Analogous to our findings with CyTOF, CD35 and CD16 were able to distinguish subsets N2 and N3 and subset N4 and N5 did not show qualitatively but rather quantitatively differential surface marker expression. However, comparison of CD11b and CD101 analysis between flow cytometry and CyTOF showed a more pronounced distinction between positive and negative expression by flow cytometry.
Figure 3. Flow cytometry confirms 5 human bone marrow neutrophil subsets (see also Fig. S2).

A) Flow cytometry gating strategy based on marker expression from CyTOF data shown in Fig. 2B to identify 5 bone marrow neutrophil clusters.
B) Frequencies of 5 neutrophil subsets based on flow cytometry data for an independent cohort of 5 human bone marrow donors confirms frequencies observed in CyTOF data.
C) Histograms of neutrophil markers across 5 neutrophil subsets based on flow cytometric analysis and gating strategy shown in A.
D) Overlay of 5 identified neutrophil subsets onto CD16 vs. CD11b biaxial dot plot based on the conventional gating strategy for neutrophil progenitors (Hidalgo et al. 2019) identified subsets N1 to N5 as Promyelocytes (Pro), Myelocytes (Myelo), Metamyelocytes (Meta) and banded and segmented neutrophils (Neu).
Finally, by superimposing a published gating strategy for bone marrow neutrophil progenitors on the basis of CD16 and CD11b expression (Hidalgo et al. 2019) onto our 5 clusters, we showed that subset N1 represented promyelocytes, N2 represented myelocytes, N3 was similar to metamyelocytes, and N4 and N5 represented banded and mature neutrophils (Fig. 3D). However, subsets N4 and N5 mostly overlapped and were only subtly distinguishable in the CD16 versus CD11b plot, due to their similar expression of CD11b (Fig. 3C). Applying these subsets onto the existing neutrophil differentiation paradigm suggests a developmental trajectory from subset N1 towards subset N5, wherein N1 represents promyelocytes in both mass and flow cytometry analysis.
CD117 identifies a subpopulation of subset N1, termed eNeP.
We have previously identified a human CD66b+CD117+ neutrophil progenitor population termed hNeP (Zhu et al. 2018). Since our CyTOF clustering result did not discover these hNeP as a distinct population, we used our flow cytometry workflow including incorporation of ‘fluorescence minus one’ (FMO) controls (Fig. S3) to determine the overlap between hNeP cells and our 5 called clusters. Stratification of hNeP by CD71, the marker defining subset N1, revealed CD71+ and CD71− populations within hNeP (Fig. 4A), suggesting that hNeP were more heterogeneous than previously appreciated and comprised at least two distinct populations. When our flow cytometry gating strategy was applied onto CD71+ and CD71− hNeP, we found that the CD71− hNeP subset specifically contained cells belonging to all neutrophil subsets except N1 (Fig. 4B). Accordingly, CD71− hNeP consisted of more mature neutrophil subsets which express CD101 but lack expression of CD49d (Fig. 4C). We have previously shown that hNeP are CD117+ (Zhu et al. 2018). However, CD117 expression in our CyTOF data was not entirely distributed in the neutrophil progenitors, as in our flow cytometry results (Fig. S4A). We observed relatively high expression of CD117 in a fraction of subset N1, which failed to be recognized by Phenograph (Fig. S2A) even after isolating subset N1 for further unbiased clustering (data not shown). Since hNeP (CD66b+CD117+) were shown to be unipotent neutrophil progenitors in NSG-SGM3 mouse transfer experiments (Zhu et al. 2018), we hypothesized that CD117+CD71+ cells within subset N1 were the pure population of neutrophil progenitors. Therefore, expression of surface markers not included in our gating strategy were analyzed on both CD71+ hNeP (CD117+CD71+ cells) and CD71− hNeP cells (Fig. 4C). Again, total hNeP showed heterogeneous expression for CD11b, CD101, CD35, CD49d, and CD38, while CD71+ hNeP represented a pure population with regard to the aforementioned markers, with uniformly positive expression of progenitor markers CD49d and CD38 and lack of expression of maturation markers CD11b, CD101 and CD35. We therefore termed these CD71+ hNeP ‘early Neutrophil Progenitors’ or ‘eNeP’. The neutrophil maturation marker CD101 was positive on CD71− hNeP, but negative on eNeP, indicating that eNeP might be, as their affiliation with subset N1 suggests, the earliest bone marrow neutrophil progenitors within heterogeneous hNeP. eNeP represent ~2.5 % of subset N1 and only ~0.14 % of all bone marrow neutrophils (Fig. S4B), making these cells a small population within the bone marrow. Mapping eNeP on the diffusion map trajectory (Fig. 2C) showed that eNeP were likely the earliest identified cells found within the neutrophil developmental lineage, and eNeP possessed these early progenitor surface markers as shown in the trajectory heatmap (Fig. S4C–D). Thus, by using flow cytometry we further characterized subset N1 and stratified it according to CD117 expression into the smaller eNeP and the bigger CD117−CD71+ fraction (N1 w/o eNeP).
Figure 4. CD71+hNeP, termed eNeP, are a distinct subset of progenitors (see als Fig. S3, Fig. S4 and Fig. S5).

A) Stratification of previously identified neutrophil progenitor population termed hNeP (Zhu et al. 2018) by promyelocyte (N1) marker CD71 identified CD71+hNeP and CD71−hNeP. Because CD71 was found to be a defining marker for neutrophil progenitors within promyelocytes (Fig. 3), CD71+hNeP were re-labeled as ‘early NeP’ or ‘eNeP’. Subsequently, eNeP (CD71+hNeP) and CD71−NeP were backgated using the gating strategy depicted in Fig. 3A, revealing that only eNeP were a pure population and negative for maturation markers CD10 and CD16.
B) Frequencies of 5 defined neutrophil subsets (N1 to N5) in eNeP (CD71+hNeP) and CD71− hNeP.
C) Comparison of selected neutrophil markers based on histograms of flow cytometric analysis of hNeP, eNeP (CD71+NeP) and CD71−NeP.
D) Top: Flow cytometry gating strategy to identify previously described preNeu (Evrard et al. 2018). Bottom: preNeu were further stratified according to CD71 and CD117 expression, identifying eNeP as a small subpopulation of preNeu (2.6%; gate c). The resulting subsets were then examined for neutrophil maturation marker CD11b and progenitor marker CD38.
Next, we applied the CD16 versus CD11b gating strategy for bone marrow neutrophil progenitors (Hidalgo et al. 2019) to eNeP and CD71− hNeP (Fig. S4E-F). eNeP were located within the promyelocyte gate while CD71− hNeP were dispersed out over the more mature subsets from myelocytes to banded and mature neutrophils. eNeP however constituted less than 1% of the entire promyelocyte population and subset N1 represented around 70% of promyelocytes, demonstrating that eNeP are a small precursor subpopulation.
We then asked whether the recently discovered human neutrophil progenitors ‘preNeu’ (Evrard et al. 2018) were part of our subset N1. Using the published preNeu gating strategy (Evrard et al. 2018) on our CyTOF and flow cytometry data, we identified CD66b+CD15+CD49+Siglec8−CD34−CD101− preNeu and analyzed their expression of CD71 and CD117 (Fig. 4D and Fig. S5A). preNeu stratified by CD71 and CD117 revealed 3 preNeu subsets, namely a CD71−CD117− subset, a CD71+CD117− subset, and a small CD71+CD117+ subset. These 3 preNeu subsets exhibited distinct expression of CD38, a marker associated with myeloid progenitor populations, with the CD71+CD117+ subset being uniformly positive for this progenitor marker. Approximately 70% and ~85 % of preNeu were positive for CD71 as determined by CyTOF and flow cytometric analysis, respectively, confirming that the majority of preNeu were a part of subset N1, which is defined by CD71. Furthermore, eNeP were part of preNeu (CD71+CD117+ preNeu subset) and represented 4.4% and 2.6% of preNeu as determined by CyTOF and flow cytometry, respectively (Fig. 4D and Fig. S5B). In summary, analysis of CD117 and CD71 co-expression by flow cytometry identified eNeP, a homogeneous neutrophil progenitor subset in humans, which potentially represent the hierarchically ‘earliest’ unipotent neutrophil progenitor cells within promyelocytes and preNeu.
eNeP are proliferating neutrophil progenitors
To determine the progenitor characteristics of eNeP, we probed expression of the stem cell marker CD34 (Sidney et al. 2014) on eNeP and the rest of hNeP (CD71− hNeP) (Fig. 5A-B), because hNeP were shown to be comprised of both CD34+ and CD34− subsets (Fig. 4A) (Zhu et al. 2018). While a sizable fraction (~8%) of eNeP stained positive for CD34, this marker was absent on CD71− NeP. Importantly, none of the 5 CyTOF-identified clusters had more than 0.01% CD34+ cells (Fig. 5B), indicating that only eNeP are enriched for CD34+ cells. To confirm that these cells indeed had features of progenitor cells and possessed proliferative potential, we measured BrdU incorporation in bone marrow neutrophils (Fig. 5C). While only N1 and eNeP contained BrdU+ cells, the surface expression of CD66b differed between these two proliferating subsets (Fig 5C). The majority of non-proliferating N1 and eNeP cells were CD66blo. However, unlike proliferating eNeP which were also low in CD66b expression, the majority of BrdU+ proliferating N1 cells were CD66bhi, perhaps reflecting ongoing maturation during the proliferation process. We also found all proliferating BrdU+ cells to be positive for CD71 (Fig. 5D), in line with findings of CD71 and Ki67 expression on activated T cells (Motamedi, Xu, and Elahi 2016).
Figure 5. eNeP are early unipotent proliferating neutrophil progenitors.

A) Analysis of CD34 expression on early neutrophil subsets by flow cytometry.
B) Frequency of CD34+cells among 5 neutrophil clusters, eNeP and CD71−NeP analyzed by flow cytometry as shown in A. Please also see Fig. S6.
C) Quantification of proliferation by measuring BrdU incorporation with flow cytometry. Neutrophil subsets not depicted here contained < 0.2% proliferating cells (not shown).
D) Histogram of BrdU staining in bone marrow neutrophils stratified by CD71. Gated on BrdU+ or BrdU− live neutrophils after exclusion of doublets (not shown).
E) Microscopic analysis of morphology of fluorescence-activated cell sorted neutrophil subsets following Cytospin and Hema 3™ staining identified the typical morphology of neutrophil maturation gradually developing along identified neutrophil subsets. Please also see Fig. S6.
F) Quantification of in vitro progenitor differentiation assay of fluorescence-activated cell sorted eNeP and cluster N1 (w/o eNeP). Colonies were identified by side-by-side comparison with representative images of pre-defined colonies from 3 independent plates.
G) eNePs or N1 w/o eNePs human bone marrow cells were sorted and adoptively transferred into irradiated NSG-SGM3 mice. Recipient bone marrow was analyzed by flow cytometry after 5 days. Plots show the absence of T cells (CD3), NK cells (CD56), B cells (CD19), monocytes (CD14), and eosinophils (Siglec8, CD203c) and sole presence of neutrophils (CD66b) in human CD45+ (hCD45) progeny. Contour plot shows CD66bLo (red) and CD66bhi (blue) hCD45+ progeny. Grey contour indicates negative control (mouse CD45+ cells). Flow cytometry is representative of 3 independent experiments (n=3 mice per group). Please also see Fig. S5.
In our previous hNeP study, we have shown that both CD34 positive and negative hNeP exclusively generate neutrophils after transfer into NSG-SGM3 mice (Zhu et al. 2018). Hence, both CD34+ and CD34− hNeP must at least be partially comprised of neutrophil progenitors. Looking closer, we found that CD34+ cells were restricted to eNeP (CD34+CD71+ hNeP or CD34+CD71+CD117+ cells) and absent from all other clusters (Fig. 5B and Fig. S6A), indicating that all previously-reported CD34+ hNeP fell within eNeP. In short, CD34+ hNeP were identical with the herein identified CD34+ eNeP. Approximately ⅓ of these CD34+ eNeP are BrdU+ and proliferating (Fig. S5C). The fact that CD34+ eNeP were both proliferative and non-proliferative could perhaps be explained by the existence of a quiescent state of these neutrophil progenitors. Taken together, these results suggest that CD34+ eNeP possess unipotent differentiation potential in vivo.
We therefore aimed to further characterize CD34− hNeP, which also produced neutrophils in NSG-SGM3 mice (Zhu et al., 2018). CD34− hNeP consisted of CD71+CD101− and CD71−CD101+ populations (Fig. S6A), of which only the former localized in the promyelocyte gate. The CD71−CD101+population, aligned with more mature subsets (Fig. S6A). Based on these findings, we believe that only the CD71+CD101− fraction was responsible for the neutrophil lineage reconstitution observed after transfer of CD34− hNeP into NSG-SGM3 mice (Zhu et al., 2018).
Thus, we next sought to determine whether neutrophils derive from all CD71+ bone marrow neutrophils (N1) or solely the CD117+ eNeP within N1. To address this question, we first examined the morphology of bone marrow neutrophil subsets via cytospin (Fig. 5E, 6B and S7B). eNeP displayed morphological features of progenitor cells, including large, round nuclei and a high nucleus-to-cytoplasm ratio (Fig. 5E). Nuclei of the rest of N1 appeared flatter and the nucleus-to-cytoplasm ratio decreased, a morphology that continued through subset N2. Cells of subsets N3, N4, and N5 showed morphology more similar to mature neutrophils, in line with their surface marker expression. We then sorted eNeP and N1 w/o eNeP into cytokine-supplemented methylcellulose and counted progeny colonies. As expected, eNeP produced granulocyte-containing colonies (Fig. 5F). In contrast, the N1 w/o eNeP subset generated almost no colonies, demonstrating that only eNeP are potent neutrophil progenitors. As subset N1 was the only cluster with surface marker expression consistent with progenitor cells (CD38, CD49d, and a lack of CD11b and CD101), these data also suggested that eNeP are the only progenitors within CD66b+ bone marrow neutrophils. In order to provide more conclusive evidence in vivo that eNeP indeed differentiate into their downstream subset(s), we adoptively transferred FACS-sorted eNeP (CD71+CD117+) and ‘N1 w/o eNeP’ (CD71+CD117−; i.e., lacking eNeP) from healthy human bone marrow into recipient NSG-SGM3 mice, which permitted engraftment of human hematopoietic stem cells, particularly those of the myeloid lineage. In order to track lineage, we examined the bone marrow and blood early at day 5 after adoptive transfer (Zhu et al. 2018). First, we observed that eNeP produced only neutrophil-lineage cells in bone marrow 5 days following adoptive transfer (see Fig. 5G and Fig. 5SD-E). We found no production of T cells, NK cells, eosinophils, or monocytes by eNeP. Second, we observed that a higher frequency of eNeP-derived progeny in the bone marrow expressed lower of CD66b and slightly lower side-scatter compared to progeny derived from N1 w/o eNeP (40% CD66blo in eNeP vs. 12.8% in N1 w/o eNeP) (Fig 5G). These data suggest that the eNeP were positioned earlier in the neutrophil developmental lineage than the N1 w/o eNeP because the eNeP progeny appeared to be less mature (more cells with CD66blo and fewer with CD66bhi), averaging only 49% CD66bhi for eNeP vs. 71% CD66bhi for N1 w/o eNeP, over the given time period (Fig. S5E). We also found the presence of only human neutrophil progeny from transferred eNePs in the blood of these mice, albeit in very low numbers at this early time point. Although we tried to apply the eNeP and N1-N5 gating strategy to the neutrophil progeny, we were unable to see progeny that contributed to the eNeP or N1 populations. We did observe N2-N4 progeny, again with the eNeP-derived progeny appearing slightly less mature than the N1 w/o eNeP-derived progeny (Fig S5D and Fig S5F). Figures S5E and S5F show replication with consistent results of 3 experiments of the adoptive transfer of human progenitors into recipient NSG-SGM3 mice. In all experiments, eNeP (red dots) produced only neutrophils (Fig. S5E-F), and the eNeP progeny appeared to be less mature than N1-eNeP (blue dots) progeny (Fig. S5E). These data are in line with previous observations with hNeP transfers (Zhu et al. 2018) showing unipotency, and these data on eNeP show functional and unipotent production of neutrophil progeny by eNeP. Together with our in vitro differentiation assay (Fig. 5E-F), these data indicate that eNeP are unipotent neutrophil progenitors, and are likely a bit more immature in their lineage development than are ‘N1 w/o eNeP’.
Figure 6. Transcriptome analysis reveals distinct gene expression of eNeP.

A) eNep, N1 w/o eNeP, N2 and N3-4-5 (Neuts) were fluorescence-activated cell sorted, followed by bulk RNA sequencing. Please also see Fig. S6. MDS plot of eNeP, preNeu-like, immature and mature neutrophils (3 replicates each) suggested the developmental stages starting with eNeP toward more mature neutrophils. Number of statistically significant differentially expressed (logFC 2 and FDR-corrected p-values cutoff 0.05) genes (red: up-regulated, blue: down-regulated) for the comparison between eNep-N1(w/o eNeP), N1(w/o eNeP) - N2, N2 - mature neutrophils (N3-4-5).
B) Log2 expression of CD11b (ITGAM) and CD16 (FCGR3A) of the 4 sorted neutrophil subsets shown in A aligned with the conventional neutrophil development gating strategy (Hidalgo et al. 2019) of neutrophil maturation from promyelocytes to mature neutrophils (compare to Fig. 3D).
C) Five gene clusters from pairwise differentially expression analysis between two neutrophil subsets next to each other in the developmental lineages (eNeP-N1(w/o eNeP), N1(w/o eNeP) - N2, N2 - mature neutrophils (N3-4-5)). Biological process GO terms that were enriched in each of 5 subsets.
D) Volcano plot of differentially expressed genes between the earliest neutrophil progenitor subsets eNeP and N1 w/o eNeP (−log 10 adjusted p-values - yaxis and log2FC - xaxis) revealed 6 up-regulated genes in eNeP.
E) Top up- and down-regulated genes (logFC 2, FDR-corrected p values 0.05) in eNeP from (D) and neutrophil genes (transcriptional factors CEBPA/E, neutrophil marker MPO, AZU1, FCGR3A, S100A8/9) confirmed early developmental stage of eNeP.
These findings, however, raised the question as to how eNeP are distinct from more upstream progenitors. To visualize defining characteristics between eNeP and CD34+CD38+ myeloid progenitor cells, such as CMP and GMP, we compared the expression of neutrophil-defining surface markers CD66b and CD15 on these subsets (Fig. S7A-B). While CD34+CD38+ myeloid progenitor cells were negative for CD66b and CD15 in both flow cytometry and CyTOF data (Cluster 8 in Fig. S1; Fig. S7A-B), eNeP showed marker expression between that of myeloid progenitors and more mature neutrophils (subset N2). These data confirm eNeP as the earliest progenitors in human bone marrow expressing neutrophil lineage markers CD66b and CD15.
Transcriptomic analysis reveals gene signatures of human neutrophil development
To understand the molecular characteristics of different neutrophil subsets, we used RNA-seq to profile sorted subsets (Fig. S6B): eNeP, N1 w/o eNeP, N2, and mature neutrophil subsets (N3+4+5 combined). Multidimensional scaling (MDS) analysis based on differentially expressed genes (DEGs; see STAR* Methods) between all pairs of 12 samples showed that sorted neutrophil subsets grouped together according to the clusters we defined based on CyTOF and flow cytometry (Fig. 6A). According to their gene expression, eNeP shared more similarities with subset N1 (CD71+ neutrophils) than with immature and mature neutrophils (CD16+). The number of DEGs (both up- and down- regulated) between two neighboring neutrophil subsets increased from 52 genes between eNeP and subset N1 to 2,865 genes between immature (CD16−) and mature (CD16+) neutrophils with the same statistical cutoffs (Fig. 6A). These findings reflected the heterogeneity of transcriptional output from neutrophils at different developmental stages, which were similar to the hierarchical trajectory inferred from our CyTOF data (Fig. 2C). The RNA expression of surface markers CD11b (ITGAM) and CD16 (FCGR3A) of sorted neutrophil subsets confirmed flow cytometry data (Fig. 3D) and suggested that eNeP were distinct from the rest of subset N1 and possessed the lowest CD11b expression (Fig. 6B). Thus, our transcriptome data support the distinct early development characteristics of eNeP.
Next, we combined all 5,446 DEGs from each of the 5 pairwise comparisons (eNeP vs. N1 w/o eNeP, N1 w/o eNeP vs. N2, N2 vs. mature neutrophils, eNeP vs mature neutrophils) for hierarchical clustering analysis. We identified 5 different groups of genes with different neutrophil differentiation expression patterns (Fig. 6C). We found 2,586 genes highly expressed in early neutrophils (N1 including eNeP) compared to later developmental neutrophils (gene cluster A and B) with enriched Gene Ontology (GO) terms relating to early cellular features such as cell cycle, DNA replication and repair, and mitochondria (Table S2). Genes enriched in mature neutrophils were subsequently grouped into 2 clusters (gene cluster C and D) and classified by GO terms complement activation, cell-matrix adhesion, and regulation of neutrophil activation. 266 genes (cluster E) were specific to immature neutrophils and associated with immune response, tissue regeneration, and cytokines (Table S2). Collectively, our transcriptome data are consistent with the notion that eNeP and subset N1 form the early stages of neutrophil development in bone marrow. We next interrogated the genes between eNeP and subset N1 in order to determine which subset precedes the other in neutrophil maturation. Comparing eNeP and subset N1 revealed only 6 up-regulated genes in eNeP (Fig. 6D-E), including a few involved in early neutrophil development (AZU1, PRTN3, CTSG, MPO) according to recent published RNA-seq data (Grassi et al. 2018). These results indicate that eNeP is a more homogenous early neutrophil progenitor subset than established subsets, such as promyelocytes or preNeu. In addition, 46 genes including genes typically enriched in mature neutrophils (S100A8, S100A9, ITGAM, FCN1, MMP8) were statistically down-regulated in eNeP compared to subset N1, providing additional evidence that eNeP are upstream progenitors of subset N1 or preNeu. In addition, Zinc Finger BED Domain-Containing Protein 3 (ZBED3) was identified as an up-regulated gene in comparison to all other neutrophil subsets (Fig. 6E). In addition, ZBED3 was lowly detected in the recent RNA-Seq data of 4 conventional neutrophil subsets (Grassi et al. 2018). In summary, transcriptomic analysis revealed eNeP as an early neutrophil progenitor with a gene expression signature distinct from that of preNeu and promyelocytes.
Expansion of the CD71+ subset in cancer patients
Cancer is associated with an increase of neutrophils and neutrophil precursors in the blood due to aberrant expression of chemokines and cytokines. These neutrophil subsets egress from the bone marrow at earlier stages than under physiological steady-state conditions (Talmadge and Gabrilovich 2013). We asked whether we could detect an expansion of eNeP and subset N1 in cancer patients. We analyzed blood from healthy donors and melanoma patients (Table S3) with our CyTOF-antibody panel and identified subset N1 by gating on Lin−CD66b+CD16−CD10− CD71+ cells (Fig. 7A-B). We were unable to confidently identify eNeP in our CyTOF data from patient blood, likely due to their scarcity even in the bone marrow (only ~3 % of subset N1). Nevertheless, we found a statistically significant increase of CD71+ neutrophils (N1) in blood of melanoma patients compared to healthy donors (Fig. 7B). Furthermore, our analysis of differentially expressed protein markers from mass cytometry data between CD71+ vs CD71− neutrophils across 24 melanoma patients (Wilcox rank sum test), revealed that CD71 + neutrophils were distinct from CD71− neutrophils (Fig. 7C, Fig. S7C). Specifically, CD71+ neutrophils highly expressed immature and progenitor markers (CD38, CD49d, CD48) and poorly expressed markers of maturation (CD16,CD10,CD101). In addition, CD71+ neutrophils had higher expression of CD304, a VEGFR2 co-receptor that is associated with hypoxia-induced polarization of alternatively activated macrophages (Gelfand et al. 2014; Chen et al. 2019), suggesting a pro-tumoral function. We also observed that CD71+ neutrophils had higher expression of antigen-presenting proteins (HLA-DR, CD86 and CD64) compared to CD71− neutrophils in melanoma patients. Expression of HLA-DR, CD86, and CD64 was not detected in CD71+ or CD71− neutrophils from healthy human BM, suggesting a capacity to modulate T cell-mediated adaptive immunity may be acquired in melanoma. We also took advantage of published neutrophil scRNA-seq data from patients with non-small cell lung carcinoma (NSCLC) (Zilionis et al. 2019). Despite the potential dropout of scRNA-seq, we were able to identify a similar percentage of CD71+ neutrophils in the blood of NSCLC patients (Fig. 7D). Noticeably, we found even higher numbers of these CD71+ neutrophils in NSCLC tumors (10-fold change, Fig. 7D) which indicated a possible accumulation of proliferative neutrophils in the tumor microenvironment compared to that in the circulation. Moreover, CD71+ neutrophils in tumors lowly expressed maturation genes (FCGR3A, ITGAM, FCN1), while maintaining high expression of neutrophil markers S100A8/9 (Fig. 7E), confirming the CyTOF data from melanoma blood. Together, these results reveal an expansion of early bone marrow neutrophil progenitors in blood and tumors of cancer patients.
Figure 7. Expansion of CD71+ neutrophils in cancer patients (see also Fig. S7).

A) Representative contour plot of CyTOF analysis of 14 melanoma samples and 5 healthy controls to identify CD71 positive cells among CD66b+CD15+CD16−CD10−neutrophils in blood of healthy donors and melanoma patients suggested expansion of neutrophil progenitor subset N1 in blood of cancer patients. Gating also included exclusion of dead cells and cells expressing CD3, CD19, CD56 and CD14 (not shown).
B) Frequency of neutrophil progenitor subset N1 within all leukocytes or ratio of subset N-to-CD66b+neutrophils in blood of healthy donors and melanoma patients. Data analyzed according to results shown in panel A. n = 5 healthy donors, n = 14 melanoma patients. Welch’s t-test was performed and p-value shown.
C) Differentially expression test of protein marker expression between CD71− and CD71+ neutrophils (Wilcox rank sum test, Fig. S7C) revealed a number of important markers including progenitor markers CD38, CD48, CD49d, maturation markers CD16, CD10, CD35, CD101, antigen-presenting markers CD86, HLA-DR, CD64 and angiogenesis-associated marker CD304 (star indicating FDR-corrected p values < 0.01, 2-fold change difference in the expression median, Fig. S7C). Expression value was normalized from 0–1 for each marker.
D) CD71+ eNeP are found in the blood of NSCLC patients and in lung tumor samples (from our reanalysis of single cell RNA sequencing data sets (Zilionis et al. 2019)). Each dot is one cell, red dots representing positive CD71 expression.
E) Violin plot from scRNA-Seq of CD71+ neutrophils and other neutrophils (CD71−, data set also depicted in D).
DISCUSSION
By using mass cytometry and single-cell clustering, we identified 5 CD66b+Siglec8− neutrophil subsets in human bone marrow. We have updated the current paradigm of neutrophil bone marrow development while also revealing defining surface markers to specific stages in this process. The preNeu-like subset contained a rare CD71+CD117+ population, which we termed eNeP. eNeP were identified here as the earliest neutrophil progenitors in human bone marrow, as evidenced by their morphology, expression of neutrophil surface markers, colony-forming unit development, their ability to produce solely neutrophils in vivo, and gene expression signature.
CD71, a transferrin receptor facilitating cellular iron uptake, is commonly used to identify erythroid progenitor cells (Mori et al. 2015; Marsee, Pinkus, and Yu 2010) and is a useful diagnostic marker for certain leukemias and lymphomas (Feremans et al. 1991; Beguin et al. 1993; Wu, Borowitz, and Weir 2006). More recently, CD71 expression in non-hematopoietic cancers has been reported to be associated with aggressive tumor behavior and poor patient outcome (Leung et al. 2019; Chan et al. 2014; Habashy et al. 2010). Here, CD71+ neutrophil progenitors were expanded in blood from melanoma patients and found in both blood and tumor of lung cancer patients, in line with the concept of cancer-associated early egress of myeloid progenitor cells from bone marrow (Talmadge and Gabrilovich 2013).
One of the main objectives of this study was to resolve conflicts concerning bone marrow neutrophil progenitors. Clustering of CyTOF data revealed one subset, subset N1, which showed similar surface marker expression to a recently identified neutrophil precursor termed ‘preNeu’ (Evrard et al. 2018). PreNeu were originally defined as proliferating bone marrow neutrophils in mice. Their ability to differentiate into immature and mature neutrophils, their expression of transcription factors associated with neutrophil development, and their close proximity to CXCL12-producing reticular cells in the bone marrow, confirmed their status as murine neutrophil progenitors. In human bone marrow, Evrard and colleagues stratified CD15+CD66b+ neutrophils according to their ability to proliferate by measuring IdU incorporation. Surface markers detected on proliferating neutrophils were then used to create a gating strategy to identify preNeu. PreNeu represented around 5% of bone marrow neutrophils, similar to the frequency of our N1 (preNeu-like) subset. Nevertheless, stratifying bone marrow neutrophils according to proliferation excludes quiescent pool progenitor cells, which are a critical component of the hematopoietic progenitor compartment (X. Chen et al. 2017). Our eNeP progenitor population, on the other hand, contained both dividing and non-dividing fractions, demonstrating the existence of an actively proliferating and resting or less-proliferative pool. Furthermore, eNeP were more potent in producing granulocyte colonies in vitro compared with preNeu-like cells, collectively suggesting that eNeP preceded preNeu in neutrophil development. Upstream of eNeP are GMP, which are also CD34+ and CD38+ similar to CD34+ eNeP. However, GMP differ from eNeP by the absence of neutrophil lineage markers CD66b and CD15 (Olweus, Lund-Johansen, and Terstappen 1995; Scheinecker et al. 1995).
We previously identified a neutrophil progenitor subset termed hNeP. Like preNeu, hNeP were first discovered in mice and subsequently confirmed in human bone marrow. Human hNeP were CD66b+CD117+ and consisted of a CD34 positive and negative population, both of which produce only neutrophils in transfer experiments into NSG-SGM3 mice (Zhu et al. 2018). These findings, combined with an hNeP frequency less than 3% of neutrophils in human bone marrow, led us to conclude that hNeP are a pure progenitor population. CyTOF analysis of surface markers, however, revealed that hNeP are a heterogeneous population of neutrophils, owing to the expression of CD117 within each of our 5 bone marrow subsets. Flow cytometry confirmed CD117 co-expression on neutrophils that simultaneously expressed maturation markers such as CD11b, CD101 and CD16. However, the combination of CD117 with CD71 identified eNeP as pure neutrophil progenitors, which represent approximately 0.15 % of bone marrow neutrophils. Surface marker expression and morphology of eNeP are consistent with neutrophil progenitors and, importantly, they are endowed with the ability to form granulocyte colonies. Furthermore, re-analysis of CD34 positive and negative hNeP that produced only neutrophils in NSG-SGM3 mice confirmed the presence of CD71+ cells in CD34+ hNeP and CD34− hNeP and the progenitor potency of eNeP. Therefore, CD117 expression is not specific for progenitor populations, but in combination with CD66b and CD71, reliably identifies human neutrophil progenitors. The significance of CD117 in the expansion of human bone marrow progenitor populations has been known for decades (Brandt et al. 1992) Recently, depletion of CD117+ leukocytes in non-human primates or humanized NSG mice successfully eliminated hematopoietic stem cells and allowed for the engraftment of donor hematopoietic stem cells (Kwon et al. 2019).
Our RNA-seq-based profiling of eNeP and different neutrophil subsets supports that eNeP are developmentally early neutrophils, compared to other subsets. eNeP have the highest expression of neutrophil progenitor genes MPO, AZU1, PRTN3, CTSG, PRSS57, CEBPA and the lowest expression of FCGR3A (CD16), ITGAM (CD11b), S100A8/9. These genes were recently defined in neutrophil RNA-Seq data (Grassi et al. 2018). Although the transcriptome of eNeP was similar to the preNeu-like subset, we showed that eNeP had higher expression of early neutrophil genes and lower expression of genes specific to mature neutrophils compared to the preNeu-like subset. Transcriptomic data revealed gene set enrichment for cell adhesion and angiogenesis GO categories that are expressed in both eNeP and mature neutrophils, but not in N1 w/o eNeP. While these genes may help mature neutrophils traffic and function in the periphery, these gene sets may also provide insights into how neutrophil progenitors are retained within the bone marrow during homeostasis, as preNeu are located in close proximity to niche reticular cells and endothelial cells (Evrard et al. 2018). These findings show that the eNeP is likely an upstream progenitor of the PreNeu subset.
Single-cell transcriptome approaches have recently been used to identify 6 neutrophil subsets from peripheral blood and 5 neutrophil subsets in tumors from lung cancer patients (Zilionis et al. 2019). We observed the presence of the CD71+ neutrophil progenitor subset in blood and tumor samples. However most early neutrophil markers and transcription factors were not prominently expressed, likely due to the challenges of profiling neutrophil transcripts at single-cell resolution. Whether each of these subsets is endowed with specific functions and contributes to immunosuppression in cancer remains to be studied.
In summary, we provide a framework for neutrophil development in human bone marrow, beginning with eNeP as the earliest unipotent neutrophil progenitor. This framework will help for future studies of neutrophil heterogeneity in human diseases.
STAR ★ METHODS
RESOURCE AVAILABILITY
Lead Contact
Further information and requests for resources and reagents should be directed to and will be fulfilled by the lead contact, Catherine C. Hedrick (hedrick@lji.org).
Materials Available
This study did not generate new unique reagents.
Data and Code Available
The bulk RNA-Seq datasets generated in this study are available through Gene Expression Omnibus (Edgar et al. 2002) and are accessible through GEO series accession number GSE153263.
EXPERIMENTAL MODEL AND SUBJECT DETAILS
Mice
NSG-SGM3 mice were purchased from The Jackson Laboratory. Mice were housed in pathogen-free conditions in microisolator cages and fed standard rodent chow diet. Mice were euthanized by CO2 inhalation followed by cervical dislocation. All experiments were executed in accordance with La Jolla Institute for Immunology Animal Care and Use Committee guidelines. Approval for use of rodents was obtained from the La Jolla Institute for Immunology according to criteria outlined in the Guide for the Care and Use of Laboratory Animals from the National Institutes of Health. Male animals 7–8 weeks of age were used for experiments described in the NSG-SGM3 Adoptive Transfer section.
Human bone marrow cells
Fresh bone marrow samples from anonymous healthy adult donors were obtained from AllCells, Inc. (Alameda, CA). For information on donor characteristics, refer to Supplemental Table 1. Upon arrival, the fresh cells were immediately stained for mass cytometry, flow cytometry or cell sorting. Sorted cells were used for in vitro progenitor differentiation assay, Cytospin with subsequent staining and imaging, RNA isolation, and NSG-SGM3 adoptive transfer.
Human Peripheral Blood Collection
Blood from untreated melanoma patients (no prior melanoma-related treatment) was collected in EDTA-tubes by the Biospecimen Repository Core Facility (BRCF) at the University of Kansas Cancer Center, shipped overnight and processed for mass cytometry staining immediately upon arrival. EDTA-coated blood from healthy volunteers was obtained after written informed consent under the guidelines of the Institutional Review Board of the La Jolla Institute for Allergy and Immunology and in accordance with US Department of Health and Human Services Policy for the protection of Human Research Subjects (VD-057–0217). Both healthy donors and melanoma patient blood samples were processed at the same time and were stained for mass cytometry followed by the protocol described in the Mass Cytometry (CyTOF) section. For information on donor characteristics, refer to Supplemental Table 3.
METHOD DETAILS
Cell suspension for mass cytometry, flow cytometry and cell sorting
All samples (both bone marrow and peripheral blood) were collected in ice cold D-PBS (GIBCO) with 2 mM EDTA to prevent cation-dependent cell-cell adhesion. Cells were subsequently subjected to a red blood cell lysis (RBC lysis buffer, eBiosciences) at room temperature (5 min × 2 for BM cells, 10 min × 2 for blood cells), washed and filtered through a 70 um strainer to yield a single cell suspension.
Mass Cytometry Antibodies
Metal-conjugated antibodies were purchased directly from Fluidigm for available targets. For all other targets, purified antibodies were purchased from the companies as described before (Zhu et al. 2018). Antibody conjugations were prepared using the Maxpar Antibody Labeling Kit according to the recommended protocol provided by Fluidigm. Maxpar-conjugated antibodies were stored in PBS-based antibody stabilization solution (Candor Biosciences) supplemented with 0.05% NaN3 at 4°C. All antibodies were titrated before use.
Mass Cytometry (CyTOF)
CyTOF was performed following previously described protocols (Zhu et al. 2019). For viability staining, cells were washed in PBS and stained with Cisplatin (Fluidigm) to a final concentration of 5 μM. Prior to surface staining, RBC-lysed WB cells were resuspended in staining buffer to block the Fc receptors for 15 min at RT. The surface antibody cocktail, containing CyTOF antibodies listed in Key Resource Table, was added into the cell suspension for 1h at 4°C. The cells were then washed and fixed with 1.6% paraformaldehyde (Thermo Fisher) for 15 min at RT. Prepare 1 mL of intercalation solution for each sample by adding Cell-ID Intercalator-Ir (Fluidigm) into Maxpar Fix and Perm Buffer (Fluidigm) to a final concentration of 125 nM (a 1,000X dilution of the 125 μM stock solution) and vortex to mix. After fixation, resuspend the cells with the 1mL intercalation solution and incubate overnight at 4°C. Cells were then washed in staining buffer, with subsequent washes in Cell Acquisition Solution (CAS) (Fluidigm) to remove buffer salts. Cells were resuspended in CAS with a 1:10 dilution of EQ Four Element Calibration beads (Fluidigm) and filtered through a 35 μm nylon mesh filter cap (Corning, Falcon). Samples were analyzed on a Helios 2 CyTOF Mass Cytometer (Fluidigm) equipped with a Super Sampler (Victorian Airship & Scientific Apparatus) at an event rate of 500 events/second or less. Mass cytometry data files were normalized using the bead-based Normalizer (Finck et al, Cytometry A 83:48).
KEY RESOURCE TABLE
| REAGENT or RESOURCE | Source | Identifier |
|---|---|---|
| CyTOF Antibodies | ||
| Anti-human CD45 (Clone: HI30) – 89Y | Fluidigm | Cat#: 3089003B |
| Anti-human CD3 (Clone: UCHT1 – Purified | Biolegend | Cat#: 300443, RRID: AB_2562808 |
| Anti-human CD127 (Clone: A019D5) – Purified | Biolegend | Cat#: 351302, RRID: AB_10718513 |
| Anti-human CD41 (Clone: HIP8) – Purified | Biolegend | Cat# 303702, RRID: AB_314372 |
| Anti-human CD235a (Clone: HIR2) – Purified | Biolegend | Cat# 306602, RRID: AB_314620 |
| Anti-human CD11c (Clone: 3.9) – Purified | Biolegend | Cat#: 301602, RRID: AB_314172 |
| Anti-human CD11a (Clone: HI111) – 142Nd | Fluidigm | Cat#: 3142006B |
| Anti-human CD123 (Clone: 6H6) – 143Nd | Fluidigm | Cat#: 3143014B |
| Anti-human CD203c (Clone: NP4D6) – Purified | Biolegend | Cat# 324602, RRID: AB_756040 |
| Anti-human CD19 (Clone: HIB19) – Purified | Biolegend | Cat#: 302202, RRID: AB_314232 |
| Anti-human CD62L (Clone: DREG-56) – Purified | Biolegend | Cat#: 304802, RRID: AB_314462 |
| Anti-human CD64 (Clone: 10.1) – 146Nd | Fluidigm | Cat#: 3146006B |
| Anti-human CD182 (Clone: 5E8/CXCR2) – 147Sm | Fluidigm | Cat#: 3147010B |
| Anti-human/anti-mouse CD11b (Clone: M1/70) – Purified | Biolegend | Cat#: 101214 (Discontinued) |
| Anti-human CD48 (Clone: BJ40) – Purified | Biolegend | Cat#: 336702, RRID: AB_1227561 |
| Anti-human CD49d (Clone: 9F10) – Purified | Biolegend | Cat#: 304319, RRID: AB_2563755 |
| Anti-human CD66b (Clone: 80H3) – 152Sm | Fluidigm | Cat#: 3152011B |
| Anti-human CD14 (Clone: M5E2) – Purified | Biolegend | Cat#: 301802, RRID: AB_314184 |
| Anti-human CD117 (Clone: 104D2) – Purified | Biolegend | Cat#: 313202, RRID: AB_314981 |
| Anti-human CD45RA (Clone: HI100) – 155Gd | Fluidigm | Cat#: 3155011B |
| Anti-human CD10 (Clone: HI10a) – 156Gd | Fluidigm | Cat#: 3156001B |
| Anti-human CD101 (Clone: BB27) – 158Gd | Fluidigm | Cat#: 3158020B |
| Anti-human CD197 (Clone G043H7) – 159Tb | Fluidigm | Cat#: 3159003A |
| Anti-human CD79b (Clone: CB3-1) – Purified | BD | Cat#: 555678 |
| Anti-human Arginase I (Clone: 14D2C43) –Purified | Biolegend | Cat#: 369702, RRID: AB_2571898 |
| Anti-human CD71 (Clone: CY1G4) – Purified | Biolegend | Cat#: 334102, RRID: AB_1134247 |
| Anti-APC (Clone: APC003) – 163Dy | Fluidigm | Cat#: 3163001B |
| Anti-human CD86 (Clone: BU63) – APC | Biolegend | Cat#: 374208, RRID: AB_2721449 |
| Anti-human Siglec 8 (Clone: 7C9) – 164Dy | Fluidigm | Cat#: 3164017B |
| Anti-human CD16 (Clone: 3G8) – 165Ho | Fluidigm | Cat#; 3165001B |
| Anti-human CD34 (Clone: 581) – 166Er | Fluidigm | Cat#: 3166012B |
| Anti-human CD38 (Clone: HIT2) – 167Er | Fluidigm | Cat#: 3167001B |
| Anti-human CD304 (Clone: BDCA-4) – Purified | Biolegend | Cat#: 354502, RRID: AB_2564475 |
| Anti-human CD33 (Clone: WM53) – 169Tm | Fluidigm | Cat#: 3169010B |
| Anti-human CD35 (Clone: E11) – Purified | Biolegend | Cat#: 333402, RRID: AB_1089032 |
| Anti-human HLA-ABC (Clone: W6/32) – Purified | Biolegend | Cat#: 311402, RRID: AB_314871 |
| Anti-human CD15 (Clone: W6D3) – 172Yb | Fluidigm | Cat#: 3172021B |
| Anti-human HLA-DR (Clone: L243) – Purified | Biolegend | Cat#: 307602, RRID: AB_314680 |
| Anti-human CD184 (Clone: 12G5) – 175Lu | Fluidigm | Cat#: 3175001B |
| Anti-human CD56 (Clone: R19760) – 176Yb | Fluidigm | Cat#: 3176013B |
| Flow Cytometry Antibodies | ||
| Anti-human CD34 (Clone: 561) – Brilliant Violet 421 | Biolegend | Cat#: 343610,RRID: AB_2561358 |
| Anti-mouse CD45 (Clone: 30-F11) – Brilliant Violet 421 | Biolegend | Cat#: 103134, RRID: AB_2562559 |
| Anti-human CD10 (Clone: HI10a) – Brilliant Violet 510 | Biolegend | Cat#: 312220, RRID: AB_2563835 |
| Anti-human CD45 (Clone: HI30) – Brilliant Violet 570 | Biolegend | Cat#: 304034, RRID: AB_2563426 |
| Anti-human CD35 (Clone: E11 ) – Brilliant Violet 605 | BD | Cat#: 744276 |
| Anti-human CD71 (Clone: CY1G4) – Brilliant Violet 650 | Biolegend | Cat#: 334116, RRID: AB_2687103 |
| Anti-human CD49d (Clone: 9F10) – Brilliant Violet 711 | Biolegend | Cat#: 304332, RRID: AB_2687198 |
| Anti-mouse/anti-human CD11b (Clone: M1/70) – Brilliant Violet 785 | Biolegend | Cat#: 101243, RRID: AB_2561373 |
| Anti-human CD117 (Clone: 104D2) – Brilliant Violet 785 | Biolegend | Cat#: 313238, RRID: AB_2629837 |
| Anti-human CD7 (Clone: M-T701) – BB515 | BD | Cat#: 565211 |
| Anti-human CD127 (Clone: A019D5) – FITC | Biolegend | Cat#: 351312, RRID: AB_10933247 |
| Anti-human CD90 (Clone: 5E10) – FITC | Biolegend | Cat# 328108, RRID: AB_893438 |
| Anti-human CD3 (Clone: HIT3a) – FITC | Biolegend | Cat#: 300306, RRID: AB_314042 |
| Anti-human CD19 (Clone: HIB19) – FITC | Biolegend | Cat#: 302206, RRID: AB_314236 |
| Anti-human CD56 (Clone: B159) – BB515 | Biolegend | Cat#: 564488 |
| Anti-human CD161 (Clone: HP-3G10) – Alexa Fluor 488 | Biolegend | Cat#: 339924, RRID: AB_2563939 |
| Anti-human CD41 (Clone: HIP8) – FITC | Biolegend | Cat#: 303704, RRID: AB_314374 |
| Anti-human CD235a (Clone: HI264) – FITC | Biolegend | Cat#: 349104, RRID: AB_10613463 |
| Anti-human CD123 (Clone: 6H6) – FITC | Biolegend | Cat#: 306014, RRID: AB_2124259 |
| Anti-human CD11c (Clone: Bu15) – FITC | Biolegend | Cat#: 337214, RRID: AB_2129792 |
| Anti-human Siglec-1 (Clone: 7-239) – BB515 | BD | Cat#: 565353 |
| Anti-human Siglec-8 (Clone: 7C9) – FITC | Miltenyi Biotec | Cat#: 130–098-716 |
| Anti-human FceRIa (Clone: AER-37) – FITC | Biolegend | Cat#: 334608, RRID: AB_1227653 |
| Anti-human CD86 (Clone: 2331 (FUN-1)) – BB515 | BD | Cat#: 564544 |
| Anti-human CD14 (Clone: M5E2) – FITC | Biolegend | Cat#: 301804, RRID: AB_314186 |
| Anti-human CD125 (Clone: 26815) – Alexa Fluor 488 | R&D Systems | Cat#: FAB253G-100UG |
| Anti-human CD66b (Clone: G10F5) – PE | Biolegend | Cat#: 305106, RRID: AB_2077857 |
| Anti-human CD38 (Clone; HB-7) – PE/Dazzle 594 | Biolegend | Cat#: 356630, RRID: AB_2650757 |
| Anti-human CD203c (Clone: NP4D6) – PE/Dazzle 594 | Biolegend | Cat#: 324624, RRID: AB_2566235 |
| Anti-human Siglec-8 (Clone: 7C9) – PE/Dazzle 594 | Biolegend | Cat#: 347110, RRID: AB_2629718 |
| Anti-human CD16 (Clone: 3G8) – PerCP | Biolegend | Cat#: 302030, RRID: AB_940380 |
| Anti-human CD3 (Clone: OKT3) – PerCP-Cy5.5 | Tonbo Bioscience | Cat#: 65-0037-T100 |
| Anti-human CD56 (Clone: MEM-188) – PerCP-Cy5.5 | Biolegend | Cat#: 304626, RRID: AB_10641700 |
| Anti-human CD101 (Clone: BB27) – PE-Cy7 | Biolegend | Cat#: 331014, RRID: AB_2716109 |
| Anti-human CD19 (Clone: HIB19) – PE-Cy7 | Biolegend | Cat#: 302216, RRID: AB_314246 |
| Anti-human CD15 (Clone: HI98) – APC | Biolegend | Cat#: 301908, RRID: AB_314200 |
| Anti-mouse CD45 (Clone: 30-F11) – APC-Cy7 | Biolegend | Cat#: 103116, RRID: AB_312981 |
| Anti-human CD117 (Clone: YB5.B8) – APC-R700 | BD | Cat#: 565195 |
| Anti-human CD45 (Clone: HI30) – Alexa Fluor 700 | Biolegend | Cat#: 304024, RRID: AB_493761 |
| Biological Samples | ||
| Healthy human bone marrow | AllCells, Inc. | BM, FR, 3mL |
| Healthy human peripheral blood | La Jolla Institute for Allergy and Immunology, Clinical studies core, Normal Blood Donor Program (NBDP) | https://www.lji.org/faculty-research/scientific-cores/clinical-studies |
| Melanoma patient peripheral blood | University of Kansas Cancer Center, Biospecimen Repository Core Facility (BRCF) | http://www.kumc.edu/school-of-medicine/biospecimen.html |
| Chemicals, Peptides, and Recombinant Proteins | ||
| MAXPAR® Antibody Labeling Kits | Fluidigm | http://www.dvssciences.com/product-catalog-maxpar.php |
| Cisplatin-194Pt | Fluidigm | Cat# 201194 |
| Intercalator-Ir | Fluidigm | Cat# 201192B |
| Hyclone Phosphate Buffered Saline | Fisher Scientific | Cat#: SH30256FS |
| Ethylenediaminetetraacetic acid (EDTA) | ThermoFisher | Cat# AM9260G |
| RBC Lysis Buffer, 10x | Biolegend | Cat#: 420302 |
| Antibody Stabilizer | CANDOR Bioscience |
Cat# 130050 |
| Sodium azide | Sigma-Aldrich | Cat# S2002 |
| Paraformaldehyde | Sigma-Aldrich | Cat# 15S121 |
| Bovine Serum Albumin Solution | Millipore Sigma | Cat#: A9516 |
| Maxpar Fix and Perm Buffer | Fluidigm | Cat#: 201061 |
| Maxpar Cell Acquisition Solution | Fluidigm | Cat#: 201240 |
| EQ Four Element Calibration Beads | Fluidigm | Cat# 201018 |
| Human AB Serum, Heat Inactivated | Omega Scientific | Cat# HS-25 |
| Flavopiridol hydrocholoride hydrate | Milipore Sigma | Cat# F3055-25MG |
| Recombinant ribonuclease inhibitor | Takara | Cat#: 2313B |
| Fetal Bovine Serum | Omega Scientific | Cat# FB-02 |
| TRIzol LS Reagent | Thermo Fisher | Cat#: 10296028 |
| Methocult SF H4436 | StemCell | Cat#: 04436 |
| Critical Commercial Assays | ||
| Zombie NIR Fixable Viability Kit | Biolegend | Cat#: 423105 |
| LIVE/DEAD Fixable Blue Dead Cell Stain Kit, for UV excitation | Thermo Fisher | Cat#: L23105 |
| Cell ID IdU | Fluidigm | Cat#: 201121 |
| APC BrdU Flow Kit | BD | Cat#: 552598 |
| EasySep Mouse CD11b Positive Selection Kit II | StemCell | Cat#: 18910 |
| Hema 3 Manual Staining System | Fisher Scientific | Cat#: 23-123869 |
| Direct-zol RNA Kit | Zymo Research | Cat#: R2051 |
| Deposited data | ||
| Sorted human bone marrow RNA-Seq | This study | GSE153263 |
| Lung cancer scRNA-Seq | Zilionis et al, 2019 | GSE127465 |
| Experimental models | ||
| Mouse: NOD.Cg-Prkdcscid Il2rgtm1WlTg(CMV-IL3,CSF2,KITLG)1 Eav/MloySzJ | The Jackson Laboratory | Stock No: 013062 |
| Software and Algorithms | ||
| Bead-based Normalizer | Finck et al., 2013 | https://med.virginia.edu/flow-cytometry-facility/wp-content/uploads/sites/170/2015/10/3_Finck-Rachel_CUGM_May2013.pdf |
| RSubread R package v1.30.5 | Liao et al., 2013 | http://bioconductor.org/packages/release/bioc/html/Rsubread.html |
| edgeR v3.22.3 | Robinson et al., 2010 | https://bioconductor.org/packages/release/bioc/html/edgeR.html |
| FeatureCount R package v1.22.2 | Liao et al., 2013 | https://rdrr.io/bioc/Rsubread/man/featureCounts.html |
| Pheatmap | CRAN | https://cran.r-project.org/web/packages/pheatmap/index.html |
| Umap | CRAN | https://cran.r-project.org/web/packages/umap/index.html |
| Limma | Law et al., 2014 | https://www.bioconductor.org/packages/release/bioc/html/limma.html |
| Cytofkit | Chen et al., 2016 | https://bioconductor.riken.jp/packages/3.7/bioc/html/cytofkit.html |
| topGO | Alexa et al., 2006 | https://bioconductor.org/packages/release/bioc/html/topGO.html |
| ConsensusClusterPlus | Wikerson et al., 2010 | https://bioconductor.org/packages/release/bioc/html/ConsensusClusterPlus.html |
Computational analysis of mass cytometry
CyTOF data was analyzed using R and Bioconductor packages. Protein expression was normalized using arcsinh transformation (cofactor=5). We used Phenograph clustering (Levine et al. 2015) implemented in cytofkit package (H. Chen et al. 2016) to identify neutrophils (CD66b+Siglec8−) and other leukocyte cell-types in bone marrow. Then we selected neutrophils out for further Phenograph clustering. Consensus clustering was used to justify the number of clusters from k=2 to k=15 and we identify k=5 as the most optimal number of clusters based on relatively decrease in area under the CDF (Cumulative Distribution Function) curve (Wilkerson and Hayes 2010). Phenograph clusters were merged into 5 major clusters based on consensus clustering. Diffusion map was done using cytofkit package (H. Chen et al. 2016). UMAP deduction was done using umap R package (v0.2.3.1), a wrapper for Python package ‘umap-learn’. Heatmap was produced using pheatmap R package (v0.2).
Flow Cytometry and Cell Sorting
Staining for flow cytometry and cell sorting was performed in FACS buffer (D-PBS + 1% human serum + 0.1% sodium azide + 2 mM EDTA) on ice. Staining for cell sorting and subsequent RNA isolation was performed in FACS buffer, supplemented with Flavopiridol (100 nM; Sigma-Aldrich) and recombinant RNAse inhibitor (40 U/ml; Takara Bio USA, Inc.). Cells were stained with 100 ul of titrated antibody master mix including viability dye per 5 million cells, followed by a 30-minute incubation on ice in the dark. Sorted cells were collected in receiving buffer (D-PBS + 10% FBS). For RNA isolation, cells were sorted into TRIzol™LS Reagent (ThermoFisher Scientific), mixed well and immediately frozen at −80 °C until RNA isolation.
Flow cytometric analysis was carried out using a LSR-II (BD biosciences) or LSR Fortessa (BD bioscience) and cell sorting was performed on a FACS Aria-II (BD Biosciences). Both flow cytometric analyses and cell sorting were performed on live cells after exclusion of doublets as shown in Supplemental Figure 4B. Furthermore, cells expressing the following lineage markers were also excluded: CD7, CD127, CD90, CD3, CD19, CD56, CD161, CD41, CD235a, CD123, CD125, CD11c, CD169, Siglec8, FceRIa, CD86.
Following sorting, purity of sorted fractions was checked visually and by FACS reanalysis of the surface markers. Data were analyzed using FlowJo software (version 10.5.3, BD).
NSG-SGM3 Mouse Adoptive Transfer
NSG-SGM3 recipient mice were kept under sterile conditions prior to and after adoptive transfer. Recipient mice were sub-lethally irradiated (240 rads). CD11b depletions was performed on fresh human bone marrow using CD11b Positive Selection Kit II (StemCell). eNeP and N1-eNeP were sorted from fresh human bone marrow using FACS as described above and collected into receiving buffer (D-PBS + 10% FBS). Sorted eNeP or N1-eNeP (32,000–154,000 progenitor cells isolated from 10 ml human bone marrow) were injected in 100ul D-PBS retro-orbitally. In each experiment, mice received equal numbers of either eNeP or N1-eNeP. We attempted 6 experiments. Two FACS sort of human bone marrow resulted in too few cells to inject. Of the other 4 experiments, each with adoptive transfer of either 32,000 eNeP and N1-eNeP, 50,000 eNeP and N1-eNeP, 48,000 eNeP and N1-eNeP, or 154,000 eNeP and N1-eNeP into recipient mice, three of the experiments engrafted. After 5 days, blood and bone marrow were analyzed by flow cytometry as described above.
Proliferation analysis measuring BrdU incorporation
To assess cellular proliferation, we performed a BrdU assay using the APC BrdU Flow Kit (BD Bioscience) according to manufacturer’s instructions. Briefly, fresh bone marrow cells were incubated with culture medium containing BrdU (50 uM) and incubated for 1 h at 37 °C at 5% CO2. Following surface marker staining, the cells were fixed and permeabilized, treated with DNAse for 1 h at 37 °C to expose incorporated BrdU and stained with anti-BrdU antibody. The stained cells were then analyzed using flow cytometry. BrdU positivity indicated proliferation.
In vitro progenitor differentiation assay
Sorted progenitor cells were seeded into 6-well plates and cultured for 14 days in complete Methocult™SF H4436 media (Stem Cell Technologies) according to the manufacturer’s protocol. The cytokine cocktail of this methylcellulose assay consists of rhSCF, rhGM-CSF, rhlL-3, rhIL-6, rhG-CSF, rhEPO and serum substitute. Following incubation, microscopic images with 50x and 100x magnification were taken of all established colonies. Colonies were counted and identified by side-by-side comparison with representative images from 3 independent plates provided in the manufacturer’s technical manual.
Cytospin
Sorted bone marrow cells were cytocentrifuged onto microscope slides using a Cytospin 4 centrifuge (Thermo Shandon), stained with Hema 3™ Manual Staining System (Fisher Scientific) and analyzed by light microscopy.
RNA isolation and RNA sequencing
Sorted bone marrow cells in TRIzol™LS Reagent were thawed on ice. RNA isolation was performed using the Direct-zol™RNA MiniPrep (Zymo Research) according to manufacturer’s instructions. RNA concentration was measured on a Agilent 2200 TapeStation using the Agilent High Sensitivity RNA ScreenTape System (Agilent Technologies). Cells will be sorted directly in TriZOL LS and processed immediately into RNA using DirectZOL RNA Miniprep (Zymo Research). Library preparation and sequencing will be performed according to the Smart-Seq2 protocol in the La Jolla Institute for Immunology sequencing core.
RNA-Seq analysis
The RNA-Seq short reads were mapped to the human genome (hg38) using subread-align from the Subread R package (Liao, Smyth, and Shi 2013). Uniquely mapped reads were annotated with NCBI RefSeq annotation using featureCounts R package (v1.5.3) (Liao, Smyth, and Shi 2013, 2014) were used for downstream differentially analysis. Multidimensional scaling (MDS) analysis and differential expression testing was performed using linear model analysis (function voom from limma R package; v3.33.7) (Law et al. 2014) with scaling normalization factors estimated using edgeR package (Robinson, McCarthy, and Smyth 2010). Gene Ontology enrichment was done using Fisher exact test implemented in topGO Bioconductor package (Alexa, Rahnenfuhrer, and Lengauer 2006). Multi-test correction using Benjamini and Hochberg method (Benjamini and Hochberg 1995) implemented in p.adjust function in R.
QUANTIFICATION AND STATISTICAL ANALYSIS
Data for all experiments were analyzed with Prism software (GraphPad). Paired and unpaired t-tests and one-way or two-way ANOVA analysis were used for comparison of experimental groups as indicated in figure legends. P values of less than 0.05 were considered significant. All data replicates can be found indicated by individual points in the figures or listed in the figure legends. Mean value is indicated as center on graphs with corresponding standard error, unless otherwise noted. More information about statistical tests and results for each experiment can be found in the figure legends.
Supplementary Material
Supplemental Table 2. Statistically significant Gene Ontology terms for each of gene cluster of the pair-wise differentially expressed genes (Related to Fig. 6)
Highlights and eTOC Blurb.
Human neutrophils are produced by bone marrow progenitors which were recently identified, but their developmental lineage remains unclear. Dinh et al. discover an early neutrophil progenitor population (termed ‘eNeP’) marked by CD117+CD71 + in human bone marrow, and provides evidence for neutrophil progenitor expansion in human cancers.
Mass cytometry reveals a very early unipotent human bone marrow neutrophil progenitor.
The eNeP discovery provides a complete, unified model of human neutrophil development.
eNeP are defined by the distinct surface protein markers CD71 and CD117.
CD71+ neutrophils are expanded in blood and tumor of cancer patients.
Acknowledgments
We thank Daniel Araujo for editing and helpful discussions. Sequencing data was generated from a grant supported by the Tullie and Rickey Families’ SPARK Awards program at La Jolla Institute for Immunology to H.Q.D. M.A.M acknowledges support from the National Institute of Health (2T32AR064194). This work was supported by NIH grants U01 CA224766, R01 CA202987, R01 HL134236, P01 HL136275 (all to C.C.H.). We would like to thank the LJI Flow Cytometry Core Facility for assistance with cell sorting. The FACSAria-3 cell sorter and the Fluidigm CyTOF Helios were acquired through the NIH Shared Instrumentation Grant (SIG) Program S10 (FACSAria II Cell Sorter S10 RR027366 and CyTOF Mass Cytometer S10 OD018499 to LJI).
Footnotes
Declaration of Interests
The authors declare no competing interests.
Publisher's Disclaimer: This is a PDF file of an unedited manuscript that has been accepted for publication. As a service to our customers we are providing this early version of the manuscript. The manuscript will undergo copyediting, typesetting, and review of the resulting proof before it is published in its final form. Please note that during the production process errors may be discovered which could affect the content, and all legal disclaimers that apply to the journal pertain.
References
- Aisen Philip. 2004. “Transferrin Receptor 1.” The International Journal of Biochemistry & Cell Biology 36 (11): 2137–43. [DOI] [PubMed] [Google Scholar]
- Alexa Adrian, Jörg Rahnenführer, and Lengauer Thomas. 2006. “Improved Scoring of Functional Groups from Gene Expression Data by Decorrelating GO Graph Structure.” Bioinformatics 22 (13): 1600–1607. [DOI] [PubMed] [Google Scholar]
- Bainton DF, Ullyot JL, and Farquhar MG. 1971. “The Development of Neutrophilic Polymorphonuclear Leukocytes in Human Bone Marrow.” The Journal of Experimental Medicine 134 (4): 907–34. [DOI] [PMC free article] [PubMed] [Google Scholar]
- Becht Etienne, Leland McInnes John Healy, Dutertre Charles-Antoine, Kwok Immanuel W. H., Lai Guan Ng Florent Ginhoux, and Newell Evan W.. 2018. “Dimensionality Reduction for Visualizing Single-Cell Data Using UMAP.” Nature Biotechnology, December. 10.1038/nbt.4314. [DOI] [PubMed] [Google Scholar]
- Beguin Y, Lampertz S, De Groote D, Igot D, Malaise M, and Fillet G. 1993. “Soluble CD23 and Other Receptors (CD4, CD8, CD25, CD71) in Serum of Patients with Chronic Lymphocytic Leukemia.” Leukemia 7 (12): 2019–25. [PubMed] [Google Scholar]
- Benjamini Yoav, and Hochberg Yosef. 1995. “Controlling the False Discovery Rate: A Practical and Powerful Approach to Multiple Testing.” Journal of the Royal Statistical Society: Series B (Methodological). 10.1111/j.2517-6161.1995.tb02031.x. [DOI] [Google Scholar]
- Brandt J, Briddell RA, Srour EF, Leemhuis TB, and Hoffman R. 1992. “Role of c-Kit Ligand in the Expansion of Human Hematopoietic Progenitor Cells.” Blood 79 (3): 634–41. [PubMed] [Google Scholar]
- Chan Kin Tak, Mei Yuk Choi Kenneth K. Y. Lai, Tan Winnie, Lai Nar Tung Ho Yu Lam, Tong Daniel K. H., Lee Nikki P., and Law Simon. 2014. “Overexpression of Transferrin Receptor CD71 and Its Tumorigenic Properties in Esophageal Squamous Cell Carcinoma.” Oncology Reports 31 (3): 1296–1304. [DOI] [PubMed] [Google Scholar]
- Chen Hao, Mai Chan Lau Michael Thomas Wong, Newell Evan W., Poidinger Michael, and Chen Jinmiao. 2016. “Cytofkit: A Bioconductor Package for an Integrated Mass Cytometry Data Analysis Pipeline.” PLoS Computational Biology 12 (9): e1005112. [DOI] [PMC free article] [PubMed] [Google Scholar]
- Chen Xiaowei, Deng Huan, Churchill Michael J., Luchsinger Larry L., Du Xing, Chu Timothy H., Friedman Richard A., et al. 2017. “Bone Marrow Myeloid Cells Regulate Myeloid-Biased Hematopoietic Stem Cells via a Histamine-Dependent Feedback Loop.” Cell Stem Cell. 10.1016/j.stem.2017.11.003. [DOI] [PMC free article] [PubMed] [Google Scholar]
- Clark Stephen R., Ma Adrienne C., Tavener Samantha A., Braedon McDonald Zahra Goodarzi, Kelly Margaret M., Patel Kamala D., et al. 2007. “Platelet TLR4 Activates Neutrophil Extracellular Traps to Ensnare Bacteria in Septic Blood.” Nature Medicine 13 (4): 463–69. [DOI] [PubMed] [Google Scholar]
- Coifman RR, Lafon S, Lee AB, Maggioni M, Nadler B, Warner F, and Zucker SW. 2005. “Geometric Diffusions as a Tool for Harmonic Analysis and Structure Definition of Data: Diffusion Maps.” Proceedings of the National Academy of Sciences of the United States of America 102 (21): 7426–31. [DOI] [PMC free article] [PubMed] [Google Scholar]
- Cowland Jack B., and Borregaard Niels. 2016. “Granulopoiesis and Granules of Human Neutrophils.” Immunological Reviews 273 (1): 11–28. [DOI] [PubMed] [Google Scholar]
- Drissen Roy, Natalija Buza-Vidas Petter Woll, Thongjuea Supat, Gambardella Adriana, Giustacchini Alice, Mancini Elena, et al. 2016. “Distinct Myeloid Progenitor-Differentiation Pathways Identified through Single-Cell RNA Sequencing.” Nature Immunology 17 (6): 666–76. [DOI] [PMC free article] [PubMed] [Google Scholar]
- Drissen Roy, Thongjuea Supat, Kim Theilgaard-Mönch, and Nerlov Claus. 2019. “Identification of Two Distinct Pathways of Human Myelopoiesis.” Science Immunology 4 (35). 10.1126/sciimmunol.aau7148. [DOI] [PubMed] [Google Scholar]
- Evrard Maximilien, Kwok Immanuel W. H., Shu Zhen Chong Karen W. W. Teng, Becht Etienne, Chen Jinmiao, Sieow Je Lin, et al. 2018. “Developmental Analysis of Bone Marrow Neutrophils Reveals Populations Specialized in Expansion, Trafficking, and Effector Functions.” Immunity 48 (2): 364–79.e8. [DOI] [PubMed] [Google Scholar]
- Feremans W, Bujan W, Neve P, Delville JP, and Schandene L. 1991. “CD71 Phenotype and the Value of Gallium Imaging in Lymphomas.” American Journal of Hematology 36 (3): 215–16. [DOI] [PubMed] [Google Scholar]
- Gentles Andrew J., Newman Aaron M., Chih Long Liu Scott V. Bratman, Feng Weiguo, Kim Dongkyoon, Nair Viswam S., et al. 2015. “The Prognostic Landscape of Genes and Infiltrating Immune Cells across Human Cancers.” Nature Medicine 21 (8): 938–45. [DOI] [PMC free article] [PubMed] [Google Scholar]
- Grassi Luigi, Pourfarzad Farzin, Ullrich Sebastian, Merkel Angelika, Were Felipe, Enrique Carrillo-de-Santa-Pau Guoqiang Yi, et al. 2018. “Dynamics of Transcription Regulation in Human Bone Marrow Myeloid Differentiation to Mature Blood Neutrophils.” Cell Reports 24 (10): 2784–94. [DOI] [PMC free article] [PubMed] [Google Scholar]
- Habashy Hany Onsy, Powe Desmond G., Staka Cindy M., Rakha Emad A., Ball Graham,Green Andrew R., Aleskandarany Mohammed, et al. 2010. “Transferrin Receptor (CD71) Is a Marker of Poor Prognosis in Breast Cancer and Can Predict Response to Tamoxifen.” Breast Cancer Research and Treatment 119 (2): 283–93. [DOI] [PubMed] [Google Scholar]
- Hidalgo Andrés, Chilvers Edwin R., Summers Charlotte, and Koenderman Leo. 2019. “The Neutrophil Life Cycle.” Trends in Immunology 40 (7): 584–97. [DOI] [PubMed] [Google Scholar]
- Kwon Hye-Sook, Logan Aaron C., Chhabra Akanksha, Pang Wendy W., Agnieszka Czechowicz, Tate Keri, Le Alan, et al. 2019. “Anti-Human CD117 Antibody-Mediated Bone Marrow Niche Clearance in Nonhuman Primates and Humanized NSG Mice.” Blood 133 (19): 2104–8. [DOI] [PMC free article] [PubMed] [Google Scholar]
- Lahoz-Beneytez Julio, Elemans Marjet, Zhang Yan, Ahmed Raya, Salam Arafa, Block Michael, Niederalt Christoph, Asquith Becca, and Macallan Derek. 2016. “Human Neutrophil Kinetics: Modeling of Stable Isotope Labeling Data Supports Short Blood Neutrophil Half-Lives.” Blood. 10.1182/blood-2016-03-700336. [DOI] [PMC free article] [PubMed] [Google Scholar]
- Law Charity W., Chen Yunshun, Shi Wei, and Smyth Gordon K.. 2014. “Voom: Precision Weights Unlock Linear Model Analysis Tools for RNA-Seq Read Counts.” Genome Biology 15 (2): R29. [DOI] [PMC free article] [PubMed] [Google Scholar]
- Leung Thomas Ho-Yin, Hermit Wai-Man Tang, Michelle Kwan-Yee Siu, David Wai Chan, Kar-Loen Chan Karen, Nga-Yin Cheung Annie, and Yuen-Sheung Ngan Hextan. 2019. “CD71 Population Enriched by HPV-E6 Protein Promotes Cancer Aggressiveness and Radioresistance in Cervical Cancer Cells.”Molecular Cancer Research: MCR 17 (9): 1867–80. [DOI] [PubMed] [Google Scholar]
- Levine Jacob H., Simonds Erin F., Bendall Sean C., Davis Kara L., Amir El-Ad D., Tadmor Michelle D., Litvin Oren, et al. 2015. “Data-Driven Phenotypic Dissection of AML Reveals Progenitor-like Cells That Correlate with Prognosis.” Cell 162 (1): 184–97. [DOI] [PMC free article] [PubMed] [Google Scholar]
- Ley Klaus, Hoffman Hal M., Kubes Paul, Cassatella Marco A., Zychlinsky Arturo, Hedrick Catherine C., and Catz Sergio D.. 2018. “Neutrophils: New Insights and Open Questions.” Science Immunology 3 (30). 10.1126/sciimmunol.aat4579. [DOI] [PubMed] [Google Scholar]
- Liao Yang, Smyth Gordon K., and Shi Wei. 2013. “The Subread Aligner: Fast, Accurate and Scalable Read Mapping by Seed-and-Vote.” Nucleic Acids Research 41 (10): e108. [DOI] [PMC free article] [PubMed] [Google Scholar]
- Liao. 2014. “featureCounts: An Efficient General Purpose Program for Assigning Sequence Reads to Genomic Features.” Bioinformatics 30 (7): 923–30. [DOI] [PubMed] [Google Scholar]
- Marsee Derek K., Pinkus Geraldine S., and Yu Hongbo. 2010. “CD71 (transferrin Receptor): An Effective Marker for Erythroid Precursors in Bone Marrow Biopsy Specimens.” American Journal of Clinical Pathology 134 (3): 429–35. [DOI] [PubMed] [Google Scholar]
- Mori Yasuo, Chen James Y., Pluvinage John V., Seita Jun, and Weissman Irving L.. 2015. “Prospective Isolation of Human Erythroid Lineage-Committed Progenitors.” Proceedings of the National Academy of Sciences of the United States of America 112 (31): 9638–43. [DOI] [PMC free article] [PubMed] [Google Scholar]
- Mori Yasuo, Iwasaki Hiromi, Kohno Kentaro, Yoshimoto Goichi, Kikushige Yoshikane, Okeda Aki, Uike Naokuni, et al. 2009. “Identification of the Human Eosinophil Lineage-Committed Progenitor: Revision of Phenotypic Definition of the Human Common Myeloid Progenitor.” The Journal of Experimental Medicine 206 (1): 183–93. [DOI] [PMC free article] [PubMed] [Google Scholar]
- Motamedi Melika, Xu Lai, and Elahi Shokrollah. 2016. “Correlation of Transferrin Receptor (CD71) with Ki67 Expression on Stimulated Human and Mouse T Cells: The Kinetics of Expression of T Cell Activation Markers.” Journal of Immunological Methods 437 (October): 43–52. [DOI] [PubMed] [Google Scholar]
- Ng Lai Guan, Ostuni Renato, and Hidalgo Andrés. 2019. “Heterogeneity of Neutrophils.” Nature Reviews Immunology. 10.1038/s41577-019-0141-8. [DOI] [PubMed] [Google Scholar]
- Notta Faiyaz, Zandi Sasan, Takayama Naoya, Dobson Stephanie, Gan Olga I., Wilson Gavin, Kaufmann Kerstin B., et al. 2016. “Distinct Routes of Lineage Development Reshape the Human Blood Hierarchy across Ontogeny.” Science 351 (6269): aab2116. [DOI] [PMC free article] [PubMed] [Google Scholar]
- Olweus J, Lund-Johansen F, and Terstappen LW. 1995. “CD64/Fc Gamma RI Is a Granulo-Monocytic Lineage Marker on CD34+ Hematopoietic Progenitor Cells.” Blood 85 (9): 2402–13. [PubMed] [Google Scholar]
- Pliyev Boris K., Shmidt Evgeniya I., Ivanova Anna V., and Menshikov Mikhail. 2012. “Circulating CD35(−)/CD49d(+) Neutrophils in Influenza Virus Infection Patients.” Human Immunology 73 (11): 1087–90. [DOI] [PubMed] [Google Scholar]
- Robinson Mark D., McCarthy Davis J., and Smyth Gordon K.. 2010. “edgeR: A Bioconductor Package for Differential Expression Analysis of Digital Gene Expression Data.” Bioinformatics 26 (1): 139–40. [DOI] [PMC free article] [PubMed] [Google Scholar]
- Scheinecker C, Strobl H, Fritsch G, Csmarits B, Krieger O, Majdic O, and Knapp W. 1995. “Granulomonocyte-Associated Lysosomal Protein Expression during in Vitro Expansion and Differentiation of CD34+ Hematopoietic Progenitor Cells.” Blood 86 (11): 4115–23. [PubMed] [Google Scholar]
- Sidney Laura E., Branch Matthew J., Dunphy Siobhán E., Dua Harminder S., and Hopkinson Andrew. 2014. “Concise Review: Evidence for cD34 as a Common Marker for Diverse Progenitors.” STEM CELLS. 10.1002/stem.1661. [DOI] [PMC free article] [PubMed] [Google Scholar]
- Sierro Frederic, Evrard Maximilien, Rizzetto Simone, Melino Michelle, Mitchell Andrew J., Florido Manuela, Beattie Lynette, et al. 2017. “A Liver Capsular Network of Monocyte-Derived Macrophages Restricts Hepatic Dissemination of Intraperitoneal Bacteria by Neutrophil Recruitment.” Immunity. 10.1016/j.immuni.2017.07.018. [DOI] [PubMed] [Google Scholar]
- Summers Charlotte, Rankin Sara M., Condliffe Alison M., Singh Nanak, Michael Peters A, and Chilvers Edwin R. 2010. “Neutrophil Kinetics in Health and Disease.” Trends in Immunology. 10.1016/j.it.2010.05.006. [DOI] [PMC free article] [PubMed] [Google Scholar]
- Talmadge James E., and Gabrilovich Dmitry I.. 2013. “History of Myeloid-Derived Suppressor Cells.” Nature Reviews. Cancer 13 (10): 739–52. [DOI] [PMC free article] [PubMed] [Google Scholar]
- Wilkerson Matthew D., and Hayes D. Neil. 2010. “ConsensusClusterPlus: A Class Discovery Tool with Confidence Assessments and Item Tracking.” Bioinformatics 26 (12): 1572–73. [DOI] [PMC free article] [PubMed] [Google Scholar]
- Wu Julie M., Borowitz Michael J., and Weir Edward G.. 2006. “The Usefulness of Cd71 Expression by Flow Cytometry for Differentiating Indolent from Aggressive CD10+ B-Cell Lymphomas.” American Journal of Clinical Pathology 126 (1): 39–46. [DOI] [PubMed] [Google Scholar]
- Yáñez Alberto, Coetzee Simon G., Olsson Andre, Muench David E., Berman Benjamin P., Hazelett Dennis J., Salomonis Nathan, Grimes H. Leighton, and Goodridge Helen S. 2017. “Granulocyte-Monocyte Progenitors and Monocyte-Dendritic Cell Progenitors Independently Produce Functionally Distinct Monocytes.” Immunity. 10.1016/j.immuni.2017.10.021. [DOI] [PMC free article] [PubMed] [Google Scholar]
- Zhu Yanfang Peipei, Padgett Lindsey, Dinh Huy Q., Marcovecchio Paola, Blatchley Amy, Wu Runpei, Ehinger Erik, et al. 2018. “Identification of an Early Unipotent Neutrophil Progenitor with Pro-Tumoral Activity in Mouse and Human Bone Marrow.” Cell Reports 24 (9): 2329–41.e8. [DOI] [PMC free article] [PubMed] [Google Scholar]
- Zhu Yanfang Peipei, Padgett Lindsey, Dinh Huy Q., Marcovecchio Paola, Wu Runpei, Hinz Denise, Kim Cheryl, and Hedrick Catherine C.. 2019. “Preparation of Whole Bone Marrow for Mass Cytometry Analysis of Neutrophil-Lineage Cells.” Journal of Visualized Experiments: JoVE, no. 148 (June). 10.3791/59617. [DOI] [PMC free article] [PubMed] [Google Scholar]
- Zilionis Rapolas, Engblom Camilla, Pfirschke Christina, Savova Virginia, Zemmour David, Saatcioglu Hatice D., Krishnan Indira, et al. 2019. “Single-Cell Transcriptomics of Human and Mouse Lung Cancers Reveals Conserved Myeloid Populations across Individuals and Species.” Immunity. 10.1016/j.immuni.2019.03.009. [DOI] [PMC free article] [PubMed] [Google Scholar]
Associated Data
This section collects any data citations, data availability statements, or supplementary materials included in this article.
Supplementary Materials
Supplemental Table 2. Statistically significant Gene Ontology terms for each of gene cluster of the pair-wise differentially expressed genes (Related to Fig. 6)