Abstract
Induced pluripotent stem cells (iPSCs) are an established cellular system to study the impact of genetic variants in derived cell types and developmental contexts. However, in their pluripotent state, the disease impact of genetic variants is less known. Here, we integrate data from 1,367 human iPSC lines to comprehensively map common and rare regulatory variants in human pluripotent cells. Using this population-scale resource, we report hundreds of novel colocalization events for human traits specific to iPSCs, and find increased power to identify rare regulatory variants compared with somatic tissues. Finally, we demonstrate how iPSCs enable the identification of causal genes for rare diseases.
Introduction
The regulatory effects of common disease loci identified from genome-wide association studies (GWAS), and rare variants for rare genetic disorders, have been increasingly linked to expression changes using large population-scale gene expression resources. Existing efforts have focused on blood1–3, somatic tissues collected post-mortem4 as well as transformed lymphoblastoid cell lines5. However, detecting the regulatory effects of variants can be limited by tissue or cell accessibility. Complementary to somatic cells, human iPSCs combined with differentiation protocols provide powerful model systems for a growing range of mature cell states and types, which have been applied to study both molecular mechanisms of common6–9 and rare10–14 disease. Pluripotent cells themselves can provide unique insights into regulation of gene expression in cell states that mimic early development, with relevance to diseases that manifest in utero or in transient states throughout development15–17. However, the regulatory landscape of genetic variation in human pluripotent cells and its relationship to common and rare genetic remains poorly understood, mainly caused by the lack of appropriately powered genomic resources in human iPSCs.
To address this, we integrated data from five major iPSC genetic studies17–21 within the “Integrated iPSC QTL” (i2QTL) consortium, establishing a large-scale resource of iPSCs with matched genotype and RNA-seq data from a total of 1,367 lines. We characterized regulatory effects of common variants using expression quantitative trait locus (eQTL) mapping of a comprehensive set of RNA phenotypes, including gene-level abundance, exon-level and transcript-, splicing-, alternative polyadenylation-ratio (APA). This identifies hundreds of novel eQTL, which are implicated in colocalization events across a broad range of human traits and diseases.
We further leverage the unique opportunity posed by a large whole-genome sequencing resource combined with RNA-seq to probe for rare variants that are associated with gene expression outliers in human iPSCs. Previous work has demonstrated that aberrant gene expression can enable detection of rare variants when analyzed against a large reference cohort22; however, despite their use in rare disease research, no such reference exists for human pluripotent cells. We show that iPSCs provide increased power for identifying rare, large-effect expression variants compared to previous findings utilizing somatic tissues23, and improve the prioritization of rare variants implicated in a range of common traits and diseases. We also demonstrate the use of the i2QTL resource in modeling gene expression outlier effects linked to pathogenic rare variants across a range of rare diseases, including monogenic diabetes, Bardet-Biedl syndrome, and hereditary cerebellar ataxia. Finally, we present a patient case of global developmental delay, demonstrating the rapid improvement in resolution of candidate disease genes using a joint gene expression outlier analysis of blood and iPSC tissues.
Results
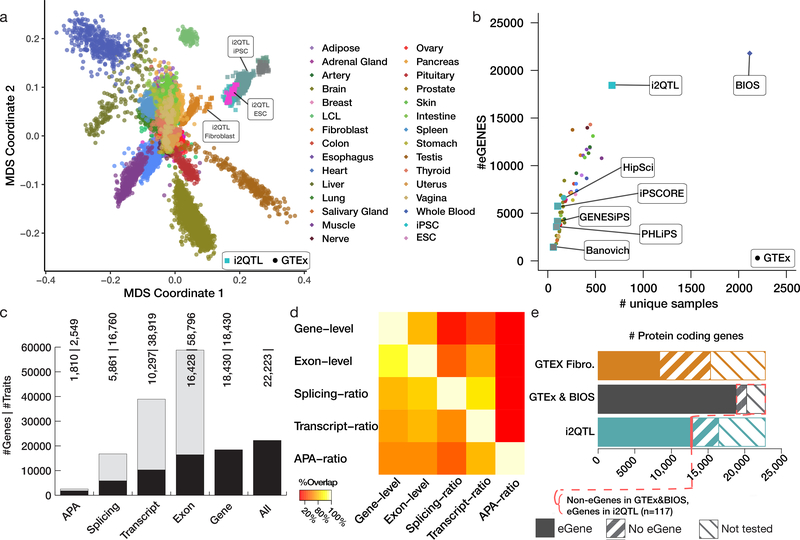
To generate the i2QTL resource, we collected previously published (~60%) and newly generated (~40%) data from human iPSC lines across five major iPSC resources (Supplementary Tables 1 & 2), spanning genotype and RNA-seq data from a total of 1,367 iPSC lines, derived from 948 primarily healthy donors (65 rare disease samples). We included additional data from fibroblast cell lines and embryonic stem cells (ESC) from the HipSci cohort and Choi et al.24 (Supplementary Tables 1 & 2). We uniformly reprocessed genotype array, whole-genome sequencing and RNA-seq data across all samples (see Methods). Joint multidimensional scaling (MDS) of our data and samples from the genotype tissue expression (GTEx4) project (v7) revealed high homogeneity of iPSCs, within and between studies, compared to between-sample and tissue variations observed in GTEx (Fig. 1a). Furthermore, iPSCs clustered together with ESCs, supporting the quality of the i2QTL resource (Fig. 1a).
Figure 1. Map of cis genetic regulation in human induced pluripotent cells.
A. Comparison of gene expression profiles of iPSCs vs. GTEx (v7) tissues. Shown are the first two MDS components based on gene-level RNA abundance. B. Comparison of the number of discovered eGenes as a function of sample size considering this study (i2QTL), existing iPSC studies (HipSci, iPSCORE, GENESiPS, PHILIPS, Banovich), GTEx (color code as in A) and a blood eQTL meta-analysis (BIOS). C. Breakdown of the number of RNA traits with a cis-eQTL. The bar plots display both the number of individual RNA traits with a cis-eQTL (grey) as well as the number of genes with at least one association (eGenes, black, aggregated across RNA traits per gene). D. Pairwise replication of genetic effects between RNA traits. Shown is the fraction of cis-eQTL discovered for each trait (rows, FDR < 5%) with replicated effects in a second trait (columns, FDR < 10%; assessing pairwise replication across RNA traits per gene). E. Comparison of the number of protein-coding genes with an eQTL (eGene), genes without eQTL (no eGene) and genes not tested for eQTL (not tested) in Fibroblasts (orange), the combination of the GTEx tissues and BIOS (black) and i2QTL iPSCs (blue). The fraction of protein-coding (0.5%) eGenes without previous evidence for an eQTL in BIOS & GTEx is shown in red.
A high-resolution map of cis-eQTL in human pluripotent cells
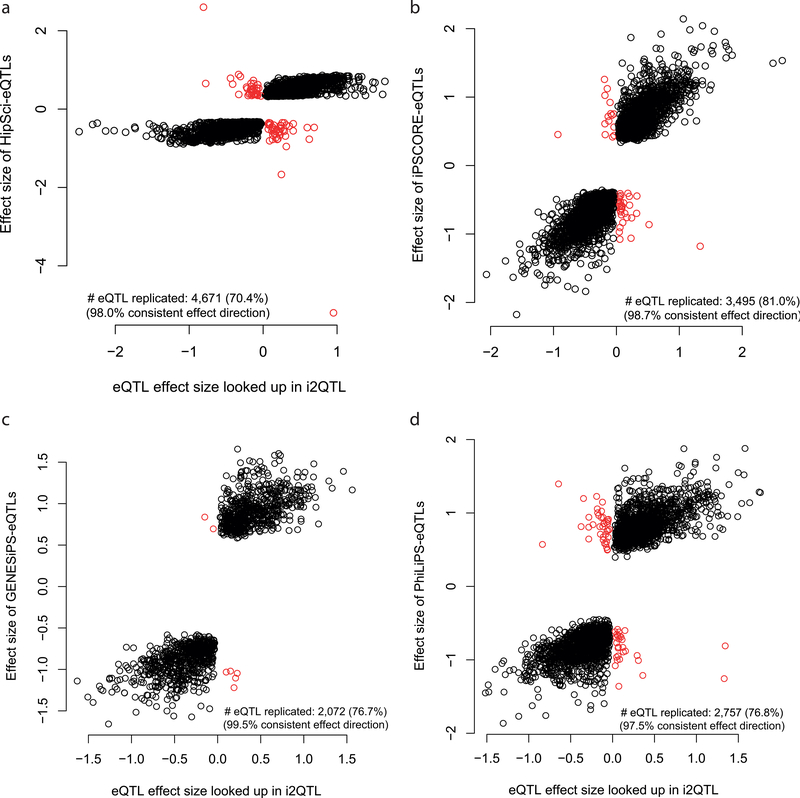
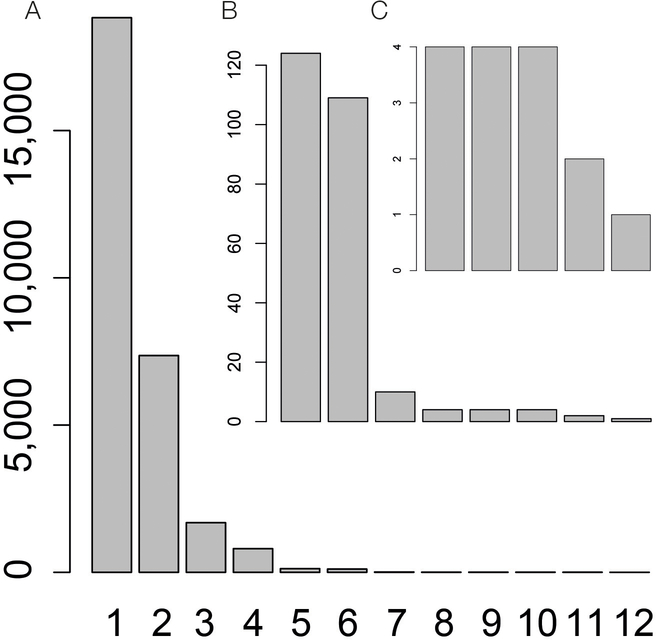
We mapped cis-eQTL, considering proximal common variants (gene body + 250 kb on both sides, MAF >1%) and paired-end stranded RNA-seq data available for 936 samples (N = 682 donors) of European ancestry (Methods). For 18,430 genes out of 27,046 Ensembl genes expressed in iPSCs (Methods), we identified at least one cis-eQTL (Supplementary Table 3, Methods; in the following denoted eGenes). This corresponds to a 2.5-fold increase compared to the largest previous gene-level cis-eQTL map in human pluripotent cells17 (Fig. 1b), while replicating previous studies (Supplementary Methods, Extended Data Fig. 1). Iterative eQTL mapping using stepwise regression (Methods) identified two or more independent effects for 39.0% of eGenes, with a maximum of 12 independent cis-eQTL for PTGR1 (Extended Data Fig. 2). In addition to gene-level expression, we considered further RNA-seq derived traits for eQTL mapping: transcript-ratio, exon-level, splicing-ratio and APA-ratio (Methods, Supplementary Table 4–7). In aggregate, we report genetic effects for 21,548 genes (FDR <5%, Fig. 1c), an increase of 17% compared to gene-level eQTL alone. Most eQTL variants were associated with two or more RNA traits (77%, Fig. 1d).
To identify iPSC-specific regulatory effects, we compared gene-level cis-eQTL in iPSCs with eQTL mapped in somatic tissues from GTEx4 (48 tissues) and BIOS3 (whole blood). Notably, we identified a greater number of eGenes compared to any single GTEx tissue (Fig. 1b,e), and a comparable number as reported in the BIOS meta-analysis, despite its substantially larger sample size (Fig. 1b). This is in line with previous observations17,25, likely reflecting the transcriptional homogeneity of iPSCs20,26 (Fig. 1a). A total of 995 eGenes detected in i2QTL iPSCs were not previously identified (Fig. 1e; 5.4% of the eGenes; 50 not assessed in other studies; Supplementary Table 3). These putative iPSC-specific eGenes were enriched for cancer (COSMIC27 genes, q = 2.4 × 10⁻⁵, Fisher Exact Test) and embryonic development 28(q = 0.03).
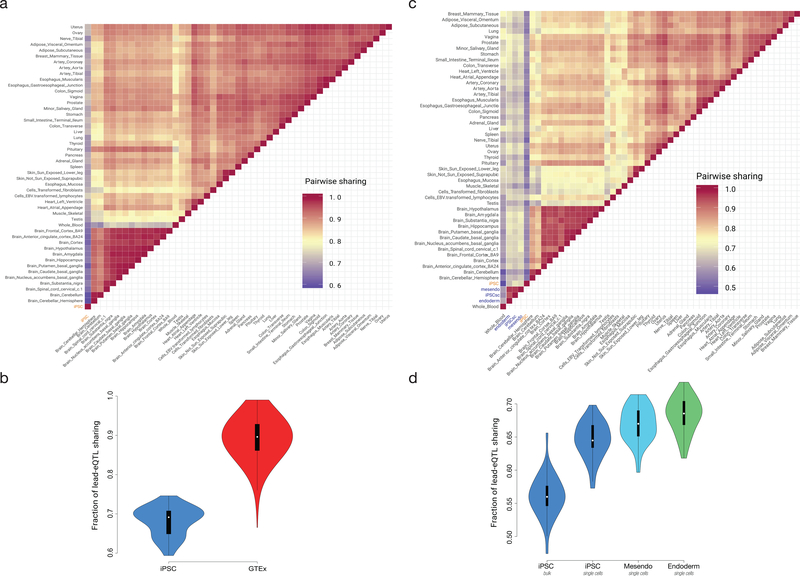
To assess the tissue specificity of shared eGenes that were detected in iPSC and at least one GTEx tissue, we employed MASHR29 to assess the replication of lead eQTL effects for 11,682 genes (replicated effect and consistent effect direction; Methods). Globally, this identified iPSCs as markedly distinct from GTEx tissues (iPSC versus GTEx on average 68.1% vs. 88.7% within GTEx tissues replication rate, Methods, Extended Data Fig. 3a). We also ranked eQTL discovered in iPSCs by the number of GTEx tissues in which these effects are replicated, observing that eGenes with low eQTL replication in GTEx were again enriched for cancer (n = 3) and developmental gene sets (n = 1) (q <10%, GSEA v4.1 pre-ranked enrichment test, Methods, Supplementary Table 8). Finally, we extended the MASHR analysis, including single-cell data from an iPSC differentiation study using HipSci lines8, which demonstrated that the observed patterns of iPSC-specific eQTL diminishes rapidly as cells exit a pluripotent state (Extended Data Fig. 3b).
Identification of trans-eQTL in pluripotent cells
We tested for trans (variants >2.5 Mb from gene-body) genetic effects on gene-level abundance using expression data from all individuals of European ancestry (samples N = 1,123, donors N = 759, Supplementary Table 2; Methods). To mitigate the burden of multiple testing we tested for associations between 16,451 protein-coding genes and a targeted set of 115,700 variants obtained by combining iPSC cis-eQTL (N = 93,146) and GWAS variants (N = 23,798; NHGRI-EBI GWAS catalog30 v92).
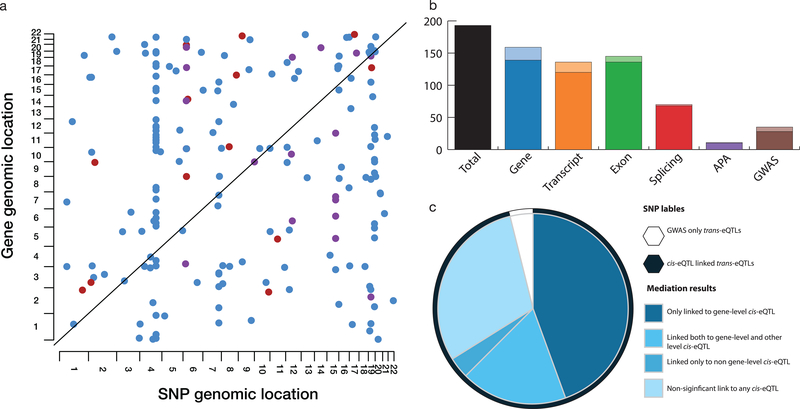
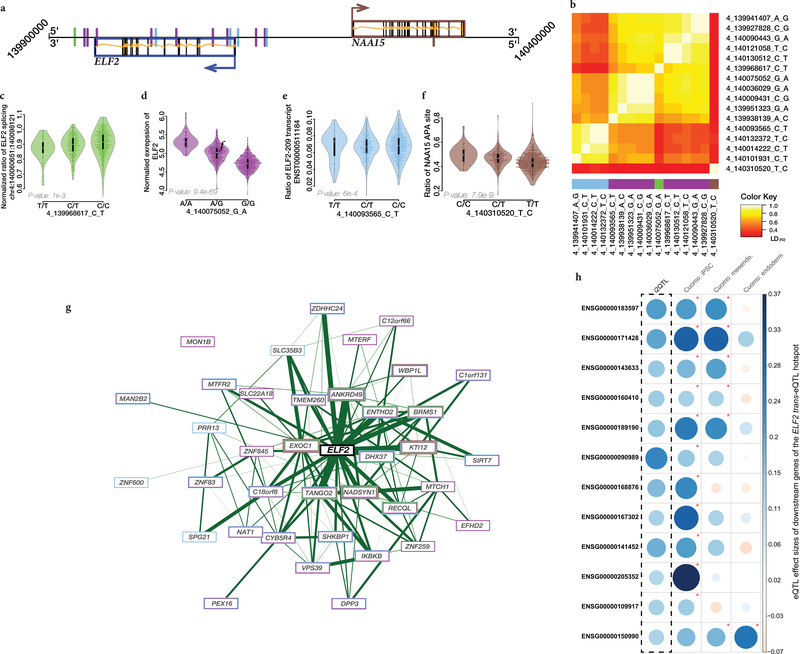
Genome-wide, this identified 193 independent trans-eQTL affecting 191 unique genes (Extended Data Fig. 4a, Supplementary Tables 9 & 10, FDR <10%; permutation-based adjustment, Methods). Only a few trans-eQTL were associated to GWAS variants (21 effects), whereas most effects were linked to cis-eQTL variants (186 effects, of which 9 linked to iPSC-specific cis-eQTL). Notably, 46 of these trans-eGenes were exclusively linked to variants with cis-associations to transcript-ratio, exon-level, splicing-ratio or APA-ratio and hence would be missed by common trans-eQTL analysis strategies (Extended Data Fig. 4b). For 121 of 186 expression-linked eQTLs we observe a significant correlation between the cis- and trans-eGene (FDR <5%; Supplementary Results, Methods). To formally assess the mediating role of the different RNA traits, we performed mediation analysis and identified 42 (21.7% of the trans-eQTL) instances where the effect on the trans-eGene was mediated by an RNA trait other than gene-level (Extended Data Fig. 4c). Among the identified trans-eQTL, there were four hotspots that regulate five or more genes, with the largest hotspot located in the vicinity of the ELF2 transcription factor (37 trans-eGenes; Supplementary Results, Extended Data Fig. 5).
We used held-out samples (237 lines, from 186 donors) to assess the replication of trans-eQTL, observing evidence for 17.1% of the individual associations in the hold out fraction (nominal P <0.05 and same effect direction). We applied the same replication strategy using DNA methylation data available for a subset of lines (N = 841), replicating 26.9% of the effects (considering methylation probes proximal to target genes, adjusted P <0.05; Supplementary Methods). These replication rates exceeded the chance expectation (Exprs: 7%, Meth: 20%; Methods), and collectively provided evidence for nominal replication of 37.8% of the trans associations (Supplementary Table 9).
Next, to explore the tissue-specificity of trans-eQTL, we assessed evidence for tissue-specific regulation of cis-eQTL that drive trans-eQTL (using the MASHR analysis; Methods). We observed that cis-eQTL with downstream trans effects were associated with a lower degree of tissue sharing than other cis-eQTL (median tissue sharing 7 versus 16, P = 0.04, Wilcoxon test, Supplemental Methods). Additionally, we assessed the replication of trans-eQTL across a single-cell RNA-seq differentiation time course from 125 HipSci lines8. While in undifferentiated iPSCs, 11.9% of the trans effects were replicated (P <0.05 and same direction, 86.5% trans-eGenes expressed), we observed a marked decrease in replicated following one day of differentiation towards endoderm, and even lower replication rates following three days of differentiation towards definitive endoderm (4.1%; Supplementary Table 9). Consistent with these global statistics, we also observed reduced trans effects for individual targets of the trans-eQTL hotspot at ELF2 (Supplemental Results, Supplementary Tables 9 & 10, Extended Data Fig. 5).
iPSC analysis improves identification of rare variants associated with aberrant gene expression
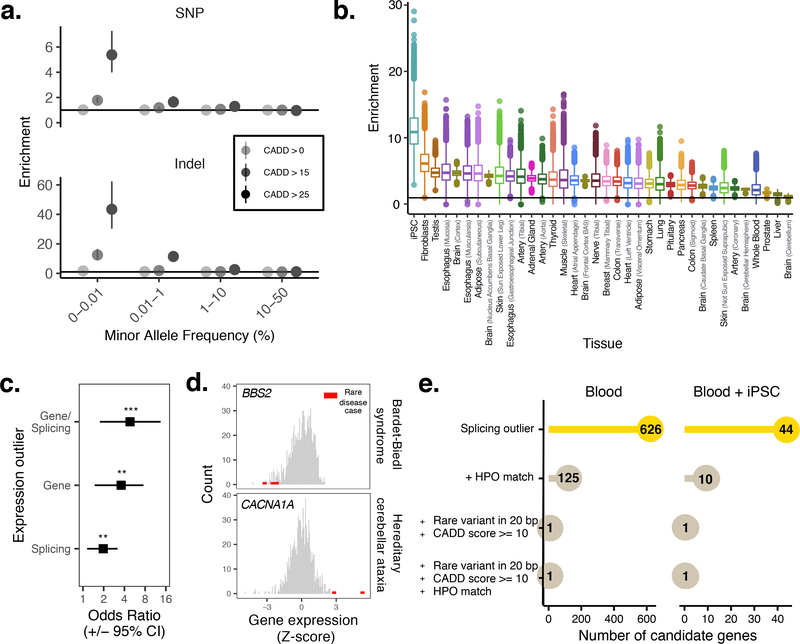
Given the sample size of our cohort and the availability of high-quality SNP and SV calls31 based on whole-genome sequencing data (N = 425 lines), we sought to identify rare variants with large effects on iPSC gene expression. Adapting strategies previously employed in cohorts of somatic tissues23,32,33, we classified iPSCs with outlying gene expression levels for each gene (under or over-expression of PEER-adjusted34 gene expression levels; Z-score based criterion; Methods), which identified at least one outlying iPSC line for 17,514 genes. Next, we computed burden scores for gene-proximal rare variants (within the gene body of ± 10 kb around gene), comparing outlier and non-outlier lines. Notably, both SNPs and indels were enriched in under-expression outliers for rare (gnomAD MAF 0 < MAF ≤ 0.01%), highly-deleterious (CADD >25) variants (5-fold and 40-fold increase for SNP and indels, respectively) (Fig. 2A) (Supplementary Table 11). For structural variants (SVs), a 9-fold increase in rare (study MAF <1%) duplications, and 18-fold increase in rare multi-allelic copy number variants (mCNVs), was observed in over-expression outliers compared with non-outliers (Supplementary Table 11). Notably, singleton, high-CADD SNPs (CADD >25) were found at a 12-fold higher rate in under-expression outliers than non-outliers at a Z-score of Z <- 2 (up to 60-fold when Z < −6).
Figure 2. Linking rare variants to gene expression outliers.
A. Enrichment of deleterious rare SNPs and indels in samples with gene expression outliers. B. Comparison of enrichments for singleton, highly-deleterious (CADD > 25) SNPs in iPSCs versus GTEx v7 tissues (adjusted for differences in sample size; Methods). Shown are enrichment scores for 10,000 random draws of 50 samples. The strongest enrichment is observed in iPSCs. N = 7,756 biologically independent samples. The data are represented as a boxplot where the middle line corresponds to median, the lower and upper edges of the box corresponding to first and third quartiles, the whiskers represent the interquartile range (IQR) × 1.5 and beyond the whiskers are outlier points. C. Odds ratios comparing gene and splicing outliers in validated rare disease genes compared to non-disease genes (P values: Gene/splicing = 0.0009; Gene = 0.002; Splicing = 0.01). Outliers in rare disease patient samples are observed in known disease genes at a higher rate. P values computed using two-sided Fisher’s exact test. Error bars represent 95% confidence interval. D. Example of outlier expression in two validated rare disease genes (BBS2 for Bardet-Biedl syndrome (top) and CACNA1A for hereditary cerebellar ataxia). Rare disease cases indicated in red, reference distribution shown in grey. E. Integrating splicing outliers in blood and iPSCs to reduce the total number of candidate disease genes in a rare disease patient.
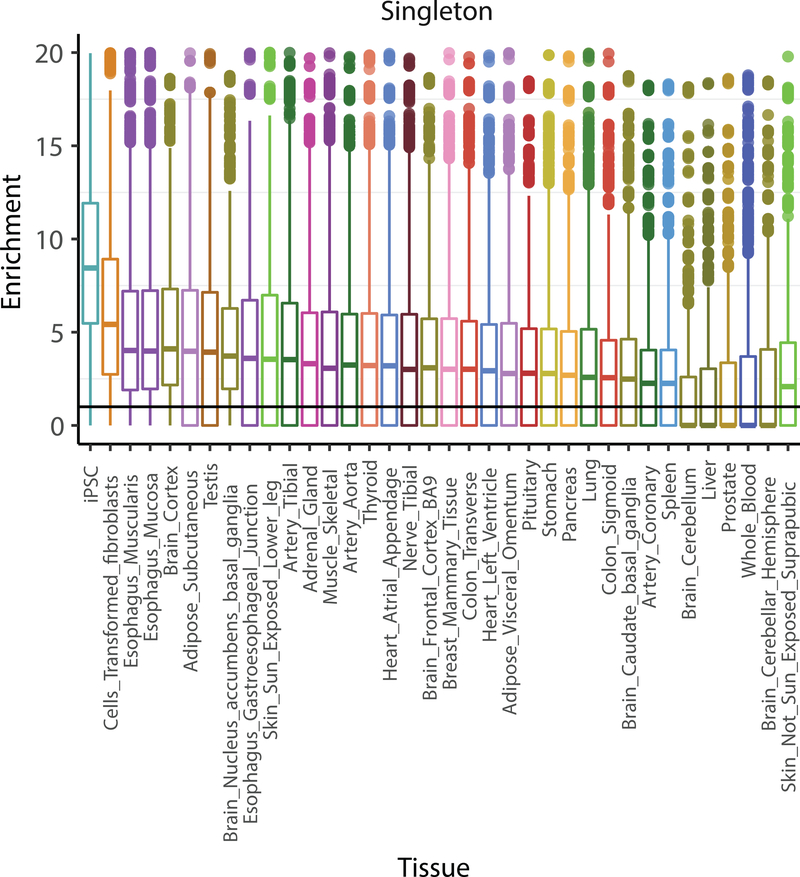
To place this enrichment of rare variants into context with prior studies that have linked rare genetic variants to outlying gene expression in somatic tissues23,35, we repeated the outlier analysis for singleton, high-CADD (CADD >25) SNPs using consistently processed data from GTEx (v7). We considered 35 tissues with at least 50 samples (after removal of globally outlying samples as for iPSCs; Methods) (Fig. 2B; Methods), and calculated the enrichment scores across 10,000 random draws of equal sample size for each tissue (N samples = 50). This identified iPSCs as the cell type with the largest enrichment score (median ~9), followed by GTEx fibroblasts (median ~7) and GTEx testis (median ~5) (Supplementary Table 12). Enrichments were moderately correlated with the number expressed genes in each tissue (Pearson r = 0.34), however the overall patterns were retained when controlling for this effect (Extended Data Fig. 6).
Leveraging iPSC transcriptome reference data to improve rare disease diagnostics
RNA-seq of blood and other accessible tissues has been used to prioritize putatively causal genes for rare diseases, by identifying genes with outlying expression patterns and pathogenic variants36–38. Despite the prevalence of iPSC models in rare disease research, such strategies have not previously been deployed to iPSCs due to lack of sufficiently large reference collections. To assess the potential of i2QTL for this task, we used a set of 65 iPSC lines derived from individuals with rare genetic disorders for which the causal gene is clinically annotated (N = 15 unique genes, N = 3 unique diseases; Supplementary Table 1) that are part of the HipSci collection.
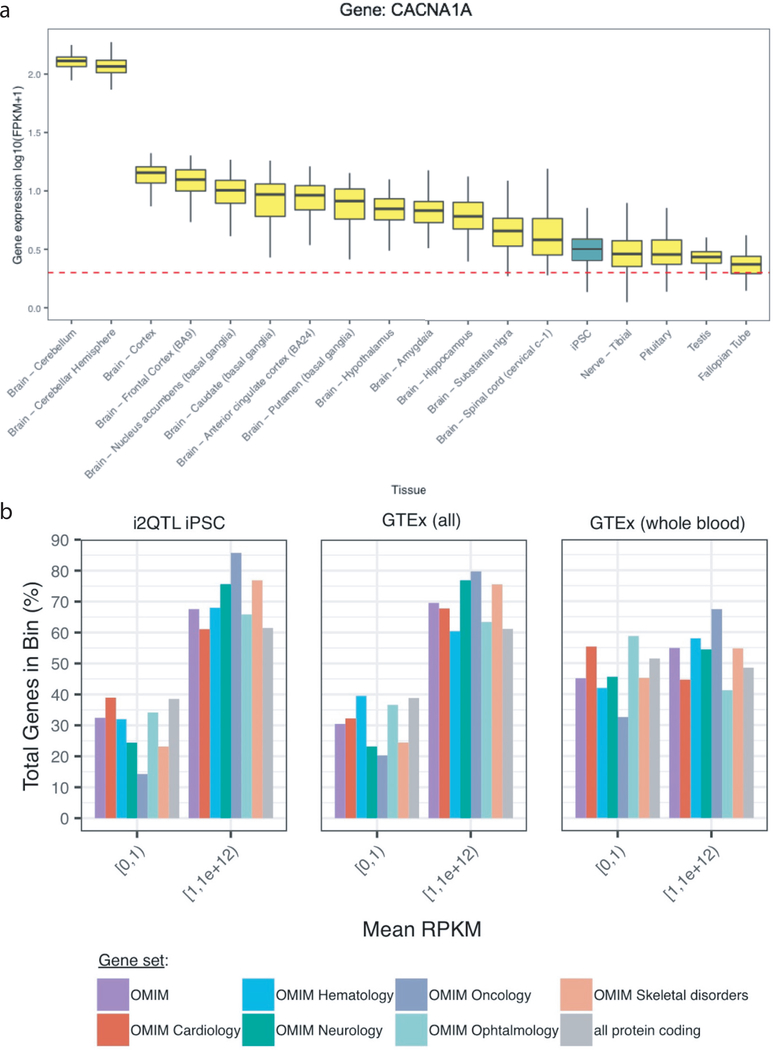
When considering known causal genes in the rare disease samples, we observed outlier (abs(Z-score) >2) gene expression in 12.3% of disease gene-sample pairs, compared to 3.75% of gene-sample pairs for non-disease associated genes matched for expression level (N = 1,138,345) (Fisher’s exact test: odds ratio = 3.59 (CI 1.48 – 7.57); P = 0.002, Methods) (Fig. 2C & 2D). We performed the same analysis for splicing outliers; comparing the fraction of splicing outliers for rare disease cases in known causal genes compared to non-causal genes, observing a 2-fold enrichment for splicing outliers (abs(Z-score) >2) in disease causal genes (Fisher’s exact test: odds ratio = 1.97 (CI 1.15 – 3.18); P = 0.01). Finally, we computed an integrated odds ratio by combining gene- and splicing-level outliers, observing an almost 5-fold enrichment known rare disease genes compared to non-disease genes (Fisher’s exact test: odds ratio = 4.83 (CI 1.76 – 13.43); P = 0.0009). Focusing on the rare disease Hereditary Cerebellar Ataxia as an example, we compared expression of the known disease gene (CACNA1A) in iPSCs to GTEx, finding that the gene was only expressed (FPKM ≥ 1) in iPSCs and GTEx tissues that are difficult to biopsy clinically (including brain tissues, testis, and fallopian tube) (Extended Data Fig. 7a). More generally, considering a broad range of curated disease genes (OMIM39), we observed a larger number of disease genes expressed in iPSCs compared to whole blood and other GTEx tissues (Extended Data Fig. 7b), highlighting the utility of iPSC transcriptomes to model the effects of pathogenic variants across diverse rare diseases.
We further tested whether i2QTL transcriptome data can improve the prioritization of putatively causal genes when combined with blood RNA-seq profiles. Briefly, we generated RNA-seq data from an iPSC line derived from a patient with a validated KCTD7 splicing defect (Methods), for whom blood expression profiles had previously been generated22. Outlying gene expression patterns in blood alone (compared to RNA-seq data from 244 reference samples in Frésard et al.22) yielded 626 candidate disease genes with at least one outlier splicing junction (abs(Z-score) >2). Notably, the intersection of outlying splice patterns in blood and iPSCs resulted in a set of only 44 genes – an approximately 14-fold reduction in the number of candidate disease genes for further curation, and containing the known causal disease gene (Fig. 2E). This highlights a generalizable approach enabled by i2QTL reference data to enhance outlier detection in rare disease patients.
GWAS variants from multiple diseases have molecular impacts in pluripotent cells
A major opportunity provided by eQTL maps in iPSCs is to identify colocalization events with GWAS loci, which could point to developmental or transient regulatory mechanisms. Using a combination of FINEMAP40 and eCAVIAR41 (Methods), we systematically assessed colocalization between eQTL for all five RNA traits and a broad range of previously reported genetic associations obtained from diverse GWAS studies, the Phenome Scanner Database V242, the NHGRI-EBI GWAS catalog30 and GWAS curated in LocusCompare43 for a combined total of 350 GWAS, and additionally the 1,740 traits from the UKBB phase 1 GWAS (http://www.nealelab.is/uk-biobank/).
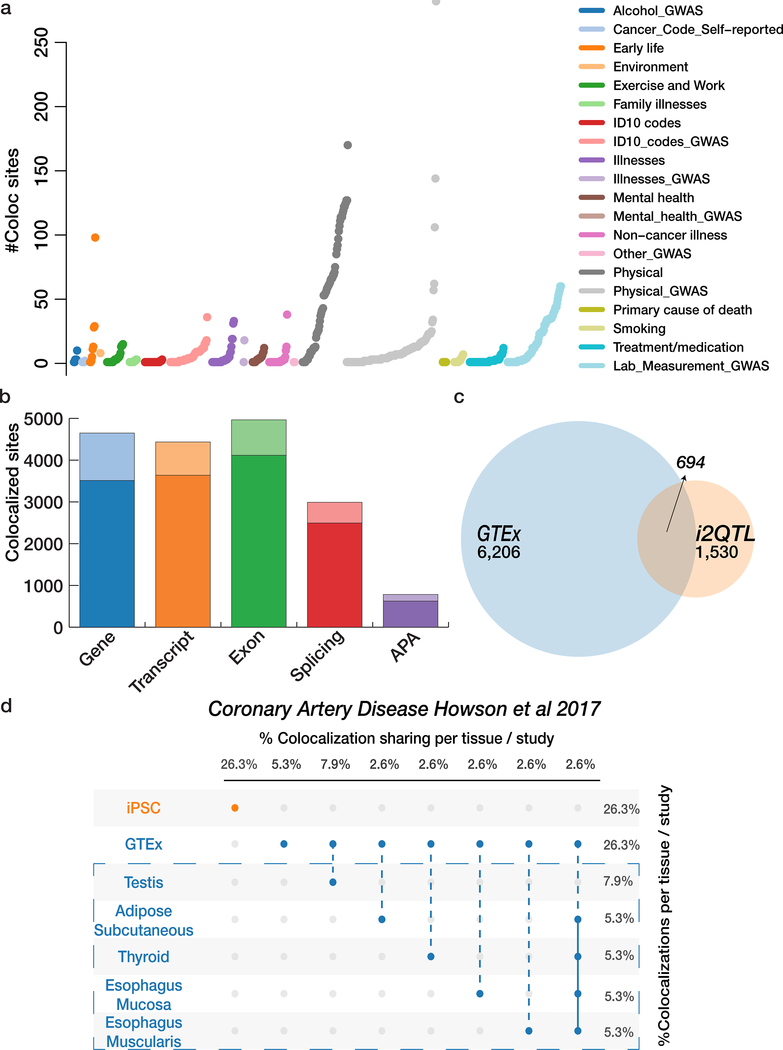
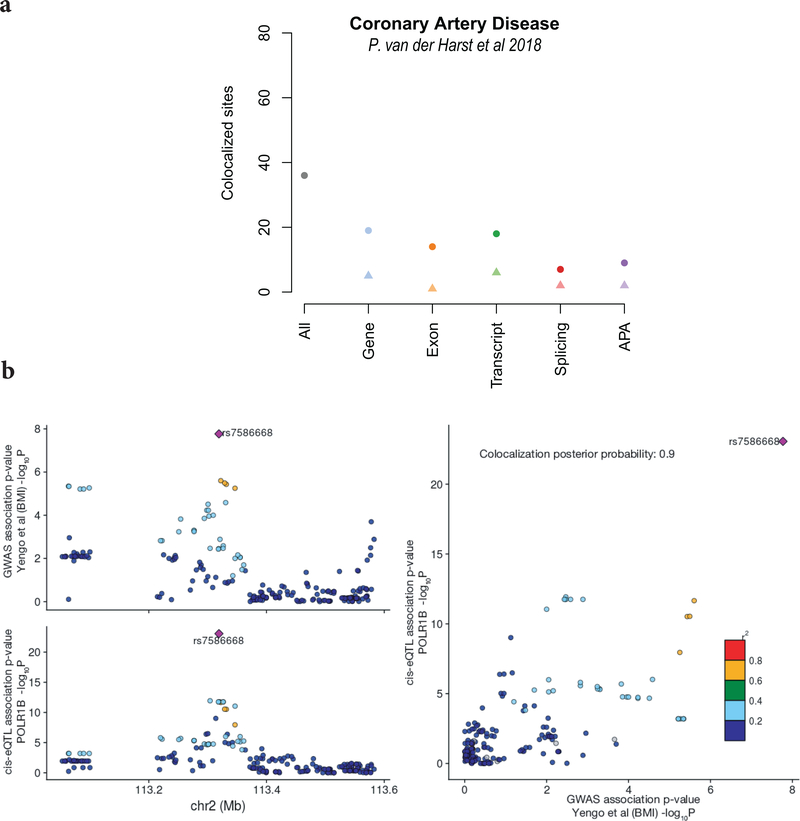
In total, we identified 4,336 colocalization events (Methods), linking 608 disease- and phenotype loci to 10,794 cis-eQTL (Fig. 3a, Supplementary Table 13). Although gene-level eQTL represented the majority of colocalizations, 41% of these exclusively colocalized with non-gene-level eQTL (Fig. 3b). For example, 36 out of 93 GWAS loci for a coronary artery disease GWAS44 (CAD) had evidence for colocalization with an iPSC eQTL, involving different RNA traits (Extended Data Fig. 8a). Next, we assessed which diseases had the largest numbers of colocalization in iPSCs, relative to the total number of GWAS loci, which identified primary biliary cirrhosis45 (PBC) (10/12 GWAS loci), followed by triglyceride46 (12/15 GWAS loci (TG)) levels as iPSC-linked traits. The co-localized genes for PBC were enriched for MAPK, NF-kappa B and TNF-R1 signaling pathways (g:Profiler P adj.: 1.1 × 10⁻², 4.9 × 10⁻², 5.725 × 10⁻³, respectively), with known functions in the immune system matching the disease. Enrichment analysis for TG colocalized genes showed significant overlap with metabolic pathways (g:Profiler: alpha-linolenic acid metabolism, P adj.: 4.899 × 10⁻³; biosynthesis of unsaturated fatty acids, P adj.: 5.729 × 10⁻³, fatty acid metabolism, P adj.: 2.585 × 10⁻²), again matching the known disease biology. We also observed co-localization events for genes that were identified as trans regulators in iPSCs (Methods; Supplementary Results; Supplementary Table 14). For example, the most significant trans-eQTL (P adj. = 1.08 × 10⁻¹⁵) associated with changes in expression of NBPF14, known to be frequently mutating breast cancer47, colocalized to a GWAS hit (rs11249433>A:G) for breast cancer.
Figure 3. Colocalization of disease and traits variants with iPSC eQTL.
A. Overview of colocalization events with iPSC eQTL, depicting the total number of colocalization events across 350 GWAS and UKBB, with colors encoding the trait categories. B. Colocalization events for each cis-eQTL type, displaying the number of GWAS loci with colocalization events that are either specific to a given eQTL type (light color; not detected by any other eQTL type) or shared with at least one other eQTL type (dark color). C. Overlap between i2QTL and GTEx GWAS colocalization events for gene-level eQTL, considering the number of unique gene-colocalization pairs. D. For the Howsen et al. coronary artery disease GWAS, iPSC eQTL resulted in an 50% increase in the number of colocalization events with disease loci compare to GTEx eQTL alone. iPSC associations in orange GTEx in blue, GTEx tissues with 2 or more genes implicated in the dashed box below.
Finally, we compared the gene-level colocalizations in iPSCs to GTEx, focusing on 452 GWAS that were assessed in the LocusCompare study43, which has employed consistent colocalization methodology using eQTL from GTEx tissues. Among the 7,042 colocalization events in aggregate across all eQTL maps, 836 events were exclusively detected in iPSCs (Fig. 3C, Supplementary Table 15). Notably, 47 of these iPSC-specific colocalization events were associated with genes that lack an eQTL in GTEx tissues, and 231 colocalizations were due to iPSC-specific eQTL signals as identified from the MASHR (V0.2.21) analysis. For example, we identified an iPSC-specific colocalization event for POLR1B and a GWAS variant for height (rs7586668>C:T48, Extended Data Fig. 8b). Recently, a mutation in this gene in zebrafish has shown to give rise to altered body size49. Collectively, these novel colocalizations substantially increased the number of linkages between GWAS loci and eQTL for traits such as CAD50 (50% new colocalizations, Fig. 3D), Parkinson’s disease51 (20% new colocalizations) and Alzheimer’s52 (7.5% new colocalizations). Moreover, 74 of the iPSC-specific colocalizations were linked to 31 traits that had no prior evidence for eQTL colocalization.
Outlier rare variants in iPSCs have large impacts on diverse complex traits
We leveraged the map of GWAS-eQTL colocalizations to prioritize genes that are more likely to harbor rare variants that are associated to expression outliers in iPSCs and affect a specific trait.
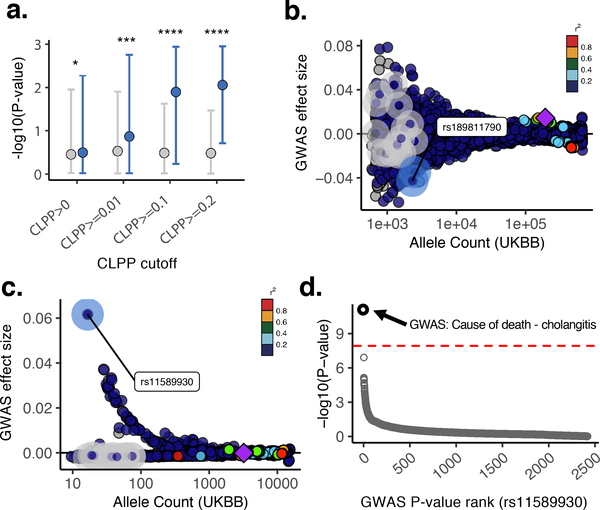
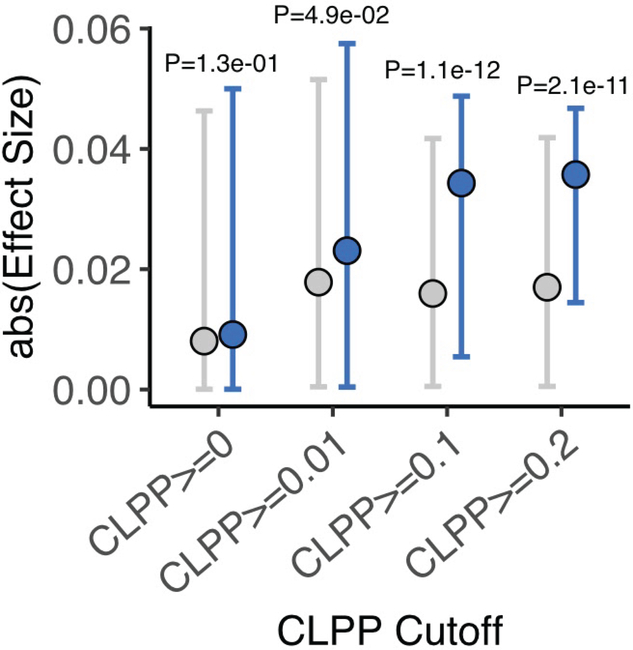
Specifically, we intersected our catalog of outlier-associated rare variants with GWAS summary statistics for matched traits contained in the UKBB Phase 1 GWAS, resulting in 10,103 outlier-associated variants linked to 779 genes (Methods). We then compared these outlier variants with matched non-outlier variants stratified by the colocalization CLPP score of the corresponding gene (Methods). Globally, outlier-associated rare variants for genes with evidence of GWAS-QTL colocalization were associated with more significant GWAS P values for the corresponding traits (Fig. 4A). This enrichment was stronger for increasing CLPP score (Methods; CLPP >0, P = 0.02; CLPP ≥0.2, P <1 × 10⁻¹⁶), and consistent trends were observed when considering GWAS effect sizes instead of statistical significance (Extended Data Fig. 9). Overall, from the starting list of outlier and matched non-outlier variants with CLPP score > 0 (N genes = 319; N traits = 543), we identified 48 (8.8%) traits with at least weak evidence of colocalization (CLPP ≥0.01), comprising 58 unique outlier-associated variants proximal to 35 genes (Supplementary Table 16).
Figure 4. Integration of common-variant colocalization analyses with outlier-associated rare variants.
A. Negative log10 P values of GWAS trait associations for iPSC outlier- and non-outlier-associated variants, considering genes with varying degree of evidence for colocalization with common eQTL variants. Genes are stratified by colocalization posterior probability (CLPP) score. Outlier-associated variants have overall more significant effects in GWAS in which there was evidence for colocalization of the same genes compared to matched non-outlier variants, increasing with colocalization probability (CLPP). Dots denote median values; error bars indicate 95% of empirical data range. P values from one-sided Wilcoxon test (P values: CLPP >0, P = 1.3 × 10−02; CLPP ≥0.01, P = 7.2 × 10−04; CLPP ≥0.1, P = 4.0 × 10⁻¹⁸; CLPP ≥0.2, = 7.1 × 10⁻¹⁷). B. Example gene locus with two outlier-associated variants highlighted (blue highlight), which exhibit the largest protective effect sizes among all outlier and non-outlier samples (gray highlight) mapping to the gene. Color denotes LD (1000 Genomes European55) relative to the lead variant (smallest P value) (purple diamond) in HSD17B12 gene locus. C. Example gene locus highlighting an outlier-associated variant (blue highlight) with the largest protective effect sizes among all outlier and non-outlier samples (gray highlight) mapping to the DENND1B gene. Points are colored by LD (1000 Genomes European55) relative to lead variant (smallest P value) (purple diamond) in gene locus. D. P value rank for SNP rs11589930:C>A across all UKBB Phase 1 GWAS (N = 2,419). Red dashed line indicates Bonferroni P value cutoff.
Among these we observed an example an outlier-associated rare variant rs189811790:A>G in HSD17B12, a gene known to be involved in type 2 diabetes mellitus53, for basal metabolic rate (UKBB GWAS ID: 23105) with a CLPP score of 0.29 (Fig. 4B). The outlier-associated rare variant in this gene has one of the largest protective effect sizes within 1 Mb around the locus (overall SNP rank = 30/4,065; top 0.73%), and it was among the top effects genome-wide (top 0.8% across all SNPs). However, owing to its low frequency this variant does not pass conventional thresholds for genome-wide significance (P = 0.003). Another candidate was observed for outlier-associated rare variant rs11589930:C>A linked to gene DENND1B, previously implicated in cholangitis54, for which we identified a rare variant associated with gene and transcript-level outliers and associated with cholangitis (UKBB GWAS “40001_K830 - Underlying (primary) cause of death: Cholangitis”). This variant had a genome-wide significant P value (P = 9 × 10⁻¹²), was in low LD with known GWAS SNPs (R2 = 0.0009) and had an absolute effect size within the top 0.04% of variants overall (Fig. 4C). The P value did not reach genome-wide significance in any other UKBB GWAS (Fig. 4D). Taken together, these results highlight a generalizable approach enabled by the i2QTL resource whereby colocalization and outlier analyses enable the detection of candidate rare variant effects on quantitative traits.
Discussion
Genetic effects in pluripotent cells can elucidate the spectrum of traits that may manifest during development and across cell differentiation. To maximize the power for such genetic analyses, we harmonized population-scale iPSC genetic and transcriptomic datasets across five studies. The scale of our resource, spanning transcriptomic and genomic profiles from iPSCs derived from close to one thousand unique donors, has enabled the mapping of cis-eQTL across a comprehensive range of RNA traits, the identification of trans-eQTL and the study of rare variant effects and their collective impacts on genetic traits and diseases.
We identified cis-eQTL across five RNA traits, yielding regulatory variants for 67.2% of expressed genes in human iPSCs (N = 21,548). This included 995 cis-eGenes that were not previously reported in eQTL maps from somatic tissues. Next to cis-eQTL, we identified 193 trans-eQTL, a substantial fraction of which (91/193) are linked to non-gene-level eQTL, which supports the relevance of eQTL variants acting on splicing, transcript isoforms, exons or alternative polyadenylation.
Outlier gene expression can aid in detection of rare variants and disease genes. We observed increased power to discover outlier-associated rare variants in iPSCs compared to somatic tissues. We further demonstrated how population-scale iPSC transcriptome data enables prioritizing disease genes from individuals with known rare genetic disorders. In a collection of rare disease samples that are part of our study, we identified a 5-fold enrichment of outliers in known rare disease genes and demonstrated detection of gene outliers in cases with monogenic diabetes, Bardet-Biedl syndrome, and hereditary cerebellar ataxia. These results demonstrate how iPSC transcriptome data from a large control cohort such as i2QTL can be directly utilized for rare disease identification, even prior to generating disease-specific differentiated cell types.
The large-scale eQTL maps enabled the generation of a comprehensive colocalization map between regulatory variants in human pluripotent cells and complex human traits. We annotated over 4,400 GWAS implicated loci (out of the 29,666 assessed loci), originating from over 600 traits, to eQTL in iPSCs. We observe unique colocalized loci across a range of traits, from physical traits to diseases and lab-measurements, including 836 colocalizations present exclusively in iPSCs. Among these we found colocalizations for developmental traits, such as congenital craniofacial abnormalities, and heritable cancers. Lastly, by integrating our colocalization results and rare variants linked to expression outliers, we demonstrated prioritization of variants with large impacts on traits measured in the UK Biobank.
Overall, the genetic maps and colocalization catalogs generated in this study form a valuable reference dataset, further aiding in the interpretation of risk variants in a unique cell type relevant for both development, cellular differentiation, cancer and rare disease research. We expect that the genetic maps presented here, in combination with the constantly growing GWAS and rare disease resources, will reveal missing molecular underpinnings of complex and rare genetic diseases and traits manifesting during development.
Online Methods
Dataset information
Within the “Integrated iPSC QTL” (i2QTL) consortium we reprocessed existing and newly generated transcriptomic and genomic data from iPSC lines from five studies17–20,56–59. A short description is given on each of the analyzed studies in the supplementary methods, and in Supplementary Table 1 the references to the data sources are given.
Genotype and RNA data processing
In brief, all data, array-based genotypes, whole-genome sequencing and RNA-sequencing, were homogenously reprocessed from the raw data deposited on the respective repositories (Supplementary Table 1). Array-based genotypes from all cohorts were quality controlled and imputed against a combined reference of UK10K and 1000 genomes. Whole-genome sequencing data from HipSci and iPSCORE were jointly reprocessed to perform joint variant calling across the two cohorts. RNA-sequencing data were homogenously processed with study-level quality control metrics and read mapping using STAR, followed by gene and exon expression quantification using featureCounts. Salmon was used to quantify transcript levels and ratios, leafCutter was used to quantify splicing levels, and APA ratios were quantified as described in Zhernakova et al.3. Full details on the raw data processing are provided in Supplementary Methods.
PEER correction and optimization
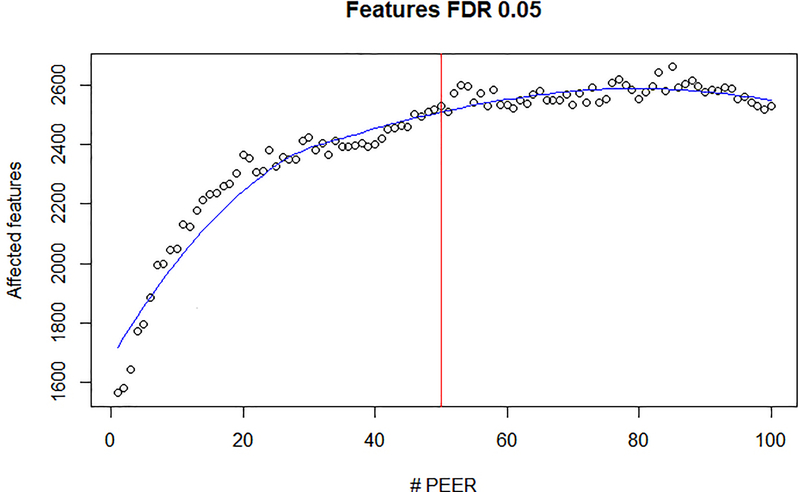
We used PEER34 to adjust for transcriptome-wide confounding sources of variation. We chose to not include known factors when estimating PEER factors, as meta-data were sparse and not standardized across studies. We ran PEER (v1.3) on normalized gene-level quantifications, considering genes with a TPM > 2. We assessed the impact of the number of estimated PEER factors on eQTL mapping as quantified by the number of eGenes detected (genes with at least one eQTL at FDR < 5%) (Extended Data Fig. 10). We used 50 PEER factors for all analyses, reflecting a compromise between selecting a compact set of factors while maximizing eQTL detection power. To rule out that PEER factors themselves are subject to genetic regulation, we tested each factor association with genome-wide variants, and found no effect (FDR >10%).
Quantitative trait loci mapping
For expression quantitative trait loci (eQTL) mapping, both in cis and trans, we used a linear mixed model implemented in LIMIX60 (v2). This model allowed controlling for both population structure and repeat lines from the same donor using kinship as a random effect component. The kinship matrix was estimated using the identity-by-descent function in PLINK (1.07)61, considering independent variants with a MAF ≥5%. Fifty PEER factors, derived from gene-level abundance were included as fixed effect covariates in all analyses (see previous section). eQTL mapping was performed using log-transformed standardized expression levels when considering both gene-level and exon-level data; for the other RNA traits, the ratio-based traits, we used an arcsin-transformation to approximately variance stabilize each trait. Significance of the eQTL SNP was assessed using a likelihood ratio test.
To control for multiple testing, we employed an approximate permutation scheme as in Ongen et al.62. Briefly, for each gene, we obtained an empirical null distribution of P values from 1,000 genotype permutations while retaining covariates, kinship, and expression values. Subsequently, we fit a parametric Beta distribution to the most significant P value per gene per permutation to interpolate the null distribution. Using this null model, we estimated cis region adjusted P values for eQTL lead variants. When multiple features per gene where tested, i.e. for transcript-ratio, exon-level, splicing-ratio and APA-ratio cis-eQTL (herein features), the FDR was controlled at a gene-level, using an additional Bonferroni correction for the number of features per gene. To control for multiple testing across genes, we employed Storey’s Q-value procedure63 to control for the genome-wide FDR.
cis-eQTL Mapping
For cis-quantitative trait loci (cis-eQTL) mapping, we considered common variants (MAF >1%) in gene-proximal regions (variants within 250 kb of the gene body). To limit technical factors of variation, only paired-end stranded European samples were used (n = 716 donors, n = 932 lines). Significant eQTL were reported at a gene-level FDR < 5%.
For all RNA traits, equivalent trait inclusion criteria were used for genetic analyses. Considered were traits that were expressed, i.e. non-zero expression, in at least 25% of the samples. For the splicing and APA-eQTL, we required at least 50% of the samples to have a non-zero and non-NA ratio. The assessed genes per eQTL type are summarized in Supplementary Table 17.
For gene-level eQTL, we additionally tested for higher order eQTL using iterative eQTL mapping. Lead eQTL variants were accounted for as covariate in subsequent mapping iterations until no additional independent cis-eQTL were identified (Extended Data Fig. 2).
Using information from GTEx, BIOS and results from previous iPSC eQTL studies, we assessed the replication and annotated the identified cis-eQTL. See Supplementary Methods for details including alternative replication strategies using MASHR.
Trans-eQTL mapping
Trans-eQTL were identified using an analogous approach as for cis-eQTL mapping, considering common variants (MAF >1%) in gene-distal regions defined as at least 2.5 Mb upstream and downstream of the gene transcription start and end sites. Given the potentially large number of tests when assessing all variant gene pairs in an exhaustive manner, we chose to limit the trans-eQTL tests to the union of cis-eQTL lead variants discovered in our study and known GWAS-implicated variants (obtained from the NHGRI-EBI GWAS catalog), yielding 115,709 variants to test for trans-eQTL. These variants were tested for association with 17,039 expressed protein coding genes (TPM ≥ 1 in at least 25% of the samples). To maximize power for the trans-eQTL discovery we used all samples from European ancestry (n = 743, lines = 1,120), and given the even larger number of tests for the other RNA-traits and the larger impact of sequencing difference we chose not to test trans-eQTL on other RNA-traits.
To reduce the possibility of spurious associations, a more conservative quantile normalization to a Gaussian distribution was employed, and we included the lead cis-eQTL variant as additional fixed effect covariate in the model. To avoid spurious associations caused by read cross-mapping64, we excluded gene combinations with high sequence similarity from the trans analysis. Briefly, we used primary and secondary mappings of the RNA-seq reads to the genome to construct such a black-list. Any secondary mapping to another gene was reason to exclude the specific gene pair for trans-eQTL mapping (n = 66,964 gene pairs, Supplementary Table 18). This cross-mapping black-list was obtained based on all paired-end stranded data only (Supplementary Table 2). Additionally, we excluded variants within the HLA region, due to its complex LD structure.
We considered the left out RNA-seq samples, single-cell RNA-seq data from the Cuomo et al.8 differentiation study and DNA methylation information on the HipSci samples to assess the replication of the discovered trans-eQTL effects. For details see Supplementary Methods.
Outlier analysis
Complementary to eQTL analyses of common variants (MAF >1%), we considered effects of rare variants linked to transcriptomic outliers. Based on featureCount gene quantifications (log TPM), we considered autosomal protein-coding and long non-coding RNA genes for outlier analysis. Cell lines from donors with predicted ancestry other than European super-population were discarded, and we additionally limited the analysis to lines with paired-end RNA-seq data. Genes were then filtered for minimal expression, defined as gene expression TPM>0 in 50% or more in each study.
To adjust for transcriptome-wide confounding sources of variation, PEER34 correction was run on the filtered data as described above (N = 50 PEER factors). The resulting residual expression profiles were scaled and centered (Z-score normalization). As additional quality control step, we tested for consistent over or under expression, i.e. cell line found to be the most under- or over-expressed cell line across hundreds of genes. Cell lines with expression abs(Z-score) >2 in more than 100 genes were discarded from subsequent analyses (N = 21 lines). Finally, cell lines were retained if WGS was available in addition to RNA-seq, leaving data from the HipSci and iPSCORE projects only. After applying these quality control steps, 17,514 genes and 425 cell lines remained for further analysis.
To prepare the WGS genotype data SNP and indel variants for the analysis, variants were filtered based on QVSR tranche 99%. The software vcfanno65 (V0.2.9) was used to annotate the WGS VCF with minor allele frequency from gnomAD66 (version r2.0.2), and CADD score from CADD67 (version 1.3). Variants were filtered on a per sample level to retain variants with at least one alternate allele. Variants were then linked to genes using the bcftools68 (V1.11) window command, selecting a maximum distance of 10 kb based on the Ensembl 75 GTF reference. A separate file was produced for each cell line consisting of the following columns: cell line ID; gene ID; chromosome; position; gnomAD MAF; CADD (phred); CADD (raw).
To facilitate comparative analysis using GTEx v7 tissues, i2QTL data were reprocessed to match the GTEx v7 pipeline to limit technical variation. For this specific analysis, RNA-SeQC (v1.1.8) expression quantification was used, and a separate PEER analysis was run to correct for technical variation, including known factors. As before, the top 50 PEER factors were selected to adjust the i2QTL data. For GTEx v7 tissues with ≤ 150 samples, 15 PEER factors were used; for tissues with ≤ 250 samples, 30 PEER factors; for tissues with >250 samples, 35 PEER factors were used. GTEx v7 WGS variants were annotated with MAF from gnomAD (version r2.0.2) and CADD scores from CADD (version 1.3) using vcfanno. GTEx v7 tissue samples with expression abs(Z) >2 in more than 100 genes were discard. GTEx tissues were considered only if there at least 50 samples were available (N tissues = 35). Residuals expression profiles from PEER adjustment were centered and scaled to generate expression Z-scores.
Outlier enrichment
We considered the subset of lines with both RNA-seq and WGS available (N = 425 cell lines after filtering, Supplementary Table 2), and focused on variants up to 10 kb upstream and downstream protein-coding and long non-coding RNA genes. Gene expression outliers for a given gene were defined as samples with a minimum gene expression Z-score (Z-score < −2, under-expression outlier) or a maximum gene expression Z-score (Z-score > 2, over-expression outlier). Separate scores were computed for gene-level under-expression outliers and over-expression outliers. The reported enrichment score were calculated as the ratio of the proportion of outlier lines with variants across several MAF/CADD bins compared to non-outlier lines. Specifically, enrichment here refers to the relative risk:
where OV denotes the number of outlier lines with ≥1 variant in or near (± 10 kb upstream or downstream of gene body) a gene passing given MAF and CADD thresholds, O is the total number of outlier lines, O′V is the number of non-outlier lines with ≥1 variant in/near gene passing given MAF and CADD thresholds, and O′ is the number of non-outlier lines. The relative risk is reported with 95% Wald confidence intervals derived from the asymptotic distribution of the log relative risk:
The bounds on the confidence interval are defined as follows:
The analysis was performed separately for SNP, indel as well as SV variants, and across different MAF bins (from common to rare) and CADD bins (progressively more deleterious variants). Expression outlier direction (i.e. under-expression, over-expression) was tested separately. For example, for under-expression outliers, an outlier line was defined as the least-expressed line in a given gene that also has a Z-score < −2. Consequently, a gene is defined to have at most one outlier line per outlier direction. Non-outliers were defined as lines with a Z-score between −1 and 1 for a given gene. Genes were discarded if there was not at least one outlier and one non-outlier line matching MAF and CADD thresholds. The outlier analysis was performed for i2QTL and GTEx data.
Colocalization of GWAS loci with iPSC eQTL
For colocalization analyses, we considered two sets of curated GWAS summary stats: i) UK Biobank (UKBB) rapid GWAS results (N = 1,740 traits)69, and ii) publicly available GWAS results obtained from the NHGRI-EBI GWAS catalog30 and PHENOMESCANNER V242 (N = 350 studies), obtained through a wide variety of studies and consortia43. For each trait and study, we iteratively selected loci with a GWAS P value of < 5 × 10⁻⁸ and located at least 1 Mb away from previously selected (more significant) loci for the same trait and study. Among these GWAS loci, we selected those with at least one significant cis-eQTL, for any the quantified RNA traits, within 10 kb of the lead GWAS variant at FDR < 5%. Owing to the vast number of SNPs and traits in the UKBB, we only tested UKBB GWAS hits for colocalization if the lead GWAS hit overlapped with a known eQTL, for computational feasibility. Given the presence of several different types of eQTL and abundant measured features for each of these eQTL types, it was possible for a single GWAS locus to be tested for colocalization with a number of eQTL traits originating from single or multiple genes.
We then tested each pair of GWAS locus and eQTL feature in our set. For each locus pair, we considered variants that were contained in both the GWAS and eQTL summary statistics. Loci with less than 5 common SNPs were discarded. We additionally discarded loci for which the minimal GWAS P value for the intersecting variants was greater than 5 × 10⁻⁶ and loci for which the adjusted eQTL P value was greater than 0.05.
LD between SNP pairs was estimated based on 1000 Genomes phase 3 (2,504 individuals) data55. We then applied FINEMAP40 separately to the GWAS and eQTL summary data to estimate posterior probabilities of causality for each SNP, and we combined these probabilities to compute a colocalization posterior probability (CLPP) following the approach outlined in eCAVIAR40,41,43.
We note that there is a relationship between the LocusCompare CLPP scores and the number of intersecting variants that are observed at a locus. To improve the comparability of colocalization events from different studies, we employed an adaptive threshold, which accounts for the observed differences in the number of overlapping variants. Specifically, we considered a locus to be colocalized if it passed one of three CLPP and #SNP thresholds; 1) 5 or more variants at a locus: CLPP of 0.5; 2) 10 or more variants at the locus: CLPP of 0.1; 25 or more variants at a locus: CLPP of 0.01. Further details and a discussion on the relation between CLPP and number of SNPs can be found in Hormozdiari et al. (2016)41.
To compare colocalization results between GTEx tissues and i2QTL, we obtained colocalization results from LocusCompare and applied the same filtering strategies to select high-confidence colocalizations. Overlap of colocalization events between GTEx tissues and i2QTL were assessed based on the level of study, trait and eGene pairs.
To link trans-eQTL to GWAS loci we performed an extended trans-eQTL mapping linking all variants within 250 kb around the identified trans-eQTL variants to the identified downstream genes. This trans-eQTL information was subsequently used to perform a colocalization analysis as detailed above for cis-eQTL. For details see Supplementary Results.
Annotating rare variants using UKBB GWAS summary statistics
To test for differences in outlier and non-outlier associated rare variants and risk for disease and traits, we overlapped i2QTL WGS variants (as described in Outlier Analysis above) with those measured or imputed in UKBB GWAS69. Specifically, we considered variants with gnomAD MAF <1% and CADD >0. Multi-allelic variants were discarded. Variants were retained if they were observed in only one i2QTL individual; for outlier-associated variants. This has the effect of isolating the set of variants putatively driving observed outlier gene expression (i.e. should the same variant be observed in both an outlier and non-outlier sample, by definition this would suggest that the variant is less likely to be causing the observed outlier expression). From this list of unique variants, outlier-associated variants were identified separately for under and over-expression outlier samples (therefore, there could be a maximum of two outlier samples per gene).
For each gene with ≥ 1 outlier sample, non-outlier-associated variants were chosen for each non-outlier sample if a variant had a CADD score within a range ± 5 of outlier variants. Non-outlier samples were defined as samples with expression absolute Z-score < 1 for a given gene. If a non-outlier sample had a larger number of variants than the outlier sample, variants were randomly downsampled to match the number of outlier variants. If a non-outlier sample had a less or equal number of variants than the outlier sample, all variants were chosen for that sample. This process was performed separately for each gene and each outlier direction (i.e. under-expression, over-expression). Integrating co-localization results, we subset to variants linked to the set of genes which showed any evidence of co-localization (CLPP score > 0). The final list of variants was then linked to UKBB GWAS effect size and P values for each trait in UKBB GWAS Phase 1. After intersecting these datasets, we obtained 10,103 outlier- and non-outlier associated variants linked to 779 genes and 2,419 traits.
Data availability
All data used in the study are available via SRA, dbGaP or ENA; the full data availability is provided in Supplementary Table 1. Supplementary Table 2 provides sample description on the samples used in the study. Full summary statistics on significant eQTL can be obtained from https://zenodo.org/record/4005576 (doi:10.5281/zenodo.4005576). The colocalization results are accessible from the LocusCompare portal (http://locuscompare.com). We used eQTL summary statistics from GTEx (v7, available at: https://gtexportal.org/home/datasets); the BIOS cohort (available at: https://genenetwork.nl/biosqtlbrowser/). We further used GWAS summary statistics from the NHGRI-EBI GWAS catalog (Ensembl V92, available at: https://www.ebi.ac.uk/gwas/); Phenome scanner v2 (available at: http://www.phenoscanner.medschl.cam.ac.uk/); and GWAS studies aggregated in the LocusCompare study. Via LocusCompare we downloaded the GTEx colocalization results. Other external data sources are referenced in Methods and the main text.
Code availability
Code produced for the analyses described in this manuscript is available on GitHub from the following URLs:
eQTL mapping: https://github.com/PMBio/hipsci_pipeline/tree/master/limix_QTL_pipeline
gene expression outlier analysis: https://github.com/csmail/i2qtl_outlier
colocalization analysis: https://github.com/mikegloudemans/ipsc-coloc.
Extended Data
Extended Data Fig. 1. Replication and consistency of effect sizes of eQTL discovered in the the original iPSC studies and replicated in i2QTL.
Shown are scatter plots between eQTL effect size estimates in this study (i2QTL, x-axis) versus effect size estimates from previous studies (y-axis). Dots correspond to eQTL discovered in the respective study. Black: eQTL with consistent effect direction. Red: eQTL with discordant effect direction. Replication defined at nominal P<0.05 in i2QTL. A. Replication of HipSci in i2QTL. 70.4% of the effects are replicated; 98% of the eQTL have concordant effect direction. Differences in the approach for estimating effect sizes result in the observed variation. B. Replication of iPSCORE in i2QTL. 81% of the effects are replicated; 98.7% of the eQTL have concordant effect direction. Notably only SNP eQTL were considered whereas SVs were not considered for replication. C. Replication of GENESiPS in i2QTL; 76.7% of the effects are replicated; 99.5% of the effects have concordant effect direction. D. Replication of PhiLiPS in i2QTL. 76.8% of the effects are replicated; 97.5% of the effects have concordant effect direction.
Extended Data Fig. 2. Identification of multiple independent eQTL for the same gene using stepwise regression.
A. Histogram of the number of independent eQTL effects identified for individual eGenes. Up to 12 independent effects were identified. B. Zoom-in view displaying the number of eGenes with 5 to 8 independent effects. C. Zoom-in view displaying the number eGenes with 8 to 12 independent effects.
Extended Data Fig. 3. Sharing of lead eQTL signals between cell types and studies, considering i2QTL, GTEX and the iPS differentiation study from Cuomo et al.
A. Pairwise sharing of lead eQTL signals in i2QTL (iPSC) and 48 GTEx tissues. Shown is the fraction of shared eQTL signals relative to the total number of common genes and lead eQTL variants in the two respective maps. Shared eQTL signals are defined as eQTL with concordant effect direction and absolute effect size within a factor of two (Methods). B. Distribution of pairwise sharing as in A of iPSCs versus GTEx tissues (blue, N=48 comparisons) versus pairwise sharing between GTEx tissues (red, N=2,401 comparisons).C. Pairwise sharing of lead eQTL signals in i2QTL (iPSC) and 48 GTEx tissues as in A, however additionally including single-cell eQTL form Cuomo et al. in iPSCs (iPSCsc), differentiated cell types (mesendo, endoderm). D. Distribution of pairwise sharing as in C, considering iPSCs and differentiated cell types (bulk left, followed by iPSC single cell), mesendoderm (cyan), and endoderm (green) versus GTex tissues (N=48 comparisons). During differentiation genetic signals in iPSC become more similar to those in GTEx tissues. Data in panels B and D are displayed as violin- and boxplot with the midpoint corresponding to the median, the lower and upper edges of the box to the first and third quartiles and the whiskers corresponding to the IQR ×1.5.
Extended Data Fig. 4. Properties of distal (trans) gene-level eQTL.
A. Dot plot of N=862 trans-eQTL detected in iPSC (FDR<10%). Dots correspond to individual trans-eQTL, with color denoting the variant category (blue: cis-eQTL, red: GWAS variant, purple: cis-eQTL and GWAS variant). </p> B. Breakdown of unique trans-eQTL variants (N=193) across different variant annotations. Darker shaded colors denote trans-eQTL linked to variants that have more than one annotation; lighter shades correspond variants that can be unique assigned to a given variant category. C. Mediation analysis of trans-eQTL, considering variants that are linked to a cis eQTL. The outer pie denotes the annotation of the underlying trans variant: GWAS only variants (n=7, white), cis eQTL variants (n=186, dark-blue). The inner pie displays results from the mediation analysis for individual trans variants: n=7 trans eQTL are exclusively linked to GWAS variants and hence not mediated (white, “GWAS only trans-eQTL”); n=58 trans eQTL variants are not significantly linked to mediation with any RNA trait (“Non-significant link to any cis-eQTL”); 86 are exclusively linked to gene-level abundance (“Only linked to gene-level cis-eQTL”), 7 are exclusively linked a RNA trait other than gene-level abundance (“Linked only to non gene-level cis-eQTL”); 35 are linked to gene-level abundance and at least one additional RNA trait(“Linked both to gene-level and other level cis-eQTL”).
Extended Data Fig. 5. Analysis of the trans-eQTL hotspot at ELF2.
A. Schematic representation of the genetic loci around ELF2 (left) and NAA15 (right). SNPs are annotated by evidence of cis-eQTL regulation on different traits (blue: transcript-ratio eQTL on ELF2, purple: gene-level eQTL on EFL2, green: splice eQTL on ELF2, brown: the APA eQTL on NAA15). B. LD structure between cis-eQTL variants implicated in the hotspot, annotated by cis-eQTL type as in A. C-F. Lead cis-eQTL effects by RNA trait for ELF2 and NAA15 across SNPs linked to downstream trans-eQTLs(n=682 samples). Data are represented as a violin- and boxplot with the midpoint corresponding to the median, the lower and upper edges of the box to the first and third quartiles, the whiskers represent the interquartile range ×1.5. C. Splicing cis-eQTL on ELF2. D. Gene level cis-eQTL on ELF2. E. Transcript-ratio cis-eQTL on ELF2. F. Alternative polyadenilation cis-eQTL on NAA15. G. Co-expression network of genes that are controlled by the trans-eQTL linked to the hotspot at ELF2 (N=37 genes), including ELF2 itself (center). Color of the bounding box around Genes denotes the cis-eQTL variant that drives the corresponding trans effect (colors as in D-G). Genes with multiple trans regulators are depicted with multiple colored rings. H. Replication of trans effects at ELF2 in a single cell differentiation study (Cuomo et al.). Shown are trans-eQTL effect sizes (beta’s) for the 12 ELF2-linked trans targets that show significant replication (defined as P<0.05 and consistent effect direction) in any of the Cuomo et al tissues. From left to right: eQTL effect size in; the i2QTL study (discovery); in undifferentiated iPSC profiled using scRNA-seq; in mesendoderm profiled using scRNA-seq and in definitive endoderm profiled using scRNA-seq. Significant replication are indicated with a red asterisk.
Extended Data Fig. 6. Enrichment for rare, deleterious SNPs in iPSC and GTEx tissues.
Comparison of enrichments for singleton, highly-deleterious (CADD > 25) SNPs in iPSC versus GTEx v7 tissues analogous to Fig. 2B, however with an additional adjustment for the number of expressed genes. Displayed are enrichments for 10,000 random draws of 50 samples, controlling for the number of expressed genes (genes subset at a fixed number across tissues, N=500 genes). Strongest enrichment is observed in iPSC. The data are represented as a boxplot where the middle line corresponds to the median, the lower and upper edges of the box corresponding to the first and third quartiles, the whiskers represent the interquartile range (IQR) ×1.5 and beyond the whiskers are outlier points.
Extended Data Fig. 7. Expression level of rare disease genes in iPSC versus GTEx tissues.
A. Distribution of gene expression level of XX rare disease genes (log10(FPKM+1)) in i2QTL iPSC and 17 GTEx tissues with a median expression level of at least 1 FPKM (red dashed line). Expression in i2QTL highlighted in teal, GTEx tissues in yellow. Disease genes are expressed in iPSCs and only difficult to biopsy tissues in GTEx display higher expression levels. n=2,952 biologically independent samples. Data are represented as boxplots with the middle line corresponding to the median, the lower and upper edges of the box to the first and third quartiles, the whiskers to the interquartile range (IQR) ×1.5. B. Expression level of genes in different curated gene lists, comparing i2QTL iPSC (left), all GTEx tissues (middle) and GTEx whole blod (right). Shown is the fraction of genes in each category for two expression bins: [0,1) FPKM expression absent or lowly expressed; [1,1e+12) FPKM gene expressed.
Extended Data Fig. 8. Additional results from the colocalization analysis of eQTL and GWAS traits.
A. Summary of colocalization results for the Coronary artery Disease GWAS (van der Harst et al 2018). 36 out of 93 GWAS loci were identified as colocalized with an eQTL of at least one RNA trait (38.7%). Shown are the number of colocalization events for eQTL of different RNA traits. From left to right: any eQTL type (All), gene-level eQTL (Gene), exon eQTL (Exon), transcript eQTL (Transcript), splicing eQTL (Splicing), APA eQTL (APA). The number of GWAS colocalization that are uniquely linked to a given RNA trait eQTL are displayed using a triangle and the total number of colocalizations per trait is depicted as a circle. B. Colocalization between a gene-level eQTL for POLR1B and a GWAS hit (rs7586668:C>T) for Height. Left: Manhatten plots displaying the local association signal for the eQTL on POLR1B (bottom) and the GWAS signal on Height (top). Right: Scatter plot of negative log P-values for the GWAS signal (x-axis) for BMI versus the POLR1B eQTL signal (y-axis) for the corresponding region.
Extended Data Fig. 9. Enrichment for large-effect outlier-associated rare variants in colocalized genes.
Absolute effect size of GWAS trait associations for iPSC outlier- and non-outlier-associated variants, considering genes with varying degree of evidence for colocalization with common eQTL variants.
Extended Data Fig. 10. Optimization of the number of PEER factors to adjust for confounding expression heterogeneity.
Shown is the number of genes with at least one gene-level eQTL (eGenes) for the top 3,000 highest expressed genes in iPSC for increasing number of PEER factors. PEER factors are adjusted for as additional fixed effect covariates. The vertical red line denotes the number of PEER factors considered in all i2QTL analyses.
Supplementary Material
Acknowledgements
The authors would like to thank the HipSci, iPSCORE, GENSIPS and PhLiPS cohorts for their input into the study and (early) access to the data. This work was supported by: a strategic award from the Wellcome Trust and UK Medical Research Council (WT098503), the EMBL Interdisciplinary Postdoc (EI3POD) program under Marie Skłodowska-Curie Actions COFUND (grant number 664726) (to M.J.B. & D.S.); National Institutes of Health (T32 LM012409 to C.S.; T15 LM01127 to D.J.; U01 HL107388-01, P30DK116074, SPO 130829 to I.C.-O.; HL107442, DK105541, DK112155 to K.A.F.); Stanford Graduate Fellowship (to M.J.G.); National Natural Science Foundation of China (31970554 to X.L.); National Key R&D Program of China (2019YFC1315804 to X.L.); Shanghai Municipal Science and Technology Major Project (2017SHZDZX01 to X.L.); EBI–Sanger Postdoctoral Fellowship (to N.C.); National Science Foundation Graduate Research Fellowship (to N.M.F.); California Institute for Regenerative Medicine (GC1R-06673 to K.A.F.). Research in the Stegle laboratory is supported by the BMBF, the Volkswagen Foundation and the EU (ERC project DECODE). S.B.M. is supported by NIH grants U01HG009431, R01HL142015, R01HG008150, R01AG066490 and U01HG009080. Research in the Knowles laboratory is supported by NIH grants DK116750, DK120565, DK106236, DK107437,HL107388. We thank the staff in the Cellular Genetics and Phenotyping and Sequencing core facilities at the Wellcome Trust Sanger Institute. Work at the Wellcome Trust Sanger Institute was further supported by Wellcome Trust grant WT090851. Several datasets used in this study were sourced from the NextGen Consortium, available from NCBI dbGaP: iPSCORE (phs000924.v4.p1; phs001325.v3.p1); PhLiPS (phs001341.v1.p1); GENESiPS (phs001139.v1.p1). This work in-part used supercomputing resources provided by the Stanford Genetics Bioinformatics Service Center, supported by National Institutes of Health S10 Instrumentation Grant S10OD023452. Research reported in this manuscript was in part supported by the NIH Common Fund, through the Office of Strategic Coordination/Office of the NIH Director under Award Number U01HG007708. The content is solely the responsibility of the authors and does not necessarily represent the official views of the National Institutes of Health.
Footnotes
Conflicts of interest
S.B.M. is on SAB of Myome Inc.
References
- 1.Westra H-J et al. Systematic identification of trans eQTLs as putative drivers of known disease associations. Nat. Genet. 45, 1238–1243 (2013). [DOI] [PMC free article] [PubMed] [Google Scholar]
- 2.Bonder MJ et al. Disease variants alter transcription factor levels and methylation of their binding sites. Nat. Genet. 49, 131–138 (2017). [DOI] [PubMed] [Google Scholar]
- 3.Zhernakova DV et al. Identification of context-dependent expression quantitative trait loci in whole blood. Nat. Genet. 49, 139–145 (2017). [DOI] [PubMed] [Google Scholar]
- 4.Consortium G & GTEx Consortium. Genetic effects on gene expression across human tissues. Nature vol. 550 204–213 (2017). [DOI] [PMC free article] [PubMed] [Google Scholar]
- 5.Lappalainen T et al. Transcriptome and genome sequencing uncovers functional variation in humans. Nature 501, 506–511 (2013). [DOI] [PMC free article] [PubMed] [Google Scholar]
- 6.Alasoo K et al. Shared genetic effects on chromatin and gene expression indicate a role for enhancer priming in immune response. Nat. Genet. 50, 424–431 (2018). [DOI] [PMC free article] [PubMed] [Google Scholar]
- 7.Schwartzentruber J et al. Molecular and functional variation in iPSC-derived sensory neurons. Nat. Genet. 50, 54–61 (2018). [DOI] [PMC free article] [PubMed] [Google Scholar]
- 8.Cuomo ASE et al. Single-cell RNA-sequencing of differentiating iPS cells reveals dynamic genetic effects on gene expression. Nat. Commun. 11, 810 (2020). [DOI] [PMC free article] [PubMed] [Google Scholar]
- 9.Jerber J et al. Population-scale single-cell RNA-seq profiling across dopaminergic neuron differentiation. Nat. Genet. (2021). [NG-A54575R1; accepted] [DOI] [PMC free article] [PubMed] [Google Scholar]
- 10.Sun N et al. Patient-specific induced pluripotent stem cells as a model for familial dilated cardiomyopathy. Sci. Transl. Med. 4, 130ra47 (2012). [DOI] [PMC free article] [PubMed] [Google Scholar]
- 11.Lan F et al. Abnormal calcium handling properties underlie familial hypertrophic cardiomyopathy pathology in patient-specific induced pluripotent stem cells. Cell Stem Cell 12, 101–113 (2013). [DOI] [PMC free article] [PubMed] [Google Scholar]
- 12.Lee J et al. Activation of PDGF pathway links LMNA mutation to dilated cardiomyopathy. Nature 572, 335–340 (2019). [DOI] [PMC free article] [PubMed] [Google Scholar]
- 13.Kodo K et al. iPSC-derived cardiomyocytes reveal abnormal TGF-β signalling in left ventricular non-compaction cardiomyopathy. Nat. Cell Biol. 18, 1031–1042 (2016). [DOI] [PMC free article] [PubMed] [Google Scholar]
- 14.Wu H et al. Modelling diastolic dysfunction in induced pluripotent stem cell-derived cardiomyocytes from hypertrophic cardiomyopathy patients. Eur. Heart J. 40, 3685–3695 (2019). [DOI] [PMC free article] [PubMed] [Google Scholar]
- 15.Dubois NC et al. SIRPA is a specific cell-surface marker for isolating cardiomyocytes derived from human pluripotent stem cells. Nat. Biotechnol. 29, 1011–1018 (2011). [DOI] [PMC free article] [PubMed] [Google Scholar]
- 16.Sterneckert JL, Reinhardt P & Schöler HR Investigating human disease using stem cell models. Nature Reviews Genetics vol. 15 625–639 (2014). [DOI] [PubMed] [Google Scholar]
- 17.Kilpinen H et al. Common genetic variation drives molecular heterogeneity in human iPSCs. Nature 546, 370–375 (2017). [DOI] [PMC free article] [PubMed] [Google Scholar]
- 18.Panopoulos AD et al. iPSCORE: A Resource of 222 iPSC Lines Enabling Functional Characterization of Genetic Variation across a Variety of Cell Types. Stem Cell Reports 8, 1086–1100 (2017). [DOI] [PMC free article] [PubMed] [Google Scholar]
- 19.Pashos EE et al. Large, Diverse Population Cohorts of hiPSCs and Derived Hepatocyte-like Cells Reveal Functional Genetic Variation at Blood Lipid-Associated Loci. Cell Stem Cell 20, 558–570.e10 (2017). [DOI] [PMC free article] [PubMed] [Google Scholar]
- 20.Banovich NE et al. Impact of regulatory variation across human iPSCs and differentiated cells. Genome Res. 28, 122–131 (2018). [DOI] [PMC free article] [PubMed] [Google Scholar]
- 21.Carcamo-Orive I et al. Analysis of Transcriptional Variability in a Large Human iPSC Library Reveals Genetic and Non-genetic Determinants of Heterogeneity. Cell Stem Cell 20, 518–532.e9 (2017). [DOI] [PMC free article] [PubMed] [Google Scholar]
- 22.Frésard L et al. Identification of rare-disease genes using blood transcriptome sequencing and large control cohorts. Nat. Med. 25, 911–919 (2019). [DOI] [PMC free article] [PubMed] [Google Scholar]
- 23.Li X et al. The impact of rare variation on gene expression across tissues. Nature 550, 239–243 (2017). [DOI] [PMC free article] [PubMed] [Google Scholar]
- 24.Choi J et al. A comparison of genetically matched cell lines reveals the equivalence of human iPSCs and ESCs. Nat. Biotechnol. 33, 1173–1181 (2015). [DOI] [PMC free article] [PubMed] [Google Scholar]
- 25.Thomas SM et al. Reprogramming LCLs to iPSCs Results in Recovery of Donor-Specific Gene Expression Signature. PLoS Genet. 11, e1005216 (2015). [DOI] [PMC free article] [PubMed] [Google Scholar]
- 26.Donovan MKR, D’Antonio-Chronowska A, D’Antonio M & Frazer KA Cellular deconvolution of GTEx tissues powers eQTL studies to discover thousands of novel disease and cell-type associated regulatory variants. Nat. Commun. 11, 955 (2020). [DOI] [PMC free article] [PubMed] [Google Scholar]
- 27.Forbes SA et al. COSMIC: mining complete cancer genomes in the Catalogue of Somatic Mutations in Cancer. Nucleic Acids Res. 39, D945–D950 (2010). [DOI] [PMC free article] [PubMed] [Google Scholar]
- 28.Gerrard DT et al. An integrative transcriptomic atlas of organogenesis in human embryos. Elife 5, (2016). [DOI] [PMC free article] [PubMed] [Google Scholar]
- 29.Urbut SM, Wang G, Carbonetto P & Stephens M Flexible statistical methods for estimating and testing effects in genomic studies with multiple conditions. Nature Genetics vol. 51 187–195 (2019). [DOI] [PMC free article] [PubMed] [Google Scholar]
- 30.Buniello A et al. The NHGRI-EBI GWAS Catalog of published genome-wide association studies, targeted arrays and summary statistics 2019. Nucleic Acids Res. 47, D1005–D1012 (2019). [DOI] [PMC free article] [PubMed] [Google Scholar]
- 31.Jakubosky D et al. Discovery and Quality Analysis of a Comprehensive Set of Structural Variants and Short Tandem Repeats. Nat. Commun. 11, 2928 (2020). [DOI] [PMC free article] [PubMed] [Google Scholar]
- 32.Zhao J et al. A Burden of Rare Variants Associated with Extremes of Gene Expression in Human Peripheral Blood. Am. J. Hum. Genet. 98, 299–309 (2016). [DOI] [PMC free article] [PubMed] [Google Scholar]
- 33.Li X et al. Transcriptome sequencing of a large human family identifies the impact of rare noncoding variants. Am. J. Hum. Genet. 95, 245–256 (2014). [DOI] [PMC free article] [PubMed] [Google Scholar]
- 34.Stegle O, Parts L, Piipari M, Winn J & Durbin R Using probabilistic estimation of expression residuals (PEER) to obtain increased power and interpretability of gene expression analyses. Nat. Protoc. 7, 500–507 (2012). [DOI] [PMC free article] [PubMed] [Google Scholar]
- 35.Ferraro NM et al. Transcriptomic signatures across human tissues identify functional rare genetic variation. Science 369(6509)(2020). [DOI] [PMC free article] [PubMed] [Google Scholar]
- 36.Cummings BB et al. Improving genetic diagnosis in Mendelian disease with transcriptome sequencing. Sci. Transl. Med. 9, (2017). [DOI] [PMC free article] [PubMed] [Google Scholar]
- 37.Kremer LS et al. Genetic diagnosis of Mendelian disorders via RNA sequencing. Nat. Commun. 8, 15824 (2017). [DOI] [PMC free article] [PubMed] [Google Scholar]
- 38.Kernohan KD et al. Whole-transcriptome sequencing in blood provides a diagnosis of spinal muscular atrophy with progressive myoclonic epilepsy. Human Mutation vol. 38 611–614 (2017). [DOI] [PMC free article] [PubMed] [Google Scholar]
- 39.McKusick VA Mendelian Inheritance in Man: A Catalog of Human Genes and Genetic Disorders. (JHU Press, 1998). [Google Scholar]
- 40.Benner C et al. FINEMAP: efficient variable selection using summary data from genome-wide association studies. Bioinformatics 32, 1493–1501 (2016). [DOI] [PMC free article] [PubMed] [Google Scholar]
- 41.Hormozdiari F et al. Colocalization of GWAS and eQTL Signals Detects Target Genes. Am. J. Hum. Genet. 99, 1245–1260 (2016). [DOI] [PMC free article] [PubMed] [Google Scholar]
- 42.Kamat MA et al. PhenoScanner V2: an expanded tool for searching human genotype-phenotype associations. Bioinformatics (2019) doi: 10.1093/bioinformatics/btz469. [DOI] [PMC free article] [PubMed] [Google Scholar]
- 43.Liu B, Gloudemans MJ, Rao AS, Ingelsson E & Montgomery SB Abundant associations with gene expression complicate GWAS follow-up. Nat. Genet. 51, 768–769 (2019). [DOI] [PMC free article] [PubMed] [Google Scholar]
- 44.van der Harst P & Verweij N Identification of 64 Novel Genetic Loci Provides an Expanded View on the Genetic Architecture of Coronary Artery Disease. Circ. Res. 122, 433–443 (2018). [DOI] [PMC free article] [PubMed] [Google Scholar]
- 45.Liu JZ et al. Dense fine-mapping study identifies new susceptibility loci for primary biliary cirrhosis. Nat. Genet. 44, 1137–1141 (2012). [DOI] [PMC free article] [PubMed] [Google Scholar]
- 46.Teslovich TM et al. Biological, clinical and population relevance of 95 loci for blood lipids. Nature 466, 707–713 (2010). [DOI] [PMC free article] [PubMed] [Google Scholar]
- 47.Pongor L et al. A genome-wide approach to link genotype to clinical outcome by utilizing next generation sequencing and gene chip data of 6,697 breast cancer patients. Genome Med. 7, 104 (2015). [DOI] [PMC free article] [PubMed] [Google Scholar]
- 48.Yengo L et al. Meta-analysis of genome-wide association studies for height and body mass index in ∼700000 individuals of European ancestry. Hum. Mol. Genet. 27, 3641–3649 (2018). [DOI] [PMC free article] [PubMed] [Google Scholar]
- 49.Sanchez E et al. POLR1B and neural crest cell anomalies in Treacher Collins syndrome type 4. Genet. Med. 22, 547–556 (2020). [DOI] [PMC free article] [PubMed] [Google Scholar]
- 50.Howson JMM et al. Fifteen new risk loci for coronary artery disease highlight arterial-wall-specific mechanisms. Nat. Genet. 49, 1113–1119 (2017). [DOI] [PMC free article] [PubMed] [Google Scholar]
- 51.Pankratz N et al. Meta-analysis of Parkinson’s disease: identification of a novel locus, RIT2. Ann. Neurol. 71, 370–384 (2012). [DOI] [PMC free article] [PubMed] [Google Scholar]
- 52.Lambert JC et al. Meta-analysis of 74,046 individuals identifies 11 new susceptibility loci for Alzheimer’s disease. Nat. Genet. 45, 1452–1458 (2013). [DOI] [PMC free article] [PubMed] [Google Scholar]
- 53.Scott RA et al. An Expanded Genome-Wide Association Study of Type 2 Diabetes in Europeans. Diabetes 66, 2888–2902 (2017). [DOI] [PMC free article] [PubMed] [Google Scholar]
- 54.Webb GJ, Siminovitch KA & Hirschfield GM The immunogenetics of primary biliary cirrhosis: A comprehensive review. J. Autoimmun. 64, 42–52 (2015). [DOI] [PMC free article] [PubMed] [Google Scholar]
- 55.1000 Genomes Project Consortium et al. A global reference for human genetic variation. Nature 526, 68–74 (2015). [DOI] [PMC free article] [PubMed] [Google Scholar]
- 56.Streeter I et al. The human-induced pluripotent stem cell initiative-data resources for cellular genetics. Nucleic Acids Res. 45, D691–D697 (2017). [DOI] [PMC free article] [PubMed] [Google Scholar]
- 57.D’Antonio M et al. Insights into the Mutational Burden of Human Induced Pluripotent Stem Cells from an Integrative Multi-Omics Approach. Cell Rep. 24, 883–894 (2018). [DOI] [PMC free article] [PubMed] [Google Scholar]
- 58.DeBoever C et al. Large-Scale Profiling Reveals the Influence of Genetic Variation on Gene Expression in Human Induced Pluripotent Stem Cells. Cell Stem Cell 20, 533–546.e7 (2017). [DOI] [PMC free article] [PubMed] [Google Scholar]
- 59.Knowles JW, Hao K, Xie W, Weedon MN & Zhang Z Genetic and Functional Analyses Identify NAT2 as a Human Insulin Sensitivity Gene. (2013). [Google Scholar]
- 60.Casale FP, Rakitsch B, Lippert C & Stegle O Efficient set tests for the genetic analysis of correlated traits. Nat. Methods 12, 755–758 (2015). [DOI] [PubMed] [Google Scholar]
- 61.Purcell S et al. PLINK: A Tool Set for Whole-Genome Association and Population-Based Linkage Analyses. Am. J. Hum. Genet. 81, 559–575 (2007). [DOI] [PMC free article] [PubMed] [Google Scholar]
- 62.Ongen H, Buil A, Brown AA, Dermitzakis ET & Delaneau O Fast and efficient QTL mapper for thousands of molecular phenotypes. Bioinformatics 32, 1479–1485 (2016). [DOI] [PMC free article] [PubMed] [Google Scholar]
- 63.Storey JD & Tibshirani R Statistical significance for genomewide studies. Proceedings of the National Academy of Sciences 100, 9440–9445 (2003). [DOI] [PMC free article] [PubMed] [Google Scholar]
- 64.Saha A & Battle A False positives in trans-eQTL and co-expression analyses arising from RNA-sequencing alignment errors. F1000Res. 7, 1860 (2018). [DOI] [PMC free article] [PubMed] [Google Scholar]
- 65.Pedersen BS, Layer RM & Quinlan AR Vcfanno: fast, flexible annotation of genetic variants. Genome Biol. 17, 118 (2016). [DOI] [PMC free article] [PubMed] [Google Scholar]
- 66.Hall CL et al. Frequency of genetic variants associated with arrhythmogenic right ventricular cardiomyopathy in the genome aggregation database. Eur. J. Hum. Genet. 26, 1312–1318 (2018). [DOI] [PMC free article] [PubMed] [Google Scholar]
- 67.Rentzsch P, Witten D, Cooper GM, Shendure J & Kircher M CADD: predicting the deleteriousness of variants throughout the human genome. Nucleic Acids Res. 47, D886–D894 (2019). [DOI] [PMC free article] [PubMed] [Google Scholar]
- 68.Li H et al. Genome Project Data Processing Subgroup. 2009. The Sequence alignment/map (SAM) format and SAMtools. Bioinformatics 1000, 2078–2079. [DOI] [PMC free article] [PubMed] [Google Scholar]
- 69.Churchhouse C Rapid GWAS of thousands of phenotypes for 337,000 samples in the UK Biobank — Neale lab. Neale lab http://www.nealelab.is/blog/2017/7/19/rapid-gwas-of-thousands-of-phenotypes-for-337000-samples-in-the-uk-biobank (2017).
Associated Data
This section collects any data citations, data availability statements, or supplementary materials included in this article.
Supplementary Materials
Data Availability Statement
All data used in the study are available via SRA, dbGaP or ENA; the full data availability is provided in Supplementary Table 1. Supplementary Table 2 provides sample description on the samples used in the study. Full summary statistics on significant eQTL can be obtained from https://zenodo.org/record/4005576 (doi:10.5281/zenodo.4005576). The colocalization results are accessible from the LocusCompare portal (http://locuscompare.com). We used eQTL summary statistics from GTEx (v7, available at: https://gtexportal.org/home/datasets); the BIOS cohort (available at: https://genenetwork.nl/biosqtlbrowser/). We further used GWAS summary statistics from the NHGRI-EBI GWAS catalog (Ensembl V92, available at: https://www.ebi.ac.uk/gwas/); Phenome scanner v2 (available at: http://www.phenoscanner.medschl.cam.ac.uk/); and GWAS studies aggregated in the LocusCompare study. Via LocusCompare we downloaded the GTEx colocalization results. Other external data sources are referenced in Methods and the main text.


