

ABSTRACT
Background
Greater consumption of red meat has been associated with a higher risk of type 2 diabetes mellitus (T2DM). A decreased intake of red meat and simultaneous increased intake of other high-protein foods may be associated with a lower risk of T2DM. These analyses of specific food replacements for red meat may provide more accurate dietary advice.
Objective
We examined the association between a decrease in intake of red meat accompanied by an increase in other major dietary protein sources and risk of T2DM.
Methods
We prospectively followed 27,634 males in the Health Professionals Follow-up Study, 46,023 females in the Nurses’ Health Study, and 75,196 females in the Nurses’ Health Study II. Diet was assessed by a validated FFQ and updated every 4 y. Cox proportional hazards models adjusted for T2DM risk factors were used to model the food replacements. We calculated HRs and 95% CIs for the T2DM risk associated with replacements of 1 daily serving of red meat with another protein source.
Results
During 2,113,245 person-years of follow-up, we identified 8763 incident T2DM cases from 1990 to 2013. In the pooled analyses, a decrease in total red meat intake during a 4-y period replaced with another common protein food was associated with a lower risk of T2DM in the subsequent 4-y period. The HR (95% CI) per 1 serving/d was 0.82 (0.75, 0.90) for poultry, 0.87 (0.77, 0.98) for seafood, 0.82 (0.78, 0.86) for low-fat dairy, 0.82 (0.77, 0.86) for high-fat dairy, 0.90 (0.81, 0.99) for eggs, 0.89 (0.82, 0.98) for legumes, and 0.83 (0.78, 0.89) for nuts. The associations were present for both unprocessed and processed red meat, although stronger for the replacement of processed red meat.
Conclusions
Replacing red meat consumption with other protein sources was associated with a lower risk of T2DM.
Keywords: type 2 diabetes mellitus, red meat, protein replacement, diet change, food substitution, follow-up study, cohort study
See corresponding editorial on page 497.
Introduction
Type 2 diabetes mellitus (T2DM) is an increasing public health concern, and diet is an important modifiable risk factor (1). A review summarizing the evidence from meta-analyses of randomized, controlled trials found a lower risk of T2DM or improved glycemic markers among individuals who participate in diet and lifestyle interventions (2). The studies demonstrated both short- and long-term effects of diet and lifestyle changes on the prevention of T2DM.
In prospective cohort studies, high habitual red and processed meat consumption has been associated with a higher risk of T2DM even though diet was typically assessed only once (3, 4). In the 3 US cohorts in the present analysis: the Health Professionals Follow-up Study (HPFS), Nurses’ Health Study (NHS), and Nurses’ Health Study II (NHS II), information on dietary intake has been collected every 4 y during follow-up. Previously, Pan et al. (5) reported that an increased intake of total, unprocessed, and processed red meat was associated with a higher risk of subsequent T2DM in these cohorts. In the USA and in many other countries, the current dietary guidelines are mostly food based and recommend reducing or limiting the intake of red and processed meats (6, 7). In dietary practice, reduced intake of red meat is often accompanied by increased consumption of other protein foods, and the choice of replacement foods may vary between individuals and populations. However, the association between change in red meat consumption and T2DM depends on these replacement foods, as these may be neutral, beneficial, or harmful in relation to the development of T2DM. Pan et al. (8) previously found that the replacement of red meat with other protein foods including poultry and fish was associated with a lower risk of T2DM. In nutritional epidemiology, total energy intake is often included in the statistical models to control for confounding (9), and this creates an unspecified substitution with other energy-providing foods. Substitution models that specify the replacement food have a more straightforward interpretation than models including only 1 food item of interest. Poultry and fish are common alternatives to red meat, but other major dietary protein sources like dairy products, eggs, legumes, and nuts can also be used to replace red meat.
The previous work by Pan and colleagues did not take into account that changes in red meat intake are mostly followed by changes in intake of other foods. We conducted a follow-up study to examine whether a decrease in intake of red meat over a 4-y period and a simultaneous increase in other specified major dietary protein sources, i.e., replacement of red meat with alternative protein sources, was associated with the incidence of T2DM in the subsequent 4-y period. We hypothesized that replacing red meat with poultry, seafood, dairy products, eggs, legumes, or nuts is associated with a lower risk of T2DM. As processed red meat has been more consistently associated with a lower risk of T2DM than unprocessed red meat (4), we also examined unprocessed and processed red meat separately.
Methods
Study design and population
This study included 3 prospective cohorts of US females and males. The HPFS is a cohort of 51,529 male health professionals from 50 states aged 40–75 y at enrollment in 1986 (10), the NHS is a cohort of 121,700 female nurses from 11 states aged 30–55 y at enrollment in 1976 (11), and the NHS II is a cohort of 116,429 younger female nurses from 14 states aged 25–42 y at enrollment in 1989 (12).
For the present analyses, we used 1986 as baseline for the HPFS and NHS, and 1991 for the NHS II cohorts, because this is the period when the dietary questionnaires became most similar across cohorts and over time. Because the diet change in one 4-y period was used to assess the risk of T2DM in the following 4-y period, we excluded participants with a history of diabetes mellitus (type 1 diabetes mellitus, T2DM, and gestational diabetes mellitus), cardiovascular disease, or cancer within that 4-y baseline period (1986–1990 for the HPFS and NHS, and 1991–1995 for the NHS II). Furthermore, we excluded participants who reported implausible energy intake (<500 or >3500 kcal/d for women and <800 or >4200 kcal/d for men) and those who left >70 items blank on the first 2 FFQs in 1986 and 1990 for HPFS and NHS, and in 1991 and 1995 for NHS II. Participants with missing exposure information and those with missing information on the covariates total energy intake, alcohol intake, physical activity, BMI, and components of the healthy eating index (described in detail below) in the first FFQ were also excluded. Furthermore, females who were or became pregnant during follow-up were excluded from the analysis for that 4-y period and from the previous 4-y period for diet change and the following 4-y period for T2DM follow-up, but afterwards were reincluded in the analyses.
The study protocol was approved by the Institutional Review Boards of the Brigham and Women's Hospital and by the Harvard T.H. Chan School of Public Health; completion of the self-administered questionnaire was considered to imply informed consent.
Dietary assessment
The dietary information was collected by use of a validated, semiquantitative FFQ at baseline and updated every 4 y. The reproducibility and validity of the FFQs have been documented elsewhere (13–17). For the HPFS, the correlation coefficients between the FFQ and 2 dietary records ranged from 0.48 to 0.74 for the protein food groups of animal origin and 0.30 to 0.45 for the protein food groups of vegetable origin investigated in the present study (17). Similar correlation coefficients were observed in the NHS (14). The participants were asked to report their average intake of foods in standard portion sizes specific for each food item in 9 response categories ranging from “never” to “6 or more times per day.”
The exposure in this study was change in red meat intake and simultaneous change in another, specified protein source in daily servings over each 4-y period. We modeled the associations of a decrease in intake of red meat replaced by an increase in other major dietary protein sources with subsequent risk of T2DM. The protein sources were total red meat, including unprocessed and processed red meat, poultry, seafood, low-fat dairy products, high-fat dairy products, eggs, legumes, and nuts. Unprocessed red meat included beef, pork, or lamb as a main dish (e.g., steak and roast), beef, pork, or lamb as a sandwich or a mixed dish (e.g., stew, lasagna, and hamburger). Processed red meat included bacon, hot dogs, sausages, salami, and other processed red meat items. Poultry included chicken and turkey with and without skin and chicken and turkey sandwiches. No processed poultry items were included in the poultry variable. Seafood included dark-meat fish (e.g., salmon, mackerel, and swordfish), other fish (e.g., cod and haddock), canned tuna, and shellfish as a main dish (including shrimp, lobster, and scallops). No processed fish items were included in the seafood variable. Low-fat dairy included low-fat milk (≤2%), flavored and unflavored yogurt, low-fat cheese, and sherbet. High-fat dairy included whole milk, cream, sour cream, butter, high-fat cheese, and ice cream. Eggs included whole eggs, n–3 (ω-3) fortified eggs, egg whites, and egg beaters. Legumes included peas, beans, lentils, string beans, and tofu. Nuts included peanuts, peanut butter, walnuts, and other unspecified nuts. All food groups were categorized as servings/d. In addition to substitutions of total red meat with other protein foods, we investigated substitutions of unprocessed and processed red meat separately.
Covariates
Study participants provided information about anthropometry, lifestyle habits, socioeconomic factors, and health status on biennial questionnaires, including body weight, height, physical activity, cigarette smoking, history of hypertension and hypercholesterolemia, race, marital status, and family history of T2DM. Females additionally provided information on menopausal status and use of postmenopausal hormones. Information on total energy intake and alcohol consumption was obtained from the FFQ. The accuracy of self-reported cardiometabolic risk factors and disease has previously been validated among females in the NHS (18) and diagnosis of hypertension has been validated among men in the HPFS (19). To assess overall diet quality, we calculated a modified diet score based on the 2010 Alternative Healthy Eating Index (AHEI) (20). The AHEI includes 11 food groups and nutrients associated with chronic disease risk, like diabetes and cardiovascular disease. Intake of each food or nutrient item in the AHEI gives a score between 0 and 10, and a higher total score has been associated with a lower risk of chronic disease. We modified the AHEI to exclude alcohol and foods already included separately in our models (e.g., red meat) and nutrients constituting a major part of these foods. Our modified AHEI included intakes of the following food groups and nutrients (including the criteria for minimum/maximum scores): vegetables (excluding legumes, 0/≥5 servings/d), fruits (0/≥4 servings/d), whole grains (women: 0/75 g/d, men: 0/90 g/d), sugar-sweetened beverages (≥1/0 servings/d), trans-fatty acids (≥4/≤0.5% of energy), PUFAs (≤2/≥10% of energy), and sodium (highest/lowest decile, mg/d).
Follow-up and case ascertainment
Incident T2DM cases were identified by self-report on the main questionnaires every 2 y and confirmed by validated supplementary questionnaires regarding symptoms, diagnostic tests, and treatment. For all cohorts, a T2DM diagnosis was confirmed if the participant met ≥1 of the following criteria according to the National Diabetes Data Group (21): 1) 1 or more of the classic symptoms (excessive thirst, polyuria, weight loss, or hunger) plus fasting blood glucose concentrations ≥140 mg/dL, random blood glucose concentrations ≥200 mg/dL, or 2-h blood glucose concentrations ≥200 mg/dL during oral glucose tolerance testing; 2) elevated blood glucose concentrations ≥2 times on different occasions (fasting blood glucose ≥140 mg/dL, random blood glucose ≥200 mg/dL, and/or blood glucose concentrations ≥200 mg/dL 2 h or more after oral blood glucose testing) in the absence of symptoms; or 3) treatment with hypoglycemic medication (insulin or antidiabetic medication). In June 1998, the fasting blood glucose threshold was lowered to 126 mg/dL, according to the American Diabetes Association (22). The validity of the supplemental questionnaires for diagnosis of diabetes mellitus has been documented elsewhere (23, 24): in the initial pilot study among 62 self-reported cases in the NHS and 59 self-reported cases in the HPFS that were confirmed by the supplemental questionnaire, 61 (98%) and 57 (97%) cases, respectively, were reconfirmed after review of the medical records.
We included only incident cases confirmed by the supplemental questionnaires. In total, 8763 incident cases of T2DM were identified and validated in the 3 cohorts combined. Deaths were identified from the National Death Index or reported by next of kin or the US postal system, combined being 98% complete in identifying deaths among participants (25).
Statistical methods
We used Cox proportional hazards regression to calculate HRs and 95% CIs for the association between decreased intake of red meat and simultaneous increased intake of another specified protein source in one 4-y period and risk of T2DM in the following 4-y period. For example, the 1986–1990 dietary change was used to assess the risk of T2DM in 1990–1994. This means that we modeled the substitution of red meat with other protein sources statistically using the naturally occurring dietary changes among the participants, and the participants were not asked to perform specific replacements. The protein foods were all included in the same Cox models as change variables in servings per day. For each substitution of 1 food item for another, we exponentiated the difference between the β-coefficients of the 2 foods to estimate the HR, and we used the variances and covariance of the 2 food items to estimate the 95% CI (26). The difference in the estimates for the 2 increases in intake statistically predicts the substitution effects on risk of T2DM. This substitution is being interpreted as the risk of T2DM associated with a decreased red meat intake and simultaneous increased intake of another protein food, e.g., poultry.
Participants could contribute up to five 8-y periods in the HPFS and NHS (1986–1994, 1990–1998, 1994–2002, 1998–2006, and 2002–2010) and four 8-y periods in the NHS II (1991–1999, 1995–2003, 1999–2007, and 2003–2011). The number of person-years was calculated for each participant from the date of return of the 1990 questionnaire for the NHS and HPFS, and the 1995 questionnaire for the NHS II until the date of diagnosis of T2DM, death, or end of follow-up (31 January, 2011 for the HPFS and NHS, and 30 June, 2013 for the NHS II), whichever came first.
Age and calendar time were included as the underlying timescale. We furthermore controlled for total energy, both as initial intake (quintiles) at the beginning of each 4-y diet change period and simultaneous change in intake (quintiles) during that period. In an additional model, we controlled for marital status (with spouse, yes or no), race (white, African American, Asian/other, missing), family history of diabetes (yes, no), history of hypertension (yes, no), history of hypercholesterolemia (yes, no), BMI (<20.0, 20.0 to <23.0, 23.0 to <25.0, 25.0 to <30.0, ≥30.0 kg/m2) at the beginning of each 4-y diet change period, alcohol intake, both as initial intake (0, 0.1–4.9, 5–14.9, 15–29.9, ≥30 g/d) and as simultaneous change in intake (quintiles), modified AHEI (initial and change, both quintiles), smoking status change (never to never, current to past, past to current, never to current, past to past, current to current, missing), physical activity (metabolic equivalents initially and change, both quintiles) and for females, initial menopausal status and use of postmenopausal hormones (premenopausal, postmenopausal + never hormone use, postmenopausal + past hormone use, postmenopausal + current hormone use, missing). In a third model, we additionally controlled for initial intake of red meat and the other protein foods at the beginning of each 4-y diet change period (servings/d). In a fourth model, we additionally controlled for simultaneous weight change (kg), a potential mediator of T2DM.
To minimize missing values during follow-up, we carried forward the last value for continuous variables and for a few categorical covariates, we created missing indicators as stated above. For the protein exposure variables, we carried missing values forward only 1 cycle and excluded participants from the analyses in the particular period they had a second exposure variable missing. Change in the exposure food groups was truncated at the 0.5th and 99.5th percentiles to minimize the influence of outliers.
We pooled the period-specific results and calculated a combined estimate within each cohort. Q-statistics was used to assess heterogeneity. Because no significant heterogeneity was found, we used an inverse variance-weighted fixed effect meta-analysis to combine the results across the 3 cohorts.
To investigate potential effect modification, stratified analyses were performed based on initial values at the beginning of each 4-y diet change period for the following variables: total red meat intake (< or ≥median intake), BMI (<25, 25 to <30, ≥30 kg/m2), smoking (never, past, current), alcohol intake (0, 0.1–29.9, ≥30 g/d), and age (< or ≥65 y). These characteristics were chosen based on their association with insulin resistance, because individuals with underlying insulin resistance may respond differently to diet (27–29). Potential surveillance bias was investigated in a sensitivity analysis by using only symptomatic T2DM cases in our main models. The assumption of proportional hazards was found to be appropriate when testing interaction terms between age and each exposure of interest.
All analyses were performed in SAS version 9.3 (SAS Institute), at a 2-tailed α of 0.05, and the figures were created in Stata Statistical Software release 16 (StataCorp LCC).
Results
After exclusions, 27,634 participants (2053 incident T2DM cases) in the HPFS, 46,023 participants (4102 incident T2DM cases) in the NHS, and 75,196 participants (2608 incident T2DM cases) in the NHS II were included with a total of 2,113,245 person-years of follow-up (Supplemental Figure 1).
Table 1 presents the distribution of characteristics according to change in total red meat intake in 1986–1990 for HPFS and NHS, and 1991–1995 for NHS II. The average age of males in the HPFS was 53 y in 1986, females in the NHS was 52 y in 1986, and females in the NHS II was 40 y in 1991. Compared to participants with a relatively stable intake of red meat, participants who decreased or increased their intake had a higher initial intake of red meat. Also, initial BMI was higher among participants with the largest change (both decrease and increase) in red meat consumption, but in general, BMI was fairly similar across the groups. In addition, participants who had the greatest change (both decrease and increase) in red meat intake were more likely to be smokers and had a lower diet quality score. Those who increased red meat intake had more weight gain, lower reduction in alcohol intake, increased total energy intake, and decreased diet quality score.
TABLE 1.
Characteristics of participants according to 4-y changes in total red meat intake from 1986 to 1990 for HPFS and NHS and 1991–1995 for NHS II1
| Changes in frequency of total red meat intake (servings/d) | |||||
|---|---|---|---|---|---|
| Decrease | No change or relatively stable (±0.14) | Increase | |||
| Characteristics | Moderate to large (>0.5) | Small to moderate (0.15–0.50) | Small to moderate (0.15–0.50) | Moderate to large (>0.5) | |
| HPFS (n = 27,634) | |||||
| No. of participants | 5522 | 6392 | 8200 | 4743 | 2777 |
| Change in total red meat, median servings/d | −0.79 | −0.29 | 0.00 | 0.29 | 0.79 |
| Change in total red meat, 90% central range | (–1.87, –0.51) | (–0.49, –0.15) | (–0.14, 0.14) | (0.14, 0.50) | (0.51, 1.85) |
| Initial total red meat intake, servings/d | 1.74 ± 0.79 | 1.04 ± 0.51 | 0.59 ± 0.51 | 0.79 ± 0.54 | 0.92 ± 0.57 |
| Change in processed red meat, median servings/d | −0.36 | −0.07 | 0.00 | 0.07 | 0.29 |
| Change in processed red meat, 90% central range | (–1.15, 0.07) | (–0.5, 0.14) | (–0.28, 0.15) | (–0.22, 0.43) | (–0.14, 1.14) |
| Age, y | 52.4 ± 9.0 | 52.7 ± 9.2 | 53.6 ± 9.3 | 52.9 ± 9.4 | 52.7 ± 9.1 |
| Initial BMI, kg/m2 | 25.7 ± 3.1 | 25.2 ± 3.1 | 25.0 ± 2.9 | 25.3 ± 3.0 | 25.7 ± 3.3 |
| Weight change, kg | 0.14 ± 4.3 | 0.55 ± 3.9 | 0.62 ± 3.5 | 0.98 ± 3.7 | 1.28 ± 4.3 |
| Initial physical activity, MET-h/wk | 19.2 ± 28.5 | 21.1 ± 27.8 | 24.8 ± 32.2 | 21.3 ± 31.4 | 19.4 ± 27.9 |
| Changes in physical activity, MET-h/wk | 17.5 ± 40.6 | 15.5 ± 36.7 | 15.2 ± 41.3 | 16.5 ± 41.3 | 17.8 ± 41.9 |
| Initial alcohol intake, g/d | 12.5 ± 16.1 | 11.8 ± 15.1 | 10.3 ± 14.0 | 12.2 ± 15.9 | 11.9 ± 16.2 |
| Changes in alcohol intake, g/d | −1.9 ± 10.9 | −1.5 ± 10.0 | −1.0 ± 9.2 | −1.1 ± 10.5 | −0.5 ± 11.4 |
| Ethnicity, white % | 92 | 92 | 92 | 92 | 92 |
| Marital status, with spouse, % | 91 | 92 | 90 | 91 | 89 |
| Current smoker, % | 10 | 8 | 7 | 9 | 12 |
| Hypertension, % | 18 | 18 | 18 | 17 | 18 |
| High cholesterol, % | 10 | 10 | 11 | 9 | 9 |
| Family history of diabetes, % | 22 | 20 | 20 | 21 | 20 |
| Initial total calorie intake, kcal/d | 2293 ± 603 | 2023 ± 568 | 1840 ± 554 | 1939 ± 574 | 2011 ± 602 |
| Changes in total calorie intake, kcal/d | −384 ± 491 | −166 ± 450 | −38 ± 439 | 81 ± 453 | 310 ± 517 |
| Modified AHEI | 34.5 ± 7.3 | 37.0 ± 7.9 | 39.8 ± 8.5 | 37.8 ± 8.3 | 36.1 ± 8.0 |
| Change in modified AHEI | 2.7 ± 7.0 | 1.2 ± 6.7 | 0.0 ± 6.8 | −0.9 ± 6.8 | −1.9 ± 6.6 |
| NHS (n = 46,023) | |||||
| No. of participants | 8641 | 12,070 | 14,308 | 7685 | 3319 |
| Change in total red meat, median servings/d | −0.73 | −0.29 | 0 | 0.28 | 0.72 |
| Change in total red meat, 90% central range | (–1.58, –0.51) | (–0.50, –0.15) | (–0.14, 0.14) | (0.14, 0.49) | (0.50, 1.37) |
| Initial total red meat intake, servings/d | 1.51 ± 0.60 | 0.91 ± 0.40 | 0.57 ± 0.39 | 0.68 ± 0.41 | 0.74 ± 0.42 |
| Change in processed red meat, median servings/d | −0.29 | –0.07 | 0.00 | 0.07 | 0.21 |
| Change in processed red meat, 90% central range | (–1.00, 0.00) | (–0.43, 0.07) | (–0.21, 0.14) | (–0.21, 0.36) | (–0.14, 0.86) |
| Age, y | 51.3 ± 7.1 | 51.6 ± 7.1 | 52.3 ± 7.0 | 51.7 ± 7.1 | 51.4 ± 7.1 |
| Initial BMI, kg/m2 | 25.4 ± 4.9 | 24.9 ± 4.5 | 24.5 ± 4.3 | 25.0 ± 4.5 | 25.6 ± 4.9 |
| Weight change, kg | 0.52 ± 6.0 | 0.95 ± 4.9 | 1.13 ± 4.7 | 1.69 ± 5.0 | 2.11 ± 5.5 |
| Initial physical activity, MET-h/wk | 12.7 ± 19.3 | 13.9 ± 19.4 | 15.8 ± 21.8 | 14.1 ± 20.9 | 13.0 ± 18.3 |
| Changes in physical activity, MET-h/wk | 0.8 ± 20.4 | 1.1 ± 21.1 | 0.7 ± 22.4 | 0.7 ± 24.4 | 0.6 ± 20.6 |
| Initial alcohol intake, g/d | 6.5 ± 10.9 | 6.3 ± 10.4 | 6.2 ± 10.2 | 6.5 ± 11.1 | 6.1 ± 11.1 |
| Changes in alcohol intake, g/d | −1.4 ± 7.7 | −1.2 ± 7.0 | −1.0 ± 6.9 | −1.0 ± 7.3 | −0.4 ± 7.5 |
| Ethnicity, white % | 98 | 98 | 98 | 98 | 98 |
| Marital status, with spouse, % | 93 | 93 | 92 | 92 | 93 |
| Current smoker, % | 22 | 20 | 18 | 21 | 24 |
| Hypertension, % | 13 | 13 | 13 | 13 | 14 |
| High cholesterol, % | 6 | 6 | 7 | 6 | 6 |
| Family history of diabetes, % | 29 | 28 | 28 | 29 | 31 |
| Postmenopausal + current hormone use, % | 13 | 14 | 16 | 15 | 14 |
| Initial total calorie intake, kcal/d | 2049 ± 518 | 1781 ± 487 | 1634 ± 488 | 1703 ± 499 | 1750 ± 509 |
| Changes in total calorie intake, kcal/d | −304 ± 453 | −99 ± 397 | 25 ± 396 | 160 ± 397 | 359 ± 457 |
| Modified AHEI | 35.1 ± 7.4 | 37.1 ± 7.7 | 39.4 ± 8.3 | 37.7 ± 8.0 | 36.9 ± 7.9 |
| Change in modified AHEI | 2.0 ± 7.3 | 0.9 ± 7.0 | −0.3 ± 7.1 | −1.1 ± 6.9 | −2.2 ± 7.1 |
| NHS II (n = 70,567)2 | |||||
| No. of participants | 10,059 | 16,649 | 24,279 | 13,294 | 6286 |
| Change in total red meat, median servings/d | –0.73 | –0.29 | 0 | 0.28 | 0.72 |
| Change in total red meat, 90% central range | (–1.58, –0.51) | (–0.49, –0.14) | (–0.14, 0.14) | (0.14, 0.49) | (0.50, 1.44) |
| Initial total red meat intake, servings/d | 1.51 ± 0.59 | 0.89 ± 0.40 | 0.52 ± 0.40 | 0.62 ± 0.40 | 0.68 ± 0.41 |
| Change in processed red meat, median servings/d | –0.22 | –0.07 | 0.00 | 0.07 | 0.14 |
| Change in processed red meat, 90% central range | (–0.93, 0.07) | (–0.43, 0.07) | (–0.21, 0.14) | (–0.14, 0.36) | (–0.14, 0.79) |
| Age, y | 40.0 ± 4.6 | 40.3 ± 4.6 | 40.3 ± 4.6 | 40.0 ± 4.6 | 39.9 ± 4.6 |
| Initial BMI, kg/m2 | 25.1 ± 5.6 | 24.4 ± 5.0 | 23.8 ± 4.7 | 24.5 ± 5.2 | 25.3 ± 5.7 |
| Weight change, kg | 2.60 ± 6.6 | 3.00 ± 6.0 | 3.21 ± 5.8 | 4.10 ± 6.2 | 5.08 ± 7.3 |
| Initial physical activity, MET-h/wk | 18.4 ± 24.5 | 19.7 ± 24.7 | 23.3 ± 30.3 | 20.0 ± 26.4 | 19.1 ± 25.6 |
| Changes in physical activity, MET-h/wk | −2.4 ± 26.0 | −3.2 ± 25.4 | −4.4 ± 29.0 | −4.0 ± 26.9 | −5.0 ± 25.8 |
| Initial alcohol intake, g/d | 3.1 ± 6.1 | 3.2 ± 6.0 | 3.4 ± 29.0 | 3.1 ± 6.0 | 3.0 ± 6.4 |
| Changes in alcohol intake, g/d | 0.0 ± 5.0 | 0.2 ± 5.2 | 0.4 ± 5.1 | 0.5 ± 5.0 | 0.4 ± 5.5 |
| Ethnicity, white % | 97 | 97 | 97 | 97 | 97 |
| Marital status, with spouse, % | 82 | 81 | 75 | 78 | 76 |
| Current smoker, % | 14 | 12 | 10 | 12 | 15 |
| Hypertension, % | 4 | 3 | 3 | 3 | 4 |
| High cholesterol, % | 9 | 9 | 9 | 10 | 11 |
| Family history of diabetes, % | 37 | 36 | 34 | 35 | 37 |
| Postmenopausal + current hormone use, % | 0 | 0 | 0 | 0 | 0 |
| Initial total calorie intake, kcal/d | 2100 ± 540 | 1829 ± 510 | 1654 ± 508 | 1700 ± 508 | 1749 ± 514 |
| Changes in total calorie intake, kcal/d | −310 ± 491 | −101 ± 437 | 36 ± 432 | 214 ± 439 | 477 ± 488 |
| Modified AHEI | 32.1 ± 7.0 | 34.6 ± 7.4 | 37.2 ± 7.9 | 35.6 ± 7.7 | 34.6 ± 7.6 |
| Change in modified AHEI | 3.1 ± 6.6 | 1.6 ± 6.5 | 0.3 ± 6.7 | −0.8 ± 6.5 | −2.1 ± 6.7 |
Mean ± SD or proportion. AHEI, Alternative Healthy Eating Index; HPFS, Health Professionals Follow-up Study; MET, metabolic equivalent; NHS, Nurses’ Health Study; NHS II, Nurses’ Health Study II.
In total, 4629 women from NHS II were pregnant during the 4-y period 1991–1995 and therefore do not contribute to Table 1. Thus, the number of women contributing to Table 1 is lower than the total number of women from NHS II included in the current study. These women were later reincluded in the analyses.
Table 2 presents the HR (95% CI) of T2DM per 1 daily serving decrease in intake of red meat and concomitant increase in poultry, seafood, low-fat dairy products, high-fat dairy products, eggs, legumes, or nuts. For all 3 cohorts, adjustment for known risk factors for T2DM attenuated the results slightly (model 2). Further adjustment for initial intake of the investigated protein groups strengthened the results (model 3). Overall, we observed that replacement of red meat with other protein foods was associated with a lower risk of T2DM, although not all risk estimates were statistically significant. In the pooled analyses, all replacements of red meat with other protein foods showed inverse associations with T2DM. Thus, reducing the intake of red meat by 1 daily serving and replacing it with poultry was associated with an 18% lower risk of T2DM (HR: 0.82; 95% CI: 0.75, 0.90) (model 3). Replacing red meat with seafood was associated with a 13% lower risk of T2DM (HR 0.87, 95% CI: 0.77, 0.98), and replacing red meat with either low-fat dairy or high-fat dairy products was associated with an 18% lower risk of T2DM (HR: 0.82; 95% CI: 0.78, 0.86 for low-fat dairy and HR: 0.82; 95% CI: 0.77, 0.86 for high-fat dairy products). Replacement with eggs was associated with a 10% lower risk (HR: 0.90; 95% CI: 0.81, 0.99), and replacement with legumes was associated with an 11% lower risk (HR: 0.89; 95% CI: 0.82, 0.98). Replacement with nuts was associated with a 17% lower risk of T2DM (HR: 0.83; 95% CI: 0.78, 0.89). Adjustment for the potential mediator concomitant weight change attenuated the associations slightly, but most remained statistically significant (model 4).
TABLE 2.
HR (95% CI) for type 2 diabetes mellitus associated with 1 daily serving decreased intake of red meat and concomitant increased intake of another major dietary protein source in the individual cohorts HPFS, NHS, and NHS II and pooled findings1
| Substituted protein (1 serving/d) | Model 12 | Model 23 | Model 34 | Model 45 |
|---|---|---|---|---|
| HPFS (n = 27,634) | ||||
| Poultry | 0.89 (0.76, 1.05) | 0.89 (0.76, 1.04) | 0.82 (0.68, 0.99) | 0.84 (0.69, 1.02) |
| Seafood | 0.94 (0.77, 1.15) | 0.94 (0.77, 1.14) | 0.87 (0.69, 1.08) | 0.89 (0.71, 1.11) |
| Low-fat dairy | 0.99 (0.90, 1.10) | 1.00 (0.91, 1.10) | 0.89 (0.80, 0.98) | 0.91 (0.82, 1.00) |
| High-fat dairy | 0.89 (0.81, 0.99) | 0.91 (0.82, 1.00) | 0.80 (0.72, 0.89) | 0.81 (0.73, 0.90) |
| Eggs | 1.03 (0.87, 1.23) | 0.99 (0.84, 1.16) | 0.88 (0.74, 1.04) | 0.90 (0.76, 1.07) |
| Legumes | 1.07 (0.92, 1.25) | 1.07 (0.92, 1.26) | 1.02 (0.86, 1.21) | 1.05 (0.88, 1.25) |
| Nuts | 0.98 (0.88, 1.10) | 0.99 (0.89, 1.11) | 0.90 (0.80, 1.02) | 0.92 (0.81, 1.03) |
| NHS (n = 46,023) | ||||
| Poultry | 0.88 (0.78, 1.00) | 0.90 (0.80, 1.02) | 0.83 (0.72, 0.97) | 0.87 (0.75, 1.01) |
| Seafood | 0.80 (0.69, 0.93) | 0.83 (0.71, 0.96) | 0.81 (0.68, 0.97) | 0.85 (0.71, 1.02) |
| Low-fat dairy | 0.88 (0.82, 0.95) | 0.89 (0.83, 0.96) | 0.77 (0.71, 0.83) | 0.79 (0.73, 0.86) |
| High-fat dairy | 0.94 (0.87, 1.02) | 0.94 (0.87, 1.01) | 0.82 (0.75, 0.90) | 0.84 (0.77, 0.91) |
| Eggs | 0.95 (0.82, 1.11) | 0.95 (0.82, 1.10) | 0.91 (0.77, 1.08) | 0.94 (0.79, 1.11) |
| Legumes | 0.92 (0.81, 1.05) | 0.93 (0.83, 1.06) | 0.86 (0.74, 0.99) | 0.89 (0.77, 1.04) |
| Nuts | 0.88 (0.80, 0.96) | 0.91 (0.83, 1.00) | 0.81 (0.73, 0.90) | 0.84 (0.75, 0.93) |
| NHS II (n = 75,196) | ||||
| Poultry | 0.74 (0.65, 0.85) | 0.85 (0.75, 0.97) | 0.80 (0.69, 0.94) | 0.84 (0.72, 0.98) |
| Seafood | 0.81 (0.66, 1.00) | 0.94 (0.77, 1.14) | 0.97 (0.78, 1.22) | 1.03 (0.83, 1.29) |
| Low-fat dairy | 0.83 (0.76, 0.91) | 0.90 (0.83, 0.98) | 0.83 (0.76, 0.91) | 0.86 (0.79, 0.94) |
| High-fat dairy | 0.85 (0.77, 0.93) | 0.91 (0.83, 0.99) | 0.83 (0.75, 0.91) | 0.85 (0.77, 0.93) |
| Eggs | 0.87 (0.74, 1.03) | 0.92 (0.79, 1.08) | 0.90 (0.76, 1.06) | 0.93 (0.79, 1.10) |
| Legumes | 0.79 (0.69, 0.91) | 0.87 (0.75, 0.99) | 0.84 (0.72, 0.98) | 0.88 (0.75, 1.02) |
| Nuts | 0.70 (0.62, 0.79) | 0.82 (0.73, 0.93) | 0.78 (0.69, 0.89) | 0.82 (0.72, 0.93) |
| Pooled (n = 148,853)6 | ||||
| Poultry | 0.83 (0.77, 0.90) | 0.88 (0.81, 0.95) | 0.82 (0.75, 0.90) | 0.85 (0.77, 0.93) |
| Seafood | 0.84 (0.76, 0.93) | 0.88 (0.80, 0.98) | 0.87 (0.77, 0.98) | 0.91 (0.81, 1.03) |
| Low-fat dairy | 0.89 (0.85, 0.94) | 0.92 (0.88, 0.97) | 0.82 (0.78, 0.86) | 0.84 (0.80, 0.89) |
| High-fat dairy | 0.90 (0.85, 0.95) | 0.92 (0.88, 0.97) | 0.82 (0.77, 0.86) | 0.83 (0.79, 0.88) |
| Eggs | 0.95 (0.86, 1.04) | 0.95 (0.87, 1.04) | 0.90 (0.81, 0.99) | 0.92 (0.84, 1.02) |
| Legumes | 0.92 (0.84, 0.99) | 0.94 (0.87, 1.02) | 0.89 (0.82, 0.98) | 0.93 (0.85, 1.02) |
| Nuts | 0.86 (0.81, 0.91) | 0.91 (0.86, 0.97) | 0.83 (0.78, 0.89) | 0.85 (0.80, 0.91) |
AHEI, Alternative Healthy Eating Index; HPFS, Health Professionals Follow-up Study; NHS, Nurses’ Health Study; NHS II, Nurses’ Health Study II.
Model 1: Cox proportional hazards models including all protein foods simultaneously, adjusted for age, calendar time, and calories (initial and change, both quintiles). For each substitution of 1 food item for another, we exponentiated the difference between the β-coefficients of the 2 foods to estimate the HR, and we used the variances and covariance of the 2 food items to estimate the 95% CI.
Model 2: model 1 + marital status (with spouse, yes or no), race (white, African American, Asian/other), family history of diabetes (yes, no), history of hypertension (yes, no), history of hypercholesterolemia (yes, no), BMI (<20.0, 20.0 to <23.0, 23.0 to <25.0, 25.0 to <30.0, ≥30.0 kg/m2) alcohol intake, both as initial intake (0, 0.1–4.9, 5–14.9, 15–29.9, ≥30 g/d) and change (quintiles), modified AHEI (initial and change, both quintiles), smoking status change (never to never, current to past, past to current, never to current, past to past, current to current), physical activity (metabolic equivalents initially and change, both quintiles) and for women initial menopausal status and use of postmenopausal hormones (premenopausal, postmenopausal + never hormone use, postmenopausal + past hormone use, postmenopausal + current hormone use).
Model 3: model 2 + initial intake of red meat, poultry, seafood, low-fat dairy, high-fat dairy, eggs, legumes, and nuts (servings/d).
Model 4: model 3 + simultaneous weight change (kg).
The results across the 3 cohorts were pooled using an inverse variance weighted, fixed-effect meta-analysis.
Figure 1 presents the pooled HR (95% CI) of T2DM for replacements of either unprocessed or processed red meat with a specified protein food. Overall, the findings for these subtypes of total red meat were similar to the findings for total red meat, but replacement of processed red meat with other protein foods was more consistently associated with a lower risk of T2DM than replacement of unprocessed red meat. Similar to the findings for total red meat, adjustment for weight change attenuated the findings slightly (Supplemental Table 1).
FIGURE 1.
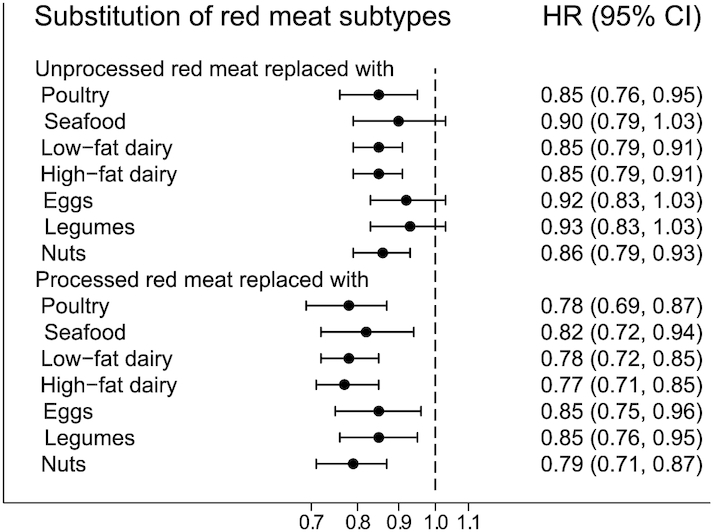
HR (95% CI) for type 2 diabetes mellitus associated with 1 daily serving decreased intake of unprocessed or processed red meat and concomitant increased intake of another major dietary protein source in pooled analyses of all 3 cohorts (n = 148,853). Note: the Cox proportional hazards models included all protein foods simultaneously and were adjusted for age, calendar time, and calories (initial and change, both quintiles), marital status (with spouse, yes or no), race (white, African American, Asian/other), family history of diabetes (yes, no), history of hypertension (yes, no), history of hypercholesterolemia (yes, no), BMI (<20.0, 20.0 to <23.0, 23.0 to <25.0, 25.0 to <30.0, ≥30.0 kg/m2) alcohol intake, both as initial intake (0, 0.1–4.9, 5–14.9, 15–29.9, ≥30 g/d) and change (quintiles), modified AHEI (initial and change, both quintiles), smoking status change (never to never, current to past, past to current, never to current, past to past, current to current), physical activity (metabolic equivalents initially and change, both quintiles) and for women initial menopausal status and use of postmenopausal hormones (premenopausal, postmenopausal + never hormone use, postmenopausal + past hormone use, postmenopausal + current hormone use), initial intake of red meat, poultry, seafood, low-fat dairy, high-fat dairy, eggs, legumes, and nuts (servings/d). For each substitution of 1 food item for another, we exponentiated the difference between the β-coefficients of the 2 foods to estimate the HR, and we used the variances and covariance of the 2 food items to estimate the 95% CI. The results across the 3 cohorts were pooled using an inverse variance weighted, fixed-effect meta-analysis. AHEI, Alternative Healthy Eating Index.
Stratifying the analyses by initial total red meat intake at each 4-y period showed stronger associations among participants with a total red meat intake at or above the median compared to intakes below the median (Supplemental Figure 2). Stratifying by age, BMI, alcohol intake, and smoking status in the beginning of each 4-y period showed no effect modification, although there was a tendency of weaker associations with higher BMI, which is associated with a higher baseline risk of T2DM. Furthermore, the associations were weak and unstable among current smokers (Supplemental Figures 3–6). Overall, findings were slightly stronger in sensitivity analyses using only symptomatic T2DM cases. The biggest difference was observed for seafood: pooled HR for substitution of seafood for total red meat was 0.87 (95% CI: 0.77, 0.98) in the main analysis (Table 2) and 0.75 (95% CI: 0.63, 0.89) when only studying symptomatic T2DM cases (results not shown).
Discussion
In this study of 3 large US cohorts with repeated assessments of diet and lifestyle factors, we found that decreasing and replacing the intake of red meat with poultry, seafood, low-fat dairy, high-fat dairy, eggs, legumes, or nuts over a 4-y period was associated with a lower risk of T2DM in the following 4-y period. For subtypes of red meat, inverse associations were found for both unprocessed and processed red meat, although slightly stronger for processed red meat. Our findings were consistent across all 3 study populations of younger and middle-aged females and middle-aged males.
We took advantage of unique, repeated dietary measures to compare participants according to dietary changes over time. In statistical models controlling for total energy intake (initial and change), we compared participants who increased their intake of red meat to participants who increased their intake of other protein foods to predict substitution effects on risk of T2DM. Our approach reflects a real-world setting, where individuals make a behavioral change best suited to their lifestyle. However, from our FFQs we were not able to ascertain why the participants changed their diet or at what point in time within each 4-y period. We used entirely observational data, and thus causality cannot be directly inferred.
The study population primarily consisted of health professionals with Caucasian ancestry and therefore the study findings may not be generalizable to other populations. However, substantial variations in intake of the investigated protein foods were observed, which improves generalizability. Female study participants were aged 25–55 y at inclusion, and male participants were aged 40–75 y, with ≤25 y of follow-up. Our findings, therefore, are mainly generalizable to middle-aged and elderly populations. The relative homogeneity of socioeconomic status may reduce confounding, and a high follow-up rate (>90%) for all 3 cohorts reduces the concern for selection bias.
The dietary information was collected via self-administered FFQs, hence, measurement error is inevitable. However, this error is likely to be random and would therefore tend to underestimate the investigated associations. The results could also be underestimated as a consequence of reverse causality if individuals who experienced health conditions associated with a high risk of T2DM or cardiovascular disease, e.g., overweight or hypertension, consequently decreased their intake of red meat and increased their intake of other potentially healthier foods like seafood, vegetables, and nuts. The self-reported information on diagnosis of T2DM was confirmed using validated supplemental questionnaires, but nondifferential misclassification of the outcome cannot be entirely excluded. Since any misclassification of T2DM is unrelated to potential dietary measurement errors, true associations are most likely attenuated towards the null. Concerning potential surveillance bias, we also ran the models using only symptomatic diabetes cases. The results were similar to, although slightly stronger than, those including all T2DM cases.
We were able to control for several potential confounders, both initial values of the covariates at the beginning of each 4-y period and changes during the 4-y diet change period. However, we cannot exclude the possibility of residual and unmeasured confounding. Adjustment for risk factors of T2DM weakened the associations modestly, but the pattern of associations between minimally adjusted and further adjusted models was similar. Intake of red meat and the other investigated protein sources might be associated with different dietary patterns and lifestyles (30, 31). Therefore, changes in red meat or other protein foods may be a marker of an overall lifestyle change. We adjusted for initial as well as simultaneous changes in dietary and behavioral factors but may not have captured all of these changes. In a third model, we further adjusted for the initial intake of the investigated protein foods in each 4-y diet change period, because this could a priori be a confounder. The baseline intake of the protein foods could also be effect modifiers, but our findings did not indicate this (Supplemental Figure 2). Adjustment for simultaneous weight change in the 4-y diet change periods attenuated our findings slightly, indicating that body weight change is an important potential mediator. This is consistent with body weight gain being an established and important risk factor for T2DM (32).
In our pooled analysis, substitutions of red meat with any other protein food showed inverse associations. The benefits of these substitutions are likely due to multiple simultaneous changes in nutrient intakes, e.g., fatty acids, proteins, heme iron, sodium, dietary fiber, minerals, phytochemicals, and other bioactive components. Potential mechanisms include red meat as a main source of heme-iron, a strong pro-oxidant resulting in an increased level of oxidative stress that can cause tissue damage, in particular to pancreatic β-cells. Excess body iron can cause iron deposition in pancreatic β-cells, thereby also impairing insulin secretion (33). Red meat products are often high in fat and in particular saturated fat in contrast to poultry and seafood. Saturated fat has been linked to insulin resistance via intracellular lipid storage, and the overall high energy content may promote weight gain (34). The largest difference between unprocessed and processed red meat is the content of sodium, nitrates, and nitrites, all used in preservation, and might explain why processed red meat is more harmful to cardiometabolic health than unprocessed red meat (35). High dietary sodium intake increases blood pressure, a risk factor for cardiovascular disease (35, 36). Nitrates and nitrites can be converted into nitrosamines that are toxic to pancreatic β-cells and may cause metabolic disturbances (34, 37). As an alternative to red meat, some types of seafood may be favorable due to their content of n–3 PUFAs with their presumed beneficial effects on cardiometabolic health, although the role of fish intake and n–3 PUFAs in T2DM is still debated (38, 39). The limited evidence on dairy products and T2DM suggests neutral or beneficial effects on plasma lipids, blood pressure, glucose response, insulin sensitivity, inflammatory profile, and gut microbiota, likely due to differences in content of calcium, amino acids, probiotics, and the fatty acid composition (40–42). Whether low-fat or high-fat dairy products are more beneficial is unclear (40), and we therefore split into 2 groups according to fat content. The limited evidence on eggs suggests it is a healthy alternative to more harmful foods like processed meats when consumed in moderation (43). Legume intake has a favorable impact on blood cholesterol concentrations and has been associated with low glycemic and insulin responses, presumably due to the composition of carbohydrates and contents of fiber, folate, and phytochemicals (44–46). Finally, nuts may be a good alternative to red meat as their content of unsaturated fatty acids, folate, minerals, antioxidants, and especially phytochemicals have favorable effects on blood cholesterol, triglycerides, blood pressure, inflammation, and insulin response (43, 44, 47).
In a meta-analysis of cohort studies not investigating dietary changes or specifying a substitution, higher red meat intake was associated with a higher risk of T2DM, and the association was particularly strong for processed red meat (3). Within the HPFS, NHS, and NHS II cohorts, Pan et al. (5) previously found that compared with a fairly stable intake, increasing red meat intake over a 4-y period was associated with a higher risk of T2DM in the following 4-y period. In contrast to the meta-analysis and the change study by Pan et al., a few studies have specified the foods that may replace red meat. The following 3 studies examined substitutions of habitual dietary intake, i.e., comparison of different baseline dietary intakes among study participants. Within the HPFS, NHS, and NHS II cohorts, Pan et al. (8) found that substitution of 1 daily serving of total, unprocessed, or processed red meat with poultry, fish, low-fat dairy, or nuts was associated with a 10–32% lower risk of T2DM. Likewise, a Danish cohort study found substitution of 1 weekly serving of red meat, especially processed red meat, with poultry or seafood to be associated with a lower risk of T2DM (48). Similarly, a Spanish cohort study found that replacing 1 daily serving of unprocessed or processed red meat with poultry, fish, eggs, or legumes was associated with a lower risk of metabolic syndrome (49).
In conclusion, our findings support the benefits of decreasing red meat intake and concomitantly increasing intake of poultry, seafood, low-fat dairy products, high-fat dairy products, eggs, legumes, or nuts for the prevention of T2DM. Furthermore, these results of specific food substitutions provide evidence for food-based dietary guidelines for optimal health.
Supplementary Material
ACKNOWLEDGEMENTS
We acknowledge the Channing Division of Network Medicine, Department of Biomedicine, Brigham and Women's Hospital and Harvard Medical School. We thank the participants in the Health Professionals Follow-up Study, Nurses’ Health Study, and Nurses’ Health Study II for the continued support and dedication.
The authors’ responsibilities were as follows––AMLW, MUJ, KO, WCW, and EBR: designed the study; WCW and EBR: have been instrumental in the data collection since study inception; AMLW and TH: conducted the statistical analyses; AMLW: wrote the first manuscript draft; AMLW, MUJ, MLB, TH, EBS, WCW, KO, QS, JEM, FBH, and EBR: contributed to the interpretation of the results and critical revision of the manuscript; and all authors are responsible for the final content, and have read and approved the final manuscript. The authors report no conflicts of interest.
Notes
This study was supported by grants UM1 CA186107, U01 CA176726, U01 CA167552, DK112940, and P30 DK46200 from the NIH and by the project “Diet and prevention of ischemic heart disease: a translational approach” (DIPI, www.dipi.dk), which was supported by the Danish Council for Strategic Research (today, Innovation Fund Denmark) (contract 0603-00488B). The funding agencies had no role in the design, analysis, or writing of this article.
Supplemental Figures 1–6 and Supplemental Table 1 are available from the “Supplementary data” link in the online posting of the article and from the same link in the online table of contents at https://academic.oup.com/ajcn/.
Data described in this article may be made available upon request pending on application to and approval by the Channing Division of Network Medicine. Further information including the procedures to obtain and access data from the Nurses’ Health Studies and Health Professionals Follow-up Study is described at https://www.nurseshealthstudy.org/researchers (contact e-mail: nhsaccess@channing.harvard.edu) and https://sites.sph.harvard.edu/hpfs/for-collaborators/.
Abbreviations used: AHEI, Alternative Healthy Eating Index; HPFS, Health Professionals Follow-up Study; NHS, Nurses’ Health Study; NHS II, Nurses’ Health Study II; T2DM, type 2 diabetes mellitus.
Contributor Information
Anne Mette L Würtz, Department of Public Health, Research Unit for Epidemiology, Aarhus University, Aarhus, Denmark; Department of Nutrition, Harvard T.H. Chan School of Public Health, Boston, MA, USA.
Marianne U Jakobsen, Department of Public Health, Research Unit for Epidemiology, Aarhus University, Aarhus, Denmark; Division for Diet, Disease Prevention and Toxicology, National Food Institute, Technical University of Denmark, Kgs. Lyngby, Denmark.
Monica L Bertoia, Department of Nutrition, Harvard T.H. Chan School of Public Health, Boston, MA, USA; Channing Division of Network Medicine, Department of Medicine, Brigham and Women's Hospital, Harvard Medical School, Boston, MA, USA.
Tao Hou, Department of Nutrition, Harvard T.H. Chan School of Public Health, Boston, MA, USA.
Erik B Schmidt, Department of Cardiology, Aalborg University Hospital, Aalborg University, Aalborg, Denmark.
Walter C Willett, Department of Nutrition, Harvard T.H. Chan School of Public Health, Boston, MA, USA; Channing Division of Network Medicine, Department of Medicine, Brigham and Women's Hospital, Harvard Medical School, Boston, MA, USA; Department of Epidemiology, Harvard T.H. Chan School of Public Health, Boston, MA, USA.
Kim Overvad, Department of Public Health, Research Unit for Epidemiology, Aarhus University, Aarhus, Denmark; Department of Cardiology, Aalborg University Hospital, Aalborg University, Aalborg, Denmark.
Qi Sun, Department of Nutrition, Harvard T.H. Chan School of Public Health, Boston, MA, USA; Channing Division of Network Medicine, Department of Medicine, Brigham and Women's Hospital, Harvard Medical School, Boston, MA, USA.
JoAnn E Manson, Channing Division of Network Medicine, Department of Medicine, Brigham and Women's Hospital, Harvard Medical School, Boston, MA, USA; Department of Epidemiology, Harvard T.H. Chan School of Public Health, Boston, MA, USA; Division of Preventive Medicine, Department of Medicine, Brigham and Women's Hospital, Harvard Medical School, Boston, MA, USA.
Frank B Hu, Department of Nutrition, Harvard T.H. Chan School of Public Health, Boston, MA, USA; Channing Division of Network Medicine, Department of Medicine, Brigham and Women's Hospital, Harvard Medical School, Boston, MA, USA; Department of Epidemiology, Harvard T.H. Chan School of Public Health, Boston, MA, USA.
Eric B Rimm, Department of Nutrition, Harvard T.H. Chan School of Public Health, Boston, MA, USA; Channing Division of Network Medicine, Department of Medicine, Brigham and Women's Hospital, Harvard Medical School, Boston, MA, USA; Department of Epidemiology, Harvard T.H. Chan School of Public Health, Boston, MA, USA.
References
- 1. International Diabetes Federation. IDF Diabetes Atlas 8th Edition. Belgium; 2017. [Google Scholar]
- 2. Howells L, Musaddaq B, McKay AJ, Majeed A. Clinical impact of lifestyle interventions for the prevention of diabetes: an overview of systematic reviews. BMJ Open. 2016;6(12):e013806. [DOI] [PMC free article] [PubMed] [Google Scholar]
- 3. Feskens EJ, Sluik D, van Woudenbergh GJ. Meat consumption, diabetes, and its complications. Curr Diab Rep. 2013;13(2):298–306. [DOI] [PubMed] [Google Scholar]
- 4. Schwingshackl L, Hoffmann G, Lampousi AM, Knuppel S, Iqbal K, Schwedhelm C, Bechthold A, Schlesinger S, Boeing H. Food groups and risk of type 2 diabetes mellitus: a systematic review and meta-analysis of prospective studies. Eur J Epidemiol. 2017;32(5):363–75. [DOI] [PMC free article] [PubMed] [Google Scholar]
- 5. Pan A, Sun Q, Bernstein AM, Manson JE, Willett WC, Hu FB. Changes in red meat consumption and subsequent risk of type 2 diabetes mellitus: three cohorts of US men and women. JAMA Intern Med. 2013;173(14):1328–35. [DOI] [PMC free article] [PubMed] [Google Scholar]
- 6. U.S. Department of Health and Human Services and U.S. Department of Agriculture. 2015–2020 Dietary Guidelines for Americans. 8th Edition. December 2015 [Internet]. Available at: http://health.gov/dietaryguidelines/2015/guidelines/. [Google Scholar]
- 7. Montagnese C, Santarpia L, Buonifacio M, Nardelli A, Caldara AR, Silvestri E, Contaldo F, Pasanisi F. European food-based dietary guidelines: a comparison and update. Nutrition. 2015;31(7–8):908–15. [DOI] [PubMed] [Google Scholar]
- 8. Pan A, Sun Q, Bernstein AM, Schulze MB, Manson JE, Willett WC, Hu FB. Red meat consumption and risk of type 2 diabetes: 3 cohorts of US adults and an updated meta-analysis. Am J Clin Nutr. 2011;94(4):1088–96. [DOI] [PMC free article] [PubMed] [Google Scholar]
- 9. Willett WC, Howe GR, Kushi LH. Adjustment for total energy intake in epidemiologic studies. Am J Clin Nutr. 1997;65(4 Suppl):1220S–8S.; discussion 9S–31S. [DOI] [PubMed] [Google Scholar]
- 10. Rimm EB, Giovannucci EL, Willett WC, Colditz GA, Ascherio A, Rosner B, Stampfer MJ. Prospective study of alcohol consumption and risk of coronary disease in men. Lancet North Am Ed. 1991;338(8765):464–8. [DOI] [PubMed] [Google Scholar]
- 11. Willett WC, Stampfer MJ, Colditz GA, Rosner BA, Hennekens CH, Speizer FE. Dietary fat and the risk of breast cancer. N Engl J Med. 1987;316(1):22–8. [DOI] [PubMed] [Google Scholar]
- 12. Solomon CG, Willett WC, Carey VJ, Rich-Edwards J, Hunter DJ, Colditz GA, Stampfer MJ, Speizer FE, Spiegelman D, Manson JE. A prospective study of pregravid determinants of gestational diabetes mellitus. JAMA. 1997;278(13):1078–83. [PubMed] [Google Scholar]
- 13. Willett WC, Sampson L, Stampfer MJ, Rosner B, Bain C, Witschi J, Hennekens CH, Speizer FE. Reproducibility and validity of a semiquantitative food frequency questionnaire. Am J Epidemiol. 1985;122(1):51–65. [DOI] [PubMed] [Google Scholar]
- 14. Salvini S, Hunter DJ, Sampson L, Stampfer MJ, Colditz GA, Rosner B, Willett WC. Food-based validation of a dietary questionnaire: the effects of week-to-week variation in food consumption. Int J Epidemiol. 1989;18(4):858–67. [DOI] [PubMed] [Google Scholar]
- 15. Rimm EB, Giovannucci EL, Stampfer MJ, Colditz GA, Litin LB, Willett WC. Reproducibility and validity of an expanded self-administered semiquantitative food frequency questionnaire among male health professionals. Am J Epidemiol. 1992;135(10):1114–26.; discussion 27–36. [DOI] [PubMed] [Google Scholar]
- 16. Feskanich D, Rimm EB, Giovannucci EL, Colditz GA, Stampfer MJ, Litin LB, Willett WC. Reproducibility and validity of food intake measurements from a semiquantitative food frequency questionnaire. J Am Diet Assoc. 1993;93(7):790–6. [DOI] [PubMed] [Google Scholar]
- 17. Hu FB, Rimm E, Smith-Warner SA, Feskanich D, Stampfer MJ, Ascherio A, Sampson L, Willett WC. Reproducibility and validity of dietary patterns assessed with a food-frequency questionnaire. Am J Clin Nutr. 1999;69(2):243–9. [DOI] [PubMed] [Google Scholar]
- 18. Colditz GA, Martin P, Stampfer MJ, Willett WC, Sampson L, Rosner B, Hennekens CH, Speizer FE. Validation of questionnaire information on risk factors and disease outcomes in a prospective cohort study of women. Am J Epidemiol. 1986;123(5):894–900. [DOI] [PubMed] [Google Scholar]
- 19. Ascherio A, Rimm EB, Giovannucci EL, Colditz GA, Rosner B, Willett WC, Sacks F, Stampfer MJ. A prospective study of nutritional factors and hypertension among US men. Circulation. 1992;86(5):1475–84. [DOI] [PubMed] [Google Scholar]
- 20. Chiuve SE, Fung TT, Rimm EB, Hu FB, McCullough ML, Wang M, Stampfer MJ, Willett WC. Alternative dietary indices both strongly predict risk of chronic disease. J Nutr. 2012;142(6):1009–18. [DOI] [PMC free article] [PubMed] [Google Scholar]
- 21. National Diabetes Data Group. Classification and diagnosis of diabetes mellitus and other categories of glucose intolerance. Diabetes. 1979;28(12):1039–57. [DOI] [PubMed] [Google Scholar]
- 22. Report of the Expert Committee on the Diagnosis and Classification of Diabetes Mellitus. Diabetes Care. 1997;20(7):1183–97. [DOI] [PubMed] [Google Scholar]
- 23. Manson JE, Rimm EB, Stampfer MJ, Colditz GA, Willett WC, Krolewski AS, Rosner B, Hennekens CH, Speizer FE. Physical activity and incidence of non-insulin-dependent diabetes mellitus in women. Lancet North Am Ed. 1991;338(8770):774–8. [DOI] [PubMed] [Google Scholar]
- 24. Hu FB, Leitzmann MF, Stampfer MJ, Colditz GA, Willett WC, Rimm EB. Physical activity and television watching in relation to risk for type 2 diabetes mellitus in men. Arch Intern Med. 2001;161(12):1542–8. [DOI] [PubMed] [Google Scholar]
- 25. Rich-Edwards JW, Corsano KA, Stampfer MJ. Test of the National Death Index and Equifax Nationwide Death Search. Am J Epidemiol. 1994;140(11):1016–9. [DOI] [PubMed] [Google Scholar]
- 26. Zheng Y, Li Y, Satija A, Pan A, Sotos-Prieto M, Rimm E, Willett WC, Hu FB. Association of changes in red meat consumption with total and cause specific mortality among US women and men: two prospective cohort studies. BMJ. 2019;365:l2110. [DOI] [PMC free article] [PubMed] [Google Scholar]
- 27. Neuenschwander M, Ballon A, Weber KS, Norat T, Aune D, Schwingshackl L, Schlesinger S. Role of diet in type 2 diabetes incidence: umbrella review of meta-analyses of prospective observational studies. BMJ. 2019;366:l2368. [DOI] [PMC free article] [PubMed] [Google Scholar]
- 28. Ervin RB. Prevalence of metabolic syndrome among adults 20 years of age and over, by sex, age, race and ethnicity, and body mass index: United States, 2003–2006. Natl Health Stat Report. 2009(13):1–7. [PubMed] [Google Scholar]
- 29. Alkerwi A, Boutsen M, Vaillant M, Barre J, Lair ML, Albert A, Guillaume M, Dramaix M. Alcohol consumption and the prevalence of metabolic syndrome: a meta-analysis of observational studies. Atherosclerosis. 2009;204(2):624–35. [DOI] [PubMed] [Google Scholar]
- 30. Wurtz AM, Hansen MD, Tjonneland A, Rimm EB, Schmidt EB, Overvad K, Jakobsen MU. Substitutions of red meat, poultry and fish and risk of myocardial infarction. Br J Nutr. 2016;115(9):1571–8. [DOI] [PubMed] [Google Scholar]
- 31. Song M, Giovannucci E. Substitution analysis in nutritional epidemiology: proceed with caution. Eur J Epidemiol. 2018;33(2):137–40. [DOI] [PubMed] [Google Scholar]
- 32. Pi-Sunyer X. Changes in body composition and metabolic disease risk. Eur J Clin Nutr. 2019;; 73(2):231–35. [DOI] [PubMed] [Google Scholar]
- 33. Rajpathak SN, Crandall JP, Wylie-Rosett J, Kabat GC, Rohan TE, Hu FB. The role of iron in type 2 diabetes in humans. Biochim Biophys Acta. 2009;1790(7):671–81. [DOI] [PubMed] [Google Scholar]
- 34. Kim Y, Keogh J, Clifton P. A review of potential metabolic etiologies of the observed association between red meat consumption and development of type 2 diabetes mellitus. Metabolism. 2015;64(7):768–79. [DOI] [PubMed] [Google Scholar]
- 35. Micha R, Michas G, Mozaffarian D. Unprocessed red and processed meats and risk of coronary artery disease and type 2 diabetes – an updated review of the evidence. Curr Atheroscler Rep. 2012;14(6):515–24. [DOI] [PMC free article] [PubMed] [Google Scholar]
- 36. Provenzano LF, Stark S, Steenkiste A, Piraino B, Sevick MA. Dietary sodium intake in type 2 diabetes. Clinical Diabetes. 2014;32(3):106–12. [DOI] [PMC free article] [PubMed] [Google Scholar]
- 37. Tong M, Neusner A, Longato L, Lawton M, Wands JR, de la Monte SM. Nitrosamine exposure causes insulin resistance diseases: relevance to type 2 diabetes mellitus, non-alcoholic steatohepatitis, and Alzheimer's disease. J Alzheimers Dis. 2009;17(4):827–44. [PMC free article] [PubMed] [Google Scholar]
- 38. De Caterina R. N-3 Fatty acids in cardiovascular disease. N Engl J Med. 2011;364(25):2439–50. [DOI] [PubMed] [Google Scholar]
- 39. Forouhi NG, Misra A, Mohan V, Taylor R, Yancy W. Dietary and nutritional approaches for prevention and management of type 2 diabetes. BMJ. 2018;361:k2234. [DOI] [PMC free article] [PubMed] [Google Scholar]
- 40. Soedamah-Muthu SS, de Goede J. Dairy consumption and cardiometabolic diseases: systematic review and updated meta-analyses of prospective cohort studies. Curr Nutr Rep. 2018;7(4):171–82. [DOI] [PMC free article] [PubMed] [Google Scholar]
- 41. Da Silva MS, Rudkowska I. Dairy products on metabolic health: current research and clinical implications. Maturitas. 2014;77(3):221–8. [DOI] [PubMed] [Google Scholar]
- 42. Turner KM, Keogh JB, Clifton PM. Dairy consumption and insulin sensitivity: a systematic review of short- and long-term intervention studies. Nutr Metab Cardiovasc Dis. 2015;25(1):3–8. [DOI] [PubMed] [Google Scholar]
- 43. Mozaffarian D. Dietary and policy priorities for cardiovascular disease, diabetes, and obesity: a comprehensive review. Circulation. 2016;133(2):187–225. [DOI] [PMC free article] [PubMed] [Google Scholar]
- 44. Afshin A, Micha R, Khatibzadeh S, Mozaffarian D. Consumption of nuts and legumes and risk of incident ischemic heart disease, stroke, and diabetes: a systematic review and meta-analysis. Am J Clin Nutr. 2014;100(1):278–88. [DOI] [PMC free article] [PubMed] [Google Scholar]
- 45. Anderson JW, Major AW. Pulses and lipaemia, short- and long-term effect: potential in the prevention of cardiovascular disease. Br J Nutr. 2002;88:263. [DOI] [PubMed] [Google Scholar]
- 46. Clark JL, Taylor CG, Zahradka P. Rebelling against the (insulin) resistance: a review of the proposed insulin-sensitizing actions of soybeans, chickpeas, and their bioactive compounds. Nutrients. 2018;10(4):434. [DOI] [PMC free article] [PubMed] [Google Scholar]
- 47. Sikand G, Kris-Etherton P, Boulos NM. Impact of functional foods on prevention of cardiovascular disease and diabetes. Curr Cardiol Rep. 2015;17(6):39–015-0593-9. [DOI] [PubMed] [Google Scholar]
- 48. Ibsen DB, Warberg CK, Wurtz AML, Overvad K, Dahm CC. Substitution of red meat with poultry or fish and risk of type 2 diabetes: a Danish cohort study. Eur J Nutr. 2019;58(7):2705–12. [DOI] [PubMed] [Google Scholar]
- 49. Becerra-Tomas N, Babio N, Martinez-Gonzalez MA, Corella D, Estruch R, Ros E, Fito M, Serra-Majem L, Salaverria I, Lamuela-Raventos RMet al. Replacing red meat and processed red meat for white meat, fish, legumes or eggs is associated with lower risk of incidence of metabolic syndrome. Clin Nutr. 2016;35(6):1442–9. [DOI] [PubMed] [Google Scholar]
Associated Data
This section collects any data citations, data availability statements, or supplementary materials included in this article.