

ABSTRACT
Background
Although adherence to healthful dietary patterns has been associated with a lower risk of kidney function decline in Western populations, evidence in Asian populations remains scanty.
Objectives
We examined predefined dietary patterns, namely, the Alternate Healthy Eating Index-2010 (AHEI-2010), the Dietary Approaches to Stop Hypertension (DASH), and the alternate Mediterranean diet (aMED), in relation to risk of end-stage kidney disease (ESKD).
Methods
We included 56,985 Chinese adults (aged 45–74 y) in the Singapore Chinese Health Study who were free of cancer, stroke, coronary artery disease, and ESKD at recruitment (1993–1998). Dietary pattern scores were calculated based on a validated 165-item FFQ. AHEI-2010 and aMED scores were modified by excluding the alcohol intake component because daily drinking has been associated with a higher risk of ESKD in our study population. We identified 1026 ESKD cases over a median follow-up of 17.5 y via linkage with the nationwide Singapore Renal Registry. Multivariable Cox regression models were used to compute HRs and their 95% CIs.
Results
Higher scores of all 3 dietary patterns were associated with lower ESKD risk in a dose-dependent manner. Compared with the lowest quintiles, the multivariable-adjusted HRs (95% CIs) of ESKD were 0.75 (0.61, 0.92) for the highest quintile of AHEI-2010, 0.67 (0.54, 0.84) for DASH, and 0.73 (0.59, 0.91) for aMED (all P-trend ≤ 0.004). These inverse associations were stronger with increasing BMI (in kg/m2), and the HRs for the diet–ESKD association were lowest in the obese (BMI ≥ 27.5), followed by the overweight (BMI = 25 to <27.5) participants, compared with those in lower BMI categories; the P-interaction values between BMI and diet scores were 0.03 for AHEI-2010, 0.004 for aMED, and 0.06 for DASH.
Conclusions
Adherence to healthful dietary patterns was associated with a lower ESKD risk in an Asian population, especially in overweight or obese individuals.
Keywords: AHEI-2010, BMI, DASH, dietary patterns, end-stage kidney disease, Mediterranean diet, nutritional epidemiology, Singapore Chinese Health Study
Introduction
End-stage kidney disease (ESKD), the final stage of chronic kidney diseases (CKDs) requiring lifetime dialysis or kidney transplantation, is a rising public health issue associated with high morbidity and mortality rates, and a tremendous economic burden to both individuals and health care systems (1).
Epidemiological evidence supports the relation between a number of individual foods and nutrients, and the risk of the development and progression of CKD. For example, higher intakes of red meat (2, 3), total protein (4), sodium (5), and phosphorus (6) have been associated with a higher risk of kidney function decline, whereas higher intakes of dietary fiber (7), coffee (8, 9), and low-fat dairy have been associated with a lower risk of kidney function decline (10). However, studies on any single component, either food or nutrient, do not take into consideration the interrelations of food choices and the combined exposure to different dietary components. Conversely, dietary patterns, defined as the quantities or proportions of a variety or combination of different foods and drinks in diets, may have stronger effects on health outcomes than individual dietary components (11).
The approach of studying dietary patterns has been widely used to examine the associations between overall diet and related health consequences (12). The Alternate Healthy Eating Index-2010 (AHEI-2010), the Dietary Approaches to Stop Hypertension (DASH), and the alternate Mediterranean diet (aMED) are examples of healthful dietary patterns with considerable overlap of food and nutrient items, and these have been extensively studied in relation to the risk of cardiometabolic disease (13–15). The relations between these dietary patterns and risk of kidney function decline have been investigated in Western populations. Greater adherence to the Mediterranean diet has been consistently associated with a lower risk of kidney function decline (16–18), whereas the association between DASH and kidney function decline remains inconsistent: some studies have shown an inverse association (19, 20), whereas another study showed that the DASH diet was not associated with CKD (21). Only the ARIC (Atherosclerosis Risk in Communities) study has investigated the association between AHEI-2010 and risk of CKD, and shown this to be an inverse association (22). Moreover, evidence has suggested that there could be ethnic discrepancies in the association between dietary patterns and risk of type 2 diabetes (23), which is the leading cause of ESKD (24). However, whether adherence to these healthy dietary patterns could also benefit Asian populations remains largely unknown. To our best knowledge, to date, an Iranian prospective cohort study is the only longitudinal study that has assessed the aforementioned dietary patterns and risk of kidney disease in an Asian population and there is no evidence from East Asian populations (25, 26).
We have previously studied the associations of healthful dietary patterns in the Singapore Chinese Health Study (SCHS) and found inverse associations of the AHEI-2010, DASH, and aMED patterns with the risk of mortality (13), cardiovascular disease (27), diabetes (14), and cognitive impairment (28). In this study, we used data from this prospective cohort of middle-aged and older Chinese in Singapore to examine the association between these 3 healthful diet patterns and the risk of ESKD.
Methods
Study population
The design of the SCHS has been described previously (29). Briefly, 63,257 Chinese adults (27,959 men and 35,298 women), aged 45–74 y, were recruited between April 1993 and December 1998. All the participants were permanent residents or citizens of Singapore, who were restricted to the 2 major dialect groups of Chinese in Singapore: the Hokkien originating from Fujian and the Cantonese from Guangdong provinces in the southern part of China. Information on demographics, anthropometric data (height and weight), lifestyle factors (lifetime use of tobacco, alcohol intake, habitual sleep hours, and physical activity), and medical history (physician-diagnosed hypertension, coronary artery disease, stroke, and diabetes) was obtained by trained interviewers using a structured questionnaire at recruitment. The study was approved by the Institutional Review Board of the National University of Singapore. All participants gave written informed consent.
Dietary assessment
At baseline, habitual dietary intakes over the past 12 mo were captured using a validated 165-item, semiquantitative FFQ developed specifically for this cohort. Eight predefined categories for the items, ranging from never or hardly ever to ≥2 times/d, and portion sizes including small, medium, and large were provided for the participants to choose, with the aid of photographs of the foods commonly consumed in Singapore. For alcoholic beverages, the frequency was also reported using the same 8 predefined categories for the intake of food items, and the serving size was determined by 4 serving sizes from 1 standard drink to ≥4 standard drinks. One standard drink was defined as 375 mL beer, 30 mL rice wine, 118 mL grape wine, or 30 mL hard liquor. We derived the daily nutrients and energy intakes from the Singapore Food Composition Database. The validity and reproducibility of the FFQ have been described previously (29). The correlation coefficients for nutrients and energy between two 24-h recalls and repeated FFQ estimates in a subcohort ranged from 0.24 to 0.79, and the variations in mean intakes for most of the nutrients were <10% between the 2 methods (29).
Dietary pattern scores
AHEI-2010
The AHEI is based on comprehensive epidemiological evidence on diet and the risk of chronic diseases (30). In this study, we used the updated version of the AHEI, the AHEI-2010 (31), with the exclusion of the trans-fat component because of the very low consumption level in Singapore and lack of data in this cohort (13). We also excluded the alcohol component, which was treated as a separate factor because daily drinking has been associated with a higher risk of ESKD in our study population (32). Hence, the AHEI-2010 score in this study was computed from the remaining 9 components of whole grains, vegetables, fruits, sugar-sweetened beverages and fruit juice, nuts and legumes, red meat (fresh or processed), long-chain n–3 PUFAs, PUFAs, and sodium. Each component was assigned from 0 to 10 points according to predetermined criteria and a predetermined formula, with higher points being assigned to higher intakes of desired foods or lower intakes of undesired foods, whereas intermediate intakes were assigned scores proportionately (30).
DASH
The DASH score used in this study was adapted from the DASH diet, first designed to reduce blood pressure (33). The score included 8 components and each component was scored as 1–5 points. Participants in the highest quintile of 5 desired foods (whole grains, vegetables, fruits, nuts and legumes, and dairy) received 5 points for each food item, whereas 3 undesired foods (sugar-sweetened beverages and fruit juice, red and processed meat, and sodium) were reverse-scored (13). We modified the DASH score by using total dairy intake instead of low-fat dairy owing to lack of information on the latter in our cohort.
aMED
The Mediterranean diet index was originally developed to examine dietary patterns in Mediterranean populations in relation to mortality (34). We used the modified version of the Mediterranean diet used by Fung et al. (35), but only included 8 components (whole grains, fruit, vegetables, nuts, legumes, fish, ratio of MUFAs to SFAs, and red meat), because alcohol was treated as a separate risk factor and thus excluded from our computation for the aforementioned reason. An intake which was either above the cohort median intake for potentially protective food items or below the cohort median intake for potentially detrimental components was assigned 1 point (13).
Ascertainment of incident ESKD cases
The primary outcome was incident ESKD, which was identified via record linkage of the cohort database with the Singapore Renal Registry. This registry has been shown to be comprehensive in recording ESKD cases from various sources, and compulsory reporting has been mandated by law in recent years (36). Until the end of the follow-up, only 57 subjects (<0.1%) in our cohort were known to be lost to follow-up owing to migration or other reasons. Hence, the identification of ESKD cases via linkage with this nationwide registry could be considered virtually complete.
Any case meeting ≥1 of the following criteria would be registered in the Singapore Renal Registry: 1) serum creatinine concentration ≥ 500 mmol/L (10 mg/dL); 2) estimated glomerular filtration rate (eGFR) <15 mL · min−1 · 1.73 m−2 (calculated by either 24-h creatinine clearance, the Cockcroft-Gault equation, or the Modification of Diet in Renal Disease Study equation); 3) undertaking hemodialysis or peritoneal dialysis; or 4) has undergone a kidney transplant. To be qualified as a diagnosed ESKD, the first 3 criteria had to be persistent for >90 d (36).
Statistical analysis
We excluded participants who had at baseline a previous diagnosis of ESKD (n = 110), cancer (n = 1927), or coronary artery disease or stroke (n = 3269), and those who had an unrealistic daily energy intake (<700 or >3700 kcal/d for men and <600 or >3000 kcal/d for women, n = 966). Overall, the current analysis included data from 56,985 participants and 1026 ESKD cases (Supplemental Figure 1). Each participant's person-years at risk were calculated from the date of recruitment to the date that ESKD was reported, date of death, loss to follow-up, or 31 December, 2015, whichever occurred first.
We assessed the correlations among these dietary patterns using Spearman rank correlation coefficients. Distributions of the baseline characteristics were compared across quintiles of each of these dietary pattern scores. Cox proportional hazards regression was used to calculate HRs and their corresponding 95% CIs for the association between dietary pattern scores and the risk of ESKD. The Schoenfeld residuals method was used to test the proportional hazards assumption of the Cox models and no violation was detected. To test for linear trends, we modeled the dietary pattern scores per quintile by assigning the median value to all the participants within a given quintile. We also studied the association between each 1-SD increment in the dietary pattern scores and the risk of ESKD.
In multivariable Model 1, we adjusted for the potential confounders that were either established factors or factors that we have published from this cohort with a relation to risk of ESKD: age at recruitment (y), sex (male, female), dialect (Hokkien, Cantonese), year of baseline interview (1993–1995, 1996–1998), level of education (no formal education, primary school, secondary school or higher), BMI (in kg/m2) (37), smoking status (never, ever smoked ≤ 19 cigarettes/d, ever smoked 20–39 cigarettes/d, and ever smoked ≥ 40 cigarettes/d) (38), hours per week of moderate activity (<0.5 h, 0.5–2 h, 2–4 h, 4–7 h, and ≥7 h) (39), sleep duration (≤5 h, 6 h, 7 h, 8 h, ≥9 h) (40), total energy intake (kcal/d), coffee consumption (none to <1 cup/d, 1 cup/d, ≥2 cups/d; 1 cup = 237 mL) (9), domestic incense use (current, noncurrent) (41), and alcohol intake (never, monthly to weekly, 1 drink/d, ≥2 drinks/d) (32). Because diet was closely related to history of diabetes or hypertension in the general population, and these comorbidities are strong risk factors for ESKD (24), they could have a confounding effect on the diet–ESKD risk associations. Hence, we further adjusted for self-reported history of physician-diagnosed hypertension and diabetes (yes, no) in Model 2.
To examine potential interaction effects between a dietary pattern and a factor of our interest on risk of ESKD, we included in Model 2 additional product terms of the dietary pattern scores and selected factors, namely, sex (men compared with women), baseline smoking status (never compared with ever), and pre-existing hypertension or diabetes (yes compared with no). We also modeled the association between per 1-SD increment of these dietary pattern scores and risk of ESKD across 4 ordinal categories of BMI (<23, 23 to <25, 25 to <27.5, and ≥27.5) based on the public health action points along the continuum of BMI for Asian populations (42). To determine the potential contributions of individual components in each dietary pattern to the observed associations between the dietary pattern and risk of ESKD, relations between these individual components and risk of ESKD were also assessed in overall adjusted multivariable models.
We conducted a series of sensitivity analyses. 1) We repeated the same analyses among the participants with >5 y of follow-up to minimize the potential confounding effect of subclinical diseases on the observed associations. 2) We examined the risk of ESKD with the AHEI-2010 and aMED scores that included alcohol consumption, as per the original articles, so that our results could be comparable with other studies. In this analysis, the optimal intake of alcohol was defined as 5–20 g/d for men and 5–15 g/d for women for the AHEI-2010 score, and as 10–25 g/d for men and 5–15 g/d for women for the aMED score. 3) To determine whether the observed inverse associations between healthful dietary pattern scores and the risk of ESKD could be largely explained by a common feature such as low sodium, we further adjusted for intake of sodium and the ratio of dietary potassium to dietary sodium in Model 2. 4) We adjusted for pack-years as a continuous variable to account for smoking intensity as a potential confounder. 5) We further adjusted for fish intake and total protein intake in Model 2 to determine whether such associations could be explained by the consumption of these 2 items.
All analyses were performed using Stata version 14.0 (StataCorp LP) and a 2-sided P < 0.05 was set as the threshold for statistical significance.
Results
Table 1 shows the distributions of the baseline characteristics according to the quintiles of the dietary patterns. Across all indexes, compared with participants with the lowest quintile scores, those with the highest quintile scores were more likely to be women, more highly educated, never smokers, physically active, and to have the recommended hours of sleep (6–8 h/d). We also noticed that participants with higher scores had a higher prevalence of hypertension and diabetes. The 3 dietary pattern scores had moderate correlations among themselves, and the Spearman rank correlation coefficients of pairwise comparisons between the AHEI-2010 and DASH, AHEI-2010 and aMED, and aMED and DASH scores were 0.71, 0.63, and 0.56, respectively.
TABLE 1.
Baseline characteristics according to the extreme quintiles of dietary pattern scores in the Singapore Chinese Health Study1
| Characteristics | AHEI-2010 | DASH | aMED | |||
|---|---|---|---|---|---|---|
| Q1 (Low) | Q5 (High) | Q1 (Low) | Q5 (High) | Q1 (Low) | Q5 (High) | |
| Participants, n | 11,397 | 11,397 | 11,705 | 9012 | 11,842 | 11,075 |
| Age, y | 55.9 ± 8.0 | 55.7 ± 7.7 | 55.2 ± 7.7 | 56.5 ± 7.8 | 57.3 ± 8.1 | 54.9 ± 7.5 |
| BMI, kg/m2 | 23.0 ± 3.3 | 23.1 ± 3.2 | 23.1 ± 3.3 | 22.9 ± 3.2 | 23.0 ± 3.3 | 23.1 ± 3.2 |
| Men | 6551 (57.5) | 4083 (35.8) | 6784 (58.0) | 2802 (31.1) | 5566 (47.0) | 4637 (41.9) |
| Cantonese | 4892 (42.9) | 5833 (51.2) | 4808 (41.1) | 4715 (52.3) | 4604 (38.9) | 6043 (54.6) |
| Higher education2 | 2958 (26.0) | 4225 (37.1) | 2939 (25.1) | 3220 (35.7) | 2229 (18.8) | 4538 (41.0) |
| Ever smokers | 4889 (42.9) | 2180 (19.1) | 5168 (44.2) | 1515 (16.8) | 4517 (38.1) | 2455 (22.2) |
| Physical activities3 | 3574 (31.4) | 4436 (38.9) | 3393 (29.0) | 3739 (41.5) | 3128 (26.4) | 4677 (42.2) |
| Sleep duration, h/d | ||||||
| ≤5 | 1188 (10.4) | 1012 (8.9) | 1100 (9.4) | 858 (9.5) | 1247 (10.5) | 897 (8.1) |
| 6–8 | 9325 (81.8) | 9721 (85.3) | 9704 (82.9) | 7667 (85.1) | 9743 (82.3) | 9530 (86.1) |
| ≥9 | 884 (7.8) | 664 (5.8) | 901 (7.7) | 487 (5.4) | 852 (7.2) | 648 (5.9) |
| History of hypertension | 2172 (19.1) | 2701 (23.7) | 2295 (19.6) | 2084 (23.1) | 2443 (20.6) | 2437 (22.0) |
| History of diabetes | 705 (6.2) | 1036 (9.1) | 745 (6.4) | 865 (9.6) | 859 (7.3) | 912 (8.2) |
| Alcohol drinking | ||||||
| Never drinkers | 8422 (73.9) | 9666 (84.8) | 8506 (72.7) | 7889 (87.5) | 9545 (80.6) | 8802 (79.5) |
| Monthly to weekly drinkers | 2214 (19.4) | 1512 (13.3) | 2418 (20.7) | 992 (11.0) | 1715 (14.5) | 1989 (18.0) |
| Daily drinkers | 761 (6.7) | 219 (1.9) | 781 (6.7) | 131 (1.5) | 582 (4.9) | 284 (2.6) |
| Coffee consumption, cups/d | ||||||
| 0 to <1 | 2972 (26.1) | 3921 (34.4) | 2682 (22.9) | 3449 (38.3) | 3016 (25.5) | 3736 (33.7) |
| 1 | 3611 (31.7) | 4430 (38.9) | 3866 (33.0) | 3383 (37.5) | 4061 (34.3) | 4159 (37.6) |
| ≥2 | 4814 (42.2) | 3046 (26.7) | 5157 (44.1) | 2180 (24.2) | 4765 (40.2) | 3180 (28.7) |
| Current incense user | 9000 (79.0) | 8045 (70.6) | 9500 (81.2) | 6267 (69.5) | 9673 (81.7) | 7835 (70.7) |
| Total energy, kcal/d | 1593.7 ± 568.0 | 1628.6 ± 492.3 | 1570.9 ± 528.3 | 1568.5 ± 458.1 | 1309.0 ± 428.2 | 1819.1 ± 530.0 |
| Food groups and nutrients | ||||||
| Whole grains,4 servings/d | 0.14 ± 0.39 | 0.87 ± 1.10 | 0.05 ± 0.23 | 1.11 ± 1.06 | 0.10 ± 0.38 | 0.81 ± 0.97 |
| Fruits,4 servings/d | 0.75 ± 0.68 | 2.02 ± 1.24 | 0.70 ± 0.66 | 1.94 ± 1.12 | 0.61 ± 0.57 | 1.95 ± 1.09 |
| Vegetables,4 servings/d | 1.06 ± 0.58 | 2.07 ± 1.07 | 1.08 ± 0.57 | 1.93 ± 0.97 | 0.90 ± 0.42 | 2.11 ± 0.92 |
| Nuts and legumes,4 servings/d | 0.31 ± 0.30 | 1.10 ± 0.67 | 0.38 ± 0.36 | 0.95 ± 0.69 | 0.28 ± 0.25 | 1.07 ± 0.69 |
| Dairy foods,4 servings/d | 0.26 ± 0.44 | 0.34 ± 0.48 | 0.11 ± 0.26 | 0.56 ± 0.56 | 0.24 ± 0.43 | 0.34 ± 0.47 |
| Fish,4 servings/d | 0.45 ± 0.33 | 0.69 ± 0.34 | 0.56 ± 0.31 | 0.57 ± 0.35 | 0.40 ± 0.22 | 0.76 ± 0.35 |
| Red meat,4 servings/d | 0.39 ± 0.31 | 0.25 ± 0.19 | 0.42 ± 0.26 | 0.19 ± 0.17 | 0.28 ± 0.19 | 0.34 ± 0.28 |
| SSBs and fruit juice,4 servings/d | 0.39 ± 0.62 | 0.07 ± 0.20 | 0.31 ± 0.54 | 0.06 ± 0.23 | 0.14 ± 0.37 | 0.19 ± 0.38 |
| Protein,5 % of energy | 14.3 ± 2.5 | 16.0 ± 2.3 | 15.3 ± 2.4 | 15.2 ± 2.4 | 14.5 ± 2.3 | 16.0 ± 2.3 |
| PUFA,5 % of energy | 4.00 ± 1.24 | 6.61 ± 2.22 | 4.58 ± 1.52 | 5.73 ± 2.16 | 4.03 ± 1.34 | 6.38 ± 2.07 |
| Long chain n–3 PUFAs, mg/d | 255.7 ± 0.2 | 381.1 ± 0.2 | 316.7 ± 0.2 | 310.6 ± 0.2 | 225.1 ± 0.1 | 420.3 ± 0.2 |
| MUFA:SFA ratio | 0.93 ± 0.16 | 1.08 ± 0.23 | 0.97 ± 0.17 | 1.01 ± 0.22 | 0.90 ± 0.16 | 1.08 ± 0.21 |
| Sodium, g/d | 1.20 ± 0.63 | 1.10 ± 0.51 | 1.22 ± 0.57 | 1.00 ± 0.46 | 0.89 ± 0.45 | 1.35 ± 0.59 |
Values are means ± SDs for continuous variables and n (%) for categorical variables. AHEI-2010, Alternate Healthy Eating Index-2010; aMED, alternate Mediterranean diet; DASH, Dietary Approaches to Stop Hypertension; Q, quintile; SSB, sugar-sweetened beverage.
Secondary school or higher education level.
Physical activities were defined as ≥2 h of moderate activity per week or ≥30 min of strenuous activities per week.
Food intakes are reported as servings per day: 1 serving of whole grains is 16 g; fruits is 1 medium piece; vegetables is 67 g; nuts is 28 g nuts or 1 tablespoon (16 g) of peanut butter and legumes is 1 medium-size tofu item; dairy is 250 mL or 1 cup of milk; fish is 90 g; red meat is either 113.4 g fresh meat or 42.5 g processed meat; and SSBs/fruit juice is 1 glass of soda or 1 glass, packet, or typical local portion of fruit juice. 1 cup = 237 mL.
Percentage of energy excluding energy provided by alcohol.
During a mean ± SD follow-up of 17.5 ± 5.5 y, we documented 1026 incident ESKD cases. In Model 1, all dietary pattern scores were associated with lower risk of ESKD in a dose-response manner, but only the inverse association of the DASH dietary pattern score reached statistical significance. After additional adjustment for baseline history of hypertension and diabetes in Model 2, for all 3 dietary patterns the associations between higher adherence and a lower risk of ESKD reached statistical significance in a dose-response manner (all P-trend ≤ 0.004). Compared with the lowest quintiles, the multivariable-adjusted HRs (95% CIs) of ESKD for the highest quintiles were 0.75 (0.61, 0.92) for AHEI-2010, 0.67 (0.54, 0.84) for DASH, and 0.73 (0.59, 0.91) for aMED. With each 1-SD increment in the dietary pattern scores, the HRs (95% CIs) of ESKD in Model 2 were 0.90 (0.84, 0.96) for AHEI-2010, 0.88 (0.83, 0.94) for DASH, and 0.90 (0.84, 0.97) for aMED (Table 2).
TABLE 2.
Risk of end-stage kidney disease according to quintiles of dietary pattern scores in the Singapore Chinese Health Study1
| Dietary pattern scores, in quintile | Median score (range) | Cases/person-years | Model 1 | Model 2 |
|---|---|---|---|---|
| HR (95% CI) | HR (95% CI) | |||
| AHEI-2010 | ||||
| Q1 | 37.9 (17.0–41.0) | 210/196,368 | 1.00 | 1.00 |
| Q2 | 43.1 (41.1–45.0) | 235/199,880 | 1.08 (0.90, 1.30) | 1.01 (0.84, 1.22) |
| Q3 | 46.7 (45.1–48.5) | 203/204,598 | 0.92 (0.76, 1.12) | 0.87 (0.71, 1.06) |
| Q4 | 50.4 (48.6–52.7) | 194/206,388 | 0.91 (0.74, 1.11) | 0.81 (0.67, 0.99) |
| Q5 | 56.0 (52.8–75.9) | 184/211,203 | 0.87 (0.71, 1.07) | 0.75 (0.61, 0.92) |
| P-trend | 0.06 | 0.001 | ||
| Per SD (7.30) | 1026/1,018,436 | 0.95 (0.89, 1.01) | 0.90 (0.84, 0.96) | |
| DASH | ||||
| Q1 | 19 (8–20) | 220/204,300 | 1.00 | 1.00 |
| Q2 | 22 (21–23) | 274/256,078 | 0.97 (0.81, 1.16) | 0.92 (0.77, 1.10) |
| Q3 | 24 (24–25) | 203/180,854 | 1.04 (0.86, 1.26) | 0.96 (0.79, 1.17) |
| Q4 | 27 (26–28) | 197/211,957 | 0.87 (0.71, 1.06) | 0.81 (0.66, 0.98) |
| Q5 | 30 (29–39) | 132/165,248 | 0.77 (0.62, 0.97) | 0.67 (0.54, 0.84) |
| P-trend | 0.01 | <0.001 | ||
| Per SD (4.31) | 1026/1,018,436 | 0.92 (0.86, 0.98) | 0.88 (0.83, 0.94) | |
| aMED | ||||
| Q1 | 2 (0–2) | 232/203,014 | 1.00 | 1.00 |
| Q2 | 3 (3–3) | 220/197,140 | 1.02 (0.85, 1.23) | 0.97 (0.81, 1.17) |
| Q3 | 4 (4–4) | 225/215,883 | 1.00 (0.83, 1.21) | 0.93 (0.77, 1.12) |
| Q4 | 5 (5–5) | 185/196,242 | 0.95 (0.78, 1.16) | 0.85 (0.69, 1.04) |
| Q5 | 6 (6–8) | 164/206,156 | 0.85 (0.69, 1.06) | 0.73 (0.59, 0.91) |
| P-trend | 0.14 | 0.004 | ||
| Per SD (1.68) | 1026/1,018,436 | 0.95 (0.89, 1.02) | 0.90 (0.84, 0.97) | |
1Model 1 was adjusted for age at recruitment (y), sex (male, female), dialect (Cantonese, Hokkien), education level (no formal education, primary school, secondary school or higher), year of interview (1993–1995, 1996–1998), BMI (kg/m2), hours per week of moderate activity (<0.5 h, 0.5–2 h, 2–4 h, 4–7 h, ≥7 h), smoking status (never, ever smoked ≤ 19 cigarettes/d, ever smoked 20–39 cigarettes/d, and ever smoked ≥ 40 cigarettes/d), total energy intake (kcal/d), coffee consumption (none to <1 cup/d, 1 cup/d, ≥2 cups/d), incense use (current, noncurrent), sleep duration (≤5 h, 6 h, 7 h, 8 h, ≥9 h), and alcohol use (none, monthly to weekly, 1 drink/d, ≥2 drinks/d). Model 2 was adjusted for the variables listed in Model 1 + self-reported history of physician-diagnosed hypertension and diabetes. AHEI-2010, Alternate Healthy Eating Index-2010; aMED, alternate Mediterranean diet; DASH, Dietary Approaches to Stop Hypertension; Q, quintile.
We did not find significant interactions between sex, cigarette smoking, or presence of diabetes or hypertension, and any of the 3 dietary pattern scores on ESKD risk (Supplemental Table 1). We also assessed the association between these dietary pattern scores and risk of ESKD across 4 ordinal categories of increasing BMI. The results showed that the inverse association between diet scores and ESKD risk was stronger with increasing BMI; compared with those in lower BMI categories, the HRs for the diet–ESKD association were lowest in the obese (BMI ≥ 27.5), followed by the overweight (BMI = 25 to <27.5) participants. In the BMI ≥ 27.5 category, per 1-SD increment in the dietary pattern scores, the HRs (95% CIs) of ESKD were 0.79 (0.67, 0.92) for AHEI-2010, 0.81 (0.69, 0.95) for DASH, and 0.75 (0.63, 0.89) for aMED (Figure 1). This interaction between BMI and dietary score on ESKD risk was statistically significant for the AHEI-2010 (P-interaction = 0.03) and aMED scores (P-interaction = 0.004), and of borderline statistical significance for DASH (P-interaction = 0.06).
FIGURE 1.
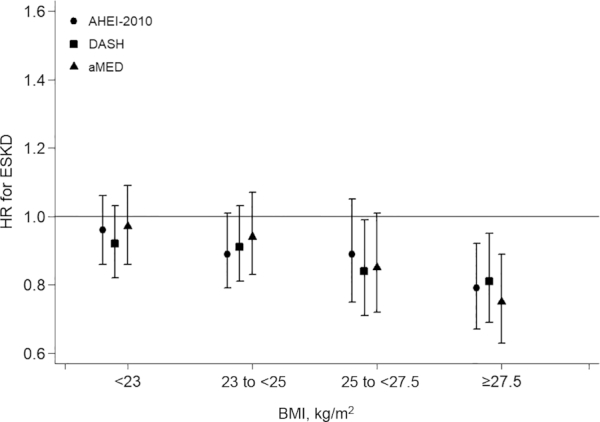
AHEI-2010, DASH, and aMED in relation to risk of ESKD across ordinal categories of increasing BMI (<23, 23 to <25, 25 to <27.5, and ≥27.5 kg/m2) (n = 56,985). HRs were adjusted for age, sex, dialect, education level, year of interview, hours per week of moderate activity, smoking status, total energy intake, coffee consumption, incense use, sleep duration, alcohol use, physician-diagnosed hypertension, and diabetes. AHEI-2010, Alternate Healthy Eating Index-2010; aMED, alternate Mediterranean diet; DASH, Dietary Approaches to Stop Hypertension; ESKD, end-stage kidney disease.
The results of the component analysis showed that the consumption of red meat (fresh or processed) was significantly associated with a higher risk of ESKD, whereas the consumption of nuts and legumes was significantly associated with a lower risk of ESKD in all 3 dietary scores. No significant association was found for other components in relation to risk of ESKD. Taking the DASH score as an example, the HR (95% CI) of ESKD for a 1-serving increment of red meat (fresh or processed) intake was 1.59 (1.13, 2.23), whereas for a 1-serving increment of nuts and legumes it was 0.83 (0.73, 0.95) (Figure 2).
FIGURE 2.

Relation between components of DASH and risk of end-stage kidney disease in the Singapore Chinese Health Study (n = 56,985). One serving of whole grains is 16 g; 1 serving of fruits is 1 medium piece; 1 serving of vegetables is 67 g; 1 serving of nuts is 28 g nuts or 1 tablespoon (16 g) of peanut butter and 1 serving of legumes is 1 medium-size tofu item; 1 serving of dairy is 250 mL or 1 cup of milk; 1 serving of fish is 90 g; 1 serving of red meat is either 113.4 g fresh meat or 42.5 g processed meat; 1 serving of SSBs/fruit juice is 1 glass of soda or 1 glass, packet, or typical local portion of fruit juice; percentage of energy excludes energy provided by alcohol. HRs were adjusted for the confounders in Model 2 and also mutually adjusted for other components of the DASH score. DASH, Dietary Approaches to Stop Hypertension; SSB, sugar-sweetened beverage.
The results were generally robust in the separate sensitivity analyses that either excluded participants with <5 y of follow-up (Supplemental Table 2), included the alcohol intake component in the computation of the AHEI-2010 and aMED scores (Supplemental Table 3), or adjusted for smoking intensity (Supplemental Table 4). Similar results were obtained in models that further adjusted for sodium intake, ratio of dietary potassium to dietary sodium (Supplemental Table 5), fish intake, or total protein intake (Supplemental Table 6).
Discussion
In this population-based prospective cohort of Chinese adults, the AHEI-2010, DASH, and aMED dietary patterns were inversely associated with the risk of ESKD, and the observed inverse associations between these healthful dietary patterns and risk of ESKD were more pronounced among overweight or obese participants than among their leaner counterparts.
Our findings were consistent with those of previous studies, that adherence to healthy dietary patterns, namely the AHEI-2010, DASH, and Mediterranean diet, was associated with a lower risk of kidney function decline in Western populations. In the ARIC study that included ∼14,000 participants without impaired kidney function at baseline (eGFR ≥ 60 mL · min−1 · 1.73 m−2), greater adherence to the AHEI-2010 and aMED indexes was associated with 20% and 13% lower risk of CKD, respectively (22). The ARIC study also showed that the lowest tertile of DASH score was associated with a 16% higher risk of kidney disease than those in the highest tertile (20). Results from 2 other cohort studies with smaller sample sizes, the Uppsala Longitudinal Study of Adult Men of 1100 Swedish men with CKD and the Northern Manhattan study of 900 participants, also suggested that adherence to the Mediterranean diet was associated with a lower risk of kidney function decline (16, 17). A subgroup analysis from the US Nurses’ Health Study also found that women in the highest quartile of the DASH dietary pattern were associated with a lower risk of rapid decline in kidney function assessed by eGFR than were women in the lowest quartile of DASH score (19). Another cohort including 1534 urban-dwelling participants showed that lower adherence to the DASH diet was associated with a higher risk of faster eGFR decline among those with hypertension (21). The Tehran Lipid and Glucose Study, which was conducted in an Iranian population, also reported an inverse association of DASH and aMED in relation to risk of CKD (25, 26).
The 3 healthful dietary patterns examined in our study have considerable overlap and emphasize higher intake of healthy plant-based foods, such as nuts, legumes, vegetables, and fruits, and lower intake of red meat (fresh or processed). Intake of sugar-sweetened beverages and fruit juice, as well as sodium intake, was restricted in addition in AHEI-2010 and DASH. Furthermore, the component analysis in our study showed that the observed association between healthful dietary patterns and risk of ESKD in this study population was predominantly driven by low intake of red meat (fresh or processed) and high intake of nuts and legumes.
Higher-quality diet has been associated with a reduced risk of obesity and diabetes (14, 43, 44), which, in turn, have been established as risk factors for ESKD in this population (32, 37). Although we adjusted for BMI and history of diabetes at baseline as confounders in the model, we did not adjust for changes in BMI and status of diabetes during follow-up. Hence, it is possible that the inverse association between a high-quality diet and risk of ESKD could be partially mediated by the reduction in BMI or the reduced development of diabetes in those with higher dietary scores during follow-up.
Furthermore, the putative relation between adherence to these dietary patterns and a lower risk of ESKD might also gain biological plausibility via the following mechanisms. First, recent evidence suggests that dietary acid load, which is linked to systemic inflammation and reduced endothelial dysfunction, is associated with a higher risk of CKD. Dietary acid load can be lowered by greater intake of plant-based foods, such as fruits, vegetables, nuts, and legumes (45, 46). Second, experimental study has shown that high circulating trimethylamine N-oxide (TMAO) in the body can cause increased concentrations of the early kidney injury markers (kidney injury molecule 1) and various renal fibrosis markers (47), and a diet high in red meat has been associated with higher concentrations of TMAO from an increased gut microbiota–dependent metabolic pathway, enhanced dietary precursors, and decreased renal TMAO excretion (48). Furthermore, diets high in nuts are rich in omega-3 PUFAs, and the latter have anti-inflammatory properties that could attenuate the renal inflammatory response (49). Therefore, through these aforementioned pathways, these different dietary components may have direct effects in slowing decline in kidney function.
In our study, we detected a more pronounced inverse association of dietary pattern scores with risk of ESKD among those who were overweight or obese. Because obesity is a proinflammatory state with raised oxidative stress (50), we hypothesize that participants with higher BMI might benefit more from the anti-inflammatory effects of healthful dietary patterns. Moreover, because greater adiposity is associated with higher circulating TMAO concentrations (51), overweight participants may be more likely to benefit from a dietary pattern that reduces TMAO concentrations.
The strengths of this study were that ESKD endpoints were assessed objectively and the follow-up was virtually complete because of linkage with the nationwide Singapore Renal Registry (52). However, several potential limitations of our study deserve mention. First, the self-reported dietary intake was subject to measurement error and some misclassification was inevitable. However, given the prospective study design, such misclassification would probably be nondifferential in nature, which would then likely lead to an underestimation of the true associations between dietary patterns and risk of ESKD. Nevertheless, we acknowledge that such misclassification could still be more problematic in heavier individuals with higher risk of ESKD. Hence, we have included BMI as a covariate in all the analyses, and also examined its influence as an effect modifier in our study. Second, because diet data were based on a single assessment at baseline, subsequent changes in diet during follow-up were not captured. Nevertheless, in this cohort, among 39,528 cohort participants who responded to the follow-up 2 interviews conducted between 2006 and 2010, which was an average of 12.7 y after the baseline interviews, we had collected data on beverage consumption for a second time. We found that among this subcohort, for the consumption of tea, 85.6% of them had retained their status as daily or nondaily drinkers of black tea, and 85.2% of them had retained their status as daily or nondaily drinkers of green tea (53). For alcohol intake, 80.1% retained the frequency of consumption reported at baseline (54). This provided indirect evidence that dietary intake could be fairly stable after midlife in this cohort. Third, we did not measure kidney function and lipid biomarkers at recruitment, and were thus unable to adjust for these factors as potential confounders. Fourth, alcohol intake was excluded from the AHEI-2010 and aMED scores because daily drinking has been associated with a higher risk of ESKD in our study population (32). Nevertheless, in a sensitivity analysis, we included alcohol in the computation of the AHEI-2010 and aMED scores, as per the original articles, and the results were essentially unchanged. Finally, owing to the limitations of observational study design, residual confounding cannot be completely ruled out.
In conclusion, healthy dietary patterns as reflected by the AHEI-2010, DASH, and aMED scores were associated with a lower risk of ESKD among Chinese adults, especially for those who were overweight or obese. Our findings highlight the importance of public health and clinical programs targeting promotion of an overall healthful diet to reduce the risk of severe kidney disease in the general population.
Supplementary Material
ACKNOWLEDGEMENTS
We thank the Singapore Renal Registry for assistance with the identification of ESKD cases via database linkages. We are grateful to Ms. Siew-Hong Low of the National University of Singapore for supervising the fieldwork of the Singapore Chinese Health Study and Dr. Renwei Wang for the maintenance of the cohort study database. We acknowledge the founding Principal Investigator of the Singapore Chinese Health Study, Mimi C Yu.
The authors’ responsibilities were as follows—W-PK: designed and conducted the research with the other coauthors and has primary responsibility for the final content; NN and RMvD: calculated the dietary pattern scores; T-TG and W-PK: analyzed the data; T-TG, THJ, J-MY, RMvD, and W-PK: interpreted the statistical analysis; T-TG: wrote the paper with critical input from THJ, NN, J-MY, RMvD, and W-PK; and all authors: read and approved the final manuscript. The authors report no conflicts of interest.
Notes
Some of the data have previously been included in a meeting abstract published as “Healthful dietary patterns and risk of end-stage kidney disease: the Singapore Chinese Health Study,” Kidney International Reports 5(3, Supplement):S90, 1 March, 2020. DOI: 10.1016/j.ekir.2020.02.224.
Supported by NIH grants R01 CA144034 (to J-MY) and UM1 CA182876 (to J-MY).
Supplemental Figure 1 and Supplemental Tables 1–6 are available from the “Supplementary data” link in the online posting of the article and from the same link in the online table of contents at https://academic.oup.com/ajcn/.
Abbreviations used: AHEI-2010, Alternate Healthy Eating Index-2010; aMED, alternate Mediterranean diet; ARIC, Atherosclerosis Risk in Communities; CKD, chronic kidney disease; DASH, Dietary Approaches to Stop Hypertension; eGFR, estimated glomerular filtration rate; ESKD, end-stage kidney disease; SCHS, Singapore Chinese Health Study; TMAO, trimethylamine N-oxide.
Contributor Information
Ting-Ting Geng, Saw Swee Hock School of Public Health, National University of Singapore, Singapore.
Tazeen H Jafar, Health Services and Systems Research, Duke-NUS Medical School, Singapore; Department of Renal Medicine, Singapore General Hospital, Singapore.
Nithya Neelakantan, Saw Swee Hock School of Public Health, National University of Singapore, Singapore.
Jian-Min Yuan, Division of Cancer Control and Population Sciences, UPMC Hillman Cancer Center, University of Pittsburgh, Pittsburgh, PA, USA; Department of Epidemiology, Graduate School of Public Health, University of Pittsburgh, Pittsburgh, PA, USA.
Rob M van Dam, Saw Swee Hock School of Public Health, National University of Singapore, Singapore; Department of Medicine, Yong Loo Lin School of Medicine, National University of Singapore and National University Health System, Singapore; Department of Nutrition, Harvard TH Chan School of Public Health, Boston, MA, USA; Department of Epidemiology, Harvard TH Chan School of Public Health, Boston, MA, USA.
Woon-Puay Koh, Saw Swee Hock School of Public Health, National University of Singapore, Singapore; Health Services and Systems Research, Duke-NUS Medical School, Singapore.
Data Availability
Data described in the article, code book, and analytic code will be made available upon reasonable request.
References
- 1. Mills KT, Xu Y, Zhang W, Bundy JD, Chen C-S, Kelly TN, Chen J, He J. A systematic analysis of worldwide population-based data on the global burden of chronic kidney disease in 2010. Kidney Int. 2015;88(5):950–7. [DOI] [PMC free article] [PubMed] [Google Scholar]
- 2. Lew Q-LJ, Jafar TH, Koh HWL, Jin A, Chow KY, Yuan J-M, Koh W-P. Red meat intake and risk of ESRD. J Am Soc Nephrol. 2017;28(1):304–12. [DOI] [PMC free article] [PubMed] [Google Scholar]
- 3. Haring B, Selvin E, Liang M, Coresh J, Grams ME, Petruski-Ivleva N, Steffen LM, Rebholz CM. Dietary protein sources and risk for incident chronic kidney disease: results from the Atherosclerosis Risk in Communities (ARIC) study. J Ren Nutr. 2017;27(4):233–42. [DOI] [PMC free article] [PubMed] [Google Scholar]
- 4. Knight EL, Stampfer MJ, Hankinson SE, Spiegelman D, Curhan GC. The impact of protein intake on renal function decline in women with normal renal function or mild renal insufficiency. Ann Intern Med. 2003;138(6):460–7. [DOI] [PubMed] [Google Scholar]
- 5. Lin J, Hu FB, Curhan GC. Associations of diet with albuminuria and kidney function decline. Clin J Am Soc Nephrol. 2010;5(5):836–43. [DOI] [PMC free article] [PubMed] [Google Scholar]
- 6. Xiang H, Zhang H, Zhou M, Jiang S, Zhang L, Chen D, Liu Z. Phosphorus is an independent risk factor for the progression of diabetic nephropathy. Adv Clin Exp Med. 2018;27(9):1239–45. [DOI] [PubMed] [Google Scholar]
- 7. Mirmiran P, Yuzbashian E, Asghari G, Sarverzadeh S, Azizi F. Dietary fibre intake in relation to the risk of incident chronic kidney disease. Br J Nutr. 2018;119(5):479–85. [DOI] [PubMed] [Google Scholar]
- 8. Hu EA, Selvin E, Grams ME, Steffen LM, Coresh J, Rebholz CM. Coffee consumption and incident kidney disease: results from the Atherosclerosis Risk in Communities (ARIC) study. Am J Kidney Dis. 2018;72(2):214–22. [DOI] [PMC free article] [PubMed] [Google Scholar]
- 9. Lew Q-LJ, Jafar TH, Jin A, Yuan J-M, Koh W-P. Consumption of coffee but not of other caffeine-containing beverages reduces the risk of end-stage renal disease in the Singapore Chinese Health Study. J Nutr. 2018;148(8):1315–22. [DOI] [PMC free article] [PubMed] [Google Scholar]
- 10. Eslami O, Shidfar F. Dairy products and chronic kidney disease: protective or harmful? A systematic review of prospective cohort studies. Nutrition. 2018;55–56:21–8. [DOI] [PubMed] [Google Scholar]
- 11. van Dam RM, Rimm EB, Willett WC, Stampfer MJ, Hu FB. Dietary patterns and risk for type 2 diabetes mellitus in US men. Ann Intern Med. 2002;136(3):201–9. [DOI] [PubMed] [Google Scholar]
- 12. Hu FB. Dietary pattern analysis: a new direction in nutritional epidemiology. Curr Opin Lipidol. 2002;13(1):3–9. [DOI] [PubMed] [Google Scholar]
- 13. Neelakantan N, Koh W-P, Yuan J-M, van Dam RM. Diet-quality indexes are associated with a lower risk of cardiovascular, respiratory, and all-cause mortality among Chinese adults. J Nutr. 2018;148(8):1323–32. [DOI] [PMC free article] [PubMed] [Google Scholar]
- 14. Chen G-C, Koh W-P, Neelakantan N, Yuan J-M, Qin L-Q, van Dam RM. Diet quality indices and risk of type 2 diabetes mellitus: the Singapore Chinese Health Study. Am J Epidemiol. 2018;187(12):2651–61. [DOI] [PMC free article] [PubMed] [Google Scholar]
- 15. Chiavaroli L, Viguiliouk E, Nishi SK, Blanco Mejia S, Rahelić D, Kahleová H, Salas-Salvadó J, Kendall CW, Sievenpiper JL. DASH dietary pattern and cardiometabolic outcomes: an umbrella review of systematic reviews and meta-analyses. Nutrients. 2019;11(2):338. [DOI] [PMC free article] [PubMed] [Google Scholar]
- 16. Khatri M, Moon YP, Scarmeas N, Gu Y, Gardener H, Cheung K, Wright CB, Sacco RL, Nickolas TL, Elkind MS. The association between a Mediterranean-style diet and kidney function in the Northern Manhattan Study cohort. Clin J Am Soc Nephrol. 2014;9(11):1868–75. [DOI] [PMC free article] [PubMed] [Google Scholar]
- 17. Huang X, Jiménez-Moleón JJ, Lindholm B, Cederholm T, Ärnlöv J, Risérus U, Sjögren P, Carrero JJ. Mediterranean diet, kidney function, and mortality in men with CKD. Clin J Am Soc Nephrol. 2013;8(9):1548–55. [DOI] [PMC free article] [PubMed] [Google Scholar]
- 18. Chrysohoou C, Panagiotakos DB, Pitsavos C, Skoumas J, Zeimbekis A, Kastorini CM, Stefanadis C. Adherence to the Mediterranean diet is associated with renal function among healthy adults: the ATTICA study. J Ren Nutr. 2010;20(3):176–84. [DOI] [PubMed] [Google Scholar]
- 19. Lin J, Fung TT, Hu FB, Curhan GC. Association of dietary patterns with albuminuria and kidney function decline in older white women: a subgroup analysis from the Nurses’ Health Study. Am J Kidney Dis. 2011;57(2):245–54. [DOI] [PMC free article] [PubMed] [Google Scholar]
- 20. Rebholz CM, Crews DC, Grams ME, Steffen LM, Levey AS, Miller ER 3rd, Appel LJ, Coresh J. DASH (Dietary Approaches to Stop Hypertension) diet and risk of subsequent kidney disease. Am J Kidney Dis. 2016;68(6):853–61. [DOI] [PMC free article] [PubMed] [Google Scholar]
- 21. Liu Y, Kuczmarski MF, Miller ER, Nava MB, Zonderman AB, Evans MK, Powe NR, Crews DC. Dietary habits and risk of kidney function decline in an urban population. J Ren Nutr. 2017;27(1):16–25. [DOI] [PMC free article] [PubMed] [Google Scholar]
- 22. Hu EA, Steffen LM, Grams ME, Crews DC, Coresh J, Appel LJ, Rebholz CM. Dietary patterns and risk of incident chronic kidney disease: the Atherosclerosis Risk in Communities study. Am J Clin Nutr. 2019;110(3):713–21. [DOI] [PMC free article] [PubMed] [Google Scholar]
- 23. Liese AD, Nichols M, Sun X, D'Agostino RB Jr, Haffner SM. Adherence to the DASH diet is inversely associated with incidence of type 2 diabetes: the Insulin Resistance Atherosclerosis Study. Diabetes Care. 2009;32(8):1434–6. [DOI] [PMC free article] [PubMed] [Google Scholar]
- 24. Webster AC, Nagler EV, Morton RL, Masson P. Chronic kidney disease. Lancet. 2017;389(10075):1238–52. [DOI] [PubMed] [Google Scholar]
- 25. Asghari G, Farhadnejad H, Mirmiran P, Dizavi A, Yuzbashian E, Azizi F. Adherence to the Mediterranean diet is associated with reduced risk of incident chronic kidney diseases among Tehranian adults. Hypertens Res. 2017;40(1):96–102. [DOI] [PubMed] [Google Scholar]
- 26. Asghari G, Yuzbashian E, Mirmiran P, Azizi F. The association between Dietary Approaches to Stop Hypertension and incidence of chronic kidney disease in adults: the Tehran Lipid and Glucose Study. Nephrol Dial Transplant. 2017;32(suppl_2):ii224–ii30. [DOI] [PubMed] [Google Scholar]
- 27. Neelakantan N, Naidoo N, Koh W-P, Yuan J-M, van Dam RM. The Alternative Healthy Eating Index is associated with a lower risk of fatal and nonfatal acute myocardial infarction in a Chinese adult population. J Nutr. 2016;146(7):1379–86. [DOI] [PMC free article] [PubMed] [Google Scholar]
- 28. Wu J, Song X, Chen G-C, Neelakantan N, van Dam RM, Feng L, Yuan J-M, Pan A, Koh W-P. Dietary pattern in midlife and cognitive impairment in late life: a prospective study in Chinese adults. Am J Clin Nutr. 2019;110(4):912–20. [DOI] [PMC free article] [PubMed] [Google Scholar]
- 29. Hankin JH, Stram DO, Arakawa K, Park S, Low S-H, Lee H-P, Yu MC. Singapore Chinese Health Study: development, validation, and calibration of the quantitative food frequency questionnaire. Nutr Cancer. 2001;39(2):187–95. [DOI] [PubMed] [Google Scholar]
- 30. McCullough ML, Feskanich D, Stampfer MJ, Giovannucci EL, Rimm EB, Hu FB, Spiegelman D, Hunter DJ, Colditz GA, Willett WC. Diet quality and major chronic disease risk in men and women: moving toward improved dietary guidance. Am J Clin Nutr. 2002;76(6):1261–71. [DOI] [PubMed] [Google Scholar]
- 31. Chiuve SE, Fung TT, Rimm EB, Hu FB, McCullough ML, Wang M, Stampfer MJ, Willett WC. Alternative dietary indices both strongly predict risk of chronic disease. J Nutr. 2012;142(6):1009–18. [DOI] [PMC free article] [PubMed] [Google Scholar]
- 32. Geng T-T, Jafar TH, Yuan J-M, Koh W-P. The impact of diabetes on the association between alcohol intake and the risk of end-stage kidney disease in the Singapore Chinese Health Study. J Diabetes. 2020;12(8):583–93. [DOI] [PubMed] [Google Scholar]
- 33. Fung TT, Chiuve SE, McCullough ML, Rexrode KM, Logroscino G, Hu FB. Adherence to a DASH-style diet and risk of coronary heart disease and stroke in women. Arch Intern Med. 2008;168(7):713–20. [DOI] [PubMed] [Google Scholar]
- 34. Trichopoulou A, Costacou T, Bamia C, Trichopoulos D. Adherence to a Mediterranean diet and survival in a Greek population. N Engl J Med. 2003;348(26):2599–608. [DOI] [PubMed] [Google Scholar]
- 35. Fung TT, Hu FB, McCullough ML, Newby PK, Willett WC, Holmes MD. Diet quality is associated with the risk of estrogen receptor–negative breast cancer in postmenopausal women. J Nutr. 2006;136(2):466–72. [DOI] [PubMed] [Google Scholar]
- 36. National Registry of Diseases Office (NRDO) . Singapore Renal Registry Annual Report 2015. [Internet]. Singapore: NRDO; 2016; [cited 20 March, 2018]. Available from: https://www.nrdo.gov.sg/docs/librariesprovider3/default-document-library/singapore-renal-registry-annual-report-2015.pdf?sfvrsn=0. [Google Scholar]
- 37. Lew QJ, Jafar TH, Talaei M, Jin A, Chow KY, Yuan J-M, Koh W-P. Increased body mass index is a risk factor for end-stage renal disease in the Chinese Singapore population. Kidney Int. 2017;92(4):979–87. [DOI] [PMC free article] [PubMed] [Google Scholar]
- 38. Jin A, Koh W-P, Chow KY, Yuan J-M, Jafar TH. Smoking and risk of kidney failure in the Singapore Chinese Health Study. PLoS One. 2013;8(5):e62962. [DOI] [PMC free article] [PubMed] [Google Scholar]
- 39. Jafar TH, Jin A, Koh W-P, Yuan J-M, Chow KY. Physical activity and risk of end-stage kidney disease in the Singapore Chinese Health Study. Nephrology. 2015;20(2):61–7. [DOI] [PMC free article] [PubMed] [Google Scholar]
- 40. Geng T-T, Jafar TH, Yuan J-M, Koh W-P. Sleep duration and risk of end-stage renal disease: the Singapore Chinese Health Study. Sleep Med. 2019;54:22–7. [DOI] [PMC free article] [PubMed] [Google Scholar]
- 41. Geng T-T, Jafar TH, Yuan J-M, Koh W-P. Long-term incense use and the risk of end-stage renal disease among Chinese in Singapore: the Singapore Chinese health study. BMC Nephrol. 2019;20(1):9. [DOI] [PMC free article] [PubMed] [Google Scholar]
- 42. WHO expert consultation . Appropriate body-mass index for Asian populations and its implications for policy and intervention strategies. Lancet. 2004;363(9403):157–63. [DOI] [PubMed] [Google Scholar]
- 43. Medina-Remón A, Kirwan R, Lamuela-Raventós RM, Estruch R. Dietary patterns and the risk of obesity, type 2 diabetes mellitus, cardiovascular diseases, asthma, and neurodegenerative diseases. Crit Rev Food Sci Nutr. 2018;58(2):262–96. [DOI] [PubMed] [Google Scholar]
- 44. Fung TT, Rimm EB, Spiegelman D, Rifai N, Tofler GH, Willett WC, Hu FB. Association between dietary patterns and plasma biomarkers of obesity and cardiovascular disease risk. Am J Clin Nutr. 2001;73(1):61–7. [DOI] [PubMed] [Google Scholar]
- 45. Sebastian A, Frassetto LA, Sellmeyer DE, Merriam RL, Morris RC Jr. Estimation of the net acid load of the diet of ancestral preagricultural Homo sapiens and their hominid ancestors. Am J Clin Nutr. 2002;76(6):1308–16. [DOI] [PubMed] [Google Scholar]
- 46. Rebholz CM, Coresh J, Grams ME, Steffen LM, Anderson CA, Appel LJ, Crews DC. Dietary acid load and incident chronic kidney disease: results from the ARIC study. Am J Nephrol. 2015;42(6):427–35. [DOI] [PMC free article] [PubMed] [Google Scholar]
- 47. Tang WH, Wang Z, Kennedy DJ, Wu Y, Buffa JA, Agatisa-Boyle B, Li XS, Levison BS, Hazen SL. Gut microbiota-dependent trimethylamine N-oxide (TMAO) pathway contributes to both development of renal insufficiency and mortality risk in chronic kidney disease. Circ Res. 2015;116(3):448–55. [DOI] [PMC free article] [PubMed] [Google Scholar]
- 48. Wang Z, Bergeron N, Levison BS, Li XS, Chiu S, Jia X, Koeth RA, Li L, Wu Y, Tang WHWet al. Impact of chronic dietary red meat, white meat, or non-meat protein on trimethylamine N-oxide metabolism and renal excretion in healthy men and women. Eur Heart J. 2019;40(7):583–94. [DOI] [PMC free article] [PubMed] [Google Scholar]
- 49. Chen X, Chen C, Fan S, Wu S, Yang F, Fang Z, Fu H, Li Y. Omega-3 polyunsaturated fatty acid attenuates the inflammatory response by modulating microglia polarization through SIRT1-mediated deacetylation of the HMGB1/NF-κB pathway following experimental traumatic brain injury. J Neuroinflammation. 2018;15(1):116. [DOI] [PMC free article] [PubMed] [Google Scholar]
- 50. Dandona P, Aljada A, Bandyopadhyay A. Inflammation: the link between insulin resistance, obesity and diabetes. Trends Immunol. 2004;25(1):4–7. [DOI] [PubMed] [Google Scholar]
- 51. Schugar RC, Shih DM, Warrier M, Helsley RN, Burrows A, Ferguson D, Brown AL, Gromovsky AD, Heine M, Chatterjee Aet al. The TMAO-producing enzyme flavin-containing monooxygenase 3 regulates obesity and the beiging of white adipose tissue. Cell Rep. 2017;19(12):2451–61. [DOI] [PMC free article] [PubMed] [Google Scholar]
- 52. National Registry of Diseases Office (NRDO) . Singapore Renal Registry Annual Registry Report 1999-2013 (Preliminary). [Internet]. Singapore: NRDO; 2014; [cited 20 March, 2018]. Available from: https://www.nrdo.gov.sg/docs/librariesprovider3/Publications—Kidney-Failure/singapore-renal-registry-annual-registry-report-1999-2013-preliminary.pdf?sfvrsn=0. [Google Scholar]
- 53. Soh AZ, Pan A, Chee CBE, Wang Y-T, Yuan J-M, Koh W-P. Tea drinking and its association with active tuberculosis incidence among middle-aged and elderly adults: the Singapore Chinese Health Study. Nutrients. 2017;9(6):544. [DOI] [PMC free article] [PubMed] [Google Scholar]
- 54. Soh AZ, Chee CBE, Wang Y-T, Yuan J-M, Koh W-P. Alcohol drinking and cigarette smoking in relation to risk of active tuberculosis: prospective cohort study. BMJ Open Resp Res. 2017;4(1):e000247. [DOI] [PMC free article] [PubMed] [Google Scholar]
Associated Data
This section collects any data citations, data availability statements, or supplementary materials included in this article.
Supplementary Materials
Data Availability Statement
Data described in the article, code book, and analytic code will be made available upon reasonable request.