

Abstract
Objectives:
Because African Americans are at elevated risk for cognitive decline and Alzheimer’s disease, it is important to understand which health and lifestyle factors are most important for reducing this risk. Obesity and poor sleep quality are common in lower-income, urban African Americans and have been linked to cognitive decline in older age. Fortunately, increasing aerobic fitness via regular exercise can improve cognitive function. This study sought to (1) examine the cross-sectional relationship between aerobic fitness and cognitive function in older African Americans, and (2) determine whether body mass index and sleep quality moderated the relationship between aerobic fitness and cognition.
Design:
402 urban African Americans, ages 60 to 90 (84% female, mean education level = 14 years) completed neuropsychological testing, computerized behavioral tasks, physical performance measures, and health and lifestyle questionnaires. Hierarchical linear regressions were performed to determine associations between aerobic fitness and cognition and whether body mass index and sleep quality moderate the fitness-cognition relationship while controlling for age, sex, education, depressive symptoms, and literacy.
Results:
Higher aerobic fitness levels were significantly associated with better executive function. The relationships between fitness and hippocampal-dependent cognitive functions (learning and memory, generalization) were attenuated in those who are obese (body mass index ≥ 30 kg/m2) or rated their sleep quality as poor, ps < .05.
Conclusion:
Our results suggest that while exercise and associated improvements in aerobic fitness are key for improved cognition, these benefits are maximized in those who maintain low body weight and get sufficient, high quality sleep. Exercise programs for older African Americans will be most effective if they are integrated with education programs that emphasize healthy eating, weight control, and sleep hygiene and conceptualize individuals as part of their broader social and environmental context.
Keywords: aerobic fitness, cognition, African Americans, older adults, body mass index, sleep
Introduction
Although African Americans have over twice the risk of accelerated cognitive decline and Alzheimer’s disease (AD) as compared to non-Hispanic white counterparts (Mehta and Yeo 2017), the reasons for this racial disparity remain poorly understood. Some modifiable environmental and psychosocial risk factors including education, literacy, stress, perceived discrimination, and socioeconomic circumstances appear to contribute to this disparity (Barnes and Bennett 2014). Further, a burgeoning body of literature demonstrates cardiovascular conditions such as hypertension, hypercholesterolemia, diabetes and often comorbid health concerns (e.g., obesity and sleep deficiencies) are more prevalent in African Americans and may partly explain the racial disparities in AD (Obisesan et al. 2012, Smith et al. 2011, Gamaldo, Allaire, and Whitfield 2010, 2008). Fortunately, higher aerobic fitness may confer neurocognitive protection in older adults (Erickson et al. 2009). However, one crucial barrier to progress is determining the synergistic influence of other health factors on the neuroprotective effects of aerobic fitness in older African Americans. Uncovering these relationships may help optimize strategies for preventing cognitive decline in this high-risk population.
Aerobic Fitness and Cognition
A higher level of aerobic fitness, also known as cardiorespiratory or cardiovascular fitness, is associated with better cognitive function in older adults (Hayes, Forman, and Verfaellie 2016) and is most commonly measured by VO2max. VO2max reflects an individual’s capacity to take up, transport, and use oxygen in the body during intense aerobic exercise. VO2max declines with advancing age at a rate of about 10% per decade (Kaminsky et al. 2017). Cross-sectional studies in older adults report a protective effect of higher aerobic fitness on various aspects of cognition including learning and memory (Szabo et al. 2011, Izquierdo-Porrera and Waldstein 2002, Freudenberger et al. 2016, Hayes, Forman, and Verfaellie 2016), executive function (Izquierdo-Porrera and Waldstein 2002, Freudenberger et al. 2016, Hayes, Forman, and Verfaellie 2016), and psychomotor skills (Freudenberger et al. 2016). Similarly, longitudinal studies demonstrate links between higher baseline aerobic fitness and less age-related cognitive decline (Wendell et al. 2014). Overall, the literature suggests that higher fitness has selective neuroprotective effects in older age, most consistently in the domains of memory and executive function.
However, these aforementioned relationships have been identified in predominantly older non-Hispanic white samples with little research conducted on the relationship between aerobic fitness and cognitive function among African Americans. One cross-sectional study of 43 African Americans examined the association between peak VO2 and cognitive function. Peak VO2, another measure of aerobic fitness that is highly correlated with VO2max, was assessed via a graded exercise test that was terminated upon maximal fatigue (Izquierdo-Porrera and Waldstein 2002). The investigators found a significant association between lower levels of peak VO2 and poorer delayed memory and executive function performance (Izquierdo-Porrera and Waldstein 2002). These findings were limited by a small sample and a wide age range (43 to 82 years). Thus, within-group variations in aerobic fitness and how they relate to facets of cognitive function in older African Americans remain relatively unexplored.
On average, and across a wide range of ages, African Americans show lower levels of aerobic fitness (VO2max) than non-Hispanic whites (Swift et al. 2013). This racial difference is hypothesized to be due, in part, to environmental and physiological factors. For example, environmental factors such as inadequate neighborhood walkability and limited access to safe and affordable exercise resources are associated with reduced cardiorespiratory fitness and physical activity in older urban-dwelling adults (Parks, Housemann, and Brownson 2003). Some research, however, has reported physiological differences between whites and blacks/Africans (of both American and African descent) for the muscles to generate energy from oxygen (Swift et al. 2013). As compared to age-, gender-, and body mass index-matched whites, college-age African Americans males, sedentary adult black African males, and obese adult African American women have lower proportions of type I “slow-twitch” muscle fibers which are useful for endurance type activities including aerobic exercise but higher proportions of type II “fast-twitch” muscle fibers useful for more intense, but shorter duration activities such as sprinting (Duey et al. 1997, Tanner et al. 2002, Ama et al. 1986). Further, African Americans have, on average, lower concentrations of hemoglobin, an oxygen transport protein, which could potentially lead to a reduced ability to deliver oxygen to working muscles during intense aerobic exercise (Pivarnik et al. 1995, Hunter et al. 2001). Importantly, however, age, race, and initial aerobic fitness levels have shown little bearing on responsiveness to aerobic exercise training (i.e., exercise-related improvements in VO2max levels) (Skinner et al. 2001). Rather, other modifiable factors, such as obesity, may impact aerobic fitness levels and responsiveness to aerobic training.
BMI and Cognition
Obesity, a serious and growing concern in the United States, is assessed using the body mass index (BMI), the ratio of weight to height, with 30 kg/m2 or greater indicating obesity (Bryant, Ford, and Kim 2014, Smith et al. 2011). Almost 50% of African Americans over the age of 60 are obese, as compared to approximately 30% of same age non-Hispanic whites (Carnethon et al. 2017). Although physical activity and diet have been implicated as major lifestyle contributors to obesity overall (Wadden et al. 2012), modifiable environmental (e.g., grocery store density, food insecurity, neighborhood walkability) and social factors (e.g., socioeconomic status, education, cultural perceptions of overweight, perceived stress) may further drive the disproportionate obesity burden among African Americans (Rundle et al. 2009, Becker et al. 1999, for a review, see Wyatt, Winters, and Dubbert 2006). Epigenetics (prenatal, perinatal, and early childhood conditions that affect genetic expression) and to a lesser extent, genetics, may also partially explain obesity disparities (Krueger and Reither 2015). Thus, multiple mechanisms spanning lifestyle, environmental, social, and biological factors may account for racial disparities in obesity.
The relationship between late-life obesity and cognition is equally complex. Some studies demonstrate that higher BMI can be either protective or detrimental to cognition. One longitudinal study found, across races, a lower baseline BMI predicts faster cognitive decline in global cognition and memory six years later (Arvanitakis et al. 2018), consistent with findings that late-life weight loss is a precursor to AD (Johnson, Wilkins, and Morris 2006). However, in one cross-sectional study, non-Hispanic whites showed a positive relationship between BMI and cognition: as BMI increased from underweight up through and including obesity, performance on a broad cognitive screening measure increased (Bryant, Ford, and Kim 2014). Among older African Americans, there was a non-monotonic relationship between BMI and cognition: While researchers found a positive relationship between BMI and cognition for those who are non-obese (BMI < 30 kg/m2), higher levels of BMI beyond that level were associated with poorer cognitive performance (Bryant, Ford, and Kim 2014). Indeed, other research suggests in addition to BMI, indicators of body fat distribution (e.g., waist-to-hip ratio, trunk-to-leg ratio) may vary across ethnicity and race leading to disparate findings in health outcomes among subpopulations (Rush et al. 2007). Thus, the literature on obesity and cognition appears to be mixed and influenced by race and study design (Smith et al. 2011). Many previous studies use global measures of cognition rather than domain-specific cognitive function (e.g., memory, executive function). Obesity may be proxied by BMI and other anthropomorphic measures such as waist circumference or waist-to-hip ratio. In addition, there may be cultural and educational variations across races that differentially affect some assessment tools for cognition.
In general, the literature shows contradictory findings on the relationship between obesity and cognition, especially in older adults. Some research suggests an inverted ‘U’-shaped function such that older individuals with extreme BMIs (i.e., very low or very high BMI) have poorer cognition. Other studies report higher BMI is protective against cognitive decline overall (Kuo et al. 2006) or is a risk factor for cognitive dysfunction and AD (Gustafson et al. 2003). Because of the continued rise in obesity rates nationwide, it is important to better understand the impact of obesity on cognition, especially in older African Americans who are at elevated risk for age-related cognitive decline and AD.
In addition, whether obesity influences the aforementioned neuroprotective effects of aerobic fitness needs to be clarified. Prior research indicates that the benefits of aerobic fitness for cognition might be nonexistent or attenuated in individuals with higher BMI (Wang et al. 2016). However, other research suggests that regardless of BMI, individuals who are obese benefit from increased aerobic fitness levels (Lee, Blair, and Jackson 1999). One study among obese older adults found that aerobic fitness accounted for significant variance in processing speed and executive function, suggesting that obesity does not preclude the neuroprotective effects of aerobic fitness (Bugg et al. 2012). While obesity may impact the ability to engage in physical activity, thereby reducing aerobic fitness, research suggests obesity alone has unique effects on cognition in older age (for a review, see Chan, Yan, and Payne 2013). Intervention development for the promotion of brain health may benefit from improved understanding of the role of obesity and its interaction with aerobic fitness on cognitive function, especially within populations disproportionately affected by both obesity and AD such as African Americans.
Sleep Quality and Cognition
Similar to obesity, sleep deficiencies are prevalent among minorities (Ruiter et al. 2010), especially those living in urban areas (Zanobetti et al. 2010). In addition, sleep deficiencies are increasingly common with age (Mander, Winer, and Walker 2017). The term “sleep deficiencies” encompasses three dimensions of sleep: poor sleep quality, insufficient or overly long sleep duration, and irregular timing of sleep (Jackson et al. 2020). There is strong evidence for racial/ethnic sleep health disparities, even in the absence of diagnosed or suspected sleep disorders (Ruiter et al. 2010), and a growing appreciation that sleep health disparities share common causal pathways with other health disparities across multiple contexts spanning the individual (e.g., physical activity), environmental (e.g., urban vs. rural residence; light, noise, and air pollution), and social contexts (e.g., education, occupation, perceived stress) (Jackson et al. 2020). Such contexts interact with each other, usually persist through the life course, and ultimately amplify sleep health disparities beyond the influence of individual determinants alone. Indeed, a recent population-based study (N = 398,382 U.S. adults) suggests that sleep health disparities are actually widening, with African Americans showing greater increases in short sleep duration prevalence from 2004 to 2017 as compared to white Americans (Sheehan et al. 2019).
Across large-scale epidemiological, cross-sectional, and longitudinal studies in predominantly white samples, sleep deficiencies are associated with worse cognitive functioning and increased risk for cognitive decline in older adults (for a recent review, see Dzierzewski, Dautovich, and Ravyts 2018). In two studies examining the sleep-cognition relationship among older African Americans, individuals who self-reported problems falling asleep as well as those with greater self-reported fluctuations in their normal sleep duration (measured by the Pittsburgh Sleep Quality Index) showed poorer memory and global cognitive performance (Gamaldo, Allaire, and Whitfield 2008, 2010). Thus, there is increasing evidence suggesting that self-reported sleep deficiencies negatively impact cognition in older African Americans.
In addition, lifetime sleep deficiencies, even in the absence of a diagnosed sleep disorder, may negatively impact the ability to reap the aforementioned neuroprotective benefits of aerobic exercise and fitness. There is evidence suggesting that individuals with poor sleep quality have lower fitness levels (Strand et al. 2013). Although the mechanisms linking sleep, fitness, and cognition remain uncertain, one hypothesis purports that high quality sleep helps replenish oxyhemoglobin saturation in the brain, resulting in improved cognition (Garcia and Gunstad 2016). In addition, higher aerobic fitness is associated with better cerebral blood flow through angiogenesis (growth of capillaries), which in turn, also confers neurocognitive protection (Etnier et al. 2006). Given their hypothesized disparate mechanisms, studying the independent and combined influence of fitness and sleep quality on cognition in older African Americans may be particularly timely given the aforementioned high (and increasing) prevalence of sleep deficiencies, low levels of aerobic fitness, and disproportionately higher AD risk observed in this subpopulation.
Purpose of the Study
The current study examined the relationship between aerobic fitness and cognitive function in older African Americans across several functional domains: learning and memory, attention and speed, executive function, language fluency. We also related variations in aerobic fitness to the ability to generalize past learning to novel task demands using performance on a concurrent discrimination and transfer task (Myers et al. 2002). In previous studies, we demonstrated that this generalization task selectively engages the hippocampus, a brain region directly altered by increased levels of aerobic fitness among older adults, and an early site of brain pathology in preclinical Alzheimer’s disease (Erickson et al. 2009). Because this task is based on non-verbal conditioning paradigms – and is less sensitive to variations in education level, education quality, and literacy as compared to standardized neuropsychological assessments of memory – it has particular utility in populations with lower levels and lower quality of education, including older lower-income, urban-residing minority populations (Rentz et al. 2013). In addition, we sought to determine whether BMI and sleep quality moderated the relationships between aerobic fitness and cognition.
Materials and Methods
Participants
Participants were drawn from an ongoing study at Rutgers University–Newark, Pathways to Healthy Aging in African Americans, which investigates cross-sectional links between aerobic fitness, cognition, health, and lifestyle variations in older urban African Americans. Participants were recruited through efforts by the Aging and Brain Health Alliance, a university-community partnership fostered over 14 years of ongoing community engagement, health education, and service. Long-standing community partners include leadership and members of local churches, senior centers, public and subsidized housing, and health and wellness organizations that serve Greater Newark, NJ. Recruitment methods are described in more detail elsewhere (Gluck, Shaw, and Hill 2018).
To be eligible for inclusion in the present analyses, participants 1) identified as black or African American; 2) were aged 60 years or older and 3) had intact mental status with a Mini-Mental State Examination (MMSE) score of 24 or above so as to exclude individuals with cognitive impairment including possible dementia. Exclusion criteria were as follows: diagnosis of any neurodegenerative disorders; diagnosis of any sleep disorders (e.g., sleep apnea, chronic insomnia) as the interest in the current study was normative sleep in older African Americans; diagnosis of a learning disability; excessive alcohol and/or recreational drug use; taking medications typically prescribed for dementia such as Razadyne, Aricept, Exelon, Namzaric, or Namenda; had a medical procedure that required general anesthesia in the past three months; inability to see a computer screen at normal viewing distance; and color blindness (because some of the cognitive tasks used colors as discriminative cues).
At the time of data extraction, 466 African Americans residing in Greater Newark, NJ and between the ages of 52 and 91 (M = 68.32, SD = 7.04) were screened for participation. The mean education level was 13.92 (SD = 2.36) and about 82% of the screened individuals were female. Fifty-one individuals were excluded based on age and 13 individuals had MMSE scores below 24. The resulting analytic sample included 402 participants. See Table 1 for demographics of the sample. Participants provided written informed consent at enrollment. Ethical approval was granted by the Rutgers University–Newark institutional review board.
Table 1.
Descriptive Statistics of Analytic Sample (N = 402)
| Variable | Mean (n) | SD (%) |
|---|---|---|
| Age (years) | 69.65 | 6.01 |
| Sex (female) | (337) | (83.80) |
| Education (years) | 14.08 | 2.33 |
| NAART (errors) | 36.83 | 11.32 |
| MMSE (24-30 points) | 27.86 | 1.53 |
| BDI-II (0-63 points) | 7.73 | 6.36 |
| VO2max | 14.63 | 2.44 |
| BMI (kg/m2) | 33.82 | 23.94 |
| Sleep Quality | ||
| Very Poor | (12) | (3.00) |
| Poor | (73) | (18.40) |
| Satisfactory | (173) | (43.60) |
| Good | (109) | (27.50) |
| Very Good | (30) | (7.60) |
Note. MMSE = Mini-Mental State Examination; NAART = North American Adult Reading Test; BDI-II = Beck Depression Inventory-II, n = 394; VO2max = Maximal O2 uptake in mL/kg/min, n = 392; BMI = Body Mass Index in kg/m2, n = 400; Sleep Quality = Rate your usual sleep quality (1 = Very Poor to 5 = Very Good), n = 397.
Procedure
Candidates were telephone screened to determine initial eligibility. Those potentially eligible were individually assessed at Rutgers University–Newark. Participants who provided their informed consent and passed in-person screening procedures (e.g., color blindness testing) proceeded with the full two-hour laboratory testing battery including neuropsychological testing, computerized behavioral tasks, physical performance measures, and health and lifestyle questionnaires.
Measures
Aerobic Fitness
An estimate of each participants’ aerobic fitness was derived from their Six-Minute Walk Test performance. The Six-Minute Walk Test is a reliable and validated low-cost field test to assess functional exercise capacity in older adults (test-retest reliability intraclass correlation = 0.95; Steffen, Hacker, and Mollinger 2002). Participants are instructed to walk back and forth along a flat, straight corridor for six minutes as quickly as possible without running. Total distance covered in meters is recorded after six minutes. The following equation is then applied to approximate each participants’ VO2max or maximum oxygen uptake: VO2max = 4.948 + (0.023 × Total Distance Walked) (Ross et al. 2010). VO2max, expressed as milliliters of oxygen consumed per kilogram of body weight per minute (mL/kg/min), is widely accepted as the criterion measure for aerobic fitness (Kaminsky et al. 2017). Overall, VO2max decreases with age at a rate of about 5 mL/kg/min per decade with men showing consistently higher VO2max throughout the lifespan than women (Kaminsky et al. 2017). Normative reference standards for VO2max by age, sex, and race are described in detail elsewhere (Kaminsky et al. 2017).
Body Mass Index (BMI)
BMI is an estimate of body fat based on an individual’s height and weight. For the current analyses, BMI was computed using height (in meters, m) and weight (in kilograms, kg) and expressed as kg/m2. Normal weight is defined as a BMI of 18.5 to 24.9 kg/m2, overweight is defined as a BMI of 25 kg/m2 to 29.9 kg/m2, and obese is defined as a BMI greater than or equal to 30 kg/m2 (World Health Organization 2006).
Sleep Quality
Sleep quality is self-reported using a single item, “Rate your usual sleep quality” with response choices on a Likert scale from 1 = “very poor” to 5 = “very good”.
Memory: The Rey Auditory Verbal Learning Test (RAVLT)
The Rey Auditory Verbal Learning Test (RAVLT) is a standardized, reliable, and widely used neuropsychological measure of verbal learning and memory (Strauss, Sherman, and Spreen 2006). The RAVLT consists of 15 unrelated words (List A) that are presented over five learning trials. After each learning trial, participants are asked to repeat back as many words as possible. After the learning trials, participants are presented with another 15-word list (distractor List B) and are asked to recall as many words from this distractor list. Immediately after the distractor list recall, participants are asked to recall as many words as possible from the original list (List A; short delay recall) and again after a 30-minute delay (long delay recall). RAVLT performance relevant to the current analyses included the total number of words recalled across the five learning trials (list-learning total), the total words recalled after a short delay (short delay recall total), and the total words recalled after the 30-minute delay (long delay recall total).
Digit Span
The Digit Span subtest of the Wechsler Adult Intelligence Scale-Fourth Edition measures the ability to hold, rehearse, and mentally manipulate aurally presented sequences of information (Wechsler 2008). In the forward condition, the examiner verbally presents sequences of digits of increasing length at the rate of one digit per second. Participants are instructed to repeat the sequence in the same order. In the backward condition, the examiner verbally presents sequences of digits, but the participants are asked to recall the sequences in the reverse order. In the sequencing condition, the participants are asked to recall the numbers in numerical order, starting with the lowest number. For each condition, scores range from 0 to 16, with higher scores indicating better performance.
Trail-Making Test Part A
Trail-Making Test Part A is a widely used measure of attention and psychomotor speed (Strauss, Sherman, and Spreen 2006). Participants are presented with a piece of paper on which encircled numbers from 1 to 25 are located randomly on the page. Participants are asked to draw a line connecting numbers in sequential order from lowest to highest (1-2-3-4, etc…25). The score represents the amount of time in seconds the participant took to complete the task with lower scores (faster completion times) indicating better performance.
Trail-Making Test Part B
Trail-Making Test Part B is a measure of mental flexibility and executive function (Strauss, Sherman, and Spreen 2006). Task requirements are similar to Trail-Making Test A, except the participant must alternate connecting numbers and letters in sequential order (1-A-2-B, etc…13) with the goal of completing the task as quickly and accurately as possible. Lower scores indicate better performance.
Phonemic Fluency
The Controlled Oral Word Association Test is a widely used assessment of phonemic verbal fluency (Strauss, Sherman, and Spreen 2006). The participant is asked to produce as many words as possible that start with a given letter of the alphabet in one minute. Three trials are administered, each trial using a different letter of the alphabet (e.g., “F”, “A”, “S”). The total number of words produced in each trial is recorded.
Category Fluency
The animal naming test is a reliable (rs = .69 - .81) measure of category or semantic fluency (Strauss, Sherman, and Spreen 2006). Participants are given 60 seconds to verbally generate as many animals as possible. The more animals produced in 60 seconds indicates better performance.
Generalization: The Concurrent Discrimination and Transfer Task
The concurrent discrimination and transfer task was developed by Gluck and colleagues at Rutgers University–Newark and is administered via a laptop computer (Myers et al. 2002). It is used to assess the ability to generalize past learning to novel task demands and has been shown to be sensitive to the subtle changes in the hippocampus and medial temporal lobe circuits affected in early preclinical AD (Myers et al. 2008). The task involves two phases: 1) a training phase during which participants learn to discriminate between the correct and incorrect object in eight object pairs based on feedback and 2) a generalization phase in which participants apply previously learned discrimination rules from the training phase to discriminate the correct and incorrect object in novel object pairs. During each trial, participants see a pair of objects on the computer screen, one of which is designated as the correct object, and are prompted with the question, “Which object is the smiley face under?” Participants are instructed to use the keys labeled “Left” or “Right” to select the correct object. Upon selecting the correct object, the object raises to reveal a smiley face underneath. Object pairs can appear in left-right or right-left order, but the same object is always designated as the correct object regardless of placement.
During each training phase trial, two objects are presented that differ in shape or color but not both features (see Supplemental Figure 1). With feedback (i.e., smiley face revealed), participants learn which object is the correct object in eight object pairs. Four of the pairs presented differ in shape but not color (e.g., green box and green mushroom) and four pairs differ in color but not shape (e.g., red cross and yellow cross). In each pair, one feature is relevant and predictive while the other is irrelevant. For example, participants might learn to choose the green box over the green mushroom (color = irrelevant, shape = relevant/predictive) and the red cross over the yellow cross in the training phase (color = relevant/predictive, shape = irrelevant). Once participants reach criterion performance (16 consecutive correct responses) or a maximum number of 96 trials, the generalization phase starts without warning.
During the generalization phase, participants are again asked to select the correct object among object pairs, but the irrelevant features are different. For example, participants might be presented with a brown box and a brown mushroom. In this case, shape is still predictive (box) and color is irrelevant as in the training phase. In another generalization trial, participants might be presented with a red cat eye and a yellow cat eye; color is still the relevant feature, but shape has been altered. The generalization phase continues for a maximum of 96 trials or 16 consecutive correct responses. Generalization phase performance is recorded as the number of errors; lower scores indicate better performance.
Demographics
Age, sex, education, and literacy level (as measured by the North American Adult Reading Test errors; NAART; Uttl 2002) were collected from all participants. These variables were considered as covariates.
Depressive Symptomology
The Beck Depression Inventory (BDI-II) is a widely used 21-item self-report measure of depressive symptoms and depression severity (Beck, Steer, and Brown 1996). Participants are asked to select one statement from each item that best describes the way they have felt during the past two weeks. Scores range from 0 to 63 with higher scores indicating greater depressive symptomology. The BDI-II has good internal reliability (α = .86) and excellent convergent validity with other known screening measures of mood problems (Segal et al. 2008). Depressive symptoms were used as a covariate as greater depressive symptoms are associated with poorer cognitive performance in older African Americans (Hamilton et al. 2014).
Analyses
Statistical Analyses
A missing value analysis was first conducted to examine the pattern of missing data. Independent samples t-tests and chi-square tests were used to compare participants with missing or no missing data on demographics, depression symptomology (BDI-II), aerobic fitness (VO2max), BMI, sleep quality, and all cognitive performance variables. BMI was log-transformed to correct for positive skewness. Due to the low frequency of individuals reporting very poor sleep quality (n = 12), the very poor and poor categories were collapsed, resulting in four categories of sleep quality: 0 = “very poor and poor sleep quality”; 1 = “satisfactory sleep quality”; 2 = “good sleep quality”; and 3 = “very good sleep quality.” Subsequently, multiple imputation by fully conditional specification with five imputations and 10 iterations was applied to obtain plausible values for missing data while also repeating the process to allow for uncertainty in the missing values. Predictors in the imputation model included age, sex (0 = female, 1 = male), education, BDI-II, BMI (original and log-transformed variable), sleep quality (original and re-coded variable), all cognitive scores, all composite cognitive scores, and the interaction terms (VO2 max × BMI; VO2 max × sleep quality). The resulting five imputed datasets were pooled and analyzed by standard procedures below.
Correlations were computed between demographics, VO2max, BMI, sleep quality, and cognitive outcomes to justify covariate selection for multivariate analyses (see Supplemental Table 1). Moderated hierarchical linear regressions were conducted to examine the main effects of aerobic fitness on cognition and the moderating roles of BMI and sleep quality on the aerobic fitness-cognition relationships. VO2max and covariates (age, sex, education, depressive symptomology [BDI], literacy [NAART]) were considered in Model 1. The moderators (BMI, sleep quality) were entered in Model 2. The interaction terms (VO2max × BMI and VO2max × sleep quality) were entered in Model 3. In order to decrease the number of dependent variables (i.e., cognitive scores) for regression analyses, composite z-scores with a mean of 0 and standard deviation of 1 were calculated for domain-specific cognitive performance from the aforementioned traditional neuropsychological tests: memory (RAVLT total learning trials 1-5, RAVLT short delay recall, RAVLT long delay recall); attention and speed (Digit Span Forward, Trail-Making Test A); executive function (Digit Span Backward, Digit Span Sequencing, Trail-Making Test B); language/verbal fluency (Letter Fluency – F, Letter Fluency – A, Letter Fluency – S, Category Fluency – Animals). Generalization phase errors were used for the concurrent discrimination and transfer task performance dependent variable. Thus, there were five dependent variables: 1) memory, 2) attention and speed, 3) executive function, 4) language/verbal fluency, and 5) generalization errors. Significant interactions were followed by simple slopes.
The Benjamini-Hochberg step up procedure was used to control the false discovery rate (FDR) for simultaneous testing of multiple independent hypotheses with the Q-value set at .10 for main effects (assumes 1/10 main effects will be a false discovery) and .20 for interactions (assumes 1/5 interaction effects will be a false discovery) (Benjamini and Hochberg 1995). In brief, all main and interaction effect p-values of interest were ordered from lowest to highest and assigned a rank (e.g., 1 through 10 for main effects). Then, the FDR critical value was calculated for each p-value as where i = rank and m = the total number of tests (i.e., m = 10 for main effects, m = five for interactions). The highest p-value that is smaller than the critical value as well as all p-values preceding it in rank are considered significant after FDR correction.
All statistical analyses were performed using IBM SPSS® Statistics for Mac, version 26 (IBM Corp., Armonk, N.Y., USA).
Results
Analytic sample characteristics are displayed in Table 1. Ages ranged from 60 to 90 years old. The majority of the sample were female (83.8%). VO2max ranged from 4.0 to 21.1 mL/kg/min, indicating a low overall aerobic fitness level (Kaminsky et al. 2017). The sample’s average BMI was 33.8 kg/m2 with 57% classified as clinically obese according to normative values (World Health Organization 2006). The majority of participants self-reported having satisfactory sleep or better (78.6%).
Of the analytic sample, 106 participants (26.4%) were missing at least one value on the following cognitive variables: Trail-Making Test – A, Trail-Making Test – B, Category Fluency – Animals, Letter Fluency – F, Letter Fluency – A, Letter Fluency – S, Digit Span Backward, RAVLT – Short Delay, and RAVLT – Long Delay. A missing value analysis revealed that the data were not missing completely at random, Little’s test p < .05. To determine if the data were missing at random, the analytic sample was split by participants with missing one or more values (n = 106) vs. no missing values (n = 296) and compared on demographic, depressive symptomology, BDI-II, NAART, BMI, aerobic fitness, and cognitive performance data. The groups differed significantly on several demographic and cognitive variables (see Supplemental Table 2). Thus, the data fulfilled the missing at random assumption that missingness was related to observed characteristics and multiple imputation was permissible.
Regression Analyses
To examine the main effects of aerobic fitness on cognition, VO2max and covariates were entered in Model 1 for each of the five cognitive domains (see Table 2). There was a significant association between aerobic fitness and executive function performance, B = 0.09, 95% CI [0.01, 0.19], p = .04, FDR-corrected significant pcritical = .04. The linear combination of aerobic fitness and covariates accounted for 22% of the variance in executive function, p < .001. There were no other significant associations between aerobic fitness and other cognitive domains, adjusting for covariates, ps > .05, FDR-corrected not significant.
Table 2.
Summary of moderated regression analyses for BMI and sleep quality as moderators of aerobic fitness–cognition relationship
| Outcome | Variable | Model 1 | Model 2 | Model 3 | ||||||
|---|---|---|---|---|---|---|---|---|---|---|
| B | SE b | p | B | SE b | p | B | SE b | p | ||
| 1) Learning and Memory | VO2max BMI Sleep Quality VO2max × BMI VO2max × SQ |
0.06 | 0.06 | .31 | 0.07 0.65 −0.19 |
0.06 1.15 0.16 |
.26 .57 .24 |
2.16 0.66 −0.18 −1.36 −0.03 |
0.76 1.15 0.16 0.50 0.07 |
.01 .56 .26 .01* .61 |
|
| ||||||||||
| 2) Attention and Speed | VO2max BMI Sleep Quality VO2max × BMI VO2max × SQ |
0.02 | .03 | .51 | 0.02 −0.20 −0.18 |
0.04 0.62 0.09 |
.57 .74 .05 |
−0.17 −0.21 −0.18 0.13 −0.01 |
0.38 0.62 0.09 0.25 0.03 |
.67 .73 .05 .61 .89 |
|
| ||||||||||
| 3) Executive Function | VO2max BMI Sleep Quality VO2max × BMI VO2max × SQ |
0.10 | 0.05 | .03* |
0.09 −0.41 −0.17 |
0.05 0.86 0.12 |
.04 .63 .16 |
0.67 −0.34 −0.18 −0.42 0.05 |
0.56 0.86 0.13 0.37 0.05 |
.23 .69 .15 .26 .35 |
|
| ||||||||||
| 4) Language/Fluency | VO2max BMI Sleep Quality VO2max × BMI VO2max × SQ |
0.09 | 0.06 | .15 | 0.09 −0.20 −0.20 |
0.06 1.20 0.17 |
.17 .87 .24 |
−0.12 −0.09 −0.22 0.07 .09 |
0.79 1.20 .17 0.52 .07 |
.88 94 .20 .90 .17 |
|
| ||||||||||
| 5) Generalization | VO2max BMI Sleep Quality VO2max × BMI VO2max × SQ |
−0.06 | 0.38 | .88 | 0.04 1.51 0.44 |
0.38 7.28 1.05 |
.92 .84 .67 |
−9.76 0.31 0.60 7.08 −0.85 |
4.72 7.16 1.04 3.08 0.40 |
.04 .97 .56 .02* .04* |
Note. Bolded indicates significant p < .05.
False Discovery Rate-corrected significant.
BMI = Body Mass Index. SQ = Sleep quality. Model 1 = VO2max and covariates (age, sex, education, depressive symptomology [Beck Depression Inventory-II], and literacy [NAART] entered; Model 2 = moderators BMI and sleep quality entered; Model 3 = interaction terms VO2max × BMI and VO2max × sleep quality entered. BMI was log10 transformed to correct for positive skew.
BMI and Sleep Quality as Moderators of Aerobic Fitness–Cognition Relationship
To test the hypothesis that BMI and sleep quality moderate the relationship between aerobic fitness and cognition, moderated hierarchical linear regressions were carried out using VO2max as the independent variable, BMI and sleep quality as the moderator variables, and 1) memory (composite of RAVLT total learning trials, RAVLT short delay recall, and RAVLT long delay recall), 2) attention and speed (composite of Digit Span Forward and Trail-Making Test A), 3) executive function (composite of Digit Span Backward, Digit Span Sequencing, and Trail-Making Test B), 4) language/verbal fluency (Letter Fluency – F, Letter Fluency – A, and Letter Fluency – S, Category Fluency – Animals) and 5) generalization errors as the dependent variables. For each regression analysis, VO2max and covariates were added in Model 1, the moderators (BMI and sleep quality) were added in Model 2, and the interaction terms – VO2max × BMI and VO2max × sleep quality entered in Model 3 (see Table 2 for main effects and interaction effects by cognitive domain).
BMI significantly moderated the association between VO2max and memory, both before and after controlling for age, sex, education, depressive symptomology and literacy, B = −1.36, 95% CI [−2.34, −0.39], p = .01, FDR-corrected significant pcritical = .02. BMI also significantly moderated the association between VO2max and generalization, B = 7.08, 95% CI [1.04, 13.11], p = .02, FDR-corrected significant pcritical = .04. There were no significant interaction effects for BMI on the relationship between VO2max and attention and speed, VO2max and executive function, nor VO2max and language/verbal fluency.
Sleep quality significantly moderated the association between VO2max and generalization errors, B = −0.85, 95% CI [−1.64, −0.05], p = .04, FDR-corrected significant pcritical = .06. Sleep quality did not moderate any of the remaining associations between VO2max and cognitive domains, ps > .05, FDR-corrected not significant.
Simple Slopes with BMI as Moderator.
Significant interactions were followed by simple slopes analyses. VO2max was mean centered at 14.6 mL/kg/min. BMI was analyzed at three levels: low (1 SD below sample mean, 24 kg/m2), average (33 kg/m2), and high (1 SD above mean, 41 kg/m2). For both the low and average BMI groups, there was a significant positive association between VO2max and memory performance, ps < .01. However, the high BMI group demonstrated no significant relationship between VO2max and memory performance, p = .10 (see Figure 1a). BMI also significantly moderated the relationship between VO2max and generalization performance. The low and average BMI groups demonstrated significant negative associations between VO2max and generalization errors; as aerobic fitness increases, the number of generalization errors decreases (see Figure 1b). However, the high BMI group showed no significant relationship between VO2max and generalization errors, p = .48. In summary, among those in the low BMI group, every 2.04 mL/kg/min increase in VO2max is associated with a 0.32 standard deviation increase in memory composite performance and a −1.54 decrease in the number of generalization errors.
Figure 1.
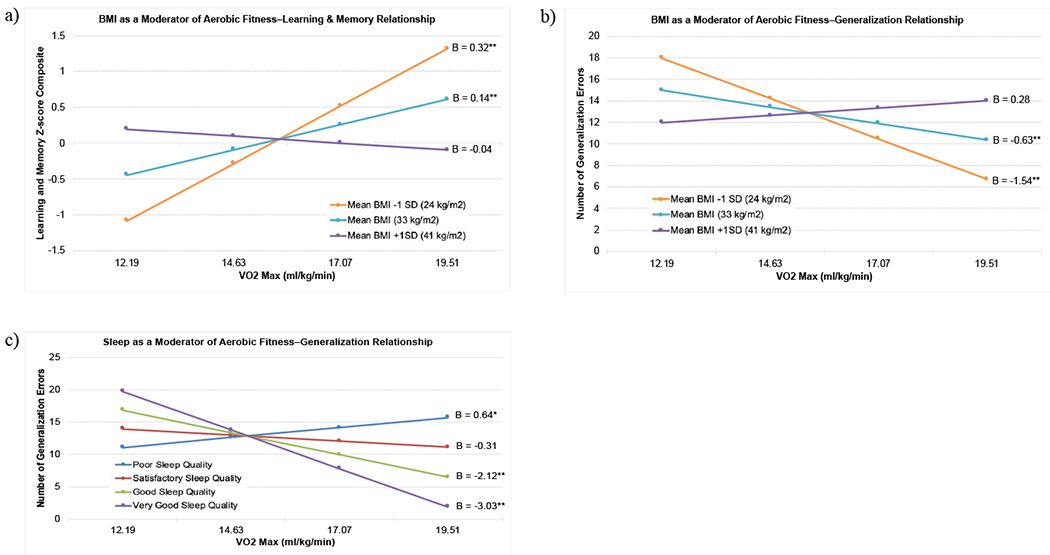
Simple slopes: (a) BMI as a moderator of the relationship between aerobic fitness (VO2max) and learning and memory. (b) BMI as a moderator of the relationship between aerobic fitness (VO2max) and generalization performance (number of generalization errors). (c) Self-reported sleep quality as a moderator of the relationship between aerobic fitness (VO2max) and generalization performance (number of generalization errors). Fewer generalization errors indicates better performance. *p < .05, **p < .01.
Simple Slopes with Sleep Quality as Moderator.
Simple slopes were analyzed by four sleep quality levels: 0 = very poor and poor, 1 = satisfactory, 2 = good, 3 = very good. For very poor and poor sleep quality, there was a significant, positive association between VO2max and generalization errors (indicative of poorer transfer of learning to novel contexts) such that for every 2.44 mL/kg/min increase in VO2max, there was a .64 increase in number of generalization errors, p = .02. For those with satisfactory sleep quality, there was no significant relationship between VO2max and generalization errors, p = .14. Among both good and very good sleep quality, there was a significant negative association between VO2max and generalization errors, ps < .01; for every 2.44 mL/kg/min increase in VO2max, there was a decrease of 2.12 and 3.03 generalization errors, respectively (see Figure 1c).
Discussion
We examined the relationship between aerobic fitness and performance across several cognitive domains among older urban African Americans. Consistent with previous research (Izquierdo-Porrera and Waldstein 2002, Freudenberger et al. 2016, Szabo et al. 2011), we found that higher aerobic fitness levels were associated with better cognitive function, specifically in the executive function domain. We also observed that the relationships between aerobic fitness and both memory and generalization were moderated by BMI. Similarly, the relationship between aerobic fitness and generalization was moderated by sleep quality. Those with lower BMIs showed a stronger relationship between higher aerobic fitness and better memory and generalization performance. Participants with good and very good quality sleep showed a stronger relationship between higher aerobic fitness and better generalization performance. Neither BMI nor sleep moderated any other aerobic fitness–cognition relationship in the attention and speed, executive function, and language/fluency domains.
Few studies have examined interactions between aerobic fitness and other lifestyle factors on cognition. In the present study, higher BMI attenuated the neuroprotective effects of aerobic fitness on hippocampal-dependent cognitive function. Specifically, participants with higher BMIs showed diminished associations between a) aerobic fitness and memory and b) aerobic fitness and generalization performance. Thus, contrary to some evidence that individuals who are obese benefit from increased aerobic fitness levels (Lee, Blair, and Jackson 1999), we found that those individuals with higher BMIs did not exhibit a positive relationship between fitness and cognition. These results are consistent with Freudenberger et al. (2016) who found a significant interaction between VO2max and BMI on memory among 877 older (white) Austrians. Freudenberger and colleagues reported that individuals in the obese range (BMI ≥ 30 kg/m2) showed no relationship between improved aerobic fitness and memory performance while individuals in the normal and overweight BMI groups (≤25 kg/m2 and 26-29 kg/m2, respectively) showed improved memory performance with increasing aerobic fitness levels (Freudenberger et al. 2016). We extend these findings by also observing a significant fitness × BMI interaction on generalization performance, lending further evidence that the hippocampus and medial temporal lobes are sensitive to changes in aerobic fitness (Erickson et al. 2009). Thus, BMI shows indirect influences on higher-order cognitive domains via its interaction with fitness, but the mechanisms have yet to be determined. Taken together, our findings suggest that African Americans who are obese may derive more cognitive and neuroprotective benefits from increases in aerobic fitness if they lose weight and achieve a healthy BMI.
Our finding that participants who self-reported good or very good sleep quality showed a decrease in generalization errors with increasing aerobic fitness levels is consistent with interventional work demonstrating that a low-intensity exercise program enhanced sleep and improved memory function in older adults (Naylor et al. 2000). Indeed, high quality sleep is crucial for memory consolidation (Mander, Winer, and Walker 2017). Given our present findings, improved sleep quality may also be important for generalizing previously learned rules to novel situations.
Curiously, we also found that participants with poor sleep quality showed an increase in generalization errors (poorer transfer performance) with higher aerobic fitness levels; a subset of individuals with poor sleep quality show a detrimental effect of increasing aerobic fitness on hippocampal-dependent cognitive function. Although the mechanisms by which sleep quality and fitness independently and synergistically impact cognition are yet to be fully explored, it is possible that increased cerebral blood flow elicited by fitness improvements can be inconsequential or detrimental to cognition if there is depletion of oxyhemoglobin in the brain due to poor sleep quality. Thus, although improving aerobic fitness may improve generalization performance (reducing transfer errors), poor sleep quality may negate or reverse the neuroprotective effects of aerobic fitness. Future research should be undertaken to elucidate the disparate mechanisms by which sleep quality and fitness influence cognition, both independently and in tandem. Further, given the complex interaction between fitness and sleep quality on cognition, exercise intervention programs may be optimized by also addressing sleep hygiene.
Limitations
Due to the current study’s cross-sectional nature, directionality of the observed relationships cannot be determined. In addition, we used a single self-report item for sleep quality, which may not capture the multidimensional features of sleep such as sleep duration and timing of sleep (Jackson et al. 2020). Although this approach is not ideal, other studies have also used single self-reported sleep items (Gamaldo, Allaire, and Whitfield 2008). Future research should incorporate objectively measured sleep metrics via actigraphy and polysomnography and a validated self-report measure of sleep quality (e.g., Pittsburgh Sleep Quality Index). For the parent study, participants were generally healthy (see inclusion/exclusion criteria in Methods), mostly female (84%), and were recruited via longstanding university-community partnerships on a first-come, first-serve basis. Thus, it is possible that the study participants reflect a healthy volunteer cohort and generalizability of the results may be limited. Across senior residents of Newark, NJ, women outnumber men by more than 2:1. Thus, future efforts with targeted male recruitment will aim to enroll women and men in proportion to this distribution (Gluck, Shaw, and Hill 2018). Finally, although we observed that individuals in the obesity range show reduced neuroprotection from higher aerobic fitness levels, some evidence suggests BMI might overestimate obesity and overweight prevalence in African Americans (Lear et al. 2010). In one epidemiological study (N = 69,393), waist circumference was a better indicator of excess weight and cardiovascular health than BMI (Flint et al. 2010). Thus, future studies should examine abdominal girth measures in addition to BMI and relate these factors to fitness and cognition.
Conclusion
Overall, these results support the continued development of health-promoting interventions tailored for African American communities. While exercise and associated improvements in aerobic fitness are a key pathway towards improved cognition and reduced risk for AD and other dementias, these benefits are maximized in those who maintain healthy body weight and get sufficient, high quality sleep. Importantly, given that such individual behaviors are further shaped by environmental, community, and social contextual factors, interventions should seek to also address these upstream determinants of health, thereby leading to greater improvements in individual health and reductions in AD and other health disparities (Agurs-Collins et al. 2019).
Relatively few interventions have successfully tailored interventions seeking to address the interplay between these contexts on individual health outcomes in African Americans (Resnicow et al. 2005, Wilson et al. 2015). One of the exceptions is the Positive Action for Today’s Health (a.k.a., PATH) trial, which employed a community-level intervention combining a monthly police-patrolled walking program and a grassroots social marketing campaign to address neighborhood safety perceptions, community connectedness, and accessibility of physical activity resources (Wilson et al. 2015). Evaluation of this program documented sustained increases in the number of participants who attended monthly walks from baseline to 24 months. Other trials have successfully employed church- and public-housing based interventions to reduce obesity, improve nutrition, and increase physical activity in older African Americans (see Resnicow et al. 2005, Bowen et al. 2018). Taken together, our work and current directions in the literature suggest that health-promoting interventions for older African Americans will be most effective if the individual-level components (e.g., exercise, sleep hygiene, weight loss) are also conceptualized within and/or address the individual’s broader environmental and social context.
Supplementary Material
Acknowledgements
The authors would like to thank Neha Sinha, Chelsie Berg, Emily Hokett, and Solaleh Azimipour for their insightful feedback. We would also like to thank the Pathways to Healthy Aging in African Americans participants and research assistants who volunteered their time to make this project possible.
Footnotes
Declaration of Interest
The authors report no potential conflicts of interest.
References
- Agurs-Collins T, Persky S, Paskett ED, Barkin SL, Meissner HI, Nansel TR, Arteaga SS, Zhang X, Das R, and Farhat T. 2019. “Designing and assessing multilevel interventions to improve minority health and reduce health disparities.” American Journal of Public Health 109:S86–S93. [DOI] [PMC free article] [PubMed] [Google Scholar]
- Ama PF, Simoneau JA, Boulay MR, Serresse O, Theriault G, and Bouchard C. 1986. “Skeletal muscle characteristics in sedentary black and Caucasian males.” Journal of Applied Physiology 61 (5):1758–1761. [DOI] [PubMed] [Google Scholar]
- Arvanitakis Z, Capuano AW, Bennett DA, and Barnes LL. 2018. “Body mass index and decline in cognitive function in older black and white persons.” The Journals of Gerontology: Series A 73 (2):198–203. [DOI] [PMC free article] [PubMed] [Google Scholar]
- Barnes LL, and Bennett DA. 2014. “Alzheimer’s disease in African Americans: risk factors and challenges for the future.” Health Affairs 33 (4):580–586. [DOI] [PMC free article] [PubMed] [Google Scholar]
- Beck AT, Steer RA, and Brown G. 1996. Manual for the Beck Depression Inventory-II. San Antonio, TX: Psychological Corporation. [Google Scholar]
- Becker DM, Yanek LR, Koffman DM, and Bronner YC. 1999. “Body image preferences among urban African Americans and whites from low income communities.” Ethnicity & Disease 9 (3):377–386. [PubMed] [Google Scholar]
- Benjamini Y, and Hochberg Y. 1995. “Controlling the false discovery rate: A practical and powerful approach to multiple testing.” Journal of the Royal Statistics Society 57:289–300. [Google Scholar]
- Bowen DJ, Quintiliani LM, Bhosrekar SG, Goodman R, and Smith E. 2018. “Changing the housing environment to reduce obesity in public housing residents: a cluster randomized trial.” BMC Public Health 13 (883). [DOI] [PMC free article] [PubMed] [Google Scholar]
- Bryant AN, Ford KL, and Kim G. 2014. “Racial/ethnic variations in the relation between body mass index and cognitive function among older adults.” The American Journal of Geriatric Psychiatry 22 (7):653–660. [DOI] [PubMed] [Google Scholar]
- Bugg JM, Shah K, Villareal DT, and Head D. 2012. “Cognitive and neural correlates of aerobic fitness in obese older adults.” Experimental Aging Research 38 (2):131–145. [DOI] [PMC free article] [PubMed] [Google Scholar]
- Carnethon MR, Pu J, Howard G, Albert MA, Anderson CAM, Bertoni AG, Mujahid MS, Palaniappan L, Taylor HA Jr., Willis M, and Yancy CW. 2017. “Cardiovascular health in African Americans: A scientific statement from the American Heart Association.” Circulation 126:e393–e423. [DOI] [PubMed] [Google Scholar]
- Chan JS, Yan JH, and Payne VG. 2013. “The impact of obesity and exercise on cognitive aging.” Frontiers in Aging Neuroscience 5 (97). [DOI] [PMC free article] [PubMed] [Google Scholar]
- Duey WJ, Bassett DR, Torok DJ, Howley ET, Bond V, Mancuso P, and Trudell R. 1997. “Skeletal muscle fibre type and capillary density in college-aged blacks and whites.” Annals of Human Biology 24 (4):323–331. [DOI] [PubMed] [Google Scholar]
- Dzierzewski JM, Dautovich N, and Ravyts S. 2018. “Sleep and cognition in older adults.” Sleep Medicine Clinics 13 (1):93–106. doi: 10.1016/j.jsmc.2017.09.009. [DOI] [PMC free article] [PubMed] [Google Scholar]
- Erickson KI, Prakash RS, Voss MW, Chaddock L, Hu L, Morris KS, White SM, Wojcicki TR, McAuley E, and Kramer AF. 2009. “Aerobic fitness is associated with hippocampal volume in elderly humans.” Hippocampus 19 (1030-1039). doi: 10.1002/hipo.20547. [DOI] [PMC free article] [PubMed] [Google Scholar]
- Etnier JL, Nowell PM, Landers DM, and Sibley BA. 2006. “A meta-regression to examine the relationship between aerobic fitness and cognitive performance.” Brain Research Reviews 52 (1):119–130. [DOI] [PubMed] [Google Scholar]
- Flint AJ, Rexrode KM, Hu FB, Glynn RJ, Caspard H, Manson JE, Willett WC, and Rimm EB. 2010. “Body mass index, waist circumference, and risk of coronary heart disease: a prospective study among men and women.” Obesity Research & Clinical Practice 4 (3):e171–e181. [DOI] [PMC free article] [PubMed] [Google Scholar]
- Freudenberger P, Petrovic K, Sen A, Töglhofer AM, Fixa A, Hofer E, Perl S, Zweiker R, Seshadri S, Schmidt R, and Schmidt H. 2016. “Fitness and cognition in the elderly: the Austrian stroke prevention study.” Neurology 86 (5):418–424. doi: 10.1212/WNL.0000000000002329. [DOI] [PMC free article] [PubMed] [Google Scholar]
- Gamaldo AA, Allaire JC, and Whitfield KE. 2008. “The relationship between reported problems falling asleep and cognition among African American elderly.” Research on Aging 30 (6):752–767. [Google Scholar]
- Gamaldo AA, Allaire JC, and Whitfield KE. 2010. “Exploring the within-person coupling of sleep and cognition in older African Americans.” Psychology and Aging 25 (4):851–857. doi: 10.1037/a0021378. [DOI] [PMC free article] [PubMed] [Google Scholar]
- Garcia S, and Gunstad J. 2016. “Sleep and physical activity as modifiable risk factors in age-associated cognitive decline.” Sleep and Biological Rhythms 14 (1):3–11. [Google Scholar]
- Gluck MA, Shaw A, and Hill D. 2018. “Recruiting older African Americans to brain health and aging research through community engagement.” Generations 42 (2):78–82. [PMC free article] [PubMed] [Google Scholar]
- Gustafson D, Rothenberg E, Blennow K, Steen B, and Skoog I. 2003. “An 18-year follow-up of overweight and risk of Alzheimer disease.” Archives of Internal Medicine 163 (13):1524–1528. [DOI] [PubMed] [Google Scholar]
- Hamilton JL, Brickman AM, Lang R, Byrd GS, Haines JL, Pericak-Vance MA, and Manly JJ. 2014. “Relationship between depressive symptoms and cognition in older, non-demented African Americans.” Journal of the International Neuropsychological Society 20 (7):756–763. [DOI] [PMC free article] [PubMed] [Google Scholar]
- Hayes SM, Forman DE, and Verfaellie M. 2016. “Cardiorespiratory fitness is associated with cognitive performance in older but not younger adults.” Journals of Gerontology. Series B: Psychological Sciences and Social Sciences 71 (3):474–482. [DOI] [PMC free article] [PubMed] [Google Scholar]
- Hunter GR, Weinsier RL, McCarthy JP, Larson-Meyer DE, and Newcomer BR. 2001. “Hemoglobin, muscle oxidative capacity, and V2max in African-American and Caucasian women.” Medicine & Science in Sports & Exercise 33 (10):1739–1743. [DOI] [PubMed] [Google Scholar]
- Izquierdo-Porrera AM, and Waldstein SR. 2002. “Cardiovascular risk factors and cognitive function in African Americans.” The Journals of Gerontology, Series B: Psychological Sciences and Social Sciences 57 (4):377–380. [DOI] [PubMed] [Google Scholar]
- Jackson CL, Walker JR, Brown MK, Das R, and Jones NL. 2020. “A workshop report on the causes and consequences of sleep health disparities.” Sleep. doi: 10.1093/sleep/zsaa037. [DOI] [PMC free article] [PubMed] [Google Scholar]
- Johnson DK, Wilkins CH, and Morris JC. 2006. “Accelerated weight loss may precede diagnosis in Alzheimer disease.” Archives of Neurology 63 (9):1312–1317. [DOI] [PubMed] [Google Scholar]
- Kaminsky LA, Imboden MT, Arena R, and Myers J. 2017. “Reference standards for cardiorespiratory fitness measured with cardiopulmonary exercise testing using cycle ergometry: data from the Fitness Registry and the Importance of Exercise National Database (FRIEND) registry.” Mayo Clinic Proceedings. [DOI] [PubMed] [Google Scholar]
- Krueger PM, and Reither EN. 2015. “Mind the gap: race/ethnic and socioeconomic disparities in obesity.” Current Diabetes Reports 15 (11). doi: 10.1007/s11892-015-0666-6. [DOI] [PMC free article] [PubMed] [Google Scholar]
- Kuo HK, Jones RN, Milberg WP, Tennstedt S, Talbot L, Morris JN, and Lipsitz LA. 2006. “Cognitive function in normal-weight, overweight, and obese older adults: An analysis of the advanced cognitive training for independent and vital elderly cohort.” Journal of the American Geriatrics Society 54 (1):97–103. [DOI] [PMC free article] [PubMed] [Google Scholar]
- Lear SA, James PT, Ko GT, and Kumanyika S. 2010. “Appropriateness of waist circumference and waist-to-hip ratio cutoffs for different ethnic groups.” European Journal of Clinical Nutrition 64 (1):42–61. [DOI] [PubMed] [Google Scholar]
- Lee CD, Blair SN, and Jackson AS. 1999. “Cardiorespiratory fitness, body composition, and all-cause and cardiovascular disease mortality in men.” American Journal of Clinical Nutrition 69:373–380. [DOI] [PubMed] [Google Scholar]
- Mander BA, Winer JR, and Walker MP. 2017. “Sleep and human aging.” Neuron 94 (1):19–36. [DOI] [PMC free article] [PubMed] [Google Scholar]
- Mehta KM, and Yeo GW. 2017. “Systematic review of dementia prevalence and incidence in United States race/ethnic populations.” Alzheimer’s & Dementia 13 (1):72–83. doi: 10.1016/j.jalz.2016.06.2360. [DOI] [PubMed] [Google Scholar]
- Myers CE, Kluger A, Golomb J, Ferris S, De Leon MJ, Schnirman G, and Gluck MA. 2002. “Hippocampal atrophy disrupts transfer generalization in nondemented elderly.” Journal of Geriatric Psychiatry and Neurology 15 (2):82–90. [DOI] [PubMed] [Google Scholar]
- Myers CE, Kluger A, Golomb J, Gluck MA, and Ferris S. 2008. “Learning and generalization tasks predict short-term cognitive outcome in non-demented elderly.” Journal of Geriatric Psychiatry and Neurology 21 (2):93–103. [DOI] [PubMed] [Google Scholar]
- Naylor E, Penev PD, Orbeta L, Janssen I, Ortiz R, Colecchia EF, Keng M, Finkel S, and Zee PC. 2000. “Daily social and physical activity increases slow-wave sleep and daytime neuropsychological performance in the elderly.” Sleep 23 (1):1–9. [PubMed] [Google Scholar]
- Obisesan TO, Gillum RF, Johnson S, Umar N, Williams D, and Bond V. 2012. “Neuroprotection and neurodegeneration in Alzheimer’s disease: Role of cardiovascular disease risk factors, implications for dementia rates, and prevention with aerobic exercise in African Americans.” International Journal of Alzhemer’s Disease. doi: 10.1155/2012/568382. [DOI] [PMC free article] [PubMed] [Google Scholar]
- Parks SE, Housemann RA, and Brownson RC. 2003. “Differential correlates of physical activity in urban and rural adults of various socioeconomic backgrounds in the United States.” Journal of Epidemiology and Community Health 57:29–35. [DOI] [PMC free article] [PubMed] [Google Scholar]
- Pivarnik JM, Bray MS, Hergenroeder AC, Hill RB, and Wong WW. 1995. “Ethnicity affects aerobic fitness in US adolescent girls.” Medicine and Science in Sports and Exercise 27 (12):1635–1638. [PubMed] [Google Scholar]
- Rentz DM, Rodriguez MAP, Amariglio R, Stern Y, Sperling R, and Ferris S. 2013. “Promising developments in neuropsychological approaches for the detection of preclinical Alzheimer’s disease: A selective review.” Alzheimer’s Research & Therapy 5 (6):58. [DOI] [PMC free article] [PubMed] [Google Scholar]
- Resnicow K, Jackson A, Blissett D, Wang T, McCarty F, Rahotep S, and Periasamy S. 2005. “Results of the healthy body healthy spirit trial.” Health Psychology 24 (4):339–348. [DOI] [PubMed] [Google Scholar]
- Ross RM, Murthy JN, Wollak ID, and Jackson AS. 2010. “The six minute walk test accurately estimates mean peak oxygen uptake.” BMC Pulmonary Medicine 10 (1):31. doi: 10.1186/1471-2466-10-31. [DOI] [PMC free article] [PubMed] [Google Scholar]
- Ruiter ME, DeCoster J, Jacobs L, and Lichstein KL. 2010. “Sleep disorders in African Americans and Caucasian Americans: A meta-analysis.” Behavioral Sleep Medicine 8 (4):246–259. [DOI] [PubMed] [Google Scholar]
- Rundle A, Neckerman KM, Freeman L, Lovasi GS, Purciel M, Quinn J, Richards C, Sircar N, and Weiss C. 2009. “Neighborhood food environment and walkability predict obesity in New York City.” Environmental Health Perspectives 117 (3):442–447. doi: 10.1289/ehp.11590. [DOI] [PMC free article] [PubMed] [Google Scholar]
- Rush EC, Goedecke JH, Jennings C, Micklesfield L, Dugas L, Lambert EV, and Plank LD. 2007. “BMI, fat and muscle differences in urban women of five ethnicities from two countries.” International Journal of Obesity 31 (8):1232–1239. [DOI] [PubMed] [Google Scholar]
- Segal DL, Coolidge FL, Cahill BS, and O’Riley AA. 2008. “Psychometric properties of the Beck Depression Inventory—II (BDI-II) among community-dwelling older adults.” Behavior Modification 32 (1):3–20. [DOI] [PubMed] [Google Scholar]
- Sheehan CM, Frochen SE, Walsemann KM, and Ailshire JA. 2019. “Are US adults reporting less sleep?: Findings from sleep duration trends in the National Health Interview Survey, 2004-2017.” Sleep 42 (2):1–8. doi: 10.1093/sleep/zsy221. [DOI] [PMC free article] [PubMed] [Google Scholar]
- Skinner JS, Jaskólski A, Jaskólska A, Krasnoff J, Gagnon J, Leon AS, Rao DC, Wilmore JH, and Bouchard C. 2001. “Age, sex, race, initial fitness, and response to training: The HERITAGE Family Study.” Journal of Applied Physiology 90 (5):1770–1776. [DOI] [PubMed] [Google Scholar]
- Smith E, Hay P, Campbell L, and Trollor JN. 2011. “A review of the association between obesity and cognitive function across the lifespan: implications for novel approaches to prevention and treatment.” Obesity Reviews 12 (9):740–755. [DOI] [PubMed] [Google Scholar]
- Steffen TM, Hacker TA, and Mollinger L. 2002. “Age-and gender-related test performance in community-dwelling elderly people: Six-Minute Walk Test, Berg Balance Scale, Timed Up & Go Test, and gait speeds.” Physical Therapy 82 (2):128–137. doi: 10.1093/ptj/82.2.128. [DOI] [PubMed] [Google Scholar]
- Strand LB, Laugsand LE, Wisløff U, Nes BM, Vatten L, and Janszky I. 2013. “Insomnia symptoms and cardiorespiratory fitness in healthy individuals: the Nord-Trøndelag Health Study (HUNT).” Sleep 36 (1):99–108. [DOI] [PMC free article] [PubMed] [Google Scholar]
- Strauss ME, Sherman EM, and Spreen O. 2006. A compendium of neuropsychological tests: Administration, norms, and commentary. 3rd ed: Oxford University Press. [Google Scholar]
- Swift DL, Staiano AE, Johannsen NM, Lavie CJ, Earnest CP, Katzmarzyk PT, and Church TS. 2013. “Low cardiorespiratory fitness in African Americans: A health disparity risk factor?” Sports Medicine 43 (12):1301–1313. [DOI] [PMC free article] [PubMed] [Google Scholar]
- Szabo AN, McAuley E, Erickson KI, Voss M, Prakash RS, Mailey EL, Wójcicki TR, White SM, Gothe N, Olson EA, and Kramer AF. 2011. “Cardiorespiratory fitness, hippocampal volume, and frequency of forgetting in older adults.” Neuropsychology 25 (5):545–553. doi: 10.1037/a0022733. [DOI] [PMC free article] [PubMed] [Google Scholar]
- Tanner CJ, Barakat HA, Dohm GL, Pories WJ, MacDonald KG, Cunningham PR, Swanson MS, and Houmard JA. 2002. “Muscle fiber type is associated with obesity and weight loss.” American Journal of Physiology-Endocrinology and Metabolism 282 (6):E1191–E1196. [DOI] [PubMed] [Google Scholar]
- Uttl B 2002. “North American Adult Reading Test: Age norms, reliability, and validity.” Journal of Clinical and Experimental Neuropsychology 24 (8):1123–1137. doi: 10.1076/jcen.24.8.1123.8375. [DOI] [PubMed] [Google Scholar]
- Wadden TA, Webb VL, Moran CH, and Bailer BA. 2012. “Lifestyle modification for obesity: new developments in diet, physical activity, and behavior therapy.” Circulation 125 (9):1157–1170. [DOI] [PMC free article] [PubMed] [Google Scholar]
- Wang C, Chan JS, Ren L, and Yan JH. 2016. “Obesity reduces cognitive and motor functions across the lifespan.” Neural Plasticity 2473081. [DOI] [PMC free article] [PubMed] [Google Scholar]
- Wechsler D 2008. WAIS-IV: Administration and scoring manual. New York, NY: The Psychologial Corporation. [Google Scholar]
- Wendell CR, Gunstad J, Waldstein SR, Wright JG, Ferrucci L, and Zonderman AB. 2014. “Cardiorespiratory fitness and accelerated cognitive decline with aging.“ Journals of Gerontology. Series A, Biological Sciences and Medical Sciences 69 (4):455–462. [DOI] [PMC free article] [PubMed] [Google Scholar]
- Wilson DK, Van Horn ML, Siceloff ER, Alia KA, St SM. George HG. Lawman NN. Trumpeter SM. Coulon SF. Griffin A Wandersman B. Egan N. Colabianchi M. Forthofer, and Gadson B. 2015. “The results of the “Positive Action for Today’s Health”(PATH) trial for increasing walking and physical activity in underserved African-American Communities.” Annals of Behavioral Medicine 49 (3):398–410. [DOI] [PMC free article] [PubMed] [Google Scholar]
- World Health Organization. 2006. “Global database on body mass index.” http://www.assessmentpsychology.com/icbmi.htm.
- Wyatt SB, Winters KP, and Dubbert PM. 2006. “Overweight and obesity: Prevalence, consequences, and causes of a growing public health problem.” The American Journal of the Medical Sciences 331 (4):166–174. [DOI] [PubMed] [Google Scholar]
- Zanobetti A, Redline S, Schwartz J, Rosen D, Patel S, O’Connor GT, Lebowitz M, Coull BA, and Gold DR. 2010. “Associations of PM10 with sleep and sleep-disordered breathing in adults from seven US urban areas.” American Journal of Respiratory and Critical Care Medicine 182 (6):819–825. [DOI] [PMC free article] [PubMed] [Google Scholar]
Associated Data
This section collects any data citations, data availability statements, or supplementary materials included in this article.