Abstract
BACKGROUND AND PURPOSE:
Measuring the volume of fetal brain structures is challenging due to fetal motion, low resolution, and artifacts caused by maternal tissue. Our aim was to introduce a new, simple, Matlab-based semiautomated method to measure the volume of structures in the fetal brain and present normal volumetric curves of the structures measured.
MATERIALS AND METHODS:
The volume of the supratentorial brain, left and right hemispheres, cerebellum, and left and right eyeballs was measured retrospectively by the new semiautomated method in MR imaging examinations of 94 healthy fetuses. Four volume ratios were calculated. Interobserver agreement was calculated with the intraclass correlation coefficient, and a Bland-Altman plot was drawn for comparison of manual and semiautomated method measurements of the supratentorial brain.
RESULTS:
We present normal volumetric curves and normal percentile values of the structures measured according to gestational age and of the ratios between the cerebellum and the supratentorial brain volume and the total eyeball and the supratentorial brain volume. Interobserver agreement was good or excellent for all structures measured. The Bland-Altman plot between manual and semiautomated measurements showed a maximal relative difference of 7.84%.
CONCLUSIONS:
We present a technologically simple, reproducible method that can be applied prospectively and retrospectively on any MR imaging protocol, and we present normal volumetric curves measured. The method shows results like manual measurements while being less time-consuming and user-dependent. By applying this method on different cranial and extracranial structures, anatomic and pathologic, we believe that fetal volumetry can turn from a research tool into a practical clinical one.
In pediatric and adult populations, 3D volumetric measurement of brain structures is an important tool for the assessment of neurologic patients. Automatic volumetry of the brain is used to diagnose and evaluate different pathologies such as Alzheimer disease, essential tremor, multiple sclerosis, and epilepsy.1–4 During the past decade, with the increasing use of MR imaging in prenatal evaluation, attempts to implement brain volumetric measurements on fetal MR imaging have been made. However, fetal MR imaging presents unique challenges for interpretation and measuring capabilities, such as fetal motion, low resolution, and artifacts due to maternal tissue. Some studies have tried to overcome these difficulties by measuring the volume manually.5,6 This method is very time-consuming and interpreter-dependent. Other studies have presented newly developed automatic algorithms to correct the artifacts and align the images affected by fetal motion. However, these methods are costly, not widely applicable, and may require changes in the routine fetal MR imaging protocol.2,7–11
In this study, we introduce a new, Matlab-based (MathWorks, Natick, Massachusetts) semiautomated method for measuring the volume of structures in the fetal brain. We measured 6 structures with this method in a relatively large group and calculated 4 volume ratios. We validated this method by measuring a small control group manually and comparing the results with the measurements of the same group obtained with the new method and assessed its interobserver reliability.
Materials and Methods
Subjects
This is a retrospective review of 94 fetal MR imaging examinations performed in the Chaim Sheba Medical Center between 2011 and 2014. Indications for MR imaging examinations included suspected pathologic findings on ultrasonographic evaluation, extracranial pathologic findings, maternal cytomegalovirus infection, and a family member with an intracranial pathology.
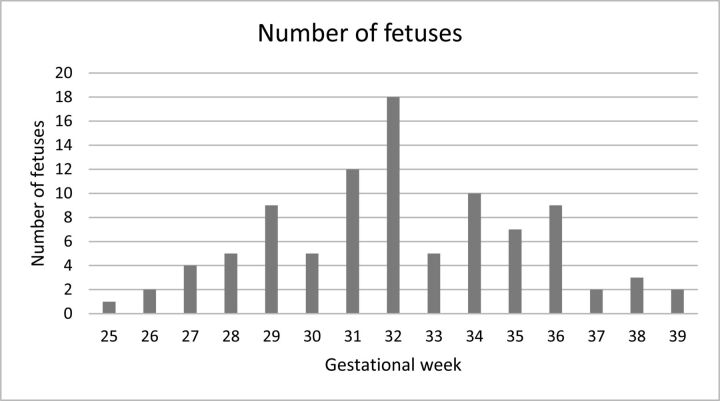
The inclusion criteria were no pathologic findings according to the neuroradiologist's evaluation and normal 2D biometric measurements according to previously reported biometric studies.12,13 The distribution of gestational age is presented in Fig 1.
Fig 1.
Distribution of the fetuses measured by gestational week.
MR Imaging
This study was based on the routine fetal MR imaging procedure performed in our institution. No sedation was used during MR imaging examinations. Fetal brain MR imaging was performed with a 1.5T system (Optima scanner; GE Healthcare, Milwaukee, Wisconsin). Single-shot fast spin-echo T2-weighted sequences in 3 orthogonal planes were performed with the half-Fourier technique (NEX = 0.53) with the following parameters: section thickness of 3 or 4 mm, no gap, flexible coil (8-channel cardiac coil). The FOV was determined by the size of the fetal head with a range of 24 × 24 cm to 30 × 30 cm. Acquisition time was between 40 and 45 seconds; matrix, 320/224; TE, 90 ms; TR, 1298 ms; pixel bandwidth, 122 Hz/pixel. Specific absorption rate values were between 1.1 and 1.7 W/kg.14
Measurements
We measured 6 structures in 94 fetal brain MR imaging examinations with the semiautomated method. For comparison between manual and semiautomated measurements, we used data of manual measurements of the supratentorial brain volume (STV) previously reported by Polat et al.14 The coronal plane sequence was used for measurements in both methods. Delineation was made by a semiautomated algorithm or drawn manually. In both methods, the ROI traced created an area that was then multiplied by the section thickness to produce the volume. ROI volumes from successive sections were then summed to yield the full volume of the desired region. The measuring time was collected for each fetus measured.
The boundaries of the structures measured were defined as follows:
Supratentorial brain volume: the parenchyma of the frontal, parietal, occipital, and temporal lobes, including the third ventricle and excluding the lateral ventricles (measured separately by the semiautomated method and subtracted), the brain stem, the cerebellum, and the fourth ventricle. Anterior, posterior, superior, and lateral boundaries were defined as the outer edge of the cerebral cortex. The inferior border matched the cortex and an imaginary line crossing the brain stem between the edges of the tentorium cerebelli. The left and right hemisphere volumes (LHV and RHV) were measured separately with the same lateral boundaries with the interhemispheric fissure as a medial boundary.
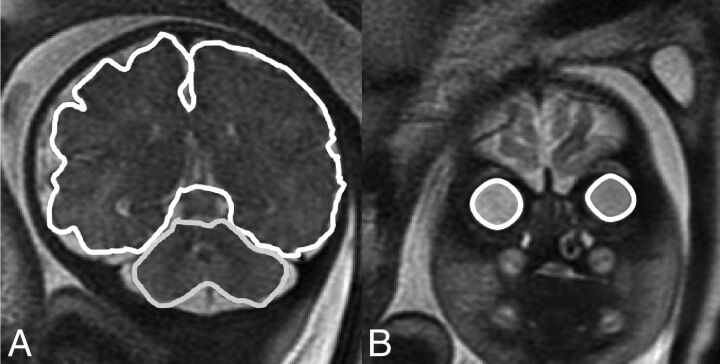
Cerebellar volume (CV): cerebellar hemispheres were drawn with the cerebellar peduncles and vermis. The brain stem and the fourth ventricle were excluded. A single-section representative image of STV and CV is presented in Fig 2A.
Fig 2.
Representative sections of structure boundaries. A, STV and CV. B, REBV and LEBV.
Left and right eyeball volumes (LEBV, REBV): the eyeball was defined as the vitreous body and the lens, excluding the optic nerve. A representative section image of LEBV and REBV is presented in Fig 2B.
We calculated 4 volume ratios: the ratio between right and left hemispheres (RHV/LHV ratio), right and left eyeballs (REBV/LEBV ratio), cerebellum and supratentorial brain (CV/STV ratio), and the 2 eyeballs and the supratentorial brain (total eyeball volume [EBV]/STV).
Manual Measurements
Images were first transformed from DICOM to TIFF format and analyzed with ImageJ software (National Institutes of Health, Bethesda, Maryland). Delineation was drawn manually through cursor-guided freehand traces on individual images in the coronal plane.
Semiautomated Measurement Algorithm
The semiautomated algorithm was implemented in the Matlab computing environment. The 3D segmentation is achieved by a set of N 2D semiautomated segmentations performed on consecutive coronal sections. The 3 main processing steps are the following:
3D Preprocessing.
The brain is cropped interactively by a cuboidal box, and bias-correction is performed to compensate for MR imaging radiofrequency-field inhomogeneity.15 Eventually, an anisotropic diffusion filter (PeronaMalikFilter; http://reference.wolfram.com/language/ref/PeronaMalikFilter.html) is applied to each section for edge-preserving smoothing.16
Midcoronal Section Processing.
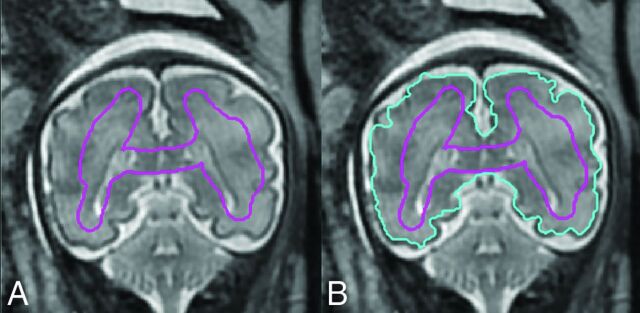
An initial closed contour is manually drawn inside the brain parenchyma of the midcoronal section, Smid (Fig 3A). The initial contour, Cinit(Smid), is automatically propagated by a level set–based active contour algorithm until convergence into contour Cconv(Smid) (Fig 3B).17 Note that Cinit does not have to be similar in shape to the targeted brain contour but should contain representative pixels for all the tissues and intensity ranges present in the brain parenchyma, including CSF if present in the considered section.
Fig 3.
A, The initial contour Cinit drawn manually on the midcoronal section. B, Contour Cconv automatically propagated by a level set–based active contour algorithm.
Forward and Backward Propagation.
Cconv(Smid) is used as an initial contour for the level set in the preceding and successive sections, Smid1 and Smid+1, respectively. The procedure is repeated recursively, with Cconv(Smidi) and Cconv(Smid+i) serving as the initial contour for Smidi and Smid+i until the first and last sections of the scan are reached. The propagated contours are downsized from section to section by a fixed quantity determined by the user, to account for the progressive reduction in coronal cross-sections of the brain when departing from the midcoronal section.
Eventually, the resulting set of 2D segmentation contours, Cconv(Si), i = 1…N, may be interactively adjusted by dragging contour points in the Matlab GUI (https://www.mathworks.com/discovery/matlab-gui.html) with the mouse. The volume is computed as the total number of voxels enclosed by the segmentation contours multiplied by the voxel physical size. Screenshots of the Matlab software GUI are presented in On-line Fig 1.
Statistical Analysis
Statistical analysis was based on a previous study by Ber et al.12 Analysis was performed by using R statistical and computing software, Version 3.3.1 (http://www.r-project.org/). The reference intervals were estimated by using the Generalized Additive Models for Location, Scale, and Shape model18 as the World Health Organization suggested method.19 In our study, the model for centile q at gestational age t is the following: cq = μt + σtZq, where μt and σt are the mean and SD at age t, measured in days, and Zq is the q centile of the standard normal distribution. The functions μt and σt were estimated and smoothed by using the Rigby and Stasinopoulos algorithm18 with a cubic spline smoothing. The normality assumption was slightly inadequate, but the resulting curves were almost identical to those achieved by assuming the Box-Cox t distribution (with 4 parameters) recommended.19 In addition, we found the skewness and kurtosis parameters of the Box-Cox t distribution to be nonsignificant for all response variables; this finding supports our decision to simply use the normal distribution without any transformation.
For the ratio variables, we examined the hypothesis μt = μ to assess the independence of the ratios with the gestational age. The hypothesis was tested with the Generalized Additive Models for Location, Scale, and Shape model. If the ratio was independent of gestational age (P > .05), we calculated its mean and SD. If the ratio was dependent on gestational age (P < .05), we applied the same analysis used for the structures measured.
The intraclass correlation coefficient (ICC) and limits of agreement were used to study the reliability of measurements across measurers, and 20 subjects were measured by 2 measurers for this purpose. Results were defined as poor for ICC < 0.6, satisfactory for 0.6 < ICC < 0.8, good for 0.8 < ICC < 0.9, and excellent for ICC > 0.9.
For comparing the manual and semiautomated methods, we calculated the maximum relative difference × 100%, where A and M represent the semiautomated and manual absolute measurements, respectively. This analysis was performed by using SPSS, Version 23 (IBM, Armonk, New York).
Ethics Approval
The research was approved by the hospital research ethics board.
Results
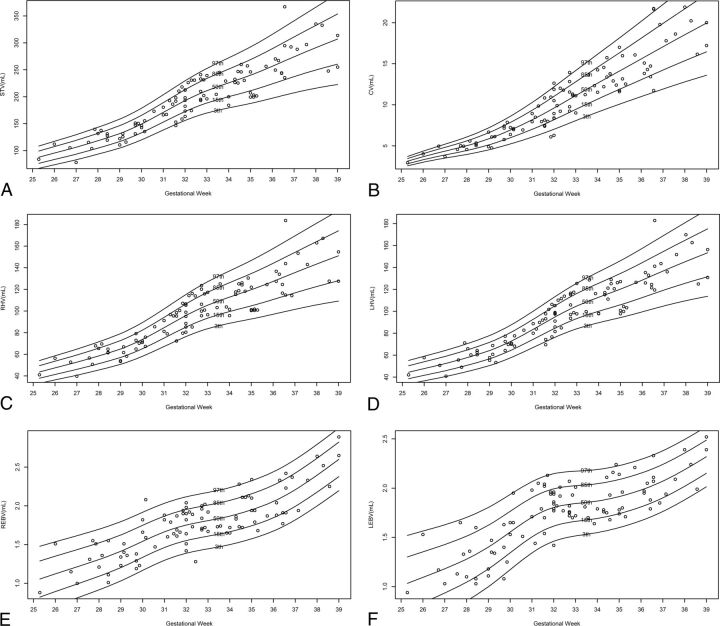
Normal curves of STV, RHV, LHV, CV, REBV, and LEBV are presented in Fig 4. Normal percentile reference data for each structure measured by gestational age are presented in On-line Tables 1–6.
Fig 4.
Normal volumetric curves of measured structures according to gestational age. A, STV. B, CV. C, RHV. D, LHV. E, REBV. F, LEBV.
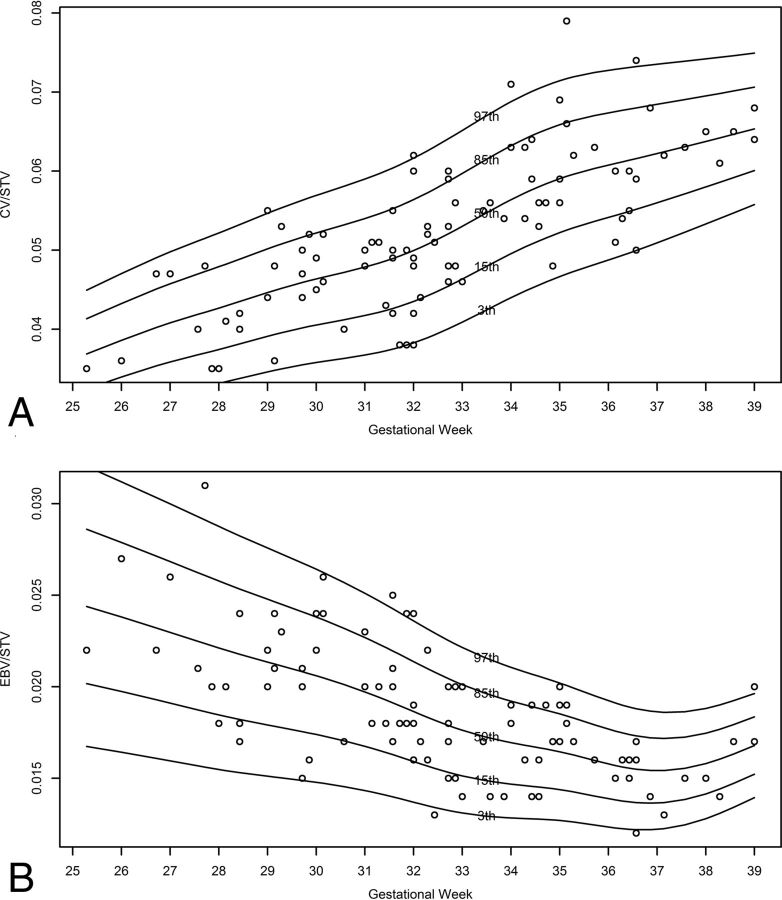
The ratio variables RHV/LHV and REBV/LEBV are independent of gestational age (P = .20 and P = .07, respectively), and their mean value and SD are 1.00 ± 0.04 and 1.01 ± 0.09, respectively. The ratio variables CV/STV and EBV/STV are dependent on gestational age (P < 10−10 for both). Their normal curves are presented in Fig 5, and their normal percentile reference data are presented in On-line Tables 7 and 8.
Fig 5.
Normal curves of the ratio variable according to gestational age. A, CV/STV ratio. B, EBV/STV ratio.
Measurement results of STV in 19 randomly selected fetuses obtained from the semiautomated and manual methods are presented in a Bland-Altman plot with 95% limits of agreement in On-line Fig 2. The mean difference between the semiautomated and manual methods was 2.11 ± 9.03 cm3; 95% limits of agreement, 16.87–21.09 cm3; and the maximum relative difference between the 2 methods, 7.84% of the mean. The average measuring times of STV with the semiautomated and the manual methods were 9.2 ± 1.1 and 22.4 ± 2.1 minutes, respectively.
The interobserver agreement per structure between the 2 measurers is presented in the Table.
Intraclass correlation coefficient between 2 observers per structure measured
| Structure Measured | ICC | 95% Confidence Interval |
|---|---|---|
| STV | 0.995 | (0.987–0.998) |
| LHV | 0.990 | (0.974–0.996) |
| RHV | 0.985 | (0.920–0.995) |
| CV | 0.977 | (0.944–0.991) |
| REBV | 0.946 | (0.871–0.978) |
| LEBV | 0.886 | (0.735–0.954) |
Discussion
Fetal volumetry might be the next step in prenatal diagnosis and evaluation of brain pathologies, as it is in pediatric and adult neurologic evaluations. Therefore, it is widely investigated, and many groups are trying to develop an accurate yet practical way to overcome the unique challenges that fetal MR imaging presents. During the past decade, attempts have been made to develop an automated volumetric measurement method that will eliminate user dependence and time consumption presented by manual volumetric measurements. The 2 most challenging obstacles of the automated prenatal volumetric evaluation are the intersection motion of the fetus and the isolation of fetal from maternal tissue. Some studies have introduced new methods to overcome these challenges and developed algorithms for isolation of fetal from maternal tissue and for motion correction. These methods have promise for future use, but they are either computationally complicated7,20 or require a change in the standard prenatal MR imaging protocol11and, therefore, may be clinically inapplicable for the time being and should be validated.
The new semiautomated method presented in this study is a combination of the simplicity of the manual method and the efficiency of the automated method. This method is not perfect and is rather a compromise: It is still relatively user-dependent; the more the fetus moves during the examination, the more manual corrections need to be performed; therefore, the method may still be time-consuming. However, it is suitable for any kind of protocol used for the examination, can be applied retrospectively, and is fast and easily applicable for most prenatal MR imaging examinations. It is a simple Matlab-based algorithm that can also be adjusted and changed according to the user requirements.
We used the new method to measure 6 structure volumes and 4 ratios and presented the results as normal growth curves and percentile reference data. The previously reported structures measured were STV and CV. Hatab et al21 measured CV manually and reported it to be 2.8–5.0 mL at the 28th gestational week, 4.6–7.9 mL at the 32nd gestational week, and 6.6–11 mL at the 36th gestational week. This report is consistently smaller than the volumes measured by the new semiautomated method for which we report a CV of 3.9–6 mL at the 28th gestational week, 7.0–12.1 mL at the 32nd gestational week, and 11.0–20.1 mL at the 36th gestational week. However, our results are closer to the results of Clouchoux et al,11 who reported a mean CV of 5.5 mL at the 28th gestational week, 11 mL at the 32nd gestational week, and 16 mL at the 36th gestational week. Mean STVs reported by Clouchoux et al were 135, 190, and 250 mL at the 28th, 32nd, and 36th gestational weeks, respectively, which are like our measurements of 118, 192, and 256 mL at the same gestational weeks, respectively.
In addition to previously reported volumetric measurements of CV and STV, we used the new method to measure smaller and clinically relevant structures such as EBV and presented their reference data. Microphthalmia can be an important marker for congenital infections such as rubella22 and for several rare congenital pathologies, such as congenital glaucoma and persistent hyperplastic primary vitreous.23 These are sometimes difficult to detect prenatally and require an experienced investigator. A few studies have addressed the issue of eyeball biometry either in ultrasound or in 2D MR imaging.24,25 We measured the eyeball volumes, presented their growth curves according to gestational age, and supplied normal reference data. We also presented the ratio between EBV and STV with gestational age and showed that the EBV change rate is slower than the STV change rate. This information may become an important tool when assessing a suspected rubella infection during the second or third trimester, for example.
In their recent publication, Kasprian et al26 have addressed the issue of fetal brain asymmetry and reported significant asymmetric morphologic and biometric properties, some of them with lateralization patterns. In our study, we confirm the above findings that some volumetric asymmetry exists between the right and left hemispheres and right and left eyeballs. However, we have found no lateralization patterns. The SDs of the right and left ratios presented in the “Results” section may be of clinical significance when evaluating nonstandard volumetric asymmetry.
To systematically validate the method, we compared 19 fetal STVs measured manually with the same volumes measured by the semiautomated method. The relative difference revealed a maximum <8% discrepancy between the volumes measured by the 2 methods. The reproducibility of the new semiautomated method represented by the interobserver agreement was good or excellent for all structures measured, with an interclass correlation coefficient ranging between 0.88 and 0.99. However, for smaller structures, such as LEBV and REBV, the agreement was worse than for larger structures. This finding might be explained by the effect of section thickness on measurements of smaller structures and is a limitation of the new method. We demonstrated another benefit generated by our method, by comparing the time needed for measuring STV by both methods and found that using the new method took less than half the time of measuring it manually.
The semiautomated method we developed makes fetal volumetry accessible for both prospective and retrospective use. On the basis of our experience with this method, we can guardedly say that other structures in the brain can be measured relatively easily and quickly, even in small structures such as EBV. However, there are some limitations to this method. The software requires practice to understand the initial contour Sinit that gives the best result for each structure. The practice time required is short, and adequate experience is gained within a few measurements of each structure. In addition, as previously mentioned, because the structure measured is smaller, it is more prone to dependence on section thickness, affecting the accuracy and reproducibility of the measurement. Nevertheless, we believe that this method can be easily applied on intracranial structures and perhaps on extracranial structures as well, such as the heart, kidneys, and placenta. It might also be used on large pathologic lesions such as cysts, tumors, and any lesion not isointense on MR imaging.
Conclusions
We present a new semiautomated method to measure the volume of structures in the fetal brain on MR imaging. This method is technologically simple, easy to learn, and reproducible and can be applied prospectively and retrospectively on any MR imaging protocol. We provide normal growth curves and volumetric reference data measured by this method in a relatively large cohort. We believe that by applying it on different cranial and extracranial structures, anatomic and pathologic, fetal volumetry can evolve from a research tool to a practical clinical tool.
Supplementary Material
ABBREVIATIONS:
- CV
cerebellar volume
- EBV
total eyeball volume
- ICC
intraclass correlation coefficient
- LEBV
left eyeball volume
- LHV
left hemisphere volume
- REBV
right eyeball volume
- RHV
right hemisphere volume
- STV
supratentorial volume
References
- 1. de Flores R, La Joie R, Landeau B, et al. Effects of age and Alzheimer's disease on hippocampal subfields: comparison between manual and FreeSurfer volumetry. Hum Brain Mapp 2015;36:463–74 10.1002/hbm.22640 [DOI] [PMC free article] [PubMed] [Google Scholar]
- 2. Jain S, Sima DM, Ribbens A, et al. Automatic segmentation and volumetry of multiple sclerosis brain lesions from MR images. Neuroimage Clin 2015;8:367–75 10.1016/j.nicl.2015.05.003 [DOI] [PMC free article] [PubMed] [Google Scholar]
- 3. Shin H, Lee DK, Lee JM, et al. Atrophy of the cerebellar vermis in essential tremor: segmental volumetric MRI analysis. Cerebellum 2016;15:174–81 10.1007/s12311-015-0682-8 [DOI] [PubMed] [Google Scholar]
- 4. Farid N, Girard HM, Kemmotsu N, et al. Temporal lobe epilepsy: quantitative MR volumetry in detection of hippocampal atrophy. Radiology 2012;264:542–50 10.1148/radiol.12112638 [DOI] [PMC free article] [PubMed] [Google Scholar]
- 5. Hoffmann C, Grossman R, Bokov I, et al. Effect of cytomegalovirus infection on temporal lobe development in utero: quantitative MRI studies. Eur Neuropsychopharmacol 2010;20:848–54 10.1016/j.euroneuro.2010.08.006 [DOI] [PubMed] [Google Scholar]
- 6. Damodaram MS, Story L, Eixarch E, et al. Foetal volumetry using magnetic resonance imaging in intrauterine growth restriction. Early Hum Dev 2012;88(suppl 1):S35–40 10.1016/j.earlhumdev.2011.12.026 [DOI] [PubMed] [Google Scholar]
- 7. Scott JA, Habas PA, Kim K, et al. Growth trajectories of the human fetal brain tissues estimated from 3D reconstructed in utero MRI. Int J Dev Neurosci 2011;29:529–36 10.1016/j.ijdevneu.2011.04.001 [DOI] [PMC free article] [PubMed] [Google Scholar]
- 8. Gholipour A, Estroff JA, Barnewolt CE, et al. Fetal brain volumetry through MRI volumetric reconstruction and segmentation. Int J Comput Assist Radiol Surg 2011;6:329–39 10.1007/s11548-010-0512-x [DOI] [PMC free article] [PubMed] [Google Scholar]
- 9. Grossman R, Hoffman C, Mardor Y, et al. Quantitative MRI measurements of human fetal brain development in utero. Neuroimage 2006;33:463–70 10.1016/j.neuroimage.2006.07.005 [DOI] [PubMed] [Google Scholar]
- 10. Pier DB, Levine D, Kataoka ML, et al. Magnetic resonance volumetric assessments of brains in fetuses with ventriculomegaly correlated to outcomes. J Ultrasound Med 2011;30:595–603 10.7863/jum.2011.30.5.595 [DOI] [PMC free article] [PubMed] [Google Scholar]
- 11. Clouchoux C, Guizard N, Evans AC, et al. Normative fetal brain growth by quantitative in vivo magnetic resonance imaging. Am J Obstet Gynecol 2012;206:173.e1–8 10.1016/j.ajog.2011.10.002 [DOI] [PubMed] [Google Scholar]
- 12. Ber R, Bar-Yosef O, Hoffmann C, et al. Normal fetal posterior fossa in MR imaging: new biometric data and possible clinical significance. AJNR Am J Neuroradiol 2015;36:795–802 10.3174/ajnr.A4258 [DOI] [PMC free article] [PubMed] [Google Scholar]
- 13. Ginath S, Lerman-Sagie T, Haratz Krajden K, et al. The fetal vermis, pons and brainstem: normal longitudinal development as shown by dedicated neurosonography. J Matern Fetal Neonatal Med 2013;26:757–62 10.3109/14767058.2012.755508 [DOI] [PubMed] [Google Scholar]
- 14. Polat A, Barlow S, Ber R, et al. Volumetric MRI study of the intrauterine growth restriction fetal brain. Eur Radiol 2017;27:2110–18 10.1007/s00330-016-4502-4 [DOI] [PubMed] [Google Scholar]
- 15. Ashburner J, Friston KJ. Unified segmentation. Neuroimage 2005;26:839–51 10.1016/j.neuroimage.2005.02.018 [DOI] [PubMed] [Google Scholar]
- 16. Perona P, Malik J. Scale-space and edge detection using anisotropic diffusion. IEEE Trans Pattern Anal Mach Intell 1990;12:629–39 10.1109/34.56205 [DOI] [Google Scholar]
- 17. Li C, Xu C, Gui C, et al. Distance regularized level set evolution and its application to image segmentation. IEEE Trans Image Process 2010;19:3243–54 10.1109/TIP.2010.2069690 [DOI] [PubMed] [Google Scholar]
- 18. Rigby RA, Stasinopoulos DM. Automatic smoothing parameter selection in GAMLSS with an application to centile estimation. Stat Methods Med Res 2014;23:318–32 10.1177/0962280212473302 [DOI] [PubMed] [Google Scholar]
- 19. Borghi E, de Onis M, Garza C, et al. ; WHO Multicentre Growth Reference Study Group. Construction of the World Health Organization child growth standards: selection of methods for attained growth curves. Stat Med 2006;25:247–65 10.1002/sim.2227 [DOI] [PubMed] [Google Scholar]
- 20. Keraudren K, Kuklisova-Murgasova M, Kyriakopoulou V, et al. Automated fetal brain segmentation from 2D MRI slices for motion correction. Neuroimage 2014;101:633–43 10.1016/j.neuroimage.2014.07.023 [DOI] [PubMed] [Google Scholar]
- 21. Hatab MR, Kamourieh SW, Twickler DM. MR volume of the fetal cerebellum in relation to growth. J Magn Reson Imaging 2008;27:8404–05 10.1002/jmri.21290 [DOI] [PubMed] [Google Scholar]
- 22. Merdassi A, Limaiem R, Turki F, et al. Ophthalmologic manifestations of congenital rubella [in French]. Arch Pediatr 2011;18:870–73 10.1016/j.arcped.2011.05.009 [DOI] [PubMed] [Google Scholar]
- 23. Esmer AC, Sivrikoz TS, Gulec EY, et al. Prenatal diagnosis of persistent hyperplastic primary vitreous: report of 2 cases and review of the literature. J Ultrasound Med 2016;35:2285–91 10.7863/ultra.15.11040 [DOI] [PubMed] [Google Scholar]
- 24. Bojikian KD, de Moura CR, Tavares IM, et al. Fetal ocular measurements by three-dimensional ultrasound. J AAPOS 2013;17:276–81 10.1016/j.jaapos.2013.02.006 [DOI] [PubMed] [Google Scholar]
- 25. Paquette LB, Jackson HA, Tavaré CJ, et al. In utero eye development documented by fetal MR imaging. AJNR Am J Neuroradiol 2009;30:1787–91 10.3174/ajnr.A1664 [DOI] [PMC free article] [PubMed] [Google Scholar]
- 26. Kasprian G, Langs G, Brugger PC, et al. The prenatal origin of hemispheric asymmetry: an in utero neuroimaging study. Cereb Cortex 2011;21:1076–83 10.1093/cercor/bhq179 [DOI] [PubMed] [Google Scholar]
Associated Data
This section collects any data citations, data availability statements, or supplementary materials included in this article.


