Abstract
BACKGROUND AND PURPOSE:
Posterior fossa malformations are a common finding in prenatal diagnosis. The objectives of this study are to re-evaluate existing normal MR imaging biometric data of the fetal posterior fossa, suggest and evaluate new parameters, and demonstrate the possible clinical applications of these data.
MATERIALS AND METHODS:
This was a retrospective review of 215 fetal MR imaging examinations with normal findings and 5 examinations of fetuses with a suspected pathologic posterior fossa. Six previously reported parameters and 8 new parameters were measured. Three new parameter ratios were calculated. Interobserver agreement was calculated by using the intraclass correlation coefficient.
RESULTS:
For measuring each structure, 151–211 MR imaging examinations were selected, resulting in a normal biometry curve according to gestational age for each parameter. Analysis of the ratio parameters showed that vermian lobe ratio and cerebellar hemisphere ratio remain constant with gestational age and that the vermis-to-cisterna magna ratio varies with gestational age. Measurements of the 5 pathologic fetuses are presented on the normal curves. Interobserver agreement was excellent, with the intraclass correlation coefficients of most parameters above 0.9 and only 2 parameters below 0.8.
CONCLUSIONS:
The biometry curves derived from new and existing biometric data and presented in this study may expand and deepen the biometry we use today, while keeping it simple and repeatable. By applying these extensive biometric data on suspected abnormal cases, diagnoses may be confirmed, better classified, or completely altered.
The posterior cranial fossa is located between the foramen magnum, which forms its caudal boundary, and the tentorium cerebelli, which form its cephalad boundary. It includes the 3 parts of the brain stem: medulla oblongata, pons, and midbrain; the cerebellum with its vermis; and the fluid-filled spaces: the fourth ventricle and cisterna magna. The structures of the posterior fossa (PF) develop from the mesencephalon of the neural tube (midbrain and vermis), the metencephalon part of the rhombencephalon (pons and cerebellar hemispheres), and the myelencephalon part of the rhombencephalon (medulla oblongata), starting at the fourth gestational week. Normally, by the 18th gestational week, the PF consists of a developed vermis and cerebellum, a developed pons, and a fourth ventricle fully covered by the caudal part of the vermis, and the fluid-filled spaces are connected by the foramina of Luschka and Magendie.1,2
During the development of the structures and fluid-filled spaces of the PF, a wide spectrum of malformations of these structures is often observed. The variety of these malformations, isolated or part of a syndrome, and of their outcomes makes it difficult to classify the different pathologies.3,4 During the past decade, attempts to classify the PF malformations have been made, to help physicians and radiologists diagnose and give an accurate prognosis for fetuses with a pathologic PF.5–7
The different classifications and the possible diagnoses are mainly on the basis of the morphology of the fetal PF and its biometric data. Formerly, normal biometric data were taken mainly from studies of PF biometry in ultrasonographic imaging.8–12 However, MR imaging has advantages over sonography when assessing fetal PF, such as better accuracy when evaluating the vermis and better contrast resolution, which enable evaluation of the brain stem.13,14 Therefore, during the past 2 decades, MR imaging has become an important tool to prenatally evaluate the morphology of the PF, and many studies have been published to supply valid MR imaging biometric data.15–17 However, because using MR imaging prenatally is still not a common procedure and is usually performed on suspected abnormal fetuses, re-evaluation is still needed. In addition, the high resolution of MR images makes it possible to measure structures that could not be measured before.
In this study, we re-evaluated existing normal MR imaging biometric data of PF structures in a large cohort. In addition, we suggest new biometric data, that, to our knowledge, were not measured in previous studies, to help correctly diagnose suspected pathologic fetuses. We demonstrate the potential clinical use of these data by retrospectively evaluating 5 different suspected pathologic cases.
Materials and Methods
Population
We performed a retrospective review of 215 fetal MR imaging examinations in the Chaim Sheba Medical Center between 2007 and 2013. The included examinations were selected according to the following criteria: 25th–39th gestational week (the distribution of the number of fetuses examined by gestational week is presented in On-line Fig 1), no PF findings, and mild-to-no cerebral findings. Examinations of fetuses with isolated extracranial anomalies or maternal cytomegalovirus infection with no intracranial anomalies were also included. Eighty percent of the fetuses had no abnormal findings, and 20% had a mild lateral ventricular asymmetry or ventriculomegaly. The list of examination indications and findings is presented in On-line Table 1. For each structure measured, only satisfactory images in terms of quality and alignment were selected to be measured.
In addition, 5 fetuses with a suspected pathologic PF were selected for re-evaluation according to the new reference data generated in this study. The same structures were measured for these fetuses with the same procedure performed for healthy fetuses and detailed below.
MR Imaging Technique
In our institution, we perform fetal brain MR imaging by using a 1.5T system (Optima; GE Healthcare, Milwaukee, Wisconsin). Single-shot fast spin-echo T2-weighted sequences in 3 orthogonal planes were performed by using a half Fourier technique (NEX = 0.53) with the following parameters: section thickness, 3–4 mm; no gap; flexible coil (8-channel cardiac coil); matrix, 320/224; TE, 90 ms; and TR, 1298 ms. The FOV was determined by the size of the fetal head: 24 cm for the smaller fetuses and up to 30 cm for the larger fetuses. T1 fast-spoiled gradient-echo sequences were performed only in the axial plane with a larger FOV (400 mm); section thickness, 4 mm; gap, 0.5 mm; TR, 160 ms; and TE, 2.3 ms. The in-plane resolution of the T1 fast-spoiled gradient-recalled images was the following: sagittal—matrix, 256 × 160; FOV, 30 × 30; voxel, 1.17 × 1.875 mm; and coronal: matrix, 256 × 160; FOV, 36 × 36; voxel, 1.4 × 2.25 mm.
MR imaging was followed by a DWI sequence performed with a 40-cm FOV and b-values of 0 and 1000 or 700 ms. The ADC calculation map was added.18
Measurements
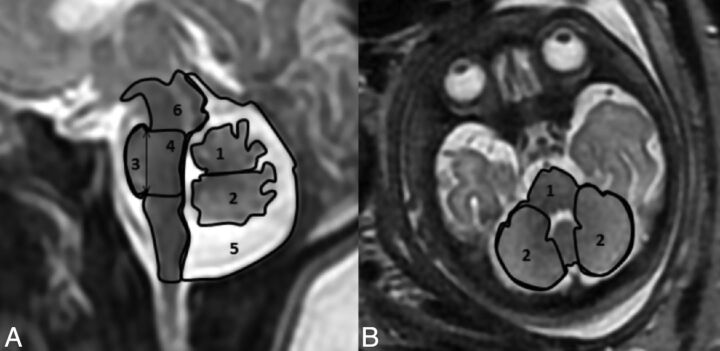
All measurements were performed manually by a single operator (R.B.) on a PACS reading workstation. Twenty-five random fetuses were remeasured by another operator (E.K.) to evaluate interobserver agreement for each structure. For each examination, 9 parameters were measured in the midsagittal section and 5, in the axial section. Axial section parameters were measured slightly above the base of skull in the plane of the following landmarks: the fastigium of the fourth ventricle, pons, anterior part of the temporal lobes, and eyeballs, with a symmetric presentation of the temporal lobes and eyeballs. Previously reported parameters measured in the midsagittal section included the anteroposterior diameter of the vermis, vermian height, vermian perimeter (VP), vermian cross-sectional area (VS), and pontine anteroposterior diameter. Previously reported parameters measured in the axial section included transcerebellar diameter (TCD). New parameters measured in the midsagittal section are presented in Fig 1A and included the vermian anterior lobe cross-sectional area, vermian posterior lobe cross-sectional area, pontine height, pontine cross-sectional area, brain stem cross-sectional area, and cisterna magna cross-sectional area (CMS). New parameters measured in the axial section are presented in Fig 1B and included the cerebellar perimeter and cerebellar cross-sectional area.
Fig 1.
New parameters measured. A, Sagittal section of the PF: 1) vermian anterior lobe cross-sectional area, 2) vermian posterior lobe cross-sectional area, 3) pontine height, 4) pontine cross-sectional area, 5) cisterna magna cross-sectional area, 6) brain stem cross sectional area. B, Axial section of the PF: 1) cerebellar cross-sectional area and perimeter, and 2) cerebellar hemisphere cross-sectional areas.
We calculated the following additional parameter ratios: the ratio between the cross-sectional areas of the vermian lobes (VLR), the ratio between the VS and CMS (VCMR), and the ratio between the cross-sectional areas of the cerebellar hemispheres (CHR). Previously reported biometric parameters (anteroposterior diameter of the vermis, vermian height, VS, VP, pontine anteroposterior diameter, TCD) were measured according to common methodology.15,19 New parameters introduced in this study were measured as follows.
Sagittal Section Measurements.
Vermian anterior lobe cross-sectional area and vermian posterior lobe cross-sectional area were measured as the cross-sectional area of the corresponding lobe of the vermis, with a separation line between the fourth ventricle fastigium and the vertex of the primary fissure of the vermis (Fig 1A). The posterolateral fissure, which separates the vermis from the nodule, is difficult to recognize in most images; therefore, the nodule of the vermis was included in the vermian posterior lobe cross-sectional area (Fig 1A).
Pontine height was measured as the height between the upper notch created between the pons and the cerebral peduncle and the lower notch created by the pontomedullary angle (Fig 1A).
The pontine cross-sectional area was measured as the area between 2 lines stretched from the pontopeduncular notch and the pontomedullary notch described above to the posterior boundary of the brain stem and orthogonal to its axis (Fig 1A).
CMS was measured as the area whose boundaries were the tentorium cerebelli, the posterior boundary of the brain stem, and the foramen magnum. The vermis, the fourth ventricle, and the cisterna magna were included in the CMS (Fig 1A).
Brain stem cross-sectional area was measured as the cross-sectional area of the medulla, the pons, and the midbrain with the tectum of the midbrain included (Fig 1A).
Axial Section Measurements.
The cerebellar perimeter and cerebellar cross-sectional area were measured as the perimeter and area, respectively, encircling the cerebellum and the pons (Fig 1B).
Cross-sectional areas of the cerebellar hemispheres were measured as the area of right and left hemispheres of the cerebellum alone, excluding the vermis (Fig 1B).
Statistical Analysis
All statistical analysis was performed by using R, Version 3.0.1 (R statistical computing software; http://www.r-project.org). The reference intervals were estimated by using the Generalized Additive Models for Location, Scale, and Shape model,20 the suggested method of the World Health Organization.21 In our study, the model for centile q at gestational age t was Cq = μt + σtZq, where μt and σt were the mean and SD at age t, measured in days, and Zq was the q centile of the standard normal distribution. The functions μt and σt were estimated and smoothed by using the Rigby and Stasinopoulos algorithm20 with a cubic spline smoothing. The normality assumption was slightly inadequate, but the resulting curves were almost identical to those achieved by assuming the Box-Cox t distribution (with 4 parameters) recommended.21 In addition, we found the skewness and kurtosis parameters of the Box-Cox t distribution to be nonsignificant for all response variables; this finding supports our decision to simply use the normal distribution without any transformation.
For the ratio variables (VCMR, VLR, CHR), we examined the hypothesis μt = μ, to assess the independence of the ratios with gestational age. The hypothesis was tested by using the Generalized Additive Models for Location, Scale and Shape.
Intraclass correlation coefficient (ICC) and limit of agreement were used to study the reliability of measurements across measurers, and 25 subjects were measured by 2 measurers for this purpose. Results were defined as poor for ICC < 0.6, satisfactory for 0.6 < ICC < 0.8, good for 0.8 < ICC < 0.9, and excellent for ICC > 0.9.
Ethics Approval
The research was approved by the hospital research ethics board.
Results
Normal Biometric Reference Data
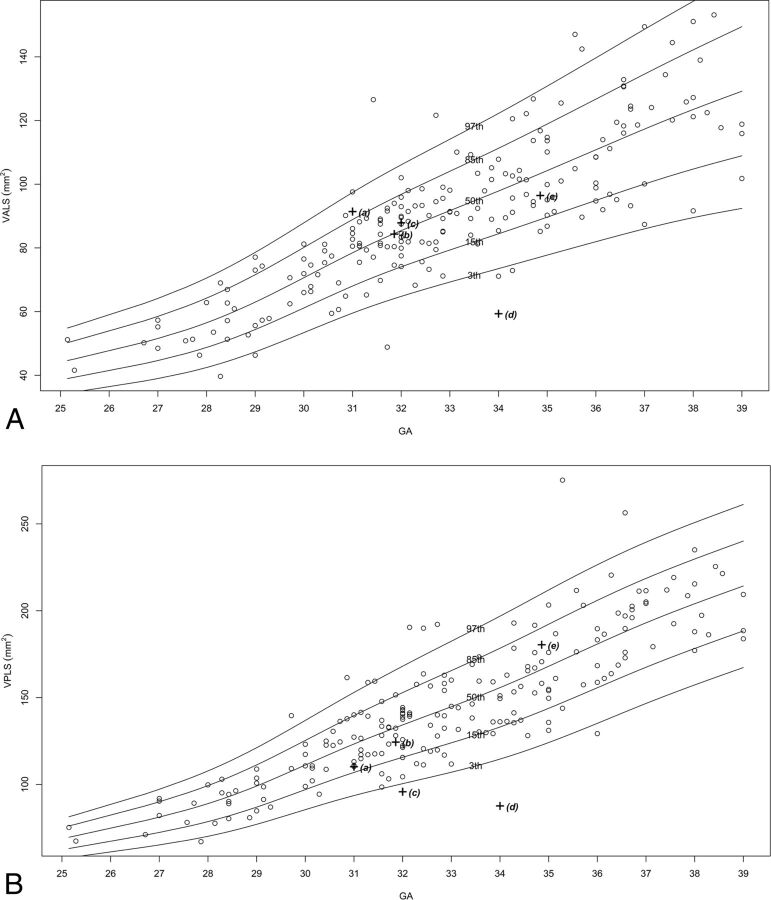
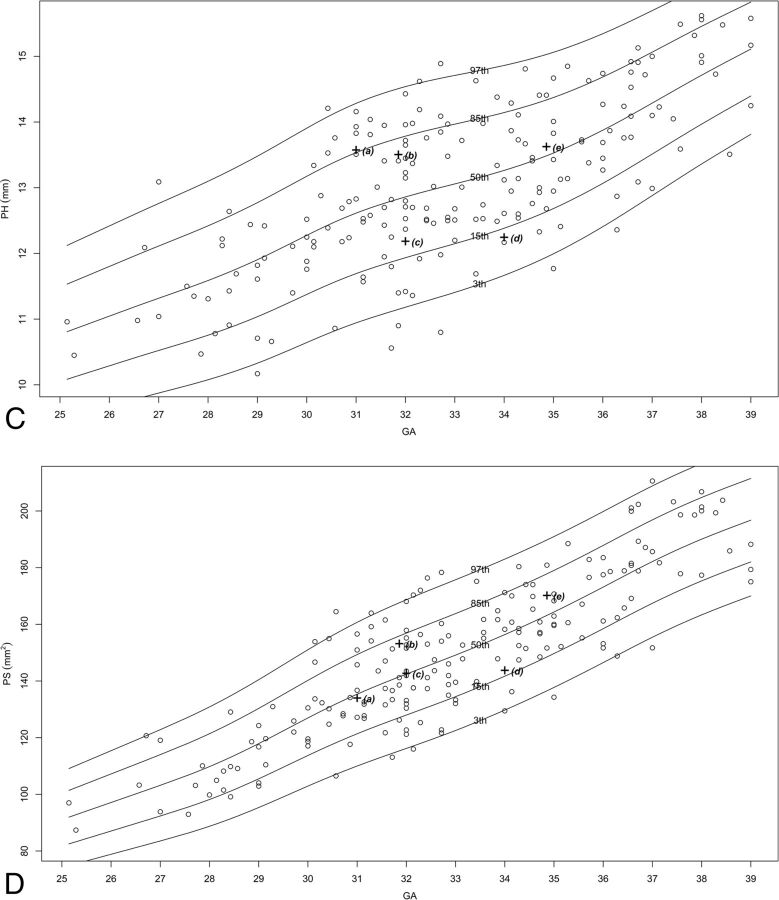
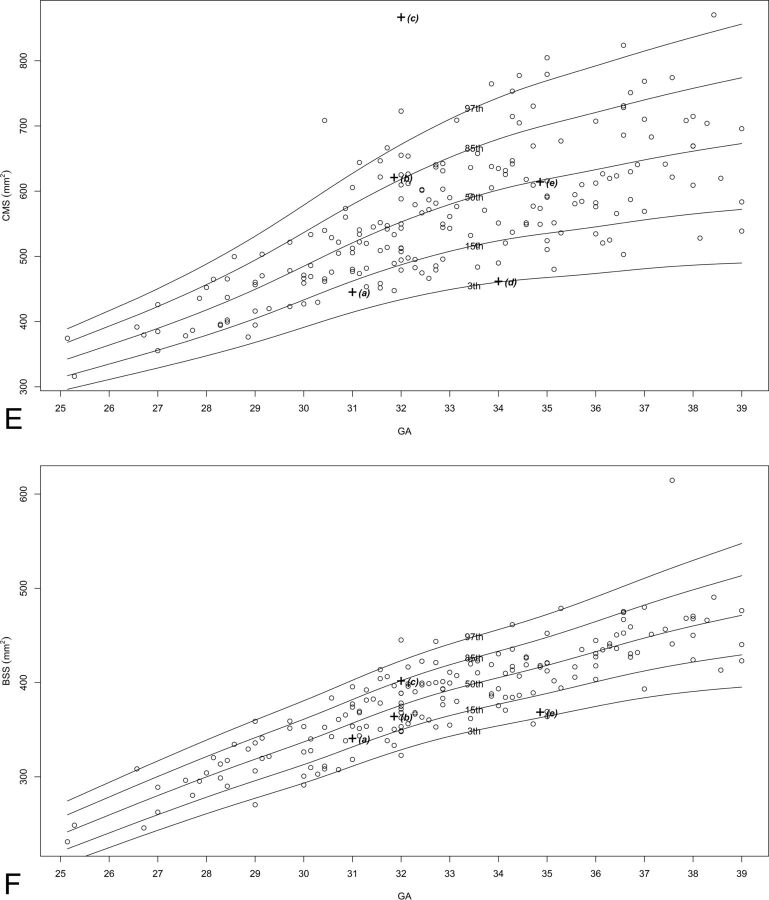
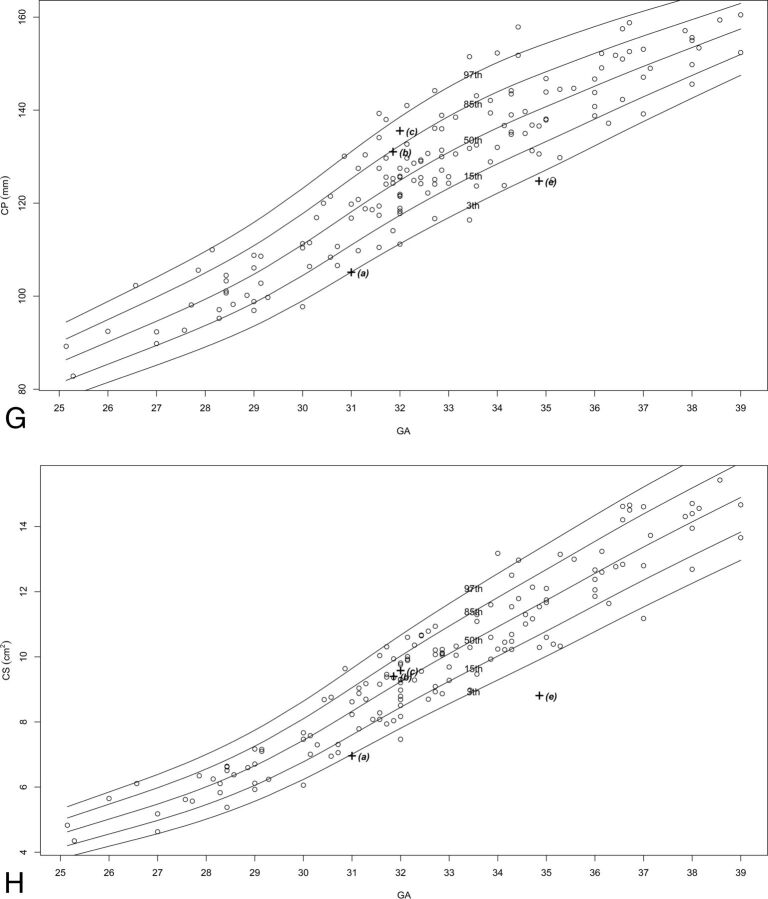
Two hundred fifteen MR imaging examinations were selected for measurement, of which 151–211 images were selected as adequate for measuring in terms of quality and alignment, for each structure. The number of images per structure is presented in On-line Table 2. Normal percentile curves of biometric reference data previously reported (anteroposterior diameter of the vermis, vermian height, VS, VP, pontine anteroposterior diameter, TCD) are presented in On-line Fig 2. Normal percentile curves of new biometric reference data (vermian anterior lobe cross-sectional area, vermian posterior lobe cross-sectional area, pontine height, pontine cross-sectional area, CMS, brain stem cross-sectional area, cerebellar perimeter, cerebellar cross-sectional area) are presented in Fig 2. Normal percentiles for each parameter by gestational age are presented in On-line Tables 3–16.
Fig 2.
Percentile curves for new parameters. A, Vermian anterior lobe cross-sectional area. B, Vermian posterior lobe cross-sectional area. C, Pontine height. D, Pontine cross-sectional area. E, Cisterna magna cross-sectional area. F, Brain stem cross-sectional area. G, Cerebellar perimeter. H, Cerebellar cross-sectional area.
Pathologic Cases Biometry
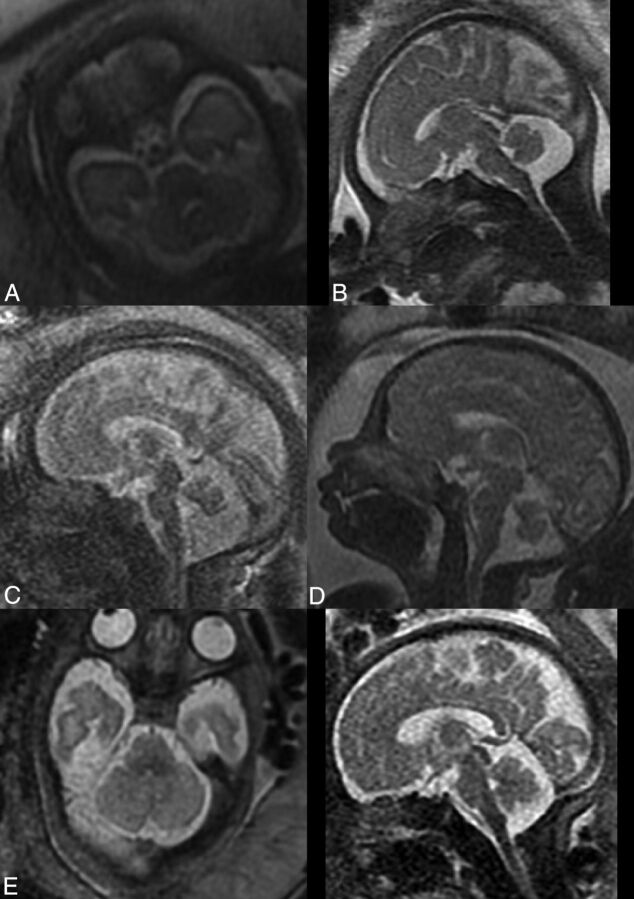
We obtained abnormal measurements for cases A, C, D, and E, according to new and previously reported biometric data. Case B had no abnormal measurements according to the parameters measured in this study. A list of the pathologic cases, their indication for MR imaging examination, and their abnormal biometry findings (measurements exceeding 2 SDs) is presented in the Table. The images of these fetuses are presented in Fig 3, and the measurements of images are presented on the normal curves in On-line Fig 2 and Fig 2 and are labeled according to their case number in the Table.
Abnormal measurements of pathologic cases
| Case | Gestational Age (weeks) | Indication for MRI | Abnormal Measurements |
|---|---|---|---|
| A | 31.0 | Cerebellar asymmetry | CHR, TCD, CS, and CP below 3rd percentile |
| B | 31.6 | Enlarged cisterna magna | No abnormal measurements |
| C | 32.0 | Suspected abnormal vermis | VS, VPLS, and VCMR below 3rd percentile; CMS and VLR above 97th percentile |
| D | 34.0 | Suspected abnormal vermis | APDV, VH, VS, VP, VALS, and VPLS below 3rd percentile |
| E | 32.0 | Low TCD measurements and suspected abnormal brain stem | TCD, CS, and CP below 3rd percentile |
Note:—APDV indicates anteroposterior diameter of the vermis; VH, vermian height; VALS, vermian anterior lobe cross-sectional area; CP, cerebellar perimeter; CS, cerebellar cross-sectional area; VPLS, vermian posterior lobe cross-sectional area.
Fig 3.
Pathologic cases indicated for MR imaging examinations. A, Cerebellar asymmetry. B, Enlarged cisterna magna. C, Suspected abnormal vermis. D, Suspected abnormal vermis. E, Low TCD measurements in axial (left) and saggital (right) planes.
Normal Parameter Ratios
For VCMR, we obtained a highly significant result (P < 10−10), implying that VCMR is not constant with gestational age. The normal percentile curves for VCMR are presented in On-line Fig 3, and the normal percentiles for VCMR are presented in On-line Table 17. For VLR and CHR, we obtained P = .09 and P = .59, respectively, and concluded that these ratios are constant with gestational age. Normal percentiles for VLR and CHR are presented in On-line Table 18.
Interobserver Agreement
Agreement between the 2 operators for each structure showed excellent correlation (ICC > 0.9) between measurers in 8 parameters, good correlation (0.8 < ICC < 0.9) in 4 parameters, and satisfactory correlation in only 2 parameters, VP and pontine height. The results are presented in On-line Table 19.
Discussion
Malformations of the posterior fossa are a common finding in prenatal diagnosis and include a wide variety of pathologies and a wide spectrum of prognoses.1,11,22 Therefore, the exact diagnosis and accurate prognosis given to the soon-to-be parents are crucial for the their understanding of the consequences of these malformations. The establishment of a diagnosis of PF malformation is based on several parameters, including anatomy, morphology, and biometry.7 Insufficient biometry and reliance on examiners' subjective assessments may lead to a wrong diagnosis and wrong prognosis, including under- or overdiagnosis of different pathologies.23,24
Existing 2D MR imaging biometric data of the PF are limited to only a few parameters, which reduce the ability to analyze dynamic components such as the PF structures. Thus, the physician evaluating the fetus must rely on his or her subjective evaluation with limited objective tools. Furthermore, some previously reported studies showed no benefit in diagnosing PF malformations by using MR imaging compared with ultrasound.4,22,25 However, the increasing use of fetal MR imaging examinations after ultrasound screening to diagnose cerebral pathologies enables us to expand our biometric data to finer structures such as the vermian lobes and the brain stem. The vermian primary fissure is difficult to recognize by using ultrasound, making it difficult to differentiate between the vermian lobes. The brain stem is considered difficult to depict by using ultrasound techniques, and only limited biometric data are available.10 MR imaging allows better evaluation of these structures and possible biometric assessment that might reinforce the role of MR imaging after ultrasound screening. Recent studies suggest a challenging approach to this issue by developing the technology to expand to 3D MR imaging biometry.26–29 However, this approach has not matured and is not yet in clinical use.
In this study, we suggest that a more comprehensive yet technologically simple 2D biometry, including biometric relations between structures, can be a more thorough and accurate objective tool for diagnosing PF malformations. We performed measurements on a large cohort of 215 fetuses from the 25th to 39th gestational week. We measured 6 previously reported parameters15,19 (anteroposterior diameter of the vermis, vermian height, VS, VP, pontine anteroposterior diameter, TCD) that are routinely used as biometric data. These parameters, together with morphologic analysis by the physician, support the diagnosis of PF malformations. To these existing data, we added 8 new biometric parameters and 3 new ratio parameters. We provided normal curves of these parameters and third, 15th, 50th, 85th, and 97th percentiles. We also showed the reproducibility of these measurements by evaluating interobserver agreement. Only 2 parameters, VP and pontine height, showed a satisfactory agreement. This could be explained by the difficulty in recognizing small fissures of the vermis in the case of VP and the difficulty in determining the location of the pontomedullary angle in the case of pontine height. The rest of the parameters measured showed good-to-excellent interobserver agreement. These expanded biometric data may replace the subjective morphologic assessment and allow further objective investigation of the pathologies.
Case A is an example of the possible clinical significance of the new parameters. Cerebellar asymmetry is a pathology diagnosed by the physician by morphologically evaluating the fetal cerebellum, along with measuring a small TCD. The cerebellar hemisphere ratio parameter, introduced in this study, may help the physician determine whether the asymmetry between lobes is within normal limits. In this case, the CHR was measured as 1.52, which exceeds normal limits and validates the subjective diagnosis of cerebellar asymmetry. By these data, we turn subjective analysis into an objective biometry-based analysis.
“Mega cisterna magna” is historically defined as a cisterna magna diameter exceeding 10 mm.30 Previous studies have reported this definition to be inaccurate, and it has been shown to vary with gestational age.31,32 The cisterna magna is a fluid-filled space that is normally continuous with the subarachnoid space of the entire PF, between the foramen magnum and the tentorium cerebelli. We measured the cross-sectional area of the entire fluid-filled space in the midsagittal section (CMS) and the ratio between the vermian cross-sectional area and the CMS. As reported and seen in Figs 2, both CMS and VCMR change according to gestational age but at different rates due to the change in VS. Case B was referred for MR imaging due to an enlarged cisterna magna on ultrasound examination; the cisterna magna was measured as >10 mm on MR imaging. However, the new parameters, CMS and VCMR, were normal for this case. We believe that these curves may suggest a different approach for diagnosing mega cisterna magna, both isolated and as part of a more complex PF malformation. Perhaps by redefining the criteria for mega cisterna magna according to the new parameters, CMS and VCMR, we may avoid overdiagnosis of mega cisterna magna.
Cases C and D were both referred for MR imaging examination due to a suspected abnormal vermis on ultrasound. As seen in Fig 3, both cases present a rotated and small vermis. Indeed, VS parameters for the 2 cases are below the third percentile. Nevertheless, when we applied the new parameter measurements, a differentiation between those cases could be achieved. Case C presented with an abnormal ratio between the vermian lobes, VLR above the 97th percentile, with a small posterior lobe. This finding may imply that the posterior lobe of the vermis either developed abnormally or experienced mass effect by the fluid below it. This case also presented with an enlarged cisterna magna with CMS above the 97th percentile and VCMR below the third percentile. Case D, on the other hand, presented with a normal VLR, with 2 vermian lobe areas below the third percentile. This case did not present with an enlarged cisterna magna. The 2 seemingly similar cases morphologically are now 2 different cases biometrically. This result may help us avoid misinterpretations and overdiagnoses that were previously reported among entities such as partial vermian agenesis, inferior vermian hypoplasia, Blake pouch, and arachnoid cyst.19 The primary fissure may be difficult to detect in cases of a rotated vermis, such as in Dandy-Walker malformation, and this is a limitation of the new measurements. However, in borderline cases such as C and D, it should be possible to recognize the primary fissure.
Case E was referred for MR imaging examination due to a small TCD and a suspected abnormal cerebellum and brain stem. As seen in Fig 3, one might suspect an asymmetry between cerebellar lobes and the brain stem looks relatively normal. When one applies the new biometric data, this case presents with a normal CHR, lowering the suspicion of asymmetry. The brain stem had relatively small biometric measurements (pontine anteroposterior diameter and brain stem cross-sectional area) below the 15th percentile. The cerebellum had all measurements (TCD, cerebellar cross-sectional area, and cerebellar perimeter) below the third percentile. These data help us describe the biometry of the PF accurately: a cerebellum that is small for gestational age, a brain stem that is relatively small, and a normal vermis and cisterna magna. This biometry may help us support or lower the suspicion of pontocerebellar dysplasia, for example.
The main limitation of this study is that we demonstrated the possible clinical significance of the new data only by applying it on selected pathologic cases. We did not compare the diagnoses we made by using these data with the previous evaluations of the pathologic cases, postnatal imaging, and their clinical outcomes. Another limitation is that we evaluated the interobserver agreement on measurements of normal cases. The results of this agreement are not necessarily valid for measurements of abnormal cases. We also did not assess the sex effect on PF measurements. This effect was previously reported to be significant statistically but insignificant clinically.17
Conclusions
Diagnosis of fetal pathologies of the PF are based mainly on biometry and morphology of the different structures. The expanding usage of MR imaging in prenatal screening enables us to expand the biometry we use in sonography screening. In this study, we presented comprehensive normative data, including the biometry of previously reported and new parameters and parameter ratios, in MR imaging, while keeping them simple and repeatable. We suggest that applying these new data may help further classify posterior fossa malformations, confirm borderline diagnoses, and avoid over- and underdiagnoses.
Supplementary Material
ABBREVIATIONS:
- ICC
intraclass correlation coefficient
- CHR
cerebellar hemisphere ratio
- CMS
cisterna magna cross-sectional area
- PF
posterior fossa
- TCD
transcerebellar diameter
- VCMR
vermis-to-cisterna magna ratio
- VLR
vermian lobe ratio
- VP
vermian perimeter
- VS
vermian cross-sectional area
REFERENCES
- 1. Adamsbaum C, Moutard ML, Andre C, et al. MRI of the fetal posterior fossa. Pediatr Radiol 2005;35:124–40 [DOI] [PubMed] [Google Scholar]
- 2. Shekdar K. Posterior fossa malformations. Semin Ultrasound CT MR 2011;32:228–41 [DOI] [PubMed] [Google Scholar]
- 3. Guibaud L. Practical approach to prenatal posterior fossa abnormalities using MRI. Pediatr Radiol 2004;34:700–11 [DOI] [PubMed] [Google Scholar]
- 4. Malinger G, Lev D, Lerman-Sagie T. The fetal cerebellum. Pitfalls in diagnosis and management. Prenat Diagn 2009;29:372–80 [DOI] [PubMed] [Google Scholar]
- 5. Tortori-Donati P, Fondelli MP, Rossi A, et al. Cystic malformations of the posterior cranial fossa originating from a defect of the posterior membranous area: mega cisterna magna and persisting Blake's pouch—two separate entities. Childs Nerv Syst 1996;12:303–08 [DOI] [PubMed] [Google Scholar]
- 6. Patel S, Barkovich AJ. Analysis and classification of cerebellar malformations. AJNR Am J Neuroradiol 2002;23:1074–87 [PMC free article] [PubMed] [Google Scholar]
- 7. Guibaud L, des Portes V. Plea for an anatomical approach to abnormalities of the posterior fossa in prenatal diagnosis. Ultrasound Obstet Gynecol 2006;27:477–81 [DOI] [PubMed] [Google Scholar]
- 8. Snijders RJ, Nicolaides KH. Fetal biometry at 14–40 weeks' gestation. Ultrasound Obstet Gynecol 1994;4:34–48 [DOI] [PubMed] [Google Scholar]
- 9. Zalel Y, Seidman DS, Brand N, et al. The development of the fetal vermis: an in-utero sonographic evaluation. Ultrasound Obstet Gynecol 2002;19:136–39 [DOI] [PubMed] [Google Scholar]
- 10. Achiron R, Kivilevitch Z, Lipitz S, et al. Development of the human fetal pons: in utero ultrasonographic study. Ultrasound Obstet Gynecol 2004;24:506–10 [DOI] [PubMed] [Google Scholar]
- 11. Bertucci E, Gindes L, Mazza V, et al. Vermian biometric parameters in the normal and abnormal fetal posterior fossa: three-dimensional sonographic study. J Ultrasound Med 2011;30:1403–10 [DOI] [PubMed] [Google Scholar]
- 12. Ginath S, Lerman-Sagie T, Haratz Krajden K, et al. The fetal vermis, pons and brainstem: normal longitudinal development as shown by dedicated neurosonography. J Matern Fetal Neonatal Med 2013;26:757–62 [DOI] [PubMed] [Google Scholar]
- 13. Tilea B, Delezoide AL, Khung-Savatovski S, et al. Comparison between magnetic resonance imaging and fetopathology in the evaluation of fetal posterior fossa non-cystic abnormalities. Ultrasound Obstet Gynecol 2007;29:651–59 [DOI] [PubMed] [Google Scholar]
- 14. Blondiaux E, Garel C. Fetal cerebral imaging–ultrasound vs. MRI: an update. Acta Radiol 2013;54:1046–54 [DOI] [PubMed] [Google Scholar]
- 15. Garel C. Fetal cerebral biometry: normal parenchymal findings and ventricular size. Eur Radiol 2005;15:809–13 [DOI] [PubMed] [Google Scholar]
- 16. Triulzi F, Parazzini C, Righini A. MRI of fetal and neonatal cerebellar development. Semin Fetal Neonatal Med 2005;10:411–20 [DOI] [PubMed] [Google Scholar]
- 17. Tilea B, Alberti C, Adamsbaum C, et al. Cerebral biometry in fetal magnetic resonance imaging: new reference data. Ultrasound Obstet Gynecol 2009;33:173–81 [DOI] [PubMed] [Google Scholar]
- 18. Hoffmann C, Weisz B, Yinon Y, et al. Diffusion MRI findings in monochorionic twin pregnancies after intrauterine fetal death. AJNR Am J Neuroradiol 2013;34:212–16 [DOI] [PMC free article] [PubMed] [Google Scholar]
- 19. Garel C, Fallet-Bianco C, Guibaud L. The fetal cerebellum: development and common malformations. J Child Neurol 2011;26:1483–92 [DOI] [PubMed] [Google Scholar]
- 20. Rigby RA, Stasinopoulos DM. Generalized additive models for location, scale and shape. Appl Statist 2005;54(part 3):507–54 [Google Scholar]
- 21. Borghi E, de Onis M, Garza C, et al. Construction of the World Health Organization child growth standards: selection of methods for attained growth curves. Stat Med 2006;25:247–65 [DOI] [PubMed] [Google Scholar]
- 22. Gandolfi Colleoni G, Contro E, Carletti A, et al. Prenatal diagnosis and outcome of fetal posterior fossa fluid collections. Ultrasound Obstet Gynecol 2012;39:625–31 [DOI] [PubMed] [Google Scholar]
- 23. Limperopoulos C, Robertson RL, Estroff JA, et al. Diagnosis of inferior vermian hypoplasia by fetal magnetic resonance imaging: potential pitfalls and neurodevelopmental outcome. Am J Obstet Gynecol 2006;194:1070–76 [DOI] [PMC free article] [PubMed] [Google Scholar]
- 24. Limperopoulos C, Robertson RL Jr, Khwaja OS, et al. How accurately does current fetal imaging identify posterior fossa anomalies? AJR Am J Roentgenol 2008;190:1637–43 [DOI] [PMC free article] [PubMed] [Google Scholar]
- 25. Malinger G, Lev D, Lerman-Sagie T. Is fetal magnetic resonance imaging superior to neurosonography for detection of brain anomalies? Ultrasound Obstet Gynecol 2002;20:317–21 [DOI] [PubMed] [Google Scholar]
- 26. Andreas T, Wedegartner U, Tchirikov M, et al. Fetal brain volume measurements by magnetic resonance imaging. Ultrasound Obstet Gynecol 2006;27:588–89 [DOI] [PubMed] [Google Scholar]
- 27. Ioannou C, Sarris I, Salomon LJ, et al. A review of fetal volumetry: the need for standardization and definitions in measurement methodology. Ultrasound Obstet Gynecol 2011;38:613–19 [DOI] [PubMed] [Google Scholar]
- 28. Scott JA, Hamzelou KS, Rajagopalan V, et al. 3D morphometric analysis of human fetal cerebellar development. Cerebellum 2012;11:761–70 [DOI] [PMC free article] [PubMed] [Google Scholar]
- 29. Vatansever D, Kyriakopoulou V, Allsop JM, et al. Multidimensional analysis of fetal posterior fossa in health and disease. Cerebellum 2013;12:632–44 [DOI] [PubMed] [Google Scholar]
- 30. Mahony BS, Callen PW, Filly RA, et al. The fetal cisterna magna. Radiology 1984;153:773–76 [DOI] [PubMed] [Google Scholar]
- 31. Garel C. Posterior fossa malformations: main features and limits in prenatal diagnosis. Pediatr Radiol 2010;40:1038–45 [DOI] [PubMed] [Google Scholar]
- 32. Brown RN. Reassessment of the normal fetal cisterna magna during gestation and an alternative approach to the definition of cisterna magna dilatation. Fetal Diagn Ther 2013;34:44–49 [DOI] [PubMed] [Google Scholar]
Associated Data
This section collects any data citations, data availability statements, or supplementary materials included in this article.


