Abstract
BACKGROUND AND PURPOSE:
Although radiation induced damage to the salivary gland is a known complication of radioactive iodine (131I) therapy for thyroid carcinoma, prediction of the severity and reversibility of sialoadenitis is difficult. Our aim was to correlate the extent of salivary dysfunction assessed by salivary gland scintigraphy with changes in the volume and attenuation of salivary glands on nonenhanced CT in postoperative patients with thyroid cancer treated with RIT.
MATERIALS AND METHODS:
Forty patients with thyroid carcinoma, 13 men (age range, 21–80 years) and 27 women (age range, 28–75 years) who underwent a total thyroidectomy and were treated with RIT were assessed retrospectively. On CT, the percentage of volume reduction and the difference in attenuation of the parotid and submandibular glands after RIT were determined and correlated with the extent of radiation-induced salivary dysfunction on scintigraphy.
RESULTS:
The salivary gland volume significantly decreased with an increase in the dysfunction grade on scintigraphy for both the parotid and submandibular glands (P < .001). The attenuation significantly increased with an increase in the dysfunction grade on scintigraphy for the parotid gland (P < .001), but not for the submandibular gland. The cutoff value of volume reduction to diagnose severe gland dysfunction was 19.5% (sensitivity, 86.0%; specificity, 100%) for the parotid gland and 31.0% (sensitivity, 100%; specificity, 97.0%) for the submandibular gland, and that of the attenuation change was 9.8 HU (sensitivity, 81.0%; specificity, 95%) for the parotid gland.
CONCLUSIONS:
The reduction in volume of the parotid and submandibular glands and the increase in attenuation of the parotid gland on nonenhanced CT can be indicators of the grade of RIT-induced salivary dysfunction.
The use of RIT for ablation of residual thyroid tissue after surgery has been established for the management of differentiated thyroid cancer.1 Due to simultaneous accumulation of 131I in the salivary glands, radiation damage to the salivary gland is a known immediate and long-term complication of RIT.2–4 Patients with RIT-induced salivary dysfunction have a variety of symptoms, including swelling and pain in the parotid region, dryness of the mouth, altered taste, and difficulty swallowing. With RIT, however, calculation of the actual absorbed dose in the salivary glands and prediction of the severity and reversibility of associated sialoadenitis are difficult. Generally, qualitative and quantitative salivary gland scintigraphy has been used for the assessment and follow-up of salivary gland dysfunction after RIT.5–9
CT of the neck and chest is usually performed in patients who have undergone RIT for evaluation of the recurrence and metastasis of thyroid carcinoma. We have noticed that the salivary glands, especially the parotid glands, show some shrinkage and an increase in attenuation on CT scans obtained during the follow-up period after RIT. These changes are likely due to radiation-induced sialoadenitis and could be a predictor of salivary gland dysfunction. A few studies have reported dose-dependent volume loss of the salivary gland in patients undergoing external radiation for head and neck cancers,10–13 but no previous studies have assessed the effect of RIT on gland volume or attenuation, to our knowledge.
In this study, we examine the relationship between the extent of salivary gland dysfunction evaluated on scintigraphy and changes in volume and attenuation of the salivary glands on CT in postoperative patients with thyroid carcinoma treated with therapeutic doses of radioiodine.
Materials and Methods
Patients
The protocol for this retrospective study was approved by our institutional review board without requirement of informed consent. The study subjects were 40 patients: Thirteen were men (age range, 21–80 years; mean age, 61 years) and 27 were women (age range, 28–75 years; mean age, 55 years). All patients had undergone a total thyroidectomy for well-differentiated thyroid carcinoma and subsequent RIT from January 2006 to January 2011. We divided the patients into 4 groups according to the number of doses of RIT: 20, 10, 4, and 6 patients received 1, 2, 3, and 4 doses, respectively. The individual doses ranged from 5.1 to 5.6 GBq (139–150 mCi), with a mean of 5.3 GBq (144.5 mCi). None of these patients had known salivary diseases, including Sjögren disease, chronic sialolithiasis, sialadenitis, or sialosis.
Imaging Examinations
Salivary gland scintigraphy and non-contrast-enhanced neck CT were performed before the initial RIT in all patients. The average time interval from pretreatment salivary gland scintigraphy and CT to the initial RIT was 8 days (range, 1–15 days). Changes in the salivary glands after RIT were evaluated on scintigraphy and CT scans obtained on the same day, with an average interval of 9 months (range, 6–12 months) since the last therapy and of 17 months (range, 8–38 months) since the first dose of RIT.
Scintigraphy Studies.
Salivary gland function was estimated by salivary gland scintigraphy by using 185-MBq (5 mCi) technetium Tc99m pertechnetate. All salivary gland scintigraphic data were assessed by a radiologist (A.O., with 15 years' experience in nuclear medicine). Depending on the salivary gland uptake and excretion, its function was classified into the following 4 grades: grade 1, normal uptake and excretion; grade 2, mild dysfunction, decreased salivary uptake, and delayed excretion, with oral activity equal to salivary uptake at 30–40 minutes; grade 3, moderate dysfunction, markedly decreased salivary gland uptake, and delayed excretion, with higher salivary gland activity than oral activity at 30–40 minutes; and grade 4, severe dysfunction, severely decreased salivary uptake and higher background than salivary activity during the entire study.7,8 To judge the grade of function in the parotid and submandibular glands, we initially determined the grade of each side gland separately. For the final grade, we used the worst grade in cases with different grades of the bilateral glands.
CT Studies.
CT examinations were performed by using a 16-detector row scanner (Aquilion 16; Toshiba Medical Systems, Tokyo, Japan). CT images were obtained with the following parameters: the tube voltage, 120 kV; tube current, 280–400 mA (automatically adjusted for the patient body build); gantry rotation time, 0.5 seconds; detector collimation, 1 mm; and a table feed, 12 mm per gantry rotation. Contiguous 3-mm-thick-section axial images were reconstructed. All CT studies were performed without contrast enhancement.
All CT studies were assessed by 2 radiologists (T.S. and B.N., with 9 and 3 years' experience in head and neck imaging, respectively), who were blinded to the results of scintigraphy. The volume and attenuation of the bilateral parotid and submandibular glands were retrospectively measured in each patient on both CT images obtained before the initial RIT and after the last RIT. The volume of the salivary gland was measured by summation of products of an area of the salivary gland on each section and section thickness. The area of the salivary gland was obtained by a manually contoured region-of-interest measurement. The percentage of volume reduction of each gland after treatment was calculated with the following formula: (Pretreatment Volume − Posttreatment Volume)/Pretreatment Volume × 100. The attenuation of each gland was determined by a region-of-interest measurement (region-of-interest size, 40–60 mm2) on CT scans obtained before and after the RIT, and their difference (Posttreatment Attenuation − Pretreatment Attenuation) was defined as an attenuation change of the salivary gland. The mean of the above-mentioned percentage of volume reduction and attenuation change of the bilateral parotid and submandibular glands was used as a CT index for each salivary gland.
Statistical Analyses
All statistical analyses were performed by using a commercially available software program (Statistical Package for the Social Sciences, Version 15.0 for Windows; SPSS, Chicago, Illinois). The correlation between the grade of dysfunction of the gland on scintigraphy and the number of RIT sessions was assessed by using the Spearman rank correlation test. The correlations of the volume reduction and attenuation change of the salivary glands with the dysfunction grade of the salivary gland on scintigraphy were assessed by using a 1-way analysis of variance. Multiple comparisons of volume reduction and attenuation changes of the group with each dysfunction grade were assessed by using the Tukey Honestly Significant Difference test. The comparisons of the incidences of each grade of dysfunction after RIT and those of the mean values of pretreatment attenuation and attenuation change after RIT between the parotid and submandibular glands were assessed by using the χ2 test and a paired t test, respectively. We calculated a correlation coefficient to assess the correlation between 2 datasets. A P value < .05 was considered statistically significant. The cutoff value of the volume-reduction percentage and attenuation change of the salivary gland to diagnose grade 4 (severe) dysfunction of the gland was determined by an ROC curve.
Results
Grade of Dysfunction on Scintigraphy and Its Correlation with the Treatment Dose
The grade of function in the parotid gland in all patients before RIT was grade 1 in 32, grade 2 in 8, grade 3 in 0, and grade 4 in 0 patients, and that after RIT was grade 1 in 9, grade 2 in 4, grade 3 in 6, and grade 4 in 21 patients. The deterioration in the parotid gland function on scintigraphy increased with an increase in the number of radiation treatments (r = 0.593, P < .001, Spearman rank correlation test) (Table 1).
Table 1:
The correlation of the grade of parotid gland dysfunction on scintigraphy and the number of radioiodine treatments
| No. of Radioiodine Treatments | Grade of Salivary Dysfunction on Scintigraphy |
||||
|---|---|---|---|---|---|
| 1 | 2 | 3 | 4 | Total | |
| Pretreatment | 32 | 8 | 0 | 0 | 40 |
| 1 | 8 | 3 | 5 | 4 | 20 |
| 2 | 0 | 1 | 1 | 8 | 10 |
| 3 | 0 | 0 | 0 | 4 | 4 |
| 4 | 1 | 0 | 0 | 5 | 6 |
The grade of function in the submandibular gland in all patients before RIT was grade 1 in 31, grade 2 in 9, grade 3 in 0, and grade 4 in 0 patients, and that after RIT was grade 1 in 11, grade 2 in 12, grade 3 in 12, and grade 4 in 5 patients. The grade of dysfunction in the submandibular glands also increased with an increase in the number of treatments (r = 0.636, P < .001, Spearman rank correlation test) (Table 2).
Table 2:
The correlation of the grade of submandibular gland dysfunction on scintigraphy with the number of radioiodine treatments
| No. of Radioiodine Treatments | Grade of Salivary Dysfunction on Scintigraphy |
||||
|---|---|---|---|---|---|
| 1 | 2 | 3 | 4 | Total | |
| Pretreatment | 31 | 9 | 0 | 0 | 40 |
| 1 | 11 | 5 | 4 | 0 | 20 |
| 2 | 0 | 4 | 4 | 2 | 10 |
| 3 | 0 | 1 | 2 | 1 | 4 |
| 4 | 0 | 2 | 2 | 2 | 6 |
When we compared the incidence of each grade of dysfunction after RIT in all patients, the parotid gland showed a significantly higher grade of dysfunction than the submandibular gland (P < .002, χ2 test).
Results on CT and Their Correlation with the Grade of Dysfunction on Scintigraphy
Due to the small number of total patients and to simplify the analysis, we combined grades 2 and 3 salivary dysfunction into 1 category and divided all of the patients into 3 groups, depending on the results of scintigraphy; grade 1, grades 2 and 3, and grade 4 in the subsequent analyses.
Volume Reduction of the Gland on CT versus the Grade of Dysfunction on Scintigraphy
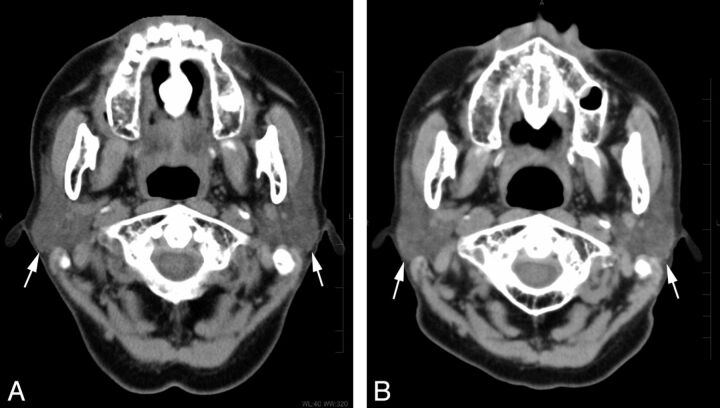
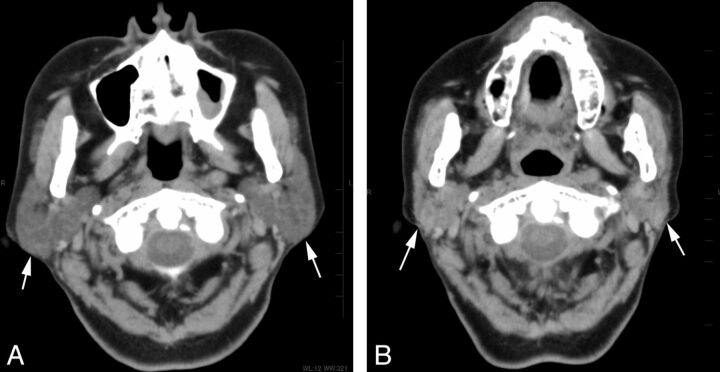
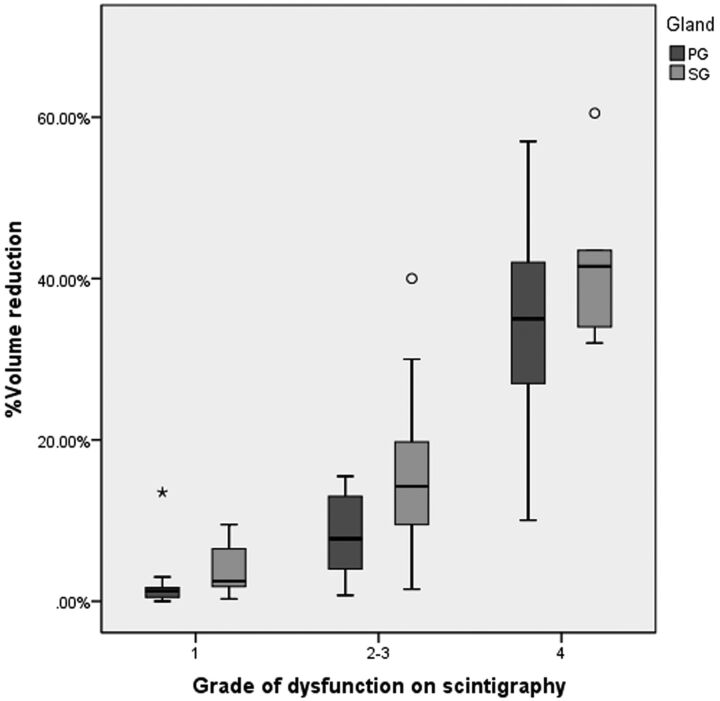
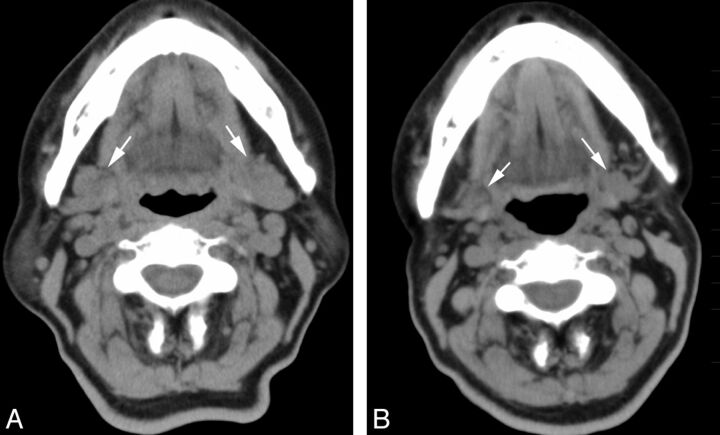
The reduction volume (mean ± SD; 95% confidence interval) in the parotid gland after RIT, depending on the grade of scintigraphy, was 2.5 ± 4.2% (0%–5.8%) for grade 1 (n = 9); 7.9 ± 5.2% (4.2%–11.7%) for grades 2 and 3 (n = 10); and 35.0 ± 13.9% (28.7%–41.4%) for grade 4 (n = 21) (Figs 1 and 2). The parotid gland volume after the treatment significantly decreased with an increase in the grade of dysfunction on scintigraphy (P < .001, 1-way analysis of variance). A significant difference in the reduction volume was present between grade 1 and grade 4 (P < .001) and grades 2 and 3 and grade 4 (P < .001) groups, but not between grade 1 and grades 2 and 3 groups, as determined by the Tukey Honestly Significant Difference test (Fig 3).
Fig 1.
A 73-year-old woman who underwent 2 radioiodine treatments showed mild dysfunction of the parotid gland on scintigraphy. Non-contrast-enhanced CT images (A) before and (B) after the treatment. Bilateral parotid glands (arrows) showed only mild shrinkage (volume reduction of 12%) and an increase in attenuation (6 HU) on the CT scan obtained after the treatment.
Fig 2.
A 71-year-old woman who underwent 3 radioiodine treatments showed severe dysfunction of the parotid gland on scintigraphy. Non-contrast-enhanced CT images (A) before and (B) after the treatment. The bilateral parotid glands (arrows) showed prominent volume reduction of 53% and an increase in attenuation of 32 HU on CT after the treatment.
Fig 3.
The volume reduction of the parotid and submandibular glands on CT after radioiodine therapy in relation to the dysfunction grade on scintigraphy (Tukey Honestly Significant Difference test). In the parotid gland, a significant difference in the volume reduction is present between the following groups: grade 1 and grade 4 (P < .001) and grades 2 and 3 and grade 4 (P < .001), but not between grade 1 and grades 2 and 3. In the submandibular gland, a significant difference in the volume reduction is present between the following groups: grade 1 and grades 2 and 3 (P < .001), grades 2 and 3 and grade 4 (P < .001), and grade 1 and grade 4 (P < .001). The horizontal line in the box indicates median, ○, outliers; asterisk, extreme outliers (>3 times the box height).
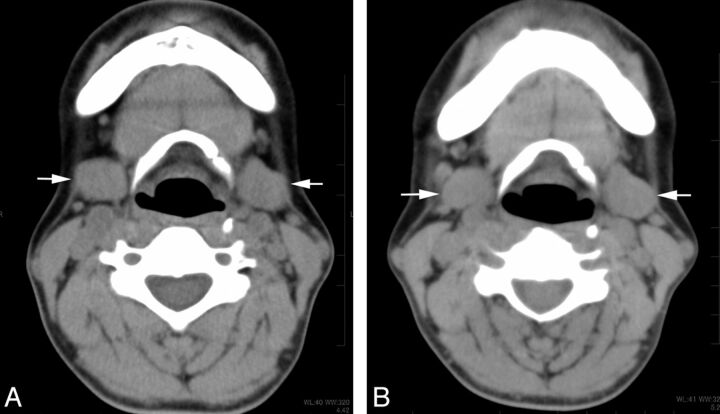
The reduction volume (mean ± SD, 95% confidence interval) in the submandibular gland after RIT, depending on the grade of scintigraphy, was 4.0 ± 3.1% (2.0%–6.1%) for grade 1 (n = 11); 14.7 ± 9.2% (10.8%–18.5%) for grades 2 and 3 (n = 24); and 42.3 ± 11.3% (28.3%–56.3%) for grade 4 (n = 5) (Figs 4 and 5). The submandibular gland volume after the treatment significantly decreased with an increase in the grade of dysfunction on scintigraphy (P < .001, 1-way analysis of variance). There was a significant difference in the reduction volume between grade 1 and grades 2 and 3 (P < .001), grades 2 and 3 and grade 4 (P < .001), and grade 1 and grade 4 (P < .001) groups, as determined by the Tukey Honestly Significant Difference test (Fig 3).
Fig 4.
A 46-year-old woman who underwent 2 radioiodine treatments shows mild dysfunction of the submandibular gland on scintigraphy. Non-contrast-enhanced CT images (A) before and (B) after the treatment. The bilateral submandibular glands (arrows) show a mild volume reduction of 11% and an increase in attenuation of 12 HU on CT after the treatment.
Fig 5.
A 68-year-old woman who underwent 4 radioiodine treatments shows severe dysfunction of the submandibular gland on scintigraphy. Non-contrast-enhanced CT images (A) before and (B) after the treatment. The bilateral submandibular glands (arrows) show a prominent volume reduction of 56% but a minimal increase in attenuation of 14 HU on CT after the treatment.
Attenuation Change in the Gland on CT versus the Grade of Dysfunction on Scintigraphy
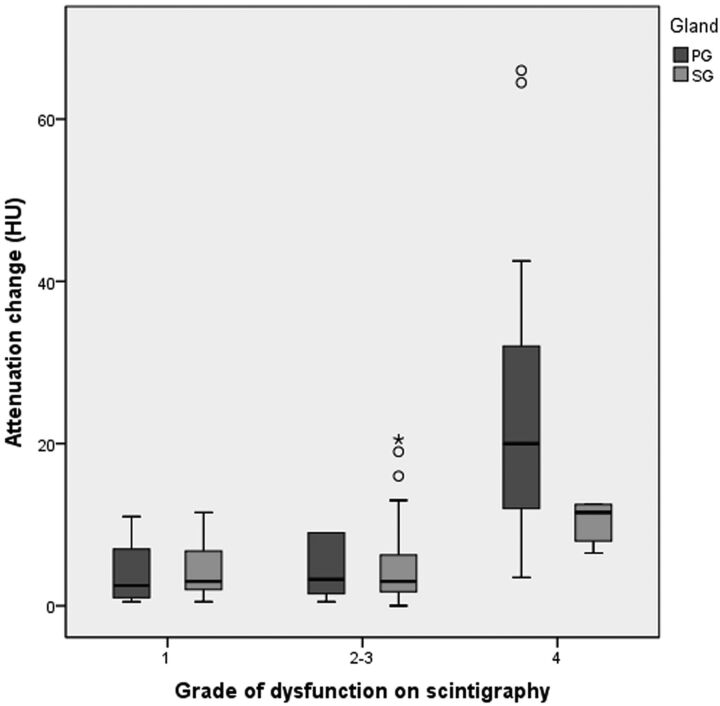
The attenuation change (mean ± SD, 95% confidence interval) in the parotid gland after RIT, depending on the grade of scintigraphy, was 4.3 ± 3.7 HU (1.5–7.2 HU) for grade 1 (n = 9); 4.3 ± 3.4 HU (1.8–6.8 HU) for grades 2 and 3 (n = 10); and 23.9 ± 17.7 HU (15.8–31.9 HU) for grade 4 (n = 21) (Figs 1 and 2). The attenuation change in the parotid gland after the treatment significantly increased with an increase in the grade of dysfunction on scintigraphy (P < .001, 1-way analysis of variance). A significant difference in the attenuation change was present between the grade 1 and grade 4 (P < .002) and between the grades 2 and 3 and grade 4 (P < .001) groups, but not between the grade 1 and grades 2 and 3 groups, as determined by the Tukey Honestly Significant Difference test (Fig 6).
Fig 6.
The attenuation change of the parotid and submandibular glands on CT after radioiodine therapy, depending on the dysfunction grade on scintigraphy (Tukey Honestly Significant Difference test). In the parotid gland, a significant difference in the attenuation increase is present between the following groups: grade 1 and grade 4 (P < .002), grades 2 and 3 and grade 4 (P < .001), but not between grade 1 and grades 2 and 3. In the submandibular gland, no significant difference is noted among the attenuation changes for each group. The horizontal line in the box indicates the median; ○, outliers; asterisk, extreme outliers (>3 times the box height).
The attenuation change (mean ± SD, 95% confidence interval) in the submandibular gland after RIT, depending on the grade of scintigraphy, was 4.4 ± 3.5 HU (2.0–6.7 HU) for grade 1 (n = 11); 5.3 ± 5.9 HU (2.8–7.8 HU) for grades 2 and 3 (n = 24); and 10.2 ± 2.8 HU (6.8–13.7 HU) for grade 4 (n = 5) (Figs 4 and 5). In the submandibular glands, there was no significant correlation between the attenuation change and the grade of dysfunction on scintigraphy. No significant differences were noted among the attenuation changes for each group (Fig 6).
The means of pretreatment attenuation of the parotid and submandibular gland were −5.5 ± 25.6 HU and 40.5 ± 10.8 HU, respectively, and the attenuation of the submandibular gland was significantly higher than that of the parotid gland (P < .001).
The means of attenuation change after RIT of the parotid gland and submandibular gland were 14.6 ± 16.3 HU and 5.6 ± 5.2 HU, respectively and the attenuation change of the parotid gland was significantly larger than that in the submandibular gland (P < .001).
The attenuation change after RIT in the parotid gland showed a significant inverse correlation with its pretreatment attenuation (r = −0.47, P = .002), while no significant correlation was noted between the attenuation change after RIT in the submandibular gland and its pretreatment attenuation (r = −0.12, P = .449).
ROC Curves and Cutoff Values
We determined the cutoff values of volume reduction and attenuation changes to diagnose grade 4 dysfunction of the salivary glands by using ROC curves in both the parotid and submandibular glands (On-line Figs 1 and 2). The best cutoff value for the volume reduction to diagnose severe dysfunction was 19.5% in the parotid gland and 31.0% in the submandibular gland, and that in the attenuation change was 9.8 HU in the parotid gland. The sensitivity, specificity, positive predictive value, negative predictive value, positive likelihood ratio, and negative likelihood ratio for each cutoff value are shown in Table 3.
Table 3:
The performance of the determined cutoff values of the percentage of volume reduction and attenuation increase in the salivary gland for the diagnosis of severe salivary dysfunction
| Parotid Gland | Submandibular Gland | Cutoff Value of the Attenuation Increase (HU) | |
|---|---|---|---|
| Cutoff value of volume reduction | 19.5% | 31.0% | 9.8 |
| Sensitivity | 0.86 | 1.00 | 0.81 |
| Specificity | 1.00 | 0.97 | 0.95 |
| PPV | 1.00 | 0.83 | 0.94 |
| NPV | 0.86 | 1.00 | 0.82 |
| Positive LR | – | 34.5 | 15.3 |
| Negative LR | 0.14 | 0 | 0.20 |
Note:—NPV indicates negative predictive value; PPV, positive predictive value; LR = likelihood ratio; –, not appreciable.
Discussion
Radioactive iodine (131I) is a well-known adjunctive treatment for thyroid carcinoma, especially in patients with a high risk of recurrence.1 In addition to accumulation in the thyroid tissue, radioactive iodine also concentrates in the salivary glands and typically leads to transient or permanent damage to the glands. In the salivary glands, serous cells are more susceptible to the deleterious effects of ionizing radiation than mucous acini. Therefore, the serous-dominant parotid gland demonstrates a more intense radiation sialoadenitis than the mixed mucous and serous cell–containing submandibular and sublingual glands.14 In line with this, our results showed that the grades of salivary dysfunction after RIT were significantly higher in the parotid glands than in the submandibular glands.
Generally, salivary dysfunction after RIT occurs in a dose-dependent manner.2,7 If the patient receives a single dose of 6 GBq, it typically results in a 30% loss of parenchymal function, while a cumulative administered dose of 35 GBq results in complete loss of glandular function, as determined by salivary gland scintigraphy.15 Radiation-induced salivary gland dysfunction is also a common complication in patients undergoing external radiation therapy for head and neck cancers.10,11 A complete loss of salivary gland function from external radiation therapy occurs at a dose level of 60 Gy. Given the absorbed functional effect of complete loss in the salivary gland by RIT and external radiation, the absorbed dose per administered 131I activity was 1.7 Gy/GBq. However, the published absorbed dose per administered activity exhibits a large variation, with a range of 0.03–14 Gy/GBq.15 These data suggest that the biologic effectiveness of external radiation and RIT is not equivalent.
The dose-effect relationship in the salivary glands is well-known with regard to external radiation therapy,10–13 whereas for RIT, predicting the severity of radiation-induced salivary dysfunction can be difficult for the following reasons: First, the activity distribution of 131I in the salivary gland is inhomogeneous. Second, the uptake of 131I in the salivary gland is individually variable and is also affected by the cumulative activity of previous treatments.4,7 Third, the biologic half-life of 131I differs in each patient. Therefore, a clinically available indicator for the salivary dysfunction is required in patients undergoing RIT.
Salivary gland scintigraphy has been widely accepted as a sensitive and valid method for evaluation of the function of the salivary glands.5–9,16 Several authors have used salivary gland scintigraphy for the assessment of salivary gland dysfunction after RIT and reported a good correlation with the clinical and histopathologic features of the salivary glands.5–9,16 In our study, salivary gland scintigraphy showed a dose-dependent salivary dysfunction after RIT, similar to the findings described in previous reports.5–9
CT examinations of the head and neck are commonly performed during the follow-up period after RIT to screen for recurrence and metastasis. Because iodine contrast material is contraindicated for a few weeks before the RIT, we obtained noncontrast CT images. Our current results suggested that the volume change of the salivary gland measured on CT could be an indicator for the assessment of salivary dysfunction after RIT. A volume reduction of nearly 20% in the parotid and 30% in the submandibular gland suggested severe dysfunction of the gland, with sensitivities of 86% and 100% and specificities of 100% and 97%, respectively. A few authors have reported radiation-induced volume loss in the salivary glands in patients receiving external radiation,10–13 and Teshima et al10 suggested a correlation between the loss of gland volume and decreased saliva production. However, no previous reports have investigated the relationship between the changes in the volume of the salivary gland on CT and the grade of salivary gland dysfunction in patients who undergo RIT.
The increase in attenuation after RIT on non-contrast-enhanced CT was also significantly correlated with gland dysfunction on scintigraphy in the parotid glands. An attenuation increase of nearly 10 HU indicated severe dysfunction of the gland, with a sensitivity of 81% and a specificity of 95%. Such a correlation was not present in the submandibular glands, possibly because of the high attenuation already present in the glands before treatment.17 In the current study, the pretreatment attenuation of the submandibular gland was significantly higher than that in the parotid gland. Moreover, its attenuation before treatment showed an inverse correlation with the attenuation change in the parotid gland, while that in the submandibular gland did not show such a correlation. Salivary dysfunction occasionally becomes more evident during a period of several months to 1 year after the last RIT, indicating that slowly progressing fibrosis is part of the pathologic process involved in radiation-induced sialoadenitis.2,8 We think that replacement of the fat tissue by fibrosis within the salivary gland contributes to its attenuation increase after RIT.
Our results suggest that we can assess the extent of radiation-induced salivary gland dysfunction in patients after RIT on a noncontrast-enhanced CT study, which is performed as a routine examination to screen for recurrence and metastasis. We might thereby avoid the routine survey with salivary scintigraphy after RIT because the CT prediction of salivary dysfunction allows clinicians to inform patients of the extent of salivary gland dysfunction without scintigraphy. Scintigraphy could be reserved for cases in which acute deterioration of the salivary gland function is suggested from clinical signs and symptoms. The advantages of CT over scintigraphy for the assessment of salivary function are its widespread availability in most hospitals; the simplicity and objectiveness of the widely used method of measurement of volume and attenuation of the structures of interest, including salivary glands; and less expensive cost.
There are some limitations to this study. First, although the aging process could significantly affect salivary gland function and attenuation, we did not consider the patient age owing to the small number of subjects examined in this study. Second, we could not determine the appropriate interval for performing CT after RIT for the assessment of associated salivary dysfunction because we did not sequentially perform CT studies after the treatment. Third, because scintigraphy and CT were performed on the same day for correlation in this study, we could not assess the potential sensitivity of scintigraphy versus CT as a function of time. Scintigraphy as a measure of salivary function might be able to detect salivary dysfunction sooner than CT, which is presumably measuring chronic changes such as fibrosis.
Conclusions
A reduction in volume of the parotid and submandibular glands and an increase in attenuation in the parotid gland on noncontrast-enhanced CT can be indicators of the grade of salivary dysfunction in patients who have undergone postoperative RIT for thyroid carcinomas.
Supplementary Material
Acknowledgments
We thank the nuclear medicine technologist Junichi Sato and the CT technologist Masahiko Suzuki for their contribution and expertise in scanning technique.
ABBREVIATIONS:
- HU
hounsfield unit
- RIT
radioiodine therapy
- ROC
receiver operating characteristic analysis
References
- 1. Samaan NA, Schults PN, Hickey RC, et al. The results of various modalities of treatment of well differentiated thyroid carcinomas; a retrospective review of 1599 patients. J Clin Endocrinol Metab 1992;75:714–20 [DOI] [PubMed] [Google Scholar]
- 2. Alexander C, Bader JB, Schaefer A, et al. Intermediate and long term side effects of high-dose radioiodine therapy for thyroid carcinoma. J Nucl Med 1998;39:1551–54 [PubMed] [Google Scholar]
- 3. Newkirk KA, Ringel MD, Wartofsky L, et al. The role of radioactive iodine in salivary gland dysfunction. Ear Nose Throat J 2000;79:460–68 [PubMed] [Google Scholar]
- 4. Almeida JP, Sanabria AE, Lima EN, et al. Late side effects of radioactive iodine on salivary gland in patients with thyroid cancer. Head Neck 2011;33:686–90 [DOI] [PubMed] [Google Scholar]
- 5. Bohuslavizki KH, Brenner W, Lassmann S, et al. Quantitative salivary gland scintigraphy in the diagnosis of parenchymal damage after treatment with radioiodine. Nucl Med Commun 1996;17:681–86 [DOI] [PubMed] [Google Scholar]
- 6. Malpani BL, Samuel AM, Ray S. Quantification of salivary gland function in thyroid cancer patients treated with radioiodine. Int J Radiat Oncol Biol Phys 1996;35:535–40 [DOI] [PubMed] [Google Scholar]
- 7. Solans R, Bosch JA, Gaofre P, et al. Salivary and lacrimal gland dysfunction (Sicca syndrome) after radioiodine therapy. J Nucl Med 2001;42:738–43 [PubMed] [Google Scholar]
- 8. Caglar M, Tuncel M, Alpar R. Scintigraphic evaluation of salivary gland dysfunction in patients with thyroid cancer after radioiodine treatment. Clin Nucl Med 2002;27:767–71 [DOI] [PubMed] [Google Scholar]
- 9. Raza H, Khan AH, Hameed A, et al. Quantitative evaluation of salivary gland dysfunction after radioiodine therapy using salivary gland scintigraphy. Nucl Med Commun 2006;27:495–99 [DOI] [PubMed] [Google Scholar]
- 10. Teshima K, Murakami R, Tomitaka E, et al. Radiation-induced parotid gland changes in oral cancer patients: correlation between parotid volume and saliva production. Jpn J Clin Oncol 2010;40:42–46 [DOI] [PubMed] [Google Scholar]
- 11. Wang ZH, Yan C, Zhang ZY, et al. Radiation induced changes in parotid and submandibular gland in patients with head and neck cancer receiving postoperative radiotherapy: a longitudinal study. Laryngoscope 2009;119:1966–74 [DOI] [PubMed] [Google Scholar]
- 12. Baker JL, Jr, Garden AS, Ang KK, et al. Quantification of volumetric and geometric changes occurring during fractionated radiotherapy for head and neck cancer using integrated CT/linear acceleratory system. Int J Radiat Oncol Biol Phys 2004;59:960–70 [DOI] [PubMed] [Google Scholar]
- 13. Robar JL, Day A, Clancey J, et al. Spatial and dosimetric variability of organs at risk in head-and-neck intensity-modulated radiotherapy. Int J Radiat Oncol Biol Phys 2007;68:1121–30 [DOI] [PubMed] [Google Scholar]
- 14. Mandel SJ, Mandel L. Radioactive iodine and salivary glands. Thyroid 2003;13:265–71 [DOI] [PubMed] [Google Scholar]
- 15. Jentzen W, Schneider E, Freudenberg L. Relationship between cumulative radiation dose and salivary gland associated with radioiodine therapy of thyroid cancer. Nucl Med Commun 2006;27:669–76 [DOI] [PubMed] [Google Scholar]
- 16. Loutfi I, Nair MK, Ebrahim AK. Salivary gland scintigraphy: the use of semiquantitative analysis for uptake and clearance. J Nucl Med Technol 2003;31:81–85 [PubMed] [Google Scholar]
- 17. Bryan RN, Miller RH, Ferreyro RI, et al. Computed tomography of the major salivary glands. AJR Am J Roentgenol 1982;139:547–54 [DOI] [PubMed] [Google Scholar]
Associated Data
This section collects any data citations, data availability statements, or supplementary materials included in this article.


