Abstract
Muscle sympathetic nerve activity (MSNA) is known as an effective measure to evaluate peripheral sympathetic activity; however, it requires invasive measurement with the microneurography method. In contrast, peripheral arterial stiffness affected by MSNA is a measure that allows non-invasive evaluation of mechanical changes of arterial elasticity. This paper aims to clarify the features of peripheral arterial stiffness to determine whether it inherits MSNA features towards non-invasive evaluation of its activity. To this end, we propose a method to estimate peripheral arterial stiffness at a high sampling rate. Power spectral analysis of the estimated was then performed on data acquired from 15 patients ( years) who underwent endoscopic thoracic sympathectomy. We examined whether exhibited the features of MSNA where its frequency components synchronise with heart and respiration rates and correlates with the low-frequency component of systolic blood pressure. Regression analysis revealed that the local peak frequency in the range of heartbeat frequency highly correlate with the heart rate (, ) where the regression slope was approximately 1 and intercept was approximately 0. Frequency analysis then found spectral peaks of approximately 0.2 Hz that correspond to the respiratory cycle. Finally, cross power spectral analysis showed a significant magnitude squared coherence between and systolic blood pressure in the frequency band from 0.04 to 0.2 Hz. These results indicate that inherits the features observed in MSNA that require invasive measurements, and thus can be an effective non-invasive substitution for MSNA measure.
Subject terms: Biomarkers, Predictive markers, Cardiovascular biology, Neurophysiology, Respiration
Introduction
The autonomic nervous system consists of the sympathetic and parasympathetic nervous system, and the balance between these systems regulates the physical and mental state.
Numerous methods for evaluating autonomic nervous activity from various physiological responses have been proposed using information derived from heart rate1, respiration2, electroencephalography3, pupil4, and skin temperature5. Heart rate variability (HRV) analysis is an easy and representative method to evaluate autonomic nervous activity1. This method focuses on the periodic fluctuations present in heartbeats. The low frequency (LF) and high frequency (HF) components in HRV are known to synchronise with cardiac sympathetic/parasympathetic nervous activity and cardiac parasympathetic nervous activity, respectively1. This method, however, evaluates only cardiac autonomic nervous activity and cannot evaluate peripheral autonomic nervous activity.
Microneurography has been proposed as a representative method for evaluating peripheral autonomic nervous activity6. In this method, muscle sympathetic nerve activity (MSNA) can be measured directly by inserting a needle electrode into the unanesthetised leg or arm percutaneously. Microneurography, however, has a limitation for measuring MSNA as this method requires an invasive procedure, which places additional strain on subjects. Meanwhile, our research group proposed the peripheral arterial stiffness as an index to noninvasively evaluate peripheral autonomic nervous activity7,8. We also showed that quantitative evaluation of human pain sensation was possible with the peripheral arterial stiffness8.
The MSNA has a close relationship with peripheral arterial stiffness in regulating blood pressure by contracting vascular smooth muscles9, and the peripheral arterial stiffness reflects this contraction. Therefore, peripheral arterial stiffness may exhibit features of MSNA. Previous studies reported that the frequency components of MSNA contain information about vital signals: the approximately 1 Hz10 of MSNA synchronise with heartbeat, the 0.15–0.4 Hz component synchronise with respiration rhythm11, and the 0.04–0.15 Hz component correlates with systolic blood pressure11. The MSNA thus may have a potential to be noninvasively evaluated using the peripheral arterial stiffness if it preserves the above-mentioned components. However, this method can only estimate the peripheral arterial stiffness based on heartbeat7,8, and this sampling frequency is insufficient to determine whether peripheral arterial stiffness preserves the periodic components in MNSA.
Against the above background, this paper aims to extract the frequency information embedded in peripheral arterial stiffness. To this end, a novel method to estimate peripheral arterial stiffness7 at a high frequency was developed. The proposed method is applied to data measured during endoscopic thoracic sympathectomy surgery because it includes clear-cut fluctuations in the state of sympathetic nerve activity. Power spectral analysis of peripheral arterial stiffness was then carried out to reveal the relationship between each frequency component and the vital signals.
Methods
Experimental configurations
Endoscopic thoracic sympathectomy (ETS) is a surgical procedure for the treatment of hyperhidrosis12. The ETS improves sweating by clipping off the sympathetic trunk near the thoracic spine. Peripheral sympathetic nerve activity decreases after clipping the sympathetic nerve, which may reduce the response of both MSNA and peripheral arterial stiffness. Therefore, the author selected adult patients undergoing ETS as subjects. In this paper, biological signals of subjects who underwent the T3 level of ETS in the order of right and left parts were analysed. During surgery, the subjects underwent general anaesthesia and the respiratory rate was set at approximately 12 times/min (0.2 Hz) using a ventilator. Electrocardiogram, invasive radial arterial blood pressure from a catheter inserted into the right radial artery, and a photoplethysmogram from the thumb on the right hand were measured using a bedside monitor (BSS-9800, Nihon Kohden Corp., Tokyo, Japan). The measured data was stored digitally at a sampling frequency of 125 Hz.
Data from fifteen patients (five male and ten female patients, mean age ± S.D. years.) were analysed in this paper. Experiments were conducted in accordance with the Declaration of Helsinki. Informed consent was obtained from all study subjects before the experiments were performed, and the study was approved by the Hiroshima University Ethics Committee.
Proposed estimation method of peripheral arterial stiffness
Peripheral arterial stiffness was estimated from the measured electrocardiogram, continuous blood pressure, and photoplethysmogram using the following log-linearised peripheral arterial viscoelastic model7,8.
| 1 |
where , and are the arterial wall inertia, viscosity and stiffness, respectively. , , and are the arterial blood pressure at the time t, photoplethysmogram, its change rate and its acceleration, respectively. represents the reference blood pressure, and represents the venous pressure component.
Conventionally, peripheral arterial stiffness is estimated for each heart-beat using the data measured in each R-R interval (refer to Supplemental Information S1). In contrast, this study estimates the peripheral arterial stiffness for each sampling time using the following procedure. First, the exponential term in Eq. (1) is approximated linearly by a Maclaurin series expansion around , as follows:
| 2 |
where is defined as follows:
Then, , , and are estimated by performing the linear least squares method on the blood pressure and photoplethysmogram for arbitrary window length w using Eq. (2).
Second, the estimated inertia and viscosity are substituted into Eq. (1). Taking the exponent on both sides of that yields the following equation:
| 3 |
Stiffness is estimated within the range that the blood pressure is higher than the mean blood pressure so that venous pressure component can be ignored. Then, becomes zero. and are estimated based on Eq. (3) using the linear least squares method with the blood pressure and photoplethysmogram for arbitrary window at a length of w.
By repeating the above procedure while shifting the data for window w each sampling time, the peripheral arterial stiffness can be estimated as equally spaced data as a sampling time. In this paper, the peripheral arterial stiffness was estimated by setting the window length w to the maximum heartbeat interval of each subject.
Analysis
Accuracy verification of the estimation of peripheral arterial stiffness
The peripheral arterial stiffness estimated by the proposed method was compared with the peripheral arterial stiffness estimated by the conventional method7,8 to verify the estimation accuracy. Whereas the proposed peripheral arterial stiffness was estimated at a sampling frequency of 125 Hz, the conventional peripheral arterial stiffness was estimated for each heartbeat. The proposed peripheral arterial stiffness was resampled at each heartbeat after anti-aliasing processing using a low-pass filter with a cutoff frequency of 0.5 Hz. Correlation analysis was then performed between resampled proposed peripheral arterial stiffness and obtained from the conventional method. Bland–Altman analysis13 was performed to compare absolute errors between the peripheral arterial stiffness and . The estimated , along with other parameters, was then substituted into Eq. (2) so that the blood pressure predicted by the model could be obtained. The predicted blood pressure was then compared to the measured blood pressure for verification. The stiffness and were adopted only for data, where the coef?cient of determination between the predicted and measured blood pressure was 0.9 or more.
The significance levels of the tests were set at .
Frequency spectrum analysis of peripheral arterial stiffness
Power spectral analysis was performed to examined whether the frequency components in peripheral arterial stiffness synchronise with the vital signals as observed in MSNA. In ETS, the surgeon searches for the thoracic sympathetic trunk of the patients, and blocks it using clips. Therefore, stimulation searching for the thoracic sympathetic trunk enhances peripheral sympathetic nerve activity, whereas thoracic sympathetic trunk blockage decreases its activity. Thus, the analysis was set to 30 s before right thoracic sympathetic trunk blocking (hereinafter called “pre SNB”), and 30 s after 60 s had passed after right thoracic sympathetic trunk blocking (hereinafter called “post SNB”). Sections where the coefficient of determination between the estimated blood pressure based on the stiffness and the measured blood pressure was 0.9 or more were chosen for analysis.
Power spectral density (PSD) of peripheral arterial stiffness was calculated using the autoregressive model. The previous study reported that oversampling of the signal does not provide any advantage because it only increases the analysis time and required model order14. In order to focus on the frequency band below 2 Hz, the peripheral arterial stiffness estimated at a sampling frequency of 125 Hz was downsampled to 5 Hz after anti-aliasing operation (a low-pass filter with a cutoff frequency of 2 Hz). Thereafter, PSD of the peripheral stiffness was calculated using the Burg method15. The order of the autoregressive model was determined based on the minimised Akaike’s information criterion (AIC)16. The result of calculating AIC from pre SNB and post SNB was (mean ± standard deviation). A previous study regarding heart rate variability with periodic characteristics similar to MSNA reported that the order obtained by AIC is slightly smaller than the optimal order14. The order of the autoregressive model was therefore set to 23. The calculated PSD was normalised by dividing with the total power in each analysis interval of each subject.
Cross power spectral density (CPSD) between the peripheral arterial stiffness and systolic blood pressure (SBP) was calculated using a bivariate autoregressive model. The peripheral arterial stiffness was estimated at a sampling frequency of 5 Hz, as well as the PSD calculation. SBP was resampled at 5 Hz using cubic spline interpolation. Then, CPSD was calculated using the Nuttall-Strand method17, which is a cross power spectral analysis method. The model order was determined based on Akaike’s information corrected criterion (AICC)18. The order was set to 12 because the minimised AICC calculated from pre SNB and post SNB was . Thereafter, magnitude squared coherence (MSC) between the peripheral stiffness and SBP was calculated. MSC is an index indicating the strength of linear correlation between two signals in a certain frequency band. The significance of MSC between peripheral stiffness and SBP was verified for each subject and each frequency band, using the surrogate data method19 with the significance level set at .
Relationship analysis between and vital signals
The peripheral arterial stiffness was evaluated to verify whether the following MSNA features were present.
(i) Heart rate
The relationship between heart rate and was verified by applying linear regression analysis for the heartbeat frequency and the peak frequency of pre/post SNBs calculated from the electrocardiogram. The heartbeat frequencies were calculated from the average heartbeat intervals, and then the local peak frequency of closest to the heartbeat frequency was extracted. It is assumed that the heartbeat frequency matches the peak frequency of peripheral arterial stiffness , the slope of regression line between the heartbeat frequency and the peak frequency of the peripheral arterial stiffness will be 1 and the line will pass through the origin. The significance levels of the tests were set at .
(ii) Respiratory rate
The relationship between respiratory rate and was investigated by analysing the frequency components corresponding to the respiratory rate. The respiratory rate of the subjects during ETS was controlled at 12 times/min, corresponding to 0.2 Hz. Therefore, if the respiratory component is included in the peripheral arterial stiffness , a PSD peak of the peripheral arterial stiffness appears around 0.2 Hz. A previous study reported that the respiratory rate usually measures at 9–24 times/min and synchronises with HF (0.15–0.4 Hz)20. The peak frequencies at HF of the peripheral arterial stiffness in pre SNB and post SNB were calculated, in addition the histograms were created by dividing every 0.025 Hz. 95 confidence interval of the peak frequencies was calculated for investigating that frequency included in 0.2 Hz.
(iii) Systolic blood pressure
The relationship between SBP and was investigated by analysing their MSC. Prior research reported that MSNA and SBP correlated with LF (0.04–0.15 Hz)21 because the LF component of MSNA is thought to induce vasomotion by sympathetic nerve activity22. Hence, the maximum MSC at LF between the peripheral arterial stiffness and SBP of each subject was examined to verify the significance of pre SNB with enhancing sympathetic nerve activity. Furthermore, the sum for normalised power at LF of the peripheral arterial stiffness in pre SNB was compared with that in post SNB to verify whether LF component of the peripheral arterial stiffness reflects sympathetic nerve activity as well as MSNA. The Wilcoxon signed rank test was used to determine the significance of differences, with the significance level set at .
Results
Accuracy verification of the estimation of peripheral arterial stiffness
Figure 1 shows the measured biosignals and peripheral arterial stiffness from Sub. A. From top to bottom, each figure shows measured electrocardiograms, continuous arterial pressures, photo plethysmograms, the peripheral arterial stiffness of the proposed and that of the conventional , and enlarged figure of the peripheral arterial stiffness of the proposed and that of the conventional . Figure 1 indicates that the blood pressure increased and photoplethysmographic amplitude decreased during right thoracic sympathetic trunk stimulation. The same figure also indicates that the contours of the peripheral arterial stiffness of the proposed and that of the conventional match, and the temporal resolution of the peripheral arterial stiffness of the proposed is improved compared to that of the conventional .
Figure 1.
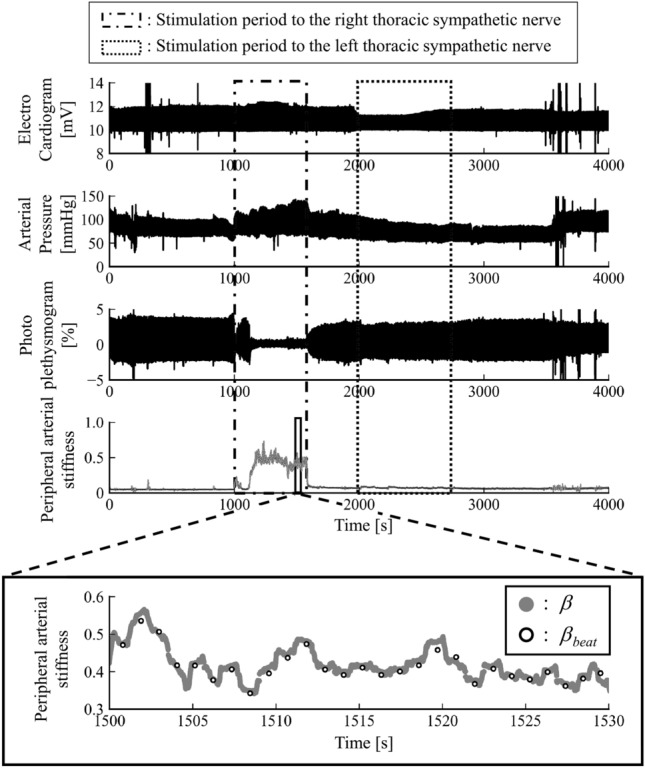
Measured biological signals. From top to bottom, electrocardiograms, continuous arterial pressures, photo plethysmograms, proposed peripheral arterial stiffness , and conventional peripheral arterial stiffness from Sub. A are shown.
Figure 2 shows that the result of Bland-Altman analysis between the peripheral arterial stiffness of the proposed and that of the conventional . The 95 confidence interval obtained from differences between the peripheral arterial stiffness of the proposed and that of the conventional was – and constant error was not seen. Proportional error between the peripheral arterial stiffness of the proposed and that of the conventional could be seen (). However, both the correlation coefficient and slope of the regression line between the difference and average of the two indices were small, indicating no bias in the estimation (, slope of the regression line ).
Figure 2.
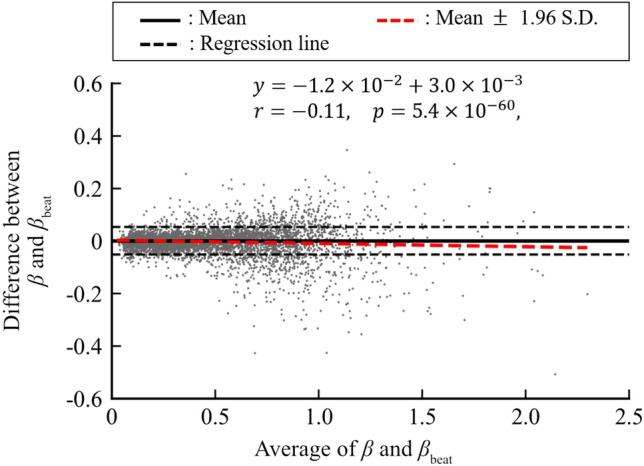
Bland–Altman plot between proposed peripheral arterial stiffness and conventional peripheral arterial stiffness .
Relationship between vital signals and peripheral arterial stiffness
Figure 3 shows the averages of normalised PSD of peripheral arterial stiffness for all subjects. Figure 3a,b show the results for pre SNB and post SNB, respectively. Figure 3 indicates that there are multiple spectral peaks at the frequency band below 0.5 Hz for both pre SNB and post SNB. In addition, Fig. 3b highlights spectral peaks around 1.2 Hz for post SNB.
Figure 3.
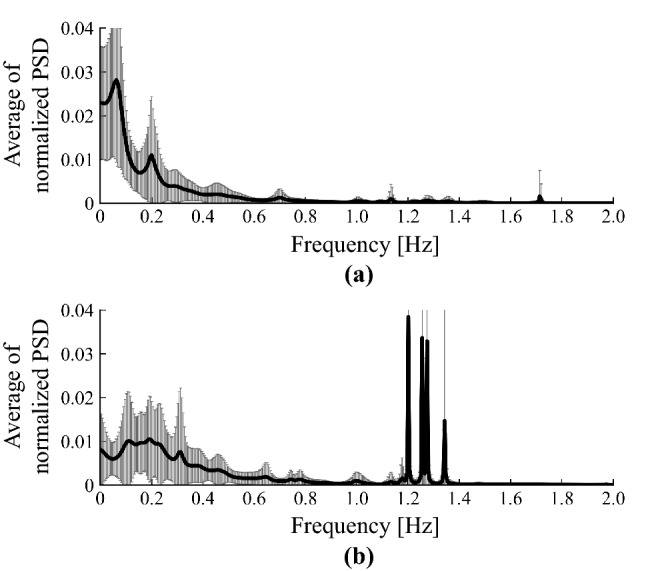
Averages of normalised PSD of peripheral arterial stiffness for all subjects: (a) pre SNB, (b) post SNB.
Figure 4 shows the relationship between the peak frequencies of peripheral arterial stiffness and that of RR intervals for all subjects. The regression line between them was significant (, ) and its slope was 1.0. The 95 confidence interval for the intercept of the regression line was between − 0.17 and 0.21, and zero was included in that interval.
Figure 4.
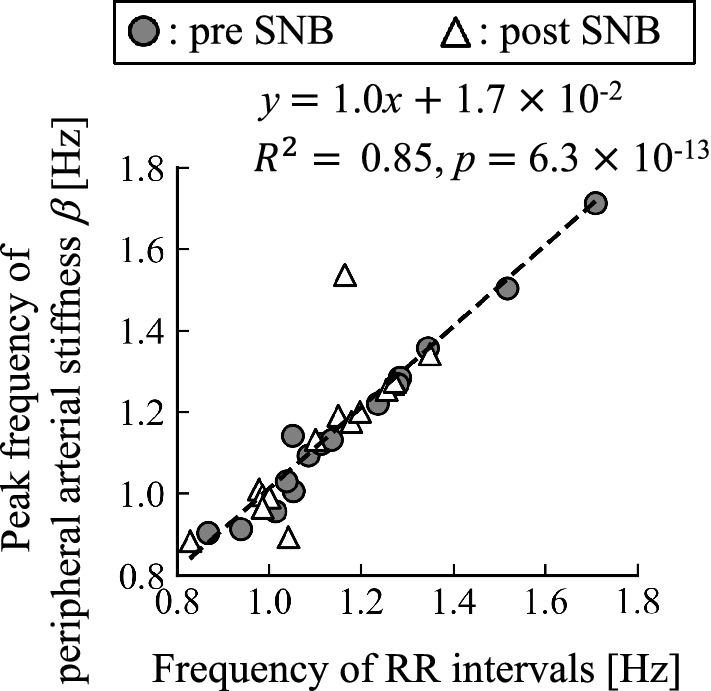
Relationship between peak frequency of peripheral arterial stiffness and that of RR intervals for all subjects.
Figure 5 shows the averages of normalised PSD and histograms of peak frequency for the peripheral arterial stiffness for all subjects. Figure 5a,b show the results for pre SNB and post SNB, respectively. There were spectral peaks around 0.2 Hz corresponding to the respiratory cycle in both pre SNB and post SNB. Figure 5c shows the sum of frequency histogram for the peripheral arterial stiffness of both pre SNB and post SNB measured at HF. The 95 confidence interval for peak frequencies of the peripheral arterial stiffness included 0.2 Hz.
Figure 5.
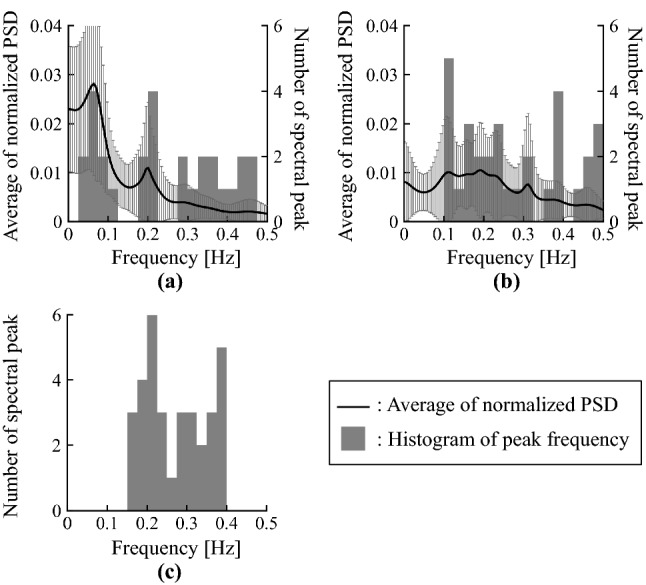
Averages of normalised PSD and histograms of peak frequency for peripheral arterial stiffness for all subjects: (a) pre SNB, (b) post SNB, (c) sum of pre SNB and post SNB measured at high frequency range HF.
Figure 6 shows the averages of MSC between the peripheral arterial stiffness and SBP for all subjects. Figure 6a,b show the results for pre SNB and post SNB, respectively. There were peaks of the MSC around 0.04 Hz and 0.2 Hz in pre SNB and 0.2 Hz in post SNB.
Figure 6.
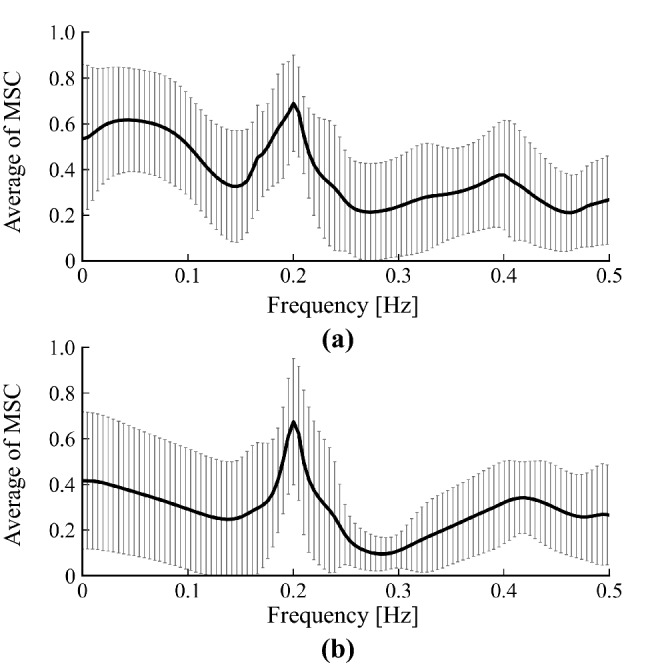
Averages of MSC between peripheral arterial stiffness and SBP for all subjects: (a) pre SNB, (b) post SNB.
Figure 7 shows the maximum MSC at LF between peripheral arterial stiffness and SBP for pre SNB and post SNB. Figure 7 indicates that the average of the maximum MSC is 0.67 and median of that is 0.69 in pre SNB, respectively. Significant values were obtained from 13 of 15 subjects. In addition, the same figure indicates that the average of the maximum MSC is 0.41 and median of that is 0.36 in post SNB, respectively. Significant values were obtained from 8 of 15 subjects. The maximum MSC of pre SNB was significantly greater than that of post SNB ().
Figure 7.
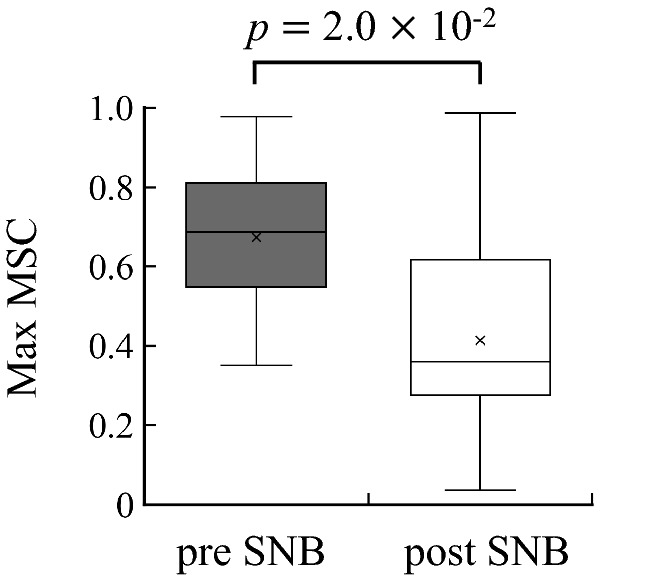
Max MSC at low frequency range LF between peripheral arterial stiffness and SBP before and after sympathetic nerve block by clipping.
Figure 8 shows the comparison results between the sum for normalised power of the peripheral arterial stiffness at LF of pre SNB and that of post SNB. Figure 8 indicates that the sum for normalised power of the peripheral arterial stiffness at LF of pre SNB were significantly greater than that of post SNB ().
Figure 8.
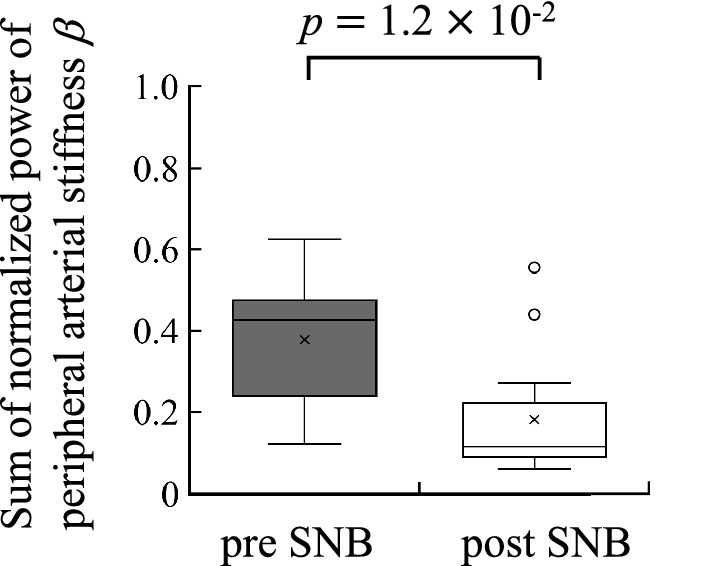
Comparison of sum of normalised power of peripheral arterial stiffness at low frequency range LF before and after sympathetic nerve block by clipping.
Discussion
It was confirmed that the peripheral arterial stiffness increased during stimulation of the right thoracic sympathetic trunk as shown in Fig. 1. This indicates sympathetic nerve activation and subsequent contraction of the peripheral arterial walls resulting from stimulation. Meanwhile, the peripheral arterial stiffness did not increase during stimulation of the left thoracic sympathetic trunk. Therefore, the peripheral sympathetic nerve on the right does not respond to stimulation because the right thoracic sympathetic trunk had already been blocked. It was confirmed that the estimation accuracy of the proposed peripheral arterial stiffness was equivalent to that of the conventional peripheral arterial stiffness and the temporal resolution of the estimated arterial stiffness was improved. As a result of Bland-Altman analysis, no constant error was found, as shown in Fig. 2. Significant correlation was confirmed between mean values and errors of the proposed peripheral arterial stiffness and the conventional peripheral arterial stiffness . However, this proportional error is negligible owing to the small slope of the regression line. From the above, the proposed method for estimating peripheral arterial stiffness can improve the temporal resolution and realise equidistant sampling while maintaining high estimation accuracy.
Spectral peaks of the peripheral arterial stiffness were confirmed at the frequency band below 2.0 Hz in both pre SNB and post SNB, as shown in Fig. 3. The features of peripheral arterial stiffness agree with those of MSNA.
First, it was confirmed that the regression line between the heartbeat frequencies and the peak frequencies of the peripheral arterial stiffness was significant, as shown in Fig. 4. The heartbeat frequencies roughly match the peak frequencies of peripheral arterial stiffness because almost all plots are on a straight line with a slope of 1.0 passing through the origin. Therefore, peripheral arterial stiffness synchronises with the heartbeat as MSNA.
Second, it was confirmed that there were spectral peaks of the peripheral arterial stiffness around 0.2 Hz, corresponding to the respiratory cycle, for both pre SNB and post SNB, as shown in Fig. 5a,b. Further, the peaks at HF were concentrated around 0.2 Hz, as shown in Fig. 5c. The peripheral arterial stiffness was considered to synchronise with the respiratory rate because the 95 confidence interval of the peak frequencies included 0.2 Hz at HF. The spectral peaks around 0.4 Hz were harmonics of the respiratory component. However, the influence of the harmonics was considered to be small, because the averages of normalised PSD for the peripheral arterial stiffness around 0.4 Hz were small in both pre SNB and post SNB. Therefore, peripheral arterial stiffness exhibits feature of MSNA where it synchronises with respiratory cycle.
Finally, the peaks in the average MSC between peripheral arterial stiffness and SBP were found around 0.04 Hz and 0.2 Hz for pre SNB and were found around 0.2 Hz for post SNB (see Fig. 6). The peaks around 0.2 Hz represent the respiratory component, because that component was synchronised with not only the peripheral arterial stiffness but also SBP23. Conversely, the MSC at LF showed significant values for most subjects in pre SNB, and it was confirmed that the peripheral arterial stiffness linearly correlated with SBP at LF (see Fig. 7). The MSC for pre SNB displayed significantly large value compared with that for post SNB, and this result was consistent with the previous study11. Furlan et al. reported that the MSC at LF between MSNA and SBP during the tilt test was significantly greater than at rest11. This result indicated that common periodic oscillations in both MSNA and SBP were induced at LF because of the sympathetic hyperactivity associated with the tilt test24. Meanwhile, the power ratio at LF of peripheral arterial stiffness in pre SNB was significantly greater than that in post SNB (see Fig. 8). Hence, the LF component of peripheral arterial stiffness was considered to reflect sympathetic nerve activity as that exhibited by MSNA.
This paper clarified that peripheral arterial stiffness inherits the features of MSNA, with its frequency components pulse-synchronous with heart and respiration rates and correlating with the LF component of SBP. Non-invasive evaluation of MSNA that requires invasive measurement may be realised with the peripheral arterial stiffness . However, peripheral arterial stiffness may not only display features of MSNA, but also those of skin sympathetic nerve activity, which plays a role in thermoregulation25. The skin sympathetic nervous activity is known to reflect in the photoplethysmogram26. Therefore, the effect of skin sympathetic nerve activity on peripheral arterial stiffness has to be investigated to enable non-invasive evaluation of MSNA.
Supplementary Information
Acknowledgements
This work was supported by JST COI Grant Number JPMJCE1311.
Author contributions
T.M., H.H., and Z.S. wrote the initial draft and prepared figures; T.M. conducted the analysis based on the methods devised by T.T. and A.F.; Y.O., R.N., N.S., M.K., and M.Y. contributed to data collection; A.Y., T.S., and S.Y. contributed to data interpretation. All authors provided critical feedback and helped shape the research, analysis, and manuscript.
Competing interests
The authors declare no competing interests.
Footnotes
Publisher's note
Springer Nature remains neutral with regard to jurisdictional claims in published maps and institutional affiliations.
Supplementary Information
The online version contains supplementary material available at 10.1038/s41598-021-85299-y.
References
- 1.Akselrod S, et al. Power spectrum analysis of heart rate fluctuation: A quantitative probe of beat-to-beat cardiovascular control. Science. 1981;213:220–222. doi: 10.1126/science.6166045. [DOI] [PubMed] [Google Scholar]
- 2.Hernando A, et al. Inclusion of respiratory frequency information in heart rate variability analysis for stress assessment. IEEE J. Biomed. Health Inform. 2016;20:1016–1025. doi: 10.1109/JBHI.2016.2553578. [DOI] [PubMed] [Google Scholar]
- 3.Al-Shargie F, et al. Mental stress assessment using simultaneous measurement of EEG and FNIRS. Biomed. Opt. Express. 2016;7:3882–3898. doi: 10.1364/BOE.7.003882. [DOI] [PMC free article] [PubMed] [Google Scholar]
- 4.Bradley MM, Miccoli L, Escrig MA, Lang PJ. The pupil as a measure of emotional arousal and autonomic activation. Psychophysiology. 2008;45:602–607. doi: 10.1111/j.1469-8986.2008.00654.x. [DOI] [PMC free article] [PubMed] [Google Scholar]
- 5.Karthikeyan P, Murugappan M, Yaacob S. Descriptive analysis of skin temperature variability of sympathetic nervous system activity in stress. J. Phys. Ther. Sci. 2012;24:1341–1344. doi: 10.1589/jpts.24.1341. [DOI] [Google Scholar]
- 6.Hagbarth K-E, Vallbo Å. Pulse and respiratory grouping of sympathetic impulses in human muscle nerves. Acta Physiol. Scand. 1968;74:96–108. doi: 10.1111/j.1365-201X.1968.tb10904.x. [DOI] [PubMed] [Google Scholar]
- 7.Hirano H, et al. A log-linearized peripheral arterial viscoelastic index and its application to endoscopic thoracic sympathectomy. Trans. Soc. Instrum. Control. Eng. 2012;48:731–739. doi: 10.9746/sicetr.48.731. [DOI] [Google Scholar]
- 8.Matsubara H, et al. Quantitative evaluation of pain during electrocutaneous stimulation using a log-linearized peripheral arterial viscoelastic model. Sci. Rep. 2018;8:1–9. doi: 10.1038/s41598-017-17765-5. [DOI] [PMC free article] [PubMed] [Google Scholar]
- 9.Hart EC, Charkoudian N. Sympathetic neural mechanisms in human blood pressure regulation. Curr. Hypertension Rep. 2011;13:237–243. doi: 10.1007/s11906-011-0191-1. [DOI] [PubMed] [Google Scholar]
- 10.Oda Y, et al. Pulse-synchronous sympathetic burst power as a new index of sympathoexcitation in patients with heart failure. Am. J. Physiol. Circ. Physiol. 2004;287:H1821–H1827. doi: 10.1152/ajpheart.00252.2003. [DOI] [PubMed] [Google Scholar]
- 11.Furlan R, et al. Oscillatory patterns in sympathetic neural discharge and cardiovascular variables during orthostatic stimulus. Circulation. 2000;101:886–892. doi: 10.1161/01.CIR.101.8.886. [DOI] [PubMed] [Google Scholar]
- 12.Drott C, Göthberg G, Claes G. Endoscopic transthoracic sympathectomy: An efficient and safe method for the treatment of hyperhidrosis. J. Am. Acad. Dermatol. 1995;33:78–81. doi: 10.1016/0190-9622(95)90015-2. [DOI] [PubMed] [Google Scholar]
- 13.Bland JM, Altman D. Statistical methods for assessing agreement between two methods of clinical measurement. Lancet. 1986;327:307–310. doi: 10.1016/S0140-6736(86)90837-8. [DOI] [PubMed] [Google Scholar]
- 14.Boardman A, Schlindwein FS, Rocha AP. A study on the optimum order of autoregressive models for heart rate variability. Physiol. Meas. 2002;23:325. doi: 10.1088/0967-3334/23/2/308. [DOI] [PubMed] [Google Scholar]
- 15.Burg, J. P. A new analysis technique for time series data. Pap. Presented at NATO Adv. Study Inst. on Signal Process. Enschede, Netherlands, 1968 (1968).
- 16.Akaike H. A new look at the statistical model identification. IEEE Trans. Autom. Control. 1974;19:716–723. doi: 10.1109/TAC.1974.1100705. [DOI] [Google Scholar]
- 17.Nuttall, A. H. Multivariate linear predictive spectral analysis employing weighted forward and backward averaging: A generalization of burg’s algorithm. Tech. Rep., Naval Underwater Systems Center New London CT (1976).
- 18.Chen C, Davis RA, Brockwell PJ. Order determination for multivariate autoregressive processes using resampling methods. J. Multivar. Anal. 1996;57:175–190. doi: 10.1006/jmva.1996.0028. [DOI] [Google Scholar]
- 19.Faes, L., Nollo, G. & Antolini, R. Investigating the level of significance of the coherence function in cardiovascular variability analysis. In Computers in Cardiology 2001. Vol. 28 (Cat. No. 01CH37287), 481–484 (IEEE, 2001).
- 20.Lehrer PM, Vaschillo E, Vaschillo B. Resonant frequency biofeedback training to increase cardiac variability: Rationale and manual for training. Appl. Psychophysiol. Biofeedback. 2000;25:177–191. doi: 10.1023/A:1009554825745. [DOI] [PubMed] [Google Scholar]
- 21.Papaioannou V, Giannakou M, Maglaveras N, Sofianos E, Giala M. Investigation of heart rate and blood pressure variability, baroreflex sensitivity, and approximate entropy in acute brain injury patients. J. Crit. Care. 2008;23:380–386. doi: 10.1016/j.jcrc.2007.04.006. [DOI] [PubMed] [Google Scholar]
- 22.Taylor JA, Williams TD, Seals DR, Davy KP. Low-frequency arterial pressure fluctuations do not reflect sympathetic outflow: Gender and age differences. Am. J. Physiol. Circ. Physiol. 1998;274:H1194–H1201. doi: 10.1152/ajpheart.1998.274.4.H1194. [DOI] [PubMed] [Google Scholar]
- 23.Pagani M, et al. Power spectral analysis of heart rate and arterial pressure variabilities as a marker of sympatho-vagal interaction in man and conscious dog. Circ. Res. 1986;59:178–193. doi: 10.1161/01.RES.59.2.178. [DOI] [PubMed] [Google Scholar]
- 24.Kamiya A, et al. Low-frequency oscillation of sympathetic nerve activity decreases during development of tilt-induced syncope preceding sympathetic withdrawal and bradycardia. Am. J. Physiol. Circ. Physiol. 2005;289:H1758–H1769. doi: 10.1152/ajpheart.01027.2004. [DOI] [PubMed] [Google Scholar]
- 25.Hagbarth K-E, Hallin RG, Hongell A, Torebjörk HE, Wallin BG. General characteristics of sympathetic activity in human skin nerves. Acta Physiol. Scand. 1972;84:164–176. doi: 10.1111/j.1748-1716.1972.tb05167.x. [DOI] [PubMed] [Google Scholar]
- 26.Awad AA, et al. Different responses of ear and finger pulse oximeter wave form to cold pressor test. Anesth. Analg. 2001;92:1483–1486. doi: 10.1097/00000539-200106000-00026. [DOI] [PubMed] [Google Scholar]
Associated Data
This section collects any data citations, data availability statements, or supplementary materials included in this article.


