

Abstract
Circulating branched-chain amino acids (BCAAs) associate with insulin resistance and type 2 diabetes. 3-Hydroxyisobutyrate (3-HIB) is a catabolic intermediate of the BCAA valine. In this study, we show that in a cohort of 4,942 men and women, circulating 3-HIB is elevated according to levels of hyperglycemia and established type 2 diabetes. In complementary cohorts with measures of insulin resistance, we found positive correlates for circulating 3-HIB concentrations with HOMA2 of insulin resistance, as well as a transient increase in 3-HIB followed by a marked decrease after bariatric surgery and weight loss. During differentiation, both white and brown adipocytes upregulate BCAA utilization and release increasing amounts of 3-HIB. Knockdown of the 3-HIB–forming enzyme 3-hydroxyisobutyryl-CoA hydrolase decreases release of 3-HIB and lipid accumulation in both cell types. Conversely, addition of 3-HIB to white and brown adipocyte cultures increases fatty acid uptake and modulated insulin-stimulated glucose uptake in a time-dependent manner. Finally, 3-HIB treatment decreases mitochondrial oxygen consumption and generation of reactive oxygen species in white adipocytes, while increasing these measures in brown adipocytes. Our data establish 3-HIB as a novel adipocyte-derived regulator of adipocyte subtype-specific functions strongly linked to obesity, insulin resistance, and type 2 diabetes.
Introduction
Type 2 diabetes is characterized by elevated circulating glucose and HbA1c, insulin resistance, dyslipidemia, and increased body fat mass, especially in the intra-abdominal region (1,2). Risk factors for type 2 diabetes include excessive caloric intake, central obesity with increased waist-to-hip ratio, sedentary lifestyle, increasing age, and multiple genetic factors (3,4). The insulin resistance and dyslipidemia associated with type 2 diabetes involve increased circulating triacylglycerols (TAG) and reduced HDL cholesterol (HDL-C). As a result, TAG/HDL-C ratio can serve as a surrogate measure of insulin resistance (5). Several studies have shown a strong association between insulin resistance and increased concentrations of circulating branched-chain amino acids (BCAAs; valine, leucine, and isoleucine) (6,7), also after controlling for age, BMI, sex, and race, although particular associations were observed for nonobese people and males with type 2 diabetes (8). Elevation of these essential amino acids in obesity and insulin resistance reflects, at least partly, reduced BCAA catabolism in adipose tissue, involving decreased expression and/or activity of BCAA catabolic enzymes (9–17). People with obesity exhibit reduced catabolism of BCAAs in visceral and subcutaneous adipose tissue, which is normalized after bariatric surgery (18). BCAAs provide carbon for de novo lipogenesis in adipocytes (19,20). Furthermore, it was recently demonstrated that cold exposure increases BCAA transport into mitochondria of brown adipocytes, augmenting thermogenesis concomitant with decreased circulating BCAA levels and improved whole-body energy homeostasis (13). These data underscore the importance of BCAA catabolism in both white adipose tissue (WAT) and brown adipose tissue (BAT), with implications for type 2 diabetes, but the mechanisms underlying these changes are not fully understood.
Diabetes is not only associated with increased circulating BCAAs but also with circulating levels of the valine degradation product 3-hydroxyisobutyrate (3-HIB), a carboxylic acid. 3-HIB was first linked to diabetes in 1989, when higher plasma concentrations of 3-HIB were reported in individuals with type 1 diabetes, especially after fasting, with 3-HIB concentrations ranging from 20 to 100 μmol/L (21). More recently, studies have linked elevated circulating levels of 3-HIB to insulin resistance and risk of incident type 2 diabetes and gestational diabetes mellitus (22–25). In contrast to CoA-bound catabolites from leucine and isoleucine degradation, 3-HIB-CoA is exclusively formed from valine breakdown and hydrolyzed by the rate-limiting enzyme 3-hydroxyisobutyryl-CoA hydrolase (HIBCH), allowing free 3-HIB to leave the mitochondria and enter the extracellular fluid (26). Previous studies have demonstrated that 3-HIB is released from muscle, heart, and preadipocytes (27), stimulates fatty acid uptake by acting as a paracrine factor on endothelial cells (28), and is involved in insulin signaling in myotubes (29). Importantly, mitochondrial catabolism of 3-HIB is a critical step for incorporation of valine-derived carbon into de novo synthesized fatty acids in developing adipocytes (27), and 3-HIB can also be converted into glucose (26,30).
A previous study found no effect of altered 3-HIB levels on fatty acid uptake in adipose-derived endothelial cells (23). However, the role of 3-HIB in adipocytes, and in functionally distinct adipocyte subtypes, is unknown. In the current study, we sought to determine whether 3-HIB directly modulates the metabolic functions of white and brown adipocytes as a novel mechanism involved in the progression toward insulin resistance and type 2 diabetes.
Research Design and Methods
Human Cohorts
Circulating 3-HIB was analyzed in three independent cohort studies (Table 1). The Hordaland Health Study (HUSK) is a community-based study with baseline measurements from 1997 to 1999 (http://husk.b.uib.no). Details of the study design and methodology have been described elsewhere (31,32). We analyzed blood samples, information about diabetes status, and body composition data from 4,942 participants (2,510 men and 2,432 women) who were born from 1925–1927 or 1950–1951 and living in Hordaland County, Norway. Participants were stratified into three groups (normoglycemia, hyperglycemia, and established type 2 diabetes) based on self-reported diabetes status corrected for glucose values. The hyperglycemia group consisted of people with self-reported nondiabetes and nonfasting plasma glucose values >7 mmol/L but <11.1 mmol/L. The group with diabetes comprised those with self-reported diabetes with addition of a few individuals who were reported to be free of diabetes but had nonfasting glucose >11.1 mmol/L. In two additional cohorts (Western Norway Obesity Biobank 1 and 2 [WNOB-1 and WNOB-2]), we analyzed blood samples from patients with severe obesity (BMI >35 kg/m2) who underwent Roux-en-Y gastric bypass surgery (WNOB-1) (33) or either gastric bypass or sleeve gastrectomy (WNOB-2) (34). WNOB-1 also included people without obesity undergoing elective surgeries, and WNOB-2 included samples collected 1 week after bariatric surgery. Notably, the patients consumed a reduced-energy diet in the weeks preceding surgery in WNOB-1, but not in WNOB-2. The majority of participants included from across the cohorts used no antidiabetic medications. Among the subgroup with established type 2 diabetes from HUSK (n = 201), 84 people used metformin, and 39 people used insulin. In WNOB-1 (n = 46), 7 patients undergoing bariatric surgery used metformin.
Table 1.
Participant characteristics
| Cohort | Men/women | Age (% or years) | BMI (kg/m2) | Glucose (mmol/L) | C-peptide (nmol/L) | TAG (mmol/L) | HDL-C (mmol/L) | Figures |
|---|---|---|---|---|---|---|---|---|
| HUSK | ||||||||
| Normoglycemia | 1,923/2,614 | 47.2* | 25.2 (4.7) | 5.0 (0.8) | N/A | 1.45 (0.89) | 1.33 (0.50) | Fig. 1A and B and Supplementary Fig. 1A |
| Hyperglycemia | 122/82 | 62.2* | 26.4 (4.8) | 7.5 (0.9) | N/A | 1.86 (1.14) | 1.20 (0.44) | Fig. 1A and B and Supplementary Fig. 1A |
| Type 2 diabetes | 110/91 | 82.6* | 27.2 (5.6) | 8.9 (5.3) | N/A | 2.11 (1.54) | 1.12 (0.45) | Fig. 1A and B and Supplementary Fig. 1A |
| WNOB-1 | ||||||||
| BMI 18–57 kg/m2 | 45/40 | 44 (20.5) | 34.7 (16.4) | 5.4 (0.7) | 0.90 (0.64) | 1.21 (0.71) | 1.10 (0.45) | Fig. 2A and B |
| Pre | 11/35 | 42.5 (10.3) | 40.7 (6.2) | 5.4 (1.3) | 1.18 (0.52) | 1.35 (0.64) | 0.91 (0.34) | Fig. 2A–C and Supplementary Fig. 1B |
| Post 1 year | 11/35 | 43.5 (10.3) | 27.6 (7.1) | 4.7 (0.4) | 0.58 (0.32) | 1.00 (0.64) | 1.22 (0.36) | Fig. 2C and Supplementary Fig. 1B |
| WNOB-2 | ||||||||
| Pre | 12/33 | 40.3 (15.5) | 42.9 (4.0) | 5.4 (0.9) | 1.21 (0.68) | 1.40 (1.01) | 1.10 (0.30) | Fig. 2D and Supplementary Fig. 1C |
| Post 1 week | 12/33 | 40.3 (15.5) | N/A | 5.0 (0.6) | 1.05 (0.58) | 1.62 (0.50) | 0.80 (0.30) | Fig. 2D and Supplementary Fig. 1C |
| Post 1 year | 5/10 | 40.9 (15.8) | 28.3 (5.0) | 4.7 (0.4) | 0.53 (0.19)# | 0.87 (0.57)# | 1.14 (0.18)# | Fig. 2D and Supplementary Fig. 1C |
Data are median (interquartile range) unless otherwise indicated. For medications, see research design and methods.
N/A, not available; Post 1 week, 1 week after bariatric surgery; Post 1 year, 1 year after bariatric surgery/after profound fat loss; Pre, before bariatric surgery.
Percentage of participants in oldest age-group. Age-groups in HUSK: 46–47 years (n = 2,510 in total) and 70–72 years (n = 2,432 in total).
Data available for four patients only.
The studies were approved by the Regional Committee for Medical and Health Research Ethics, Western Norway (approval numbers 2010/502 [WNOB-1 and WNOB-2], 2010/3405 [primary adipocyte cultures], and 2015/876 [HUSK study]) and the Regional Ethical Committee in Gothenburg, Sweden (approval number Dnr 721–96 [perirenal adipose tissue]). All participants gave written informed consent.
Adipose Tissue and Primary Human Adipocyte Cultures
Ten pairs of perirenal WAT and BAT surgical biopsies were collected from healthy kidney donors (Table 2), as described previously (35). The biopsies were classified as BAT or WAT based on quantitative PCR (qPCR) analysis of uncoupling protein 1 and histological analysis.
Table 2.
Human adipose tissue and cultures
| Men/women | Age (years) | BMI (kg/m2) | Specific analyses | Figures | |
|---|---|---|---|---|---|
| Perirenal human adipose tissue | |||||
| hWAT | 4/6 | 46.5 (13.3) | 26.6 (5.9) | Affymetrix microarray analyses | Fig. 4B |
| hBAT | 4/6 | 41.5 (25.5) | 26.1 (3.6) | ||
| Primary human adipose cultures | |||||
| Donor 1 | Woman | 48 | 27.7 | 3-HIB, BCAAs | Fig. 3B |
| Donor 2 | Woman | 68 | 32.8 | 3-HIB, BCAAs | Fig. 3B |
| Donor 3 | Woman | 53 | 26.4 | qPCR | Fig. 3D and Supplementary Fig. 2G |
| Donor 4 | Woman | 41 | 32.4 | qPCR | Fig. 3D and Supplementary Fig. 2G |
| Donor 5 | Woman | 46 | 38.1 | qPCR | Fig. 3D and Supplementary Fig. 2G |
| Donor 6 | Woman | 38 | 28.4 | qPCR | Fig. 3D and Supplementary Fig. 2G |
Data are median (interquartile range) unless otherwise indicated.
hBAT, human perirenal adipose tissue containing brown adipocytes; hWAT, human perirenal adipose tissue containing white adipocytes.
For primary human adipocyte cultures (donors 1–6, Table 2), the stromal vascular fraction was isolated from abdominal subcutaneous liposuction aspirate and differentiated as described previously (36). In addition, cells were obtained from another patient during thyroidectomy from human subcutaneous neck adipose tissue and immortalized (37).
Mouse Adipocyte Cultures
Preadipocytes from interscapular subcutaneous WAT and interscapular BAT depots from C57BL/6 male mice were isolated by collagenase and immortalized by incubation with simian virus 40 overnight, followed by passaging for 2–3 months. Immortalized mouse WAT and BAT, as well as 3T3-L1 mouse fibroblasts, were cultured and differentiated as described previously (38).
Measurement of Amino Acids and Related Metabolites
Cell culture media from undifferentiated or differentiated cells were collected before medium change every 2nd day throughout differentiation (48-h intervals). Total cell lysates from 1 million cells were collected for intracellular measurements. Indicated metabolites and amino acids were measured by gas chromatography–tandem mass spectrometry based on methylchloroformate derivatization at Bevital AS (Bergen, Norway; http://www.bevital.no) as previously described (39). Where indicated, data were normalized to cell number or protein concentration in cell lysates using the colorimetric DC Protein Assay Kit (Bio-Rad Laboratories), following the manufacturer’s Microplate Assay Protocol.
siRNA Transfection
Knockdown was performed using siRNA (Supplementary Table 1) or endo-RNase–prepared siRNA (EMU024211; Sigma-Aldrich). The siRNA was diluted in Opti-MEM Reduced Serum Media and TransIT-X2 transfection reagent (Mirus Bio LLC), and cells were incubated with targeting or nontargeting siRNA, according to the manufacturer’s protocols.
Gene Expression Analysis
RNA was collected from cultured cells using the RNeasy Mini QIAcube Kit (Qiagen), cDNA was synthesized with the High-Capacity cDNA Reverse Transcription Kit (Applied Biosystems), and qPCR was performed using SYBR Green and a LightCycler 480, according to the manufacturers’ protocols. Gene expression was normalized to reference genes, and amplicon (mRNA) levels were estimated based on standard curves or the ΔΔ threshold cycle method. Primer sequences for qPCR are provided in Supplementary Table 2. For perirenal adipose tissue, HIBCH and HIBADH mRNA expression was extracted from a previous Affymetrix microarray experiment (Human Gene 1.0 ST) comparing perirenal WAT with or without interspersion of brown adipocytes (35).
Western Blot Analysis
Cultured cells were lysed in standard radioimmunoprecipitation assay buffer (Thermo Fisher Scientific) containing protease inhibitor (Roche, Sigma-Aldrich). Protein was quantified by the colorimetric DC Protein Assay Kit (Bio-Rad Laboratories) and analyzed by SDS-PAGE and immunoblotting (10 µg protein/well in 4–20% TGX gels [Bio-Rad Laboratories]). Membranes were blocked in blocking solution containing dried skimmed milk and in PBS-Tween and incubated with primary antibody against Hibch (1:200; HPA036541; Sigma-Aldrich), vinculin (1:5,000; ab18058; Abcam), and horseradish peroxidase–conjugated secondary antibody against mouse (1:7,500; 554002; BD Pharmingen) or rabbit (1:10,000, 3546; Pierce). Proteins were detected and quantified using a SuperSignal West Femto Maximum Sensitivity Substrate Kit (Thermo Fisher Scientific), Molecular Imager Gel Doc XR (Bio-Rad Laboratories), and Quantity One 1-D Analysis Software (version 4.6.5).
Oil Red O Staining
Cells were washed with PBS, fixed in 4% formaldehyde, and incubated overnight in fresh fixation solution. Oil Red O was imaged following additional washing with sterile water, incubation in 60% isopropanol at room temperature for 5 min, and staining with Oil Red O solution (3 g/L; Sigma-Aldrich). Lipid content was quantified spectrophotometrically after eluting intracellular Oil Red O using 100% isopropanol.
Fatty Acid Uptake
Cells were seeded in a black 96-well flat-bottom plate with clear bottoms, and fatty acid uptake was measured spectrophotometrically at 37°C following addition of 100 µL/well of Fatty Acid Dye Loading Solution, according to the manufacturer’s protocol (MAK156; Sigma-Aldrich). Data were normalized to cell number per well using Hoechst staining.
Radioactive Glucose Uptake
Cells were washed in PBS prior to 16-h incubation in medium containing 1:1 of DMEM without glucose (Gibco) and Ham’s Nutrient Mixture F12 (Thermo Fisher Scientific). Thereafter, cells were incubated for 2 h in glucose-free medium with or without treatment before insulin (10 nmol/L) was added to indicated wells. After 30 min, deoxy-D-[14C]glucose (57.7 mCi/mmol, final concentration 1.73 μmol/L; PerkinElmer) was subjected to cells for 30 min. Cells were placed on ice, washed twice, and lysed using 0.1% SDS lysis buffer. Lysates were transferred to Ultima Gold fluid cartridges (PerkinElmer), and radioactivity was measured as counts per minute using a Tri-Carb 4910TR scintillation counter (PerkinElmer). Counts were normalized to protein concentration using DC Protein Assay Kit (Bio-Rad Laboratories) as described previously. All incubations were performed at 5% CO2 and 37°C.
Reactive Oxygen Species Generation
Generation of reactive oxygen species (ROS) in adipocytes was quantified by using the fluorescent probe CM-H2DCFDA (Thermo Fisher Scientific). Cells were first incubated for 30 min at 37°C with 5 μmol/L probe (dissolved in DMSO and diluted in PBS) and washed twice with warm Krebs Ringer buffer. The measurement was conducted using a 96-well SpectraMax Gemini EM (Molecular Devices) plate reader at 37°C. Fluorescence (485-nm excitation, 515-nm emission) of the oxidized probe was measured once every 10 min until steady-state ROS signal was obtained. Data were normalized to cell number per well using Hoechst staining.
Mitochondrial Respiration
Seahorse XF Cell Mito Stress Test Assay (Agilent Technologies) was conducted following the manufacturer’s protocol. Briefly, XF96 cell culture microplates were coated (0.1% gelatin) before seeding of preadipocytes. Prior to assay, cells were washed with XF base medium supplemented with L-glutamine, glucose, and sodium pyruvate (final concentrations of 2 mmol/L, 10 mmol/L, and 2 mmol/L, respectively) and treated as indicated in figure legends (Fig. 6). Subsequently, cells were incubated for 1 h 20 min (37°C without CO2), prior to measurements of cellular respiration. Data were normalized to cell number per well using Hoechst staining.
Figure 6.
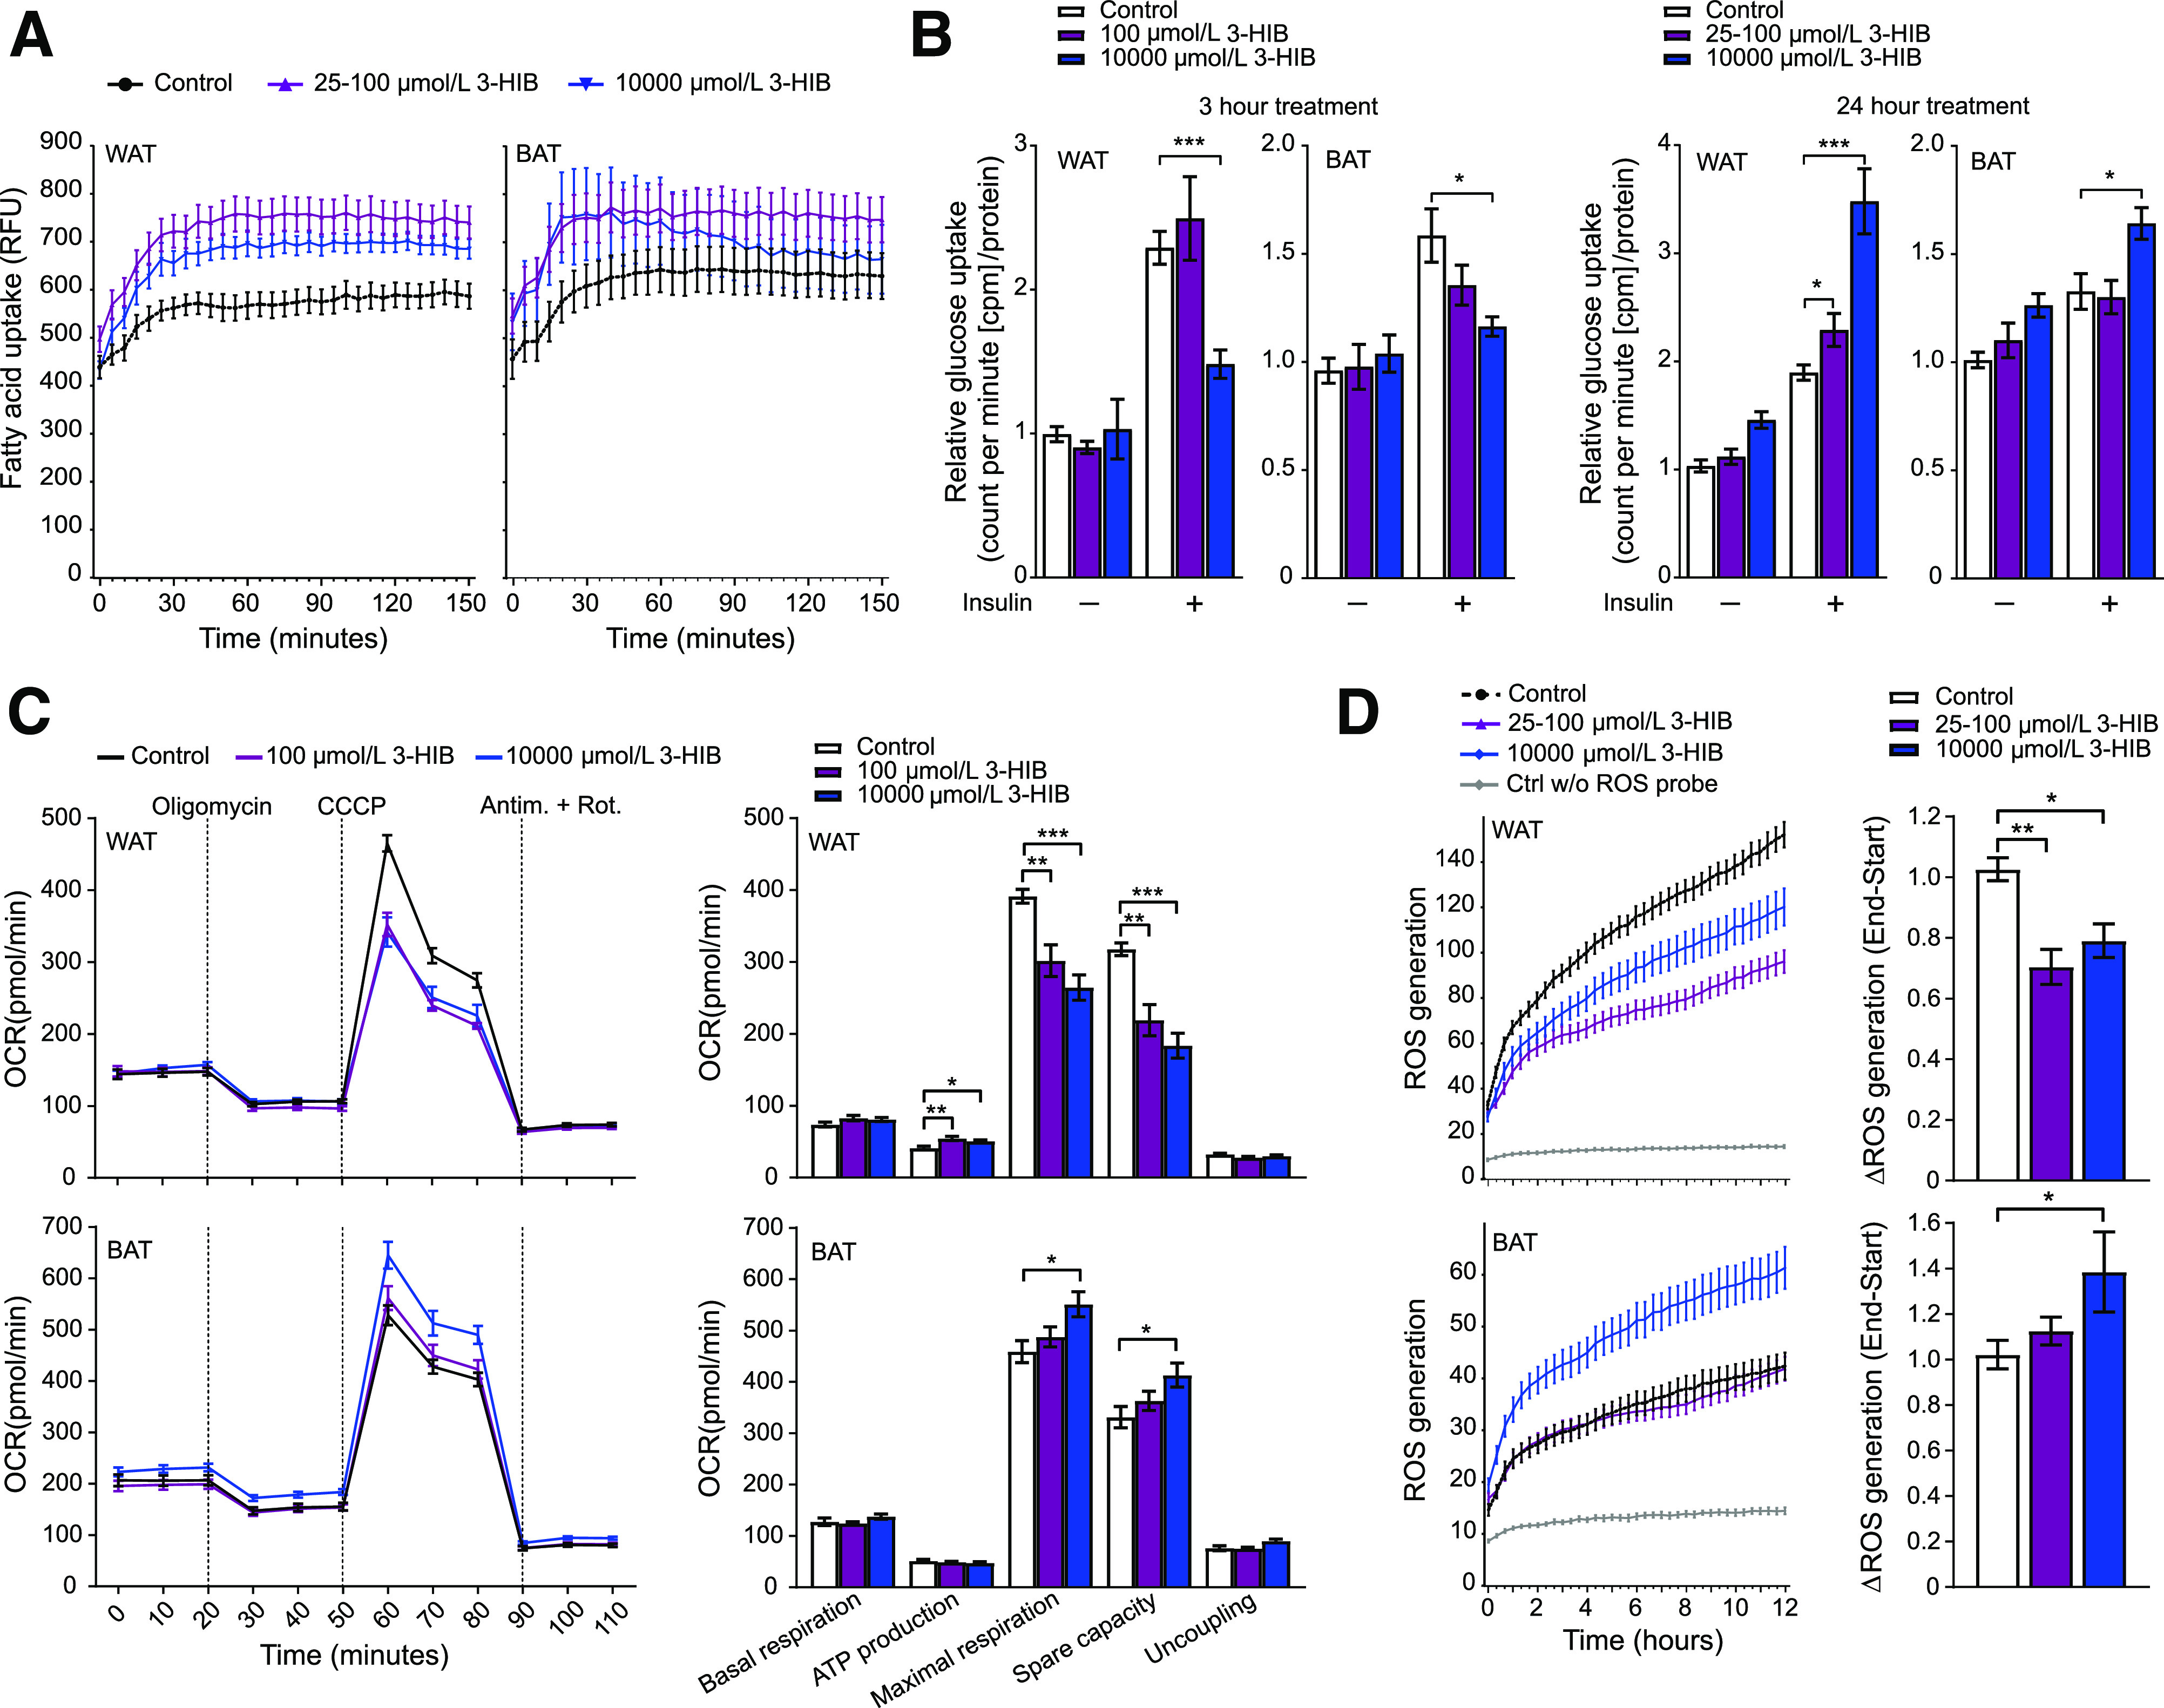
3-HIB affects uptake of fatty acids and glucose, mitochondrial respiration, and ROS generation in WAT and BAT adipocytes. A: Fatty acid uptake (shown by relative fluorescence units [RFU]) at day 6 in differentiating WAT and BAT cells (n = 11–12). 3-HIB (final concentrations of 25–100 μmol/L and 10 mmol/L) was added minutes (∼5 min) before starting the measurements. B: Glucose uptake (shown by counts per minute [cpm]/μg protein) at day 6 in differentiating WAT and BAT cells (n = 5–6) with (+) or without (−) insulin (ordinary one-way ANOVA). 3-HIB (final concentrations of 25–100 μmol/L and 10 mmol/L) was added to the cells 3 h or 24 h before measurements. Water was used as control to 3-HIB treatment. C: Seahorse XF Cell Mito Stress Assay was performed following the manufacturer’s Mito Stress protocol using the Seahorse XFe96 Analyzer to assess the mitochondrial respiration in WAT and BAT (n = 10–12) at day 5 in differentiation. 3-HIB treatment (final concentrations of 100 μmol/L and 10 mmol/L) was added 2 h before the first oxygen consumption rate (OCR) measurements in the Seahorse XFe96 Analyzer. Measurements of OCR were performed during injection of the mitochondrial-modulating compounds oligomycin, carbonyl cyanide m-chlorophenyl hydrazine (CCCP), antimycin A (Antim.), and rotenone (Rot.) (final 1 μmol/L of each, as indicated at the top in the top left panel). Outliers were removed based on a whisker Tukey test of the OCR data for each time point in each well. Basal respiration, ATP production, maximal respiration, spare capacity, and uncoupling were calculated for each well based on the OCR measurements, in accordance with the protocol from the manufacturer (Agilent Technologies). D: Short-term effect of 3-HIB addition on the production of ROS at day 6 in differentiating WAT and BAT cells (n = 11). 3-HIB (final concentrations of 25 μmol/L, 100 μmol/L, and 10 mmol/L) was added 5 min before starting the measurements. A, C, and D: Data were normalized to cell counts per well by Hoechst staining. *P < 0.05; **P < 0.01; ***P < 0.001. Ctrl w/o, control without.
Statistical Analysis
All statistical analyses were performed using the software GraphPad Prism 8 and R (version 3.6.1). Some gas chromatography-tandem mass spectrometry analyses were done in biological singlets in which five to six biological replicates were pooled. For the HUSK cohort, differences in valine and 3-HIB concentrations between groups with diabetes were modeled by multiple linear regression adjusted for age and sex. Differences between groups are reported in units of z scores obtained by standardizing the outcome variables (valine and 3-HIB). Similarly, the association between 3-HIB and established risk markers was performed as described above, with risk marker variables standardized and results reported as standardized regression coefficients. Additionally, the strength of association of 3-HIB and valine with diabetes was compared in a multivariable setting using logistic regression and stepwise selection of predictors, keeping age and sex as constant adjustment throughout. Using a combination of forward and backward selection, the final model consisted of 3-HIB, TAG, BMI, and HDL-C selected in that order. The analysis was repeated in subgroups according to sex and age, with patients with either diabetes or diabetes and hyperglycemia pooled as outcome. Association of variables in WNOB-1 was assessed by Spearman correlation adjusted for age and sex or adjusted for all included variables with correlations visualized using the function qgraph (package qgraph) in R. To assess significant differences between two groups in WNOB-1/2 and cell culture experiments, two-tailed unpaired t tests (assuming normal distribution) were performed. Ordinary one-way ANOVA (Tukey) was performed to assess significant difference for greater than two groups. Data are presented as means ± SEM or means with 95% CI (HUSK data). A significant difference was defined as P < 0.05.
Data and Resource Availability
The experimental data sets generated and/or analyzed during the current study are available from the corresponding author upon reasonable request. However, restrictions apply to the general availability of the human/clinical data because of our ethical approval, patient agreements, and the sensitive nature of the data. Except for potentially sensitive patient information, access to the HUSK cohort data can be applied for via https://husk-en.w.uib.no/how-to-apply-for-data-access/. No applicable resources were generated or analyzed during the current study.
Results
Association of Circulating 3-HIB With Hyperglycemia and Type 2 Diabetes
To evaluate circulating 3-HIB concentrations as a marker of type 2 diabetes status, plasma 3-HIB and valine concentrations available in 4,942 people from a large population-based cross-sectional cohort were investigated (HUSK cohort, Table 1). Compared with people with normoglycemia, those with hyperglycemia (glucose >7 and <11.1 mmol/L) had higher levels of 3-HIB (z score 0.45) and valine (z score 0.33), and those with established type 2 diabetes had even higher levels (z scores of 0.87 and 0.71 for 3-HIB and valine, respectively) (Fig. 1A). These data suggest that 3-HIB is a strong marker of increasing hyperglycemia. In addition, 3-HIB correlated with surrogate measures of insulin resistance and adiposity and showed similar regression coefficients with these measures for the group with normoglycemia as for the groups with hyperglycemia and type 2 diabetes (Fig. 1B), suggesting a potential role of 3-HIB in diabetes development. Comparing the strength of association of valine and 3-HIB with diabetes using logistic regression, the effect estimate for 3-HIB (adjusted for age and sex) was stronger and less affected by multiple adjustment than the other predictors (BMI, TAG, HDL-C, and valine), and, notably, in no case was valine present in the final model. With all predictors retained in the model (diabetes as outcome and all subgroups combined), the β coefficients were as follows: 3-HIB, 0.68 (0.50, 0.87); TAG, 0.24 (0.05, 0.44); BMI, 0.27 (0.10, 0.43); HDL-C, −0.18 (−0.38, 0.01); and valine, 0.13 (−0.08, 0.34).
Figure 1.
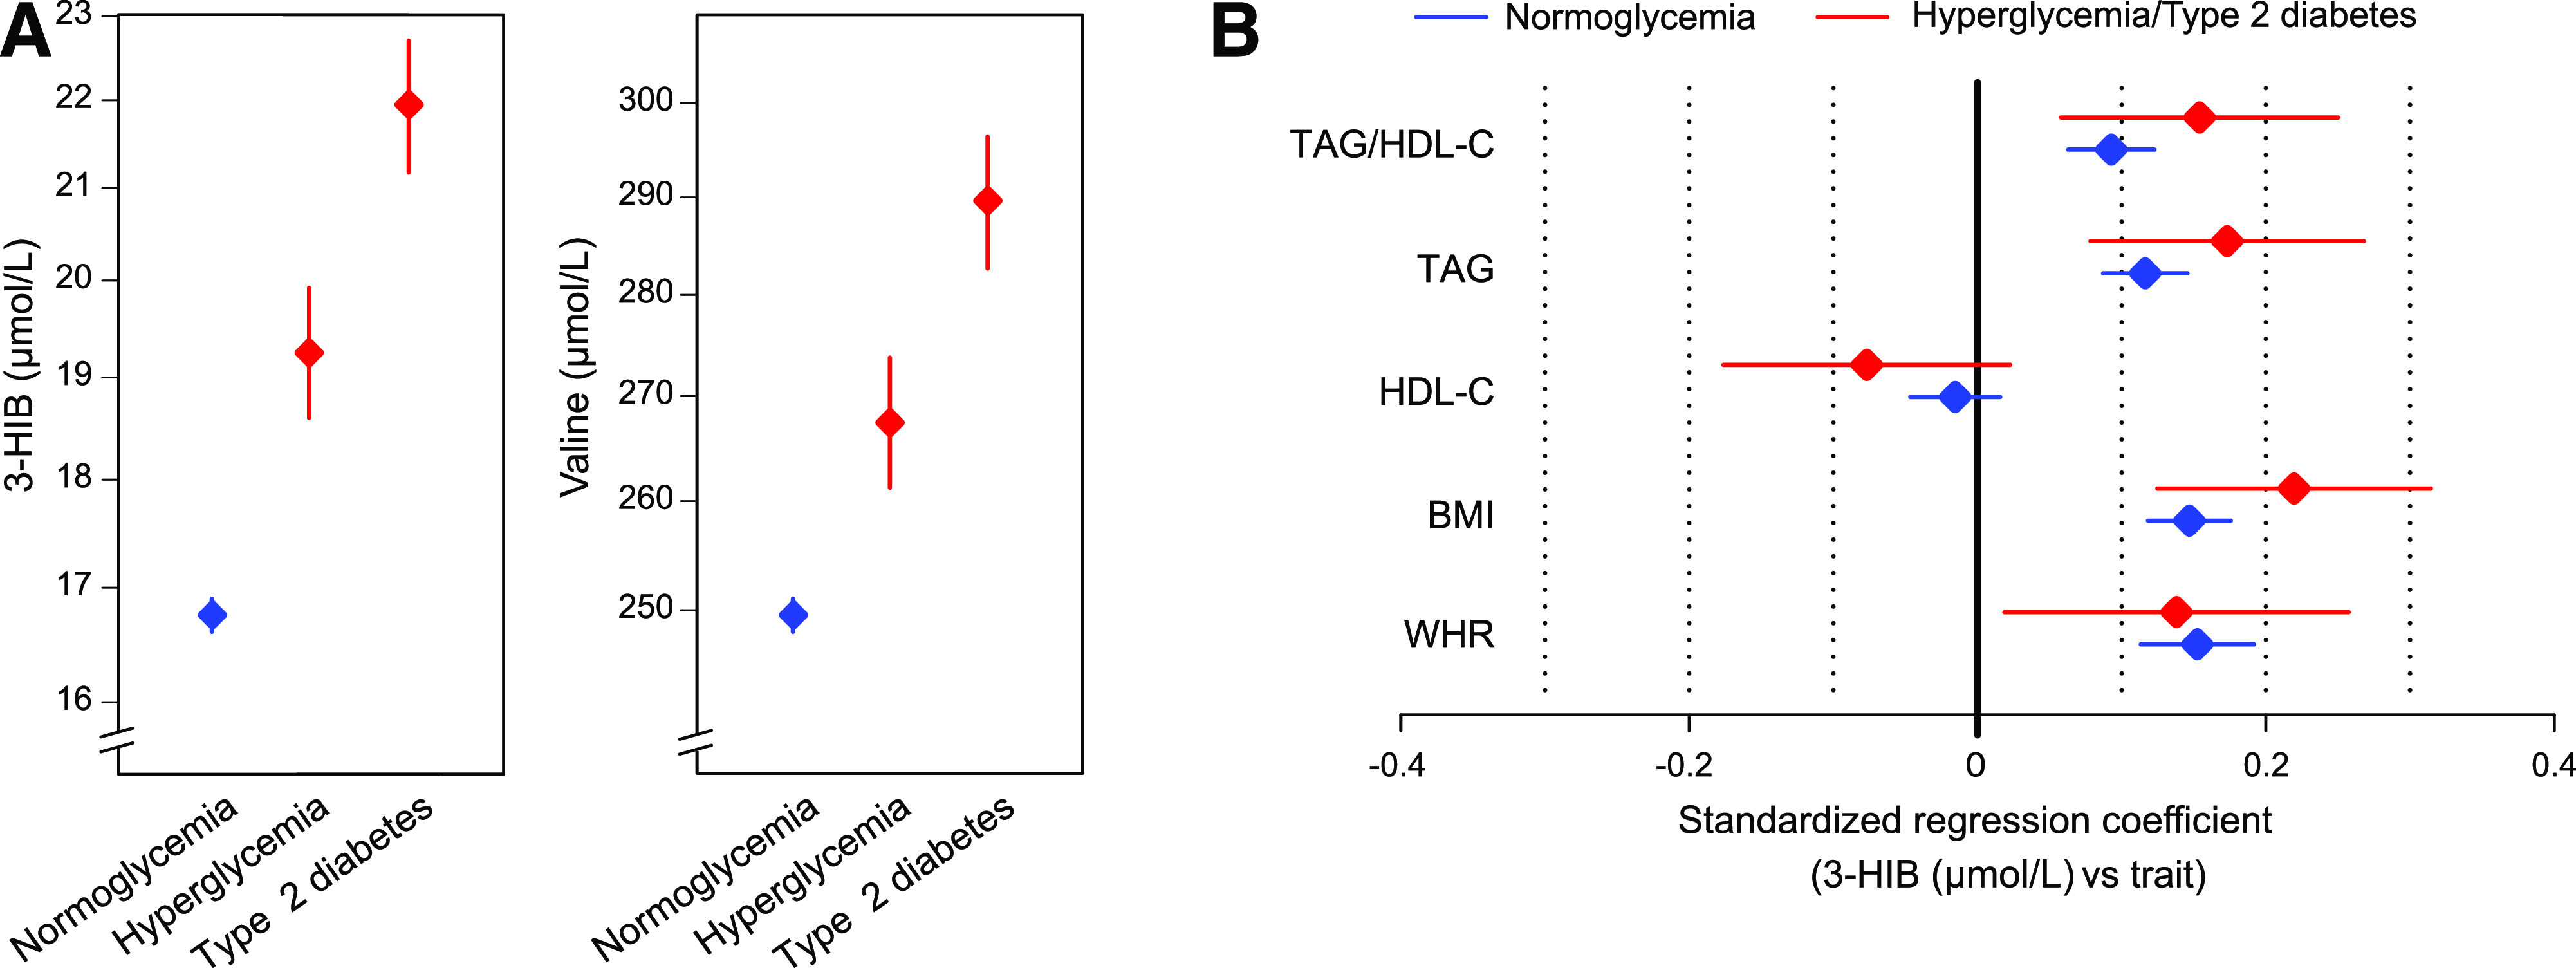
Circulating 3-HIB is associated with type 2 diabetes and measures of insulin resistance and adiposity in the HUSK cohort. A: Plasma concentrations (adjusted geometric mean ± 95% CI) of 3-HIB and valine in the groups with normoglycemia (n = 4,537), hyperglycemia (n = 204), and established type 2 diabetes (n = 201). The group with hyperglycemia consisted of people with glucose values >7 mmol/L but <11.1 mmol/L. The group with diabetes was based on self-reported diabetes with the addition of a few individuals with nonfasting glucose >11.1 mmol/L. B: Associations for plasma 3-HIB and measures of insulin resistance and adiposity in multivariate models adjusted for age and sex in the groups with normoglycemia (n = 4,761) and hyperglycemia/diabetes combined (n = 405). The combination of the latter groups gave a similar result as for the groups individually but increased statistical power. The group with hyperglycemia/diabetes included participants with self-reported type 2 diabetes and those with nonfasting glucose levels >7 mmol/L. Data are shown as estimates with 95% CI. WHR, waist-to-hip ratio.
Association of Circulating 3-HIB With Obesity and Measures of Insulin Resistance
To corroborate the relationship between circulating 3-HIB and insulin resistance, the association between these measures was investigated in people with different degrees of adiposity and insulin resistance (WNOB-1 cohort, Table 1). Although 3-HIB and valine showed similar positive correlations with HOMA2 of insulin resistance (HOMA2-IR) and insulin C-peptide and an inverse correlation with HDL-C, 3-HIB showed stronger positive correlations with BMI and glucose, while valine showed stronger correlations with TAG and TAG/HDL-C (Fig. 2A). Notably, after multiple adjustments, 3-HIB demonstrated both a positive association with HOMA2-IR and negative associations with TAG and HOMA2 of β-cell function, while valine showed weaker associations with the same variables (Fig. 2B). The link among 3-HIB, obesity, and insulin resistance was further supported by a marked decrease in circulating 3-HIB 1 year after bariatric surgery compared with presurgical values (WNOB-1 cohort), similar to the BCAAs (Fig. 2C and Supplementary Fig. 1B).
Figure 2.
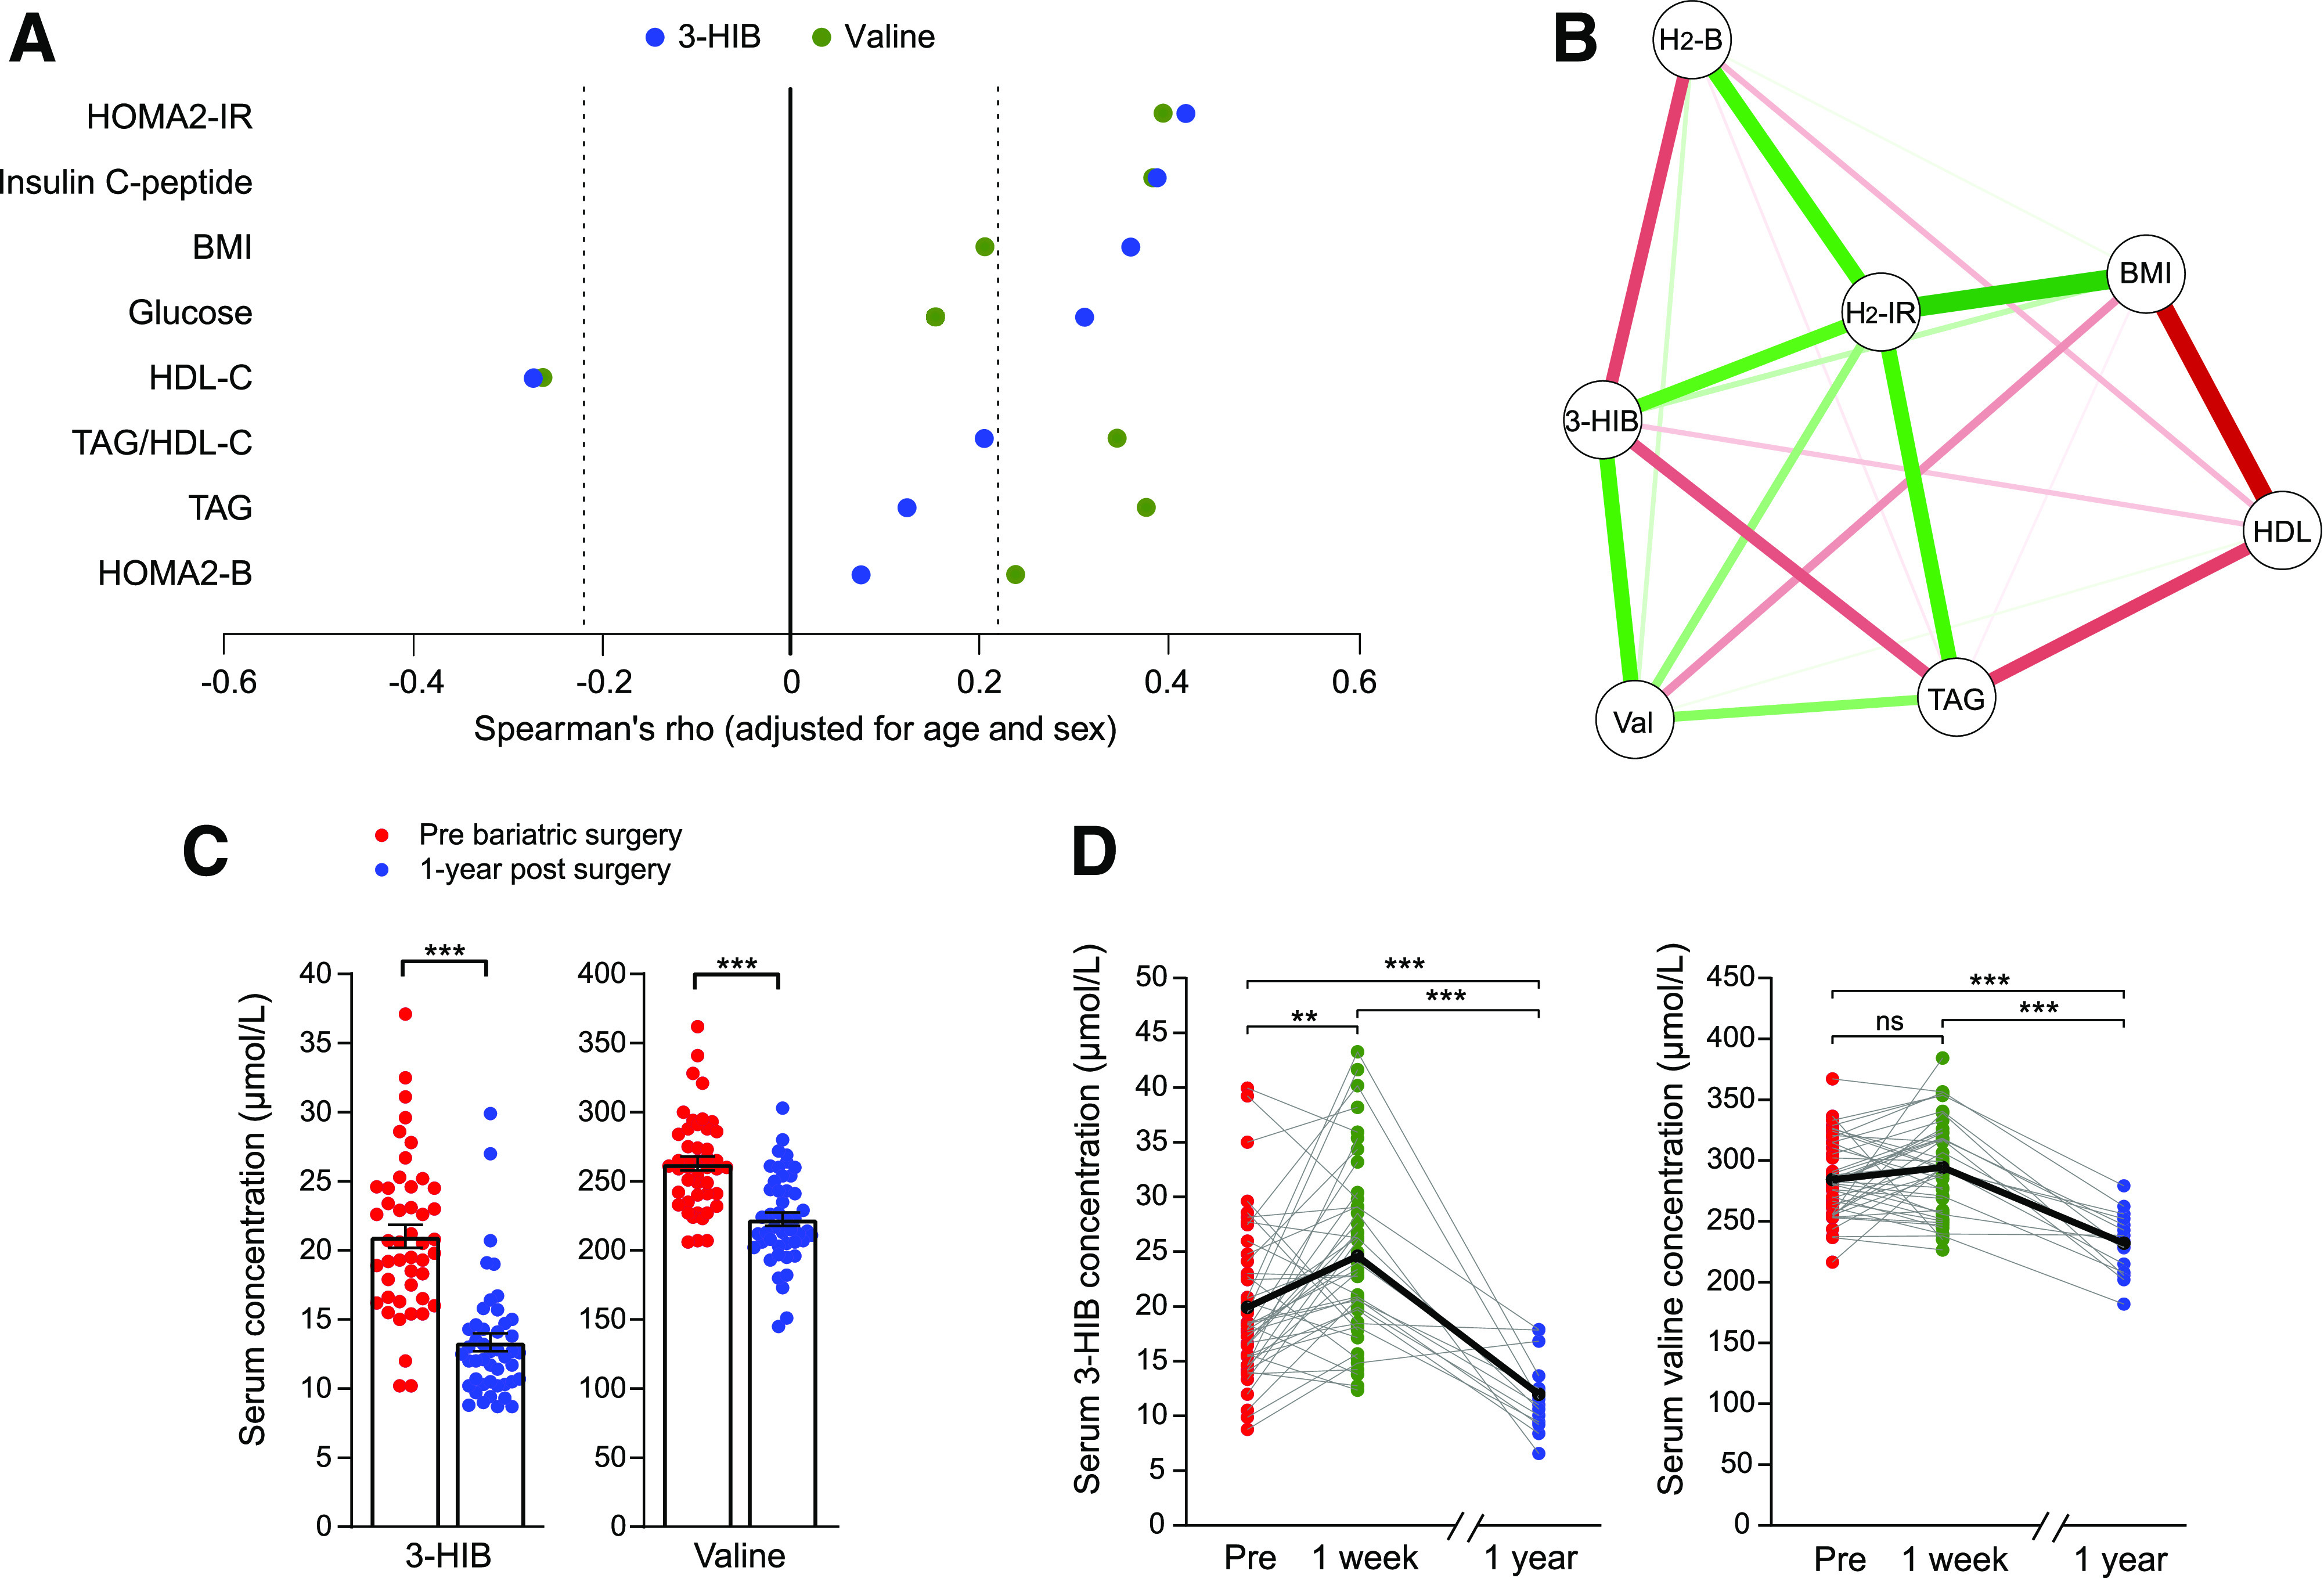
Circulating 3-HIB is associated with obesity-related insulin resistance and shows dynamic changes after bariatric surgery. A and B: Graphical representation of Spearman correlations for serum 3-HIB and valine concentrations and measures related to insulin resistance in 85 people ranging in BMI from 18 to 57 kg/m2 (WNOB-1 cohort). A: Correlations are significant for Spearman ρ <−0.22 and >0.22 (indicated by dashed lines). B: The correlations were adjusted for all variables shown in addition to age and sex. Green and red lines indicate positive and negative correlations, respectively, and line thickness the strength of correlation. C: Serum concentrations of 3-HIB and valine in patients with obesity pre– and 1 year post–bariatric surgery. Data are presented as mean ± SEM (t test) (WNOB-1 cohort). D: Individual serum concentrations of 3-HIB and valine in patients with obesity before, 1 week post–, and 1 year post–bariatric surgery (Roux-en-Y gastric bypass or laparoscopic sleeve gastrectomy) (WNOB-2 cohort). The black line indicates mean levels and gray lines individual levels. H2-B, HOMA2 of β-cell function; H2-IR, HOMA2-IR; Pre, before bariatric surgery; Val, Valine. **P < 0.01; ***P < 0.001.
Improvement in insulin resistance following bariatric surgery can occur within days, at least partially independent of weight loss (34). Circulating 3-HIB levels before and 1 week after bariatric surgery were also measured, as well as after 1 year (WNOB-2 cohort). Like the WNOB-1 cohort, there was a decrease in circulating 3-HIB 1 year after surgery. By contrast, the samples collected 1 week after bariatric surgery showed increased levels of 3-HIB and BCAAs (Fig. 2D and Supplementary Fig. 1C).
Adipocyte Release of 3-HIB During Adipogenic Differentiation and Lipid Accumulation
We investigated whether 3-HIB plays a regulatory role in adipose tissue function by analyzing metabolite fluxes in differentiating mouse 3T3-L1 and primary human adipocytes. 3-HIB efflux increased markedly during differentiation of both 3T3-L1 and primary human adipocytes, with a rebound in the later stages (Fig. 3A and B and Supplementary Fig. 2A and B). In 3T3-L1 cells, this change in 3-HIB corresponded to decreased BCAAs and increased glutamine in the culture medium throughout differentiation (Fig. 3A and Supplementary Fig. 2A and B). Although differentiating primary human adipocytes showed less fluctuation in extracellular BCAA concentrations than the 3T3-L1 cells (Fig. 2B), immortalized human adipocytes showed a clear increase in BCAA consumption accompanied by increased 3-HIB efflux, similar to what was observed in 3T3-L1 cells (Supplementary Fig. 2C and D). 3T3-L1 cells transiently accumulated intracellular 3-HIB in middifferentiation (days 2–4), but not in later stages (days 7–9) (Supplementary Fig. 2C). The changes in intracellular 3-HIB levels did not correspond with BCAA levels. As in 3T3-L1 cells, intracellular 3-HIB levels were unchanged in the mature immortalized primary human adipocytes, despite increased intracellular BCAA levels (Supplementary Fig. 2D). Taken together, both mouse and human adipocytes showed increased 3-HIB release during adipogenic differentiation, which often occurred in the absence of any change in BCAAs.
Figure 3.

Altered BCAA consumption and intracellular lipid accumulation. Changes in concentrations of amino acids and 3-HIB in culture medium throughout adipogenic differentiation in 3T3-L1 cells (A) (n = 3) and primary human adipocytes (B) (donors 1 and 2, n = 4). Mean ± SEM for absolute values are shown. C and D: Relative mRNA levels of key BCAA catabolic enzymes during adipogenic differentiation were measured in 3T3-L1 (C) (n = 3) and primary human adipocytes (D) (n = 9–12, pooled data for cultures from donors 3–6) using qPCR and calculated relative to expression of Rps13 or IPO8. One-way ANOVA with Dunnett test (median value of day 0 [C] or 2 [D] as control column) performed and presented as mean ± SEM. E: Protein levels of HIBCH (left) and the quantitative values of HIBCH relative to α-vinculin (α-VCL) (right) in immortalized primary human adipocyte cultures obtained from subcutaneous WAT. Antibody control including HIBCH knockdown to demonstrate specificity of the antibody shown in bottom panel. F–H: siRNA knockdown (final concentration of 25 nmol/L siRNA/well) was performed at day 2 and repeated every 48 h throughout differentiation. F: Effect of Hibch siRNA knockdown on mRNA level in 3T3-L1 (n = 3). G: Protein levels of HIBCH (left) and the quantitative values of HIBCH relative to α-VCL (right) in 3T3-L1 (n = 3). H: Oil Red O–stained 3T3-L1 adipocytes differentiated for 6 days, with and without siRNA-mediated knockdown of Hibch (n = 6). The results are representative of three individual experiments. I: Relative values of extracellular (medium) 3-HIB levels at day 6 during Hibch siRNA knockdown in 3T3-L1 (n = 6). Relative values are shown and normalized to control. The results are presented as mean ± SEM. Nontargeting siRNA was used as control to Hibch knockdown. *P < 0.05; **P < 0.01; ***P < 0.001. Undiff, undifferentiated.
We next evaluated if the 3-HIB release during differentiation corresponded with changes in BCAA catabolic enzyme levels, with a focus on HIBCH and HIBADH immediately upstream and downstream of 3-HIB. Using qPCR, we found a gradual increase in mRNA levels of BCAA catabolic enzymes during differentiation in both 3T3-L1 (Fig. 3C) and in primary and immortalized human adipocytes (Fig. 3D and Supplementary Fig. 2G and H). Western blot analysis also demonstrated two- to threefold higher HIBCH protein level in late adipogenesis, corresponding closely to mRNA levels (Supplementary Fig. 2I and J). The HIBCH protein level was also increased in immortalized human white adipocytes when comparing fully differentiated to undifferentiated cells (Fig. 3E). Conversely, siRNA knockdown of HIBCH in differentiating 3T3-L1 cells, which reduced Hibch mRNA level by 80% and HIBCH protein levels by 40% (Fig. 3F and G), decreased lipid accumulation by ∼25% (Fig. 3H), and reduced 3-HIB efflux from the cells by 20% (Fig. 3I).
BCAA Metabolism and 3-HIB in White and Brown Adipocytes
Reports have demonstrated metabolic effects of altered BCAA consumption in WAT and BAT (13–15,40), but to our knowledge, a direct comparison of WAT and BAT has not been performed. We found that, in C57BL/6 mice, BAT showed several-fold higher mRNA expression of key BCAA catabolic enzymes compared with WAT (e.g., Bckdha, Hibch, and Hibadh) (Fig. 4A). We also observed significantly higher mRNA levels in human perirenal adipose tissue containing brown adipocytes compared with perirenal adipose tissue containing only WAT (Fig. 4B). Similarly, in immortalized primary cultures of differentiated white and brown mouse adipocytes, with similar lipid accumulation (Fig. 4C), brown adipocytes showed considerably higher mRNA expression levels of key BCAA catabolic enzymes, with two- to fivefold higher mRNA levels in differentiated brown compared with differentiated white adipocyte cultures (Fig. 4D). As expected, expression of mature adipocyte markers (Pparg2, Glut4, and the uncoupling marker Ucp1) was substantially higher in brown adipocytes (Fig. 4D). Western blot showed increased HIBCH protein in parallel with the increased Hibch mRNA expression in both cell types, with a stronger induction upon adipogenic differentiation in brown adipocytes (Fig. 4E). Despite these differences in enzyme expression, the white and brown adipocytes released similar amounts of 3-HIB into the culture medium upon adipogenic differentiation and had similar intracellular 3-HIB levels (Fig. 4F). However, while both white and brown adipocytes showed similarly reduced extracellular BCAA levels after differentiation (indicating increased consumption), intracellular BCAA levels were higher in brown compared with white preadipocytes (Supplementary Fig. 2K).
Figure 4.
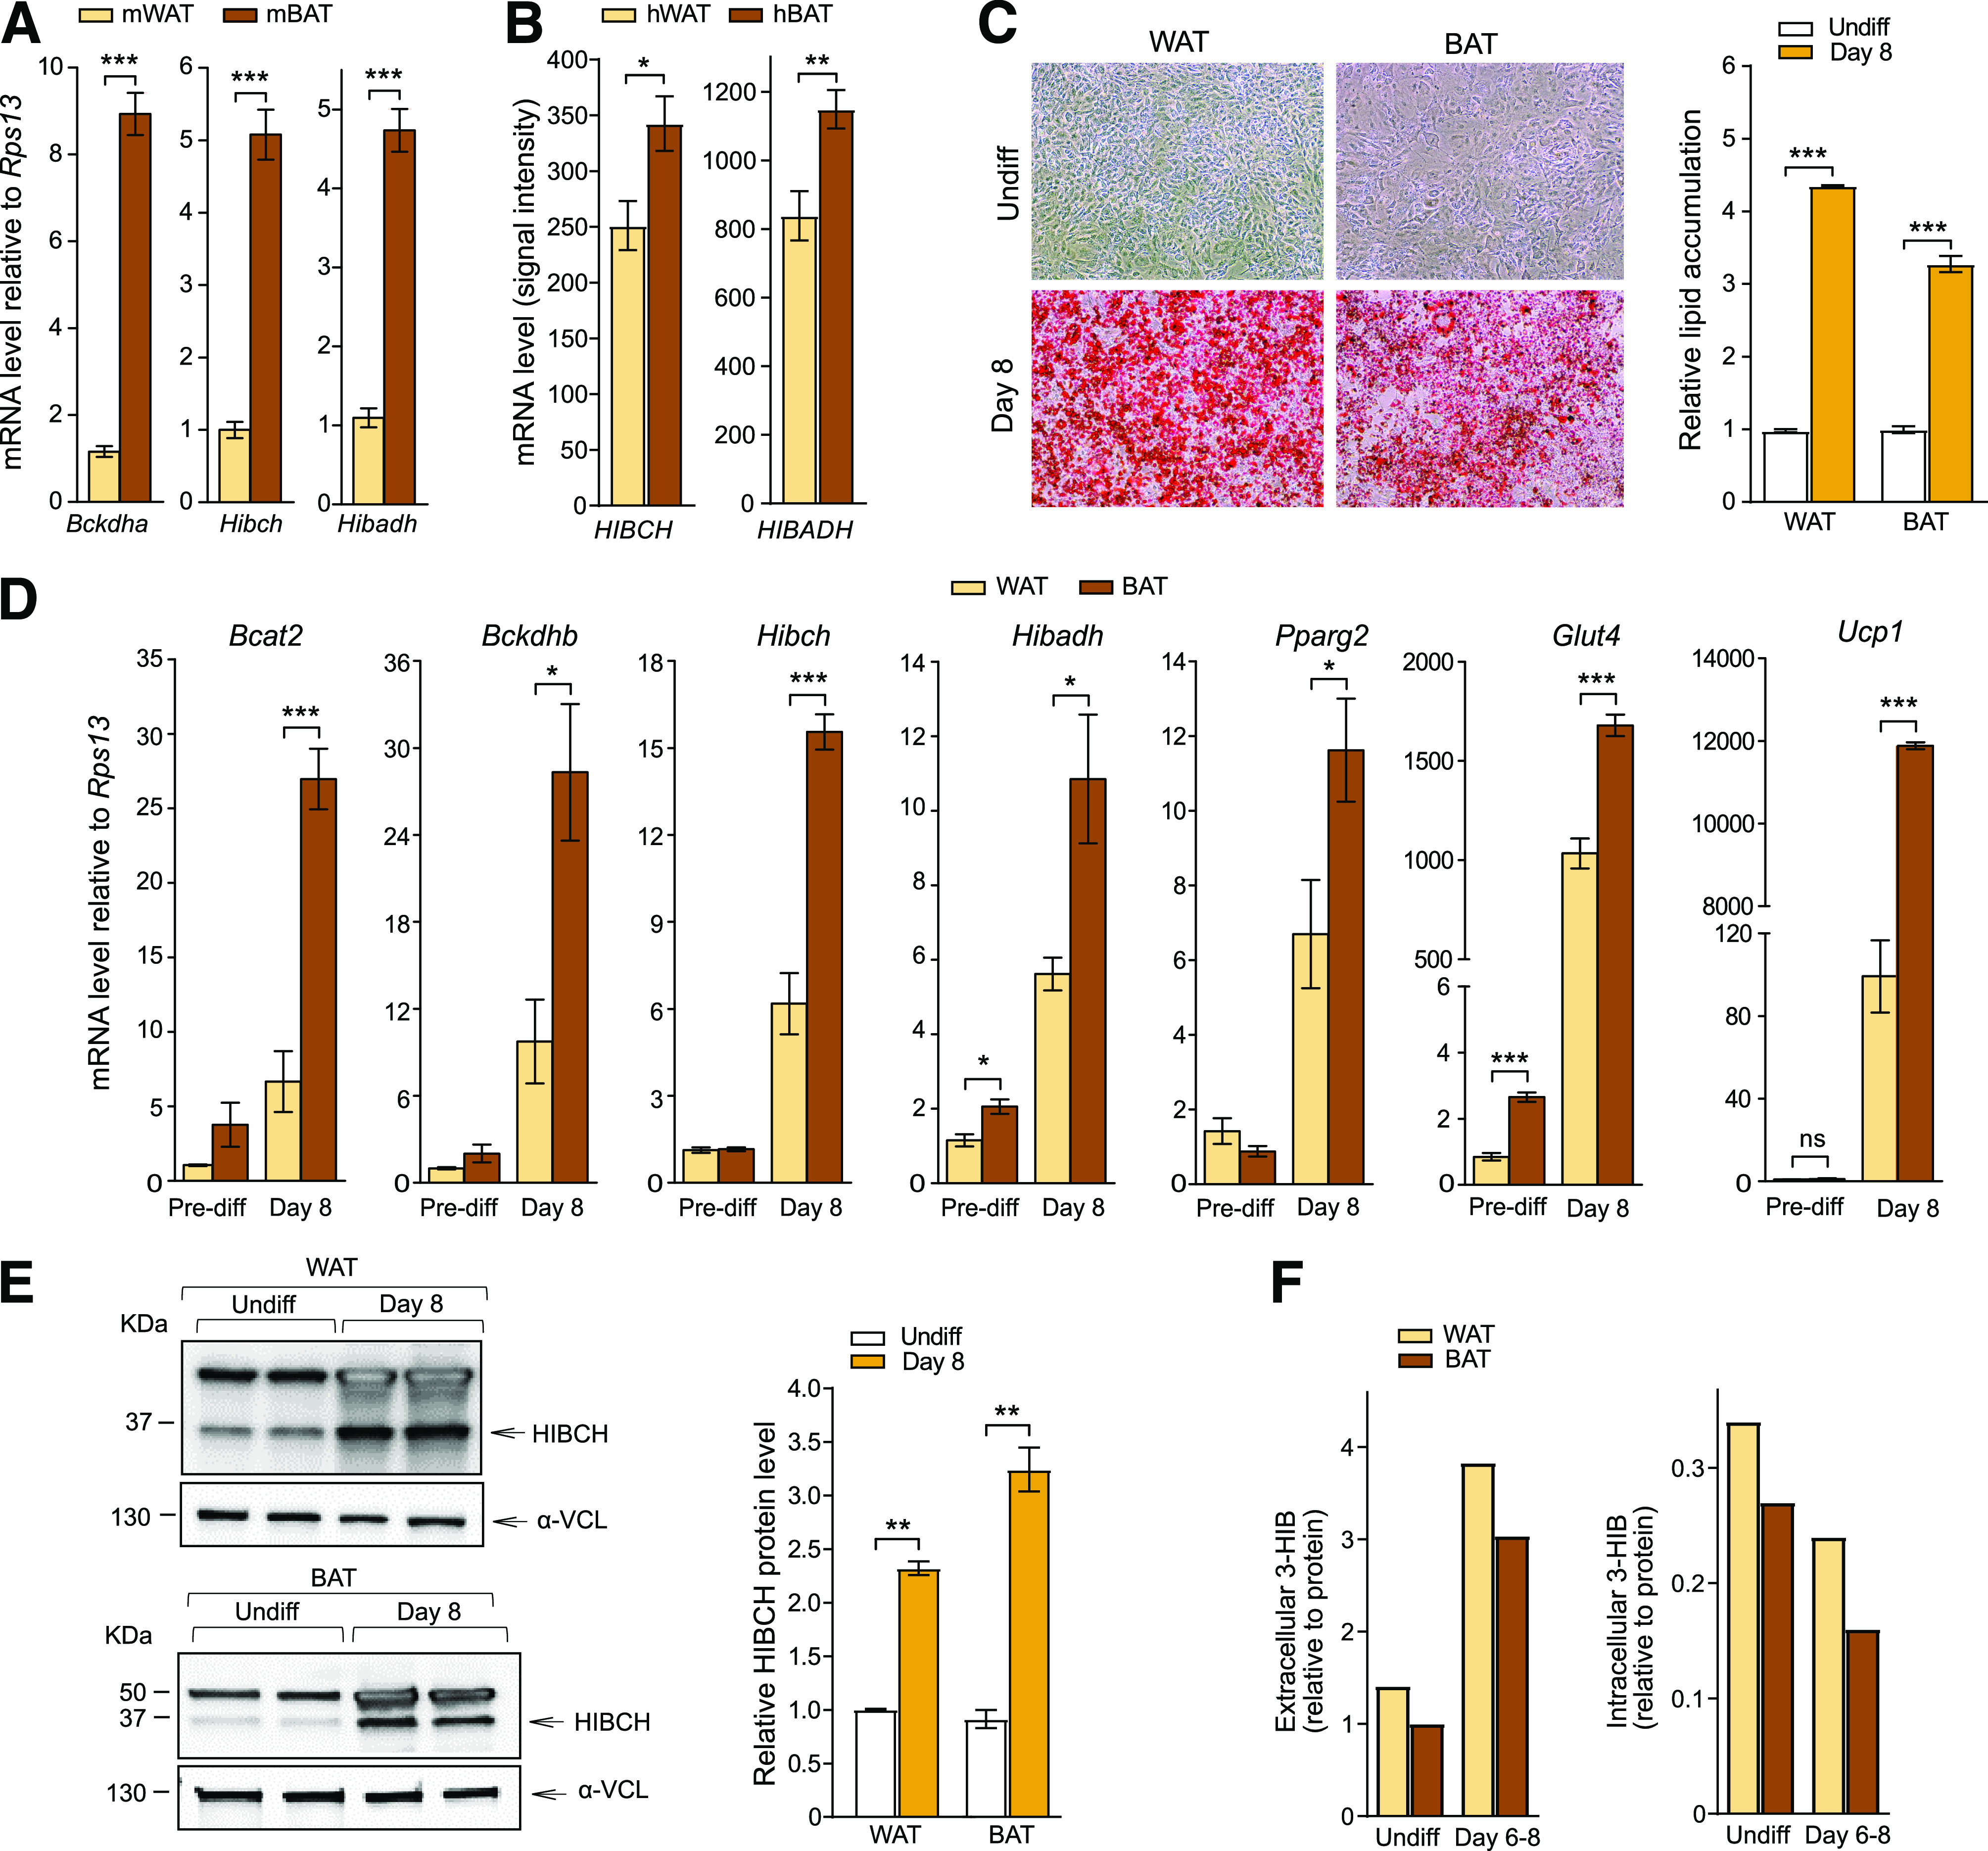
Comparison of white and brown adipocytes shows differences in BCAA metabolism. A: Relative mRNA levels of Bckdha, Hibch, and Hibadh in WAT and BAT dissected from C57BL/6 mice (mWAT and mBAT) (n = 10–12). B: Absolute values of mRNA levels (signal intensity) of HIBCH and HIBADH from array analysis of perirenal human adipocytes from WAT and BAT surgical biopsies (from healthy kidney donors) (hWAT and hBAT) (n = 10). C: Representative images of Oil Red O lipid stained adipocytes (left) and quantification of lipid accumulation (right) (n = 3) in immortalized WAT and BAT obtained from C57BL/6 mice. D: Relative mRNA levels of genes encoding BCAA catabolic enzymes and genes involved in differentiation, adipocyte maturation, and browning (n = 4). Expression was calculated relative to values in undifferentiated (Undiff) WAT cultures. The results are presented as mean ± SEM. E: Western blots showing protein levels of HIBCH (left) and the quantitative values of HIBCH relative to α-vinculin (α-VCL) (right). Relative values normalized to control (nontargeting siRNA) for each cell type are presented (n = 2). F: Extracellular (cell culture medium, 48-h consumption) and intracellular levels of 3-HIB (relative to protein) in undifferentiated controls and cells differentiated for 8 days (n = 1/time point; samples originating from six 15-cm dishes pooled together). *P < 0.05; **P < 0.01; ***P < 0.001. Pre-diff, predifferentiation.
We further examined how altered levels of HIBCH might affect adipocyte metabolic functions by performing knockdown experiments in primary white and brown adipocytes from mice followed by measurements of fatty acid and glucose uptake and mitochondrial oxygen consumption. In addition, we measured ROS generation, which is linked to altered mitochondrial respiration and impaired adipocyte function (41). HIBCH knockdown, with 90–95% reduction of mRNA and 30–40% of protein (Fig. 5A and B), decreased lipid accumulation by 25–40% in both white and brown adipocytes (Fig. 5C), concomitant with 45–50% reduced 3-HIB efflux from the cells (Fig. 5D).
Figure 5.

Hibch knockdown reduces lipid accumulation and 3-HIB efflux. A–D: Knockdown (final concentration of 25 nmol/L siRNA/well) was performed on day 2 and repeated every 48 h during differentiation. Nontargeting siRNA was used as control to Hibch knockdown. Effect of Hibch siRNA knockdown on mRNA level (B) (n = 3) and on protein levels of HIBCH (C) (left) (n = 3) in WAT and BAT and the quantitative values of HIBCH relative to α-vinculin (α-VCL) (right). C: Mature WAT and BAT adipocytes subjected to Oil Red O staining on day 6 show reduced lipid accumulation compared with control after knockdown of Hibch (n = 6). These results are representative of three independent experiments with siRNA or endo-RNase–prepared siRNA. D: Relative values of extracellular (medium) 3-HIB levels at days 4 and 6 during Hibch knockdown in WAT and BAT (n = 6). Relative values are shown and normalized to control for each cell type. The results are presented as mean ± SEM. ***P < 0.001.
Conversely, addition of 3-HIB using both physiological (25–100 μmol/L) and supraphysiological (10 mmol/L) concentrations to the cell cultures increased fatty acid uptake in white adipocytes by 15–25% (Fig. 6A). Short-term (3-h) treatment with 10 mmol/L 3-HIB also counteracted insulin-stimulated glucose uptake in both adipocyte cell types, but 100 μmol/L 3-HIB had no significant effect (Fig. 6B). In contrast, longer-term (24-h) treatment with 3-HIB increased insulin-stimulated glucose uptake in both cell types, although no effect was seen with lower doses of 3-HIB in brown adipocytes. The 24-h high-dose treatment also tended to increase basal glucose uptake (Fig. 6B). Finally, we observed that the addition of 3-HIB acutely decreased maximal mitochondrial respiration, spare respiratory capacity, and ROS generation by 20–50% in white adipocytes, while in brown adipocytes, these measures increased by 10–35% primarily at the high dose (Fig. 6C and D). The effects on mitochondrial respiration were replicated in cells supplemented with 3-HIB for 2 days (Supplementary Fig. 3). Taken together, these data demonstrate a regulatory role for 3-HIB in core adipocyte functions.
Discussion
In the current study, we found elevated plasma 3-HIB concentrations mirroring the degree of insulin resistance, with the highest levels observed in established type 2 diabetes. Additionally, we provide novel mechanistic data implicating 3-HIB as an adipocyte-derived autocrine/paracrine and possibly endocrine signaling molecule, demonstrating stimulatory effects on adipocyte lipid accumulation, modulation of insulin-stimulated glucose uptake, and differential effects on mitochondrial respiration dependent on adipocyte subtype. A marked decrease in plasma 3-HIB 1 year after bariatric surgery and weight loss further supports the clinical relevance of the mechanistic data.
White and brown adipocyte functions are critically involved in the regulation of circulating BCAA levels and systemic insulin resistance (13–15,17), but the underlying mechanisms are not fully understood. An important discovery in our study is the effect of increased 3-HIB on fatty acid uptake and insulin-stimulated glucose uptake directly in adipocytes. Earlier studies suggested that 3-HIB promotes insulin resistance in skeletal muscle by increasing fatty acid uptake from endothelial cells (28), while no 3-HIB–mediated fatty acid uptake was found in adipose-derived microvascular endothelial cells (23). In adipocytes, we observed a time-dependent regulation of insulin-stimulated glucose uptake by 3-HIB, with a decrease in the short term and an increase in the longer term. While the physiological relevance of this dynamic regulation is unclear, the stimulatory effect of chronically elevated 3-HIB on adipocyte glucose uptake is consistent with increased fat storage (e.g., by providing pyruvate for TAG synthesis) and the role of adipocyte insulin signaling in promoting obesity and glucose intolerance (42). Notably, short-term 3-HIB treatment increased fatty acid uptake, while insulin-stimulated glucose uptake decreased, indicating that sources other than glucose (e.g., pyruvate) contributed to glyceroneogenesis, as seen with fasting and high-carbohydrate diets (43).
Interestingly, we found that addition of 3-HIB decreased mitochondrial respiratory capacity in white adipocytes, a metabolic change associated with obesity in different mouse models (44). In contrast, brown adipocytes responded to 3-HIB addition by increasing mitochondrial respiratory capacity and ROS generation. Our data suggest that this difference is mediated by substantially higher expression of BCAA catabolic enzymes in brown adipocytes and consequent differences in valine degradation and anaplerosis. 3-HIB can be channeled toward the tricarboxylic acid cycle via methylmalonic acid or toward lipogenesis (27). Consistently, altered BCAA catabolism has been shown to limit mitochondrial respiratory capacity (11). Thus, our findings indicate that differential enzyme expression and 3-HIB utilization in white and brown adipocytes may determine the channeling of 3-HIB toward fatty acid synthesis or oxidative phosphorylation and thermogenesis.
Importantly, we demonstrate that HIBCH knockdown is sufficient to reduce 3-HIB efflux as well as lipid accumulation in white and brown adipocytes, supporting an independent role for the valine–3-HIB catabolic pathway in lipid accumulation in both adipocyte subtypes. Differentiation of white adipocytes was previously shown to involve a switch of substrate utilization from glucose and glutamine to BCAAs (7,19), and our enzyme expression data suggest this also occurs in brown adipocytes. A recent study showed that decreased BCAA catabolism specifically in BAT resulted in diet-induced obesity and glucose intolerance (13) and that BCAA catabolism in BAT regulates systemic BCAA clearance by increasing BCAA utilization upon cold exposure (13). Conceivably, 3-HIB may play a role in this metabolic regulation, in part by affecting fatty acid uptake, mitochondrial respiration, and ROS generation in brown as well as white adipocytes.
When comparing people with hyperglycemia and type 2 diabetes to those with normoglycemia in the large population-based HUSK cohort, we observed a greater difference in circulating concentrations of 3-HIB than in the precursor valine. Moreover, multiadjusted logistic regression analysis showed that 3-HIB, but not valine, was independently associated with type 2 diabetes in a multivariable setting. This indicates, as recently suggested (25), that measurement of circulating 3-HIB may capture altered insulin resistance–related cellular processes more directly than circulating BCAAs—in this case, valine. Interestingly, we also found that 3-HIB increased transiently 1 week after bariatric surgery, a treatment that acutely increases insulin sensitivity (34). This suggests that circulating 3-HIB may also reflect a transient metabolic adaptation during reduced food intake. A previous study reported higher plasma concentrations of 3-HIB in overnight-fasted people with type 1 diabetes compared with fasted subjects without diabetes (21). In addition, people without diabetes who fasted for 72 h had even higher levels than overnight-fasted people, indicating that 3-HIB levels rise both in the state of type 1 diabetes and upon prolonged fasting (21). Of note, elevated plasma 3-HIB in patients with liver cirrhosis, another state of insulin resistance, coincides with increased catabolism of amino acids and lipids due to a lack of cellular glucose supply (45).
It is also worth noting that skeletal muscle myocytes were found to increase the release of 3-HIB following overexpression of peroxisome proliferator–activated receptor γ coactivator-1α, a transcriptional coactivator that plays a central role in the cellular response to fasting and exercise (28). The authors proposed that 3-HIB, at least partly, mediates insulin resistance by upregulating endothelial fatty acid uptake within skeletal muscle. Conversely, when glucose and insulin increase during hyperinsulinemic-euglycemic clamp, circulating 3-HIB was found to decrease rapidly (22). However, protein intake during the clamp, which decreased insulin-stimulated glucose disposal, prevented the decrease in 3-HIB, supporting a link between 3-HIB and acute changes in nutrient supply and insulin resistance (22). Our mechanistic data indicate that 3-HIB participates in the dynamic, homeostatic regulation of cellular insulin signaling and nutrient metabolism, further supported by the inverse correlation with TAG after adjusting for other covariates. Overall, while 3-HIB responds acutely to different nutritional states, elevated circulating 3-HIB concentrations may largely reflect fat storage, evidenced by strong positive correlations with BMI and waist-to-hip ratio and marked reductions in 3-HIB following surgery-induced fat loss. Of note, because 3-HIB followed a similar pattern as valine in our cohorts, it is also possible that changes in 3-HIB levels at least partly depended on altered valine concentrations.
Muscle, heart, and preadipocytes (27), as well as white and brown adipocytes, may all release 3-HIB, but the main sources of increased circulating 3-HIB in obesity and insulin resistance are unknown. A previous study suggested that adipose tissue may contribute more to circulating BCAAs than muscle (17). Genetic manipulation of BCAA enzymes in both adipose tissue and skeletal muscle has been shown to affect circulating BCAA levels as well as cell differentiation and lipid accumulation (10,19,28). In light of our findings that adipocytes release 3-HIB during development and increasing lipid storage and considering the relatively large adipose tissue mass among individuals with obesity, insulin resistance, and type 2 diabetes, it is possible that adipocytes may contribute substantially to elevated circulating 3-HIB in these conditions. However, caution is merited in this case because people with obesity and insulin resistance show evidence of reduced BCAA catabolism in adipose tissue (10,11,18,46), which may limit 3-HIB generation from valine in adipocytes. Although reduced BCAA activity in unison with elevated circulating BCAA levels has been consistently observed in obesity-related conditions, reported circulating 3-HIB concentrations are ∼10-fold lower than that of valine, and thus, any pronounced elevation in 3-HIB levels may be more readily identified.
Our study has limitations. Study participants comprised a relatively homogenous population from Western Norway, and the generalizability to other populations and ethnicities needs further investigation. Sex differences found to influence the link between BCAAs and metabolic risk factors (8,47) should also be explored for 3-HIB, even though adjustment for sex did not notably influence the results of our analyses. Furthermore, it remains to be determined if adipocytes contribute to circulating 3-HIB in vivo and how this might influence whole-body energy metabolism and insulin sensitivity.
In conclusion, we report a novel role for 3-HIB in white and brown adipocyte metabolism, not only as an indicator of mitochondrial valine catabolism, but also as a potentially important metabolic regulator of adipocyte nutrient uptake and mitochondrial respiration. Our results raise the possibility that 3-HIB serves as an adipocyte-derived signaling molecule that contributes to metabolic cross talk between different adipocyte subtypes as well as other tissues.
Article Information
Acknowledgments. The authors thank the participants who contributed data; Linn Skartveit and Margit Solsvik at the Hormone Laboratory, Department of Medical Biochemistry and Pharmacology, Haukeland University Hospital (Bergen, Norway) and Department of Clinical Science, University of Bergen (Bergen, Norway) for expert technical assistance; and Arne-Christian Mohn, Lillian Skumsnes, Hans-Jørgen Nielsen, Tone Flølo, and other staff members at Haugesund Hospital (Haugesund, Norway) and Voss Hospital (Bergen, Norway) and Christian Busch at Plastikkirurg1 (Bergen, Norway) for collecting samples.
Funding. The study was supported by Norges Forskningsråd (263124/F20), the Diabetesforbundet (Norwegian Diabetes Association), the Western Norway Health Authority, the Bergen Medical Research Foundation, and the Trond Mohn Foundation (Bergen, Norway).
Duality of Interest. M.K.S. is currently employed by Amgen AB. No other potential conflicts of interest relevant to this article were reported.
Author Contributions. S.N.D. conceived the study with input from M.S.N., R.Å.J., A.U., A.Mc., and P.M.U. The clinical cohort studies were designed and organized by P.-A.S., M.K.S., B.G.N., O.A.G., G.S.T., G.M., and S.N.D. The immortalized white and brown adipocyte cultures were developed by M.S.N. and S.N.D. supported by C.R.K. A.U. and A.Mc. contributed to metabolomics and statistical analyses. R.Å.J. and A.Ma. helped carry out experiments. M.S.N., R.Å.J., and S.N.D. designed experiments, researched data, and wrote the manuscript. All authors reviewed, edited, and approved the final version of the manuscript. S.N.D. is the guarantor of this work and, as such, had full access to all of the data in the study and takes responsibility for the integrity of the data and the accuracy of the data analysis.
Prior Presentation. This study was presented at the Norwegian Association for Obesity Research annual meeting, Bodø, Norway, 18–19 October 2018; the Norwegian Association for Obesity Research annual meeting, Oslo, Norway, 17–18 October 2019; and the 26th European Congress on Obesity, Glasgow, U.K., 28 April–1 May 2019.
Footnotes
This article contains supplementary material online at https://doi.org/10.2337/figshare.12497591.
References
- 1.Lee JJ, Pedley A, Hoffmann U, Massaro JM, Fox CS. Association of changes in abdominal fat quantity and quality with incident cardiovascular disease risk factors. J Am Coll Cardiol 2016;68:1509–1521 [DOI] [PMC free article] [PubMed] [Google Scholar]
- 2.Smith JD, Borel A-L, Nazare J-A, et al. Visceral adipose tissue indicates the severity of cardiometabolic risk in patients with and without type 2 diabetes: results from the INSPIRE ME IAA study. J Clin Endocrinol Metab 2012;97:1517–1525 [DOI] [PubMed] [Google Scholar]
- 3.Bellou V, Belbasis L, Tzoulaki I, Evangelou E. Risk factors for type 2 diabetes mellitus: an exposure-wide umbrella review of meta-analyses. PLoS One 2018;13:e0194127. [DOI] [PMC free article] [PubMed] [Google Scholar]
- 4.Ingelsson E, McCarthy MI. Human genetics of obesity and type 2 diabetes mellitus: past, present, and future. Circ Genom Precis Med 2018;11:e002090. [DOI] [PMC free article] [PubMed] [Google Scholar]
- 5.McLaughlin T, Reaven G, Abbasi F, et al. Is there a simple way to identify insulin-resistant individuals at increased risk of cardiovascular disease? Am J Cardiol 2005;96:399–404 [DOI] [PubMed] [Google Scholar]
- 6.McCormack SE, Shaham O, McCarthy MA, et al. Circulating branched-chain amino acid concentrations are associated with obesity and future insulin resistance in children and adolescents. Pediatr Obes 2013;8:52–61 [DOI] [PMC free article] [PubMed] [Google Scholar]
- 7.Halama A, Horsch M, Kastenmüller G, et al. Metabolic switch during adipogenesis: from branched chain amino acid catabolism to lipid synthesis. Arch Biochem Biophys 2016;589:93–107 [DOI] [PubMed] [Google Scholar]
- 8.Thalacker-Mercer AE, Ingram KH, Guo F, Ilkayeva O, Newgard CB, Garvey WT. BMI, RQ, diabetes, and sex affect the relationships between amino acids and clamp measures of insulin action in humans. Diabetes 2014;63:791–800 [DOI] [PMC free article] [PubMed] [Google Scholar]
- 9.Newgard CB, An J, Bain JR, et al. A branched-chain amino acid-related metabolic signature that differentiates obese and lean humans and contributes to insulin resistance. Cell Metab 2009;9:311–326 [DOI] [PMC free article] [PubMed] [Google Scholar]
- 10.Lackey DE, Lynch CJ, Olson KC, et al. Regulation of adipose branched-chain amino acid catabolism enzyme expression and cross-adipose amino acid flux in human obesity. Am J Physiol Endocrinol Metab 2013;304:E1175–E1187 [DOI] [PMC free article] [PubMed] [Google Scholar]
- 11.Lynch CJ, Adams SH. Branched-chain amino acids in metabolic signalling and insulin resistance. Nat Rev Endocrinol 2014;10:723–736 [DOI] [PMC free article] [PubMed] [Google Scholar]
- 12.Badoud F, Lam KP, DiBattista A, et al. Serum and adipose tissue amino acid homeostasis in the metabolically healthy obese. J Proteome Res 2014;13:3455–3466 [DOI] [PubMed] [Google Scholar]
- 13.Yoneshiro T, Wang Q, Tajima K, et al. BCAA catabolism in brown fat controls energy homeostasis through SLC25A44. Nature 2019;572:614–619 [DOI] [PMC free article] [PubMed] [Google Scholar]
- 14.Burrill JS, Long EK, Reilly B, et al. Inflammation and ER stress regulate branched-chain amino acid uptake and metabolism in adipocytes. Mol Endocrinol 2015;29:411–420 [DOI] [PMC free article] [PubMed] [Google Scholar]
- 15.Blanchard PG, Moreira RJ, Castro É, et al. PPARγ is a major regulator of branched-chain amino acid blood levels and catabolism in white and brown adipose tissues. Metabolism 2018;89:27–38 [DOI] [PubMed] [Google Scholar]
- 16.Zhou M, Shao J, Wu C-Y, et al. Targeting BCAA catabolism to treat obesity-associated insulin resistance. Diabetes 2019;68:1730–1746 [DOI] [PMC free article] [PubMed] [Google Scholar]
- 17.Herman MA, She P, Peroni OD, Lynch CJ, Kahn BB. Adipose tissue branched chain amino acid (BCAA) metabolism modulates circulating BCAA levels. J Biol Chem 2010;285:11348–11356 [DOI] [PMC free article] [PubMed] [Google Scholar]
- 18.She P, Van Horn C, Reid T, Hutson SM, Cooney RN, Lynch CJ. Obesity-related elevations in plasma leucine are associated with alterations in enzymes involved in branched-chain amino acid metabolism. Am J Physiol Endocrinol Metab 2007;293:E1552–E1563 [DOI] [PMC free article] [PubMed] [Google Scholar]
- 19.Green CR, Wallace M, Divakaruni AS, et al. Branched-chain amino acid catabolism fuels adipocyte differentiation and lipogenesis. Nat Chem Biol 2016;12:15–21 [DOI] [PMC free article] [PubMed] [Google Scholar]
- 20.Crown SB, Marze N, Antoniewicz MR. Catabolism of branched chain amino acids contributes significantly to synthesis of odd-chain and even-chain fatty acids in 3T3-L1 adipocytes. PLoS One 2015;10:e0145850. [DOI] [PMC free article] [PubMed] [Google Scholar]
- 21.Avogaro A, Bier DM. Contribution of 3-hydroxyisobutyrate to the measurement of 3-hydroxybutyrate in human plasma: comparison of enzymatic and gas-liquid chromatography-mass spectrometry assays in normal and in diabetic subjects. J Lipid Res 1989;30:1811–1817 [PubMed] [Google Scholar]
- 22.Harris LLS, Smith GI, Patterson BW, et al. Alterations in 3-hydroxyisobutyrate and FGF21 metabolism are associated with protein ingestion-induced insulin resistance. Diabetes 2017;66:1871–1878 [DOI] [PMC free article] [PubMed] [Google Scholar]
- 23.Mardinoglu A, Gogg S, Lotta LA, et al. Elevated plasma levels of 3-hydroxyisobutyric acid are associated with incident type 2 diabetes. EBioMedicine 2018;27:151–155 [DOI] [PMC free article] [PubMed] [Google Scholar]
- 24.Andersson-Hall U, Gustavsson C, Pedersen A, Malmodin D, Joelsson L, Holmäng A. Higher concentrations of BCAAs and 3-HIB are associated with insulin resistance in the transition from gestational diabetes to type 2 diabetes. J Diabetes Res 2018;2018:4207067. [DOI] [PMC free article] [PubMed] [Google Scholar]
- 25.Haufe S, Engeli S, Kaminski J, et al. Branched-chain amino acid catabolism rather than amino acids plasma concentrations is associated with diet-induced changes in insulin resistance in overweight to obese individuals. Nutr Metab Cardiovasc Dis 2017;27:858–864 [DOI] [PubMed] [Google Scholar]
- 26.Letto J, Brosnan ME, Brosnan JT. Valine metabolism. Gluconeogenesis from 3-hydroxyisobutyrate. Biochem J 1986;240:909–912 [DOI] [PMC free article] [PubMed] [Google Scholar]
- 27.Kedishvili NY, Popov KM, Jaskiewicz JA, Harris RA. Coordinated expression of valine catabolic enzymes during adipogenesis: analysis of activity, mRNA, protein levels, and metabolic consequences. Arch Biochem Biophys 1994;315:317–322 [DOI] [PubMed] [Google Scholar]
- 28.Jang C, Oh SF, Wada S, et al. A branched-chain amino acid metabolite drives vascular fatty acid transport and causes insulin resistance. Nat Med 2016;22:421–426 [DOI] [PMC free article] [PubMed] [Google Scholar]
- 29.Lyon ES, Rivera ME, Johnson MA, Sunderland KL, Vaughan RA. Actions of chronic physiological 3-hydroxyisobuterate treatment on mitochondrial metabolism and insulin signaling in myotubes. Nutr Res 2019;66:22–31 [DOI] [PubMed] [Google Scholar]
- 30.Hu H, Jaskiewicz JA, Harris RA. Ethanol and oleate inhibition of α-ketoisovalerate and 3-hydroxyisobutyrate metabolism by isolated hepatocytes. Arch Biochem Biophys 1992;299:57–62 [DOI] [PubMed] [Google Scholar]
- 31.Vikse BE, Vollset SE, Tell GS, Refsum H, Iversen BM. Distribution and determinants of serum creatinine in the general population: the Hordaland Health Study. Scand J Clin Lab Invest 2004;64:709–722 [DOI] [PubMed] [Google Scholar]
- 32.Refsum H, Nurk E, Smith AD, et al. The Hordaland Homocysteine Study: a community-based study of homocysteine, its determinants, and associations with disease. J Nutr 2006;136(Suppl.):1731S–1740S [DOI] [PubMed] [Google Scholar]
- 33.Ejarque M, Borlaug M, Vilarrasa N, et al. Angiopoietin-like protein 8/betatrophin as a new determinant of type 2 diabetes remission after bariatric surgery. Transl Res 2017;184:35–44.e4 [DOI] [PubMed] [Google Scholar]
- 34.Gudbrandsen OA, Dankel SN, Skumsnes L, et al. Short-term effects of Vertical sleeve gastrectomy and Roux-en-Y gastric bypass on glucose homeostasis. Sci Rep 2019;9:14817. [DOI] [PMC free article] [PubMed] [Google Scholar]
- 35.Svensson P-A, Lindberg K, Hoffmann JM, et al. Characterization of brown adipose tissue in the human perirenal depot. Obesity (Silver Spring) 2014;22:1830–1837 [DOI] [PubMed] [Google Scholar]
- 36.Veum VL, Dankel SN, Gjerde J, et al. The nuclear receptors NUR77, NURR1 and NOR1 in obesity and during fat loss. Int J Obes 2012;36:1195–1202 [DOI] [PubMed] [Google Scholar]
- 37.Cypess AM, White AP, Vernochet C, et al. Anatomical localization, gene expression profiling and functional characterization of adult human neck brown fat. Nat Med 2013;19:635–639 [DOI] [PMC free article] [PubMed] [Google Scholar]
- 38.Dankel SN, Degerud EM, Borkowski K, et al. Weight cycling promotes fat gain and altered clock gene expression in adipose tissue in C57BL/6J mice. Am J Physiol Endocrinol Metab 2014;306:E210–E224 [DOI] [PubMed] [Google Scholar]
- 39.Midttun Ø, McCann A, Aarseth O, et al. Combined measurement of 6 fat-soluble vitamins and 26 water-soluble functional vitamin markers and amino acids in 50 μL of serum or plasma by high-throughput mass spectrometry. Anal Chem 2016;88:10427–10436 [DOI] [PubMed] [Google Scholar]
- 40.Wallace M, Green CR, Roberts LS, et al. Enzyme promiscuity drives branched-chain fatty acid synthesis in adipose tissues. Nat Chem Biol 2018;14:1021–1031 [DOI] [PMC free article] [PubMed] [Google Scholar]
- 41.Wang T, Si Y, Shirihai OS, et al. Respiration in adipocytes is inhibited by reactive oxygen species. Obesity (Silver Spring) 2010;18:1493–1502 [DOI] [PMC free article] [PubMed] [Google Scholar]
- 42.Blüher M, Michael MD, Peroni OD, et al. Adipose tissue selective insulin receptor knockout protects against obesity and obesity-related glucose intolerance. Dev Cell 2002;3:25–38 [DOI] [PubMed] [Google Scholar]
- 43.Nye C, Kim J, Kalhan SC, Hanson RW. Reassessing triglyceride synthesis in adipose tissue. Trends Endocrinol Metab 2008;19:356–361 [DOI] [PubMed] [Google Scholar]
- 44.Schöttl T, Kappler L, Fromme T, Klingenspor M. Limited OXPHOS capacity in white adipocytes is a hallmark of obesity in laboratory mice irrespective of the glucose tolerance status. Mol Metab 2015;4:631–642 [DOI] [PMC free article] [PubMed] [Google Scholar]
- 45.Miyazaki T, Honda A, Ikegami T, et al. Simultaneous quantification of salivary 3-hydroxybutyrate, 3-hydroxyisobutyrate, 3-hydroxy-3-methylbutyrate, and 2-hydroxybutyrate as possible markers of amino acid and fatty acid catabolic pathways by LC-ESI-MS/MS. Springerplus 2015;4:494. [DOI] [PMC free article] [PubMed] [Google Scholar]
- 46.Neinast MD, Jang C, Hui S, et al. Quantitative analysis of the whole-body metabolic fate of branched-chain amino acids. Cell Metab 2019;29:417–429.e4 [DOI] [PMC free article] [PubMed] [Google Scholar]
- 47.Newbern D, Gumus Balikcioglu P, Balikcioglu M, et al. Sex differences in biomarkers associated with insulin resistance in obese adolescents: metabolomic profiling and principal components analysis. J Clin Endocrinol Metab 2014;99:4730–4739 [DOI] [PMC free article] [PubMed] [Google Scholar]