

Abstract
Dysregulation of the neurotransmitter dopamine (DA) is implicated in several neuropsychiatric conditions. Multiple-cyclic square-wave voltammetry (MCSWV) is a state-of-the-art technique for measuring tonic DA levels with high sensitivity (<5 nM), selectivity, and spatiotemporal resolution. Currently, however, analysis of MCSWV data requires manual, qualitative adjustments of analysis parameters, which can inadvertently introduce bias. Here, we demonstrate the development of a computational technique using a statistical model for standardized, unbiased analysis of experimental MCSWV data for unbiased quantification of tonic DA. The oxidation current in the MCSWV signal was predicted to follow a lognormal distribution. The DA-related oxidation signal was inferred to be present in the top 5% of this analytical distribution and was used to predict a tonic DA level. The performance of this technique was compared against the previously used peak-based method on paired in vivo and post-calibration in vitro datasets. Analytical inference of DA signals derived from the predicted statistical model enabled high-fidelity conversion of the in vivo current signal to a concentration value via in vitro post-calibration. As a result, this technique demonstrated reliable and improved estimation of tonic DA levels in vivo compared to the conventional manual post-processing technique using the peak current signals. These results show that probabilistic inference-based voltammetry signal processing techniques can standardize the determination of tonic DA concentrations, enabling progress toward the development of MCSWV as a robust research and clinical tool.
Introduction
Quantification of neurotransmitters in the central nervous system has been of great interest for understanding normal neurobiology and neuropsychiatric disorders.1 Neurotransmitters are endogenous substances that act on extracellular postsynaptic receptors to generate functional changes in target cells. Therefore, it is crucial to understand changes in extracellular concentrations of these neurotransmitters to unravel the pathologic mechanisms of neurological disorders and to form an analytical biomarker-based treatment strategy. Dopamine (DA) is one such neurotransmitter that plays a critical role in the modulation of several functions, including motor control, motivation, cognition, reward-seeking behavior, and prolactin release.2−6 Transient phasic DA release occurs in response to behaviorally relevant stimuli against a background of relatively slow-changing tonic DA levels.7 There is an interplay between tonic DA levels and the intensity of phasic responses. Dysregulation of both phasic and tonic DA release has been associated with several neuropsychiatric conditions, such as Parkinson’s disease (PD), addiction, mania, obsessive-compulsive disorder, and schizophrenia.8−11
In vivo DA levels have been measured using microdialysis and voltammetry. In contrast to microdialysis in which analytes are extracted from extracellular fluid for offline analysis, voltammetric techniques allow the analyte to be measured in situ. Also, the size of voltammetry microsensors and rapid subsecond sampling greatly minimize tissue damage and allow for high spatial and temporal resolution. The ability to reliably measure DA using voltammetry and other electrochemical techniques has provided the groundwork for the translation of this technique to clinical applications.6,12−14 Despite these advantages, electrochemical techniques have previously been limited to the measurement of only phasic changes in analyte concentration. An electrochemical technique capable of measuring tonic concentrations has long been sought, and recent progress has been made toward realizing this goal.15−20
While technical developments have enabled estimation of tonic DA concentrations in the brain, signal interpretation techniques correlating the measured electrochemical signal to actual levels have yet to be standardized. In most electrochemical analyses, including both phasic and tonic DA concentration estimations, the target analyte is measured in vivo and then calibrated using in vitro standards by comparing peak oxidation currents.15,17,18 Electrochemical techniques can utilize either peak current and/or integration of oxidation currents for estimation of concentration.21 In the peak current method, the spread of oxidation current is not fully considered; therefore, information dimensionality inherent in the observed oxidation response is lost. When using the integration method, significantly more information is considered for concentration estimation, leading to higher sensitivity.22 However, the integration potential range must be manually set by the user, introducing potential bias in the resulting data.17,22
An objective and standardized analysis method is therefore critical to increase the reliability of tonic DA estimation. We recently developed a tonic DA measurement technique called multiple-cyclic square-wave voltammetry (MCSWV).15 MCSWV utilizes an integration method to process and evaluate the measured oxidation current. However, defining the limits of integration of the oxidation signals for final DA estimations remains subjective. Herein, we detail the development of a probabilistic post-processing method that uses analytical inference of DA signals based on a statistical model predicting the level of DA measured by MCSWV. Our goal is to improve precision for reliable quantification of tonic DA levels in vivo without bias by removing manually fixed analysis parameters.
Methods
MCSWV and In Vivo Experiments
Six Sprague–Dawley rats weighing 250–350 g were used for in vivo tonic DA recordings and evaluation of the signal processing method proposed herein. NIH guidelines were followed for all animal care, and the Mayo Clinic Institutional Animal Care and Use Committee approved the experimental procedures. Briefly, the rats were anesthetized with urethane (1.5 g/kg i.p.), placed into a stereotaxic frame (David Kopf), and then implanted with a stimulation electrode (Plastic One, MS303/2, Roanoke, VA) and carbon-fiber microelectrode15 in the medial forebrain bundle (MFB; AP: −4.6, ML: +1.3, DV: −8) and dorsomedial striatum (AP: +1.2, ML: +2.0, DV: −4.5), respectively.23 An in-house-built electrometer (WINCS Harmoni) was used to determine the optimal placement of the carbon-fiber electrode via MFB electrical stimulation during the application of conventional fast-scan cyclic voltammetry.24 Upon successful placement of both electrodes, recordings were switched to the MCSWV (Figure 1) system using in-house software written in LabVIEW 2016 (National Instruments, Austin, TX) and a commercial electronic interface (NI USB-6363, National Instruments, Austin, TX) with a base-station PC.15,25 MCSWV recordings were then performed to measure tonic DA concentrations in the rat striatum at baseline and following pharmacological manipulation. MATLAB (MathWorks, Inc., Natick, MA) was used to process the data. All averaged values are presented as mean ± SEM. Additional details on in vivo experiments and carbon-fiber microelectrode fabrication are available in the Supporting Information.
Figure 1.

Multiple-cyclic square-wave voltammetry. (A) Schematic design of square waveform. (B) Multiple-cyclic square-wave tonic concentration measurements utilizing the properties of dopamine adsorption at the carbon-fiber microelectrode. (C) Left: peak current of dopamine at 1 μM at each cyclic square wave (CSW); middle: pseudo-color plot of the difference between CSW #2 and #5 for 1 μM of dopamine; right: MCSWV signal (i.e., integration of oxidation currents) correlates with tonic dopamine concentrations (50–1000 nM; n = 4 electrodes; quadratic fitting: R2 = 0.99). Reproduced from Oh et al.15 with permission from Elsevier.
Peak-Based Method
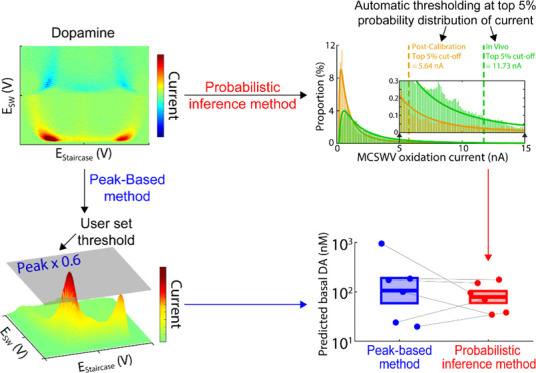
In the peak-based method, the peak oxidation current of MCSWV was used to estimate in vivo DA concentrations via post-calibration (in vitro) (Figure 2). A two-dimensional voltammogram15 resulting from DA oxidation was estimated to analyze the oxidation current derived from MCSWV in vivo recordings,. Then, a binary matrix (DA kernel; Figure 2B) was created as defined and detailed in our previous study.15 As in previous studies,26,27 the peak oxidation current value established the cutoff level used to generate a DA kernel and the subjective standard was set to 60% of the peak current value. Oxidation currents exceeding the cutoff level were assigned a logical 1 and currents lower than the cutoff level were assigned a logical 0 in the DA kernel, respectively. Then, DA oxidation current values (oxidation currents within the area of logical 1) were integrated to calculate the total faradic current derived from DA oxidation. This enabled us to estimate the tonic level of DA in vivo based on the post-calibration in vitro recordings. Additional details are available in the Supporting Information.
Figure 2.
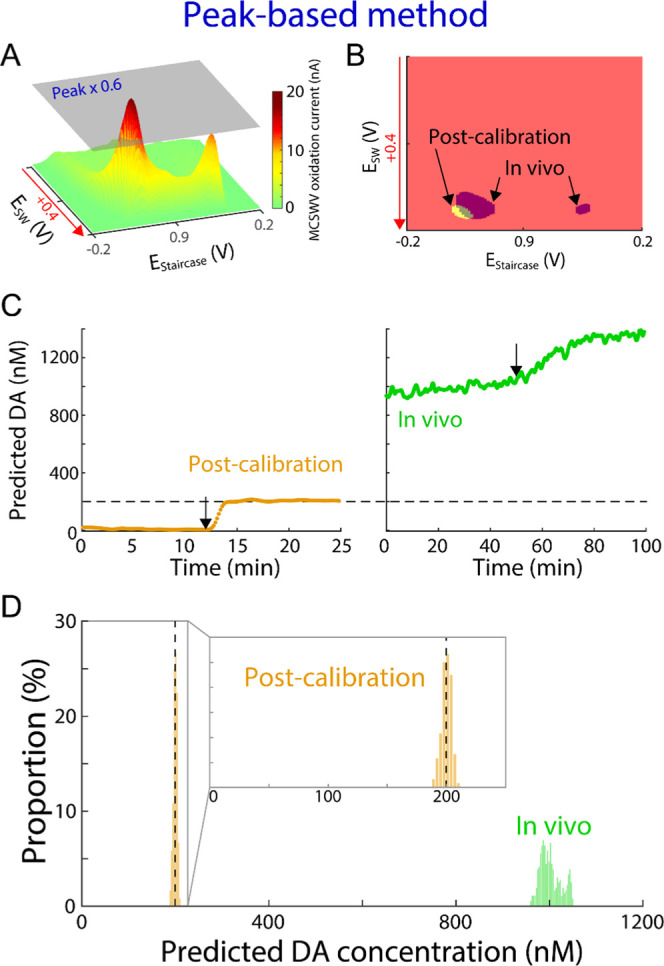
Processing DA kernel and prediction of DA levels by peak-based method. (A) Example of three-dimensional illustration of MCSWV oxidation currents with 200 nM of DA in vitro (i.e., post-calibration). (B) DA kernel for the representative in vitro post-calibration recording shown in (A) (yellow) and an in vivo recording (purple). (C) Example of DA concentration predictions using the peak-based method for the post-calibration (left, orange) and the in vivo recording (green, right). Arrows represent DA injection for post-calibration and nomifensine administration in vivo; the dashed line indicates injected DA concentration in post-calibration. (D) Distributions of the predicted DA concentrations during the first 40 min and the last 15 min for the in vivo and in vitro post-calibration recordings in (C), respectively. Inset: enlarged x-axis scale matching to Figure 4D.
Probabilistic Inference Method
This approach is analogous to the peak-based method in terms of implementing a cutoff level to produce a DA kernel. However, the cutoff level was instead determined and set by an automated and statistical method. The intensity distribution of the oxidation current for each MCSWV scan collected for the peak-based method was plotted to automatically determine the cutoff level of the MCSWV oxidation current in a nonsubjective manner (Figures 3 and 4A). A probability density function for a continuous random variable was predicted, which best describes the analytical distribution of oxidation currents. It was found that the lognormal probability distribution was the best fit for our experimental MCSWV data. The goodness of fit was conducted by a graphical method, quantile–quantile plot, and comparing the fitting results using lognormal versus γ distribution (details available in the Supporting Information). The threshold level of oxidation current, which would best quantify DA, was inferred from this analytical distribution. The significance level was set at the top 5th percentile from the analytical distribution as the less arbitrary standard to determine the cutoff level for generating the DA kernel (Figures 3 and 4B). This is motivated by the statistical model from the analytically estimated distribution of the observed MCSWV oxidation current and analogous to a one-sided statistical hypothesis with a 5% significance level28 (details available in the Supporting Information).
Figure 3.
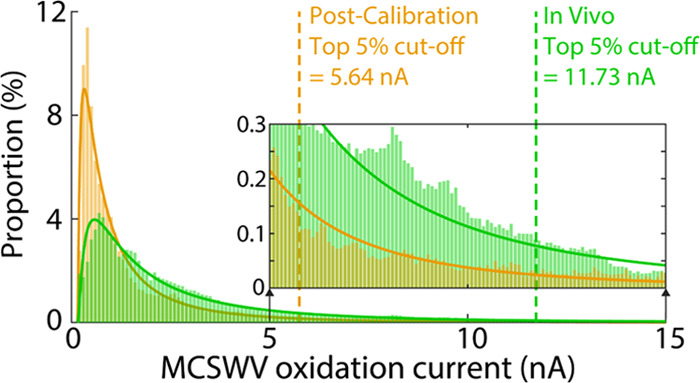
Distributions of MCSWV oxidation currents for the recordings shown in Figure 2D. Analytical lognormal distribution is shown in the respective curves. The vertical dashed line indicates the top 5th percentile of the respective analytical distribution—the cutoff level to separate the DA signal (i.e., higher than the cutoff) and non-DA signal (i.e., lower than the cutoff) in the post-calibration in vitro (orange) and in vivo (green), respectively.
Figure 4.
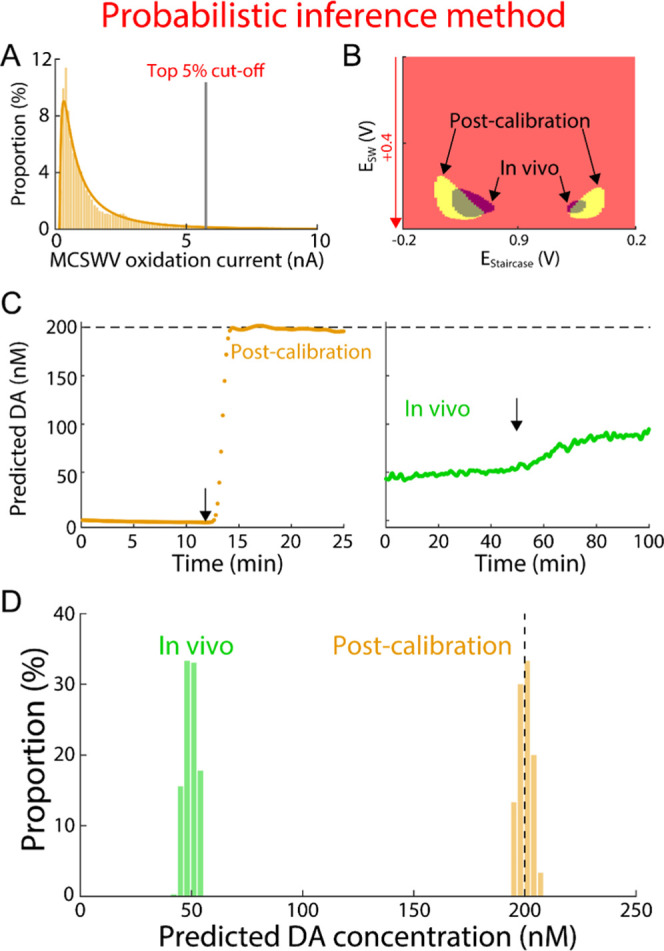
Processing DA kernel and prediction by probabilistic inference method. (A) Example of distribution of MCSWV oxidation currents with 200 nM DA in vitro using the same data shown in Figure 2A. DA kernel was determined using the methods proposed in this study: thresholding by the top 5th percentile from the analytical distribution (gray line). (B) DA kernels for the representative in vitro post-calibration recordings are shown in (A) (yellow) and the in vivo recording (green). (C) Example of DA concentration predictions using the method in (A) and (B) for the post-calibration (left, orange) and the in vivo recording (green, right). Arrow represents DA injection for post-calibration and nomifensine administration in vivo; the dashed line indicates injected DA concentration in post-calibration. (D) Distributions of the predicted DA concentrations during the first 40 min and the last 15 min for the in vivo and in vitro post-calibration recordings in (C), respectively.
Estimation of DA Concentrations
To estimate in vivo DA concentrations, a generalized linear model (GLM; implemented using “fitglm” function in Matlab)29−31 was proposed to predict DA concentrations for an MCSWV scan data. First, a “training” dataset consisting of in vitro post-calibrations recording was collected. This dataset was then used to find maximum likelihood estimators of the parameters of the GLM. For these parameters, we then predicted unknown DA levels from a “test” dataset (either in vitro testing or in vivo testing). The in vitro dataset was used to compare model performance via fivefold cross-validation.30,32 The in vivo dataset was used to predict the unknown DA concentrations of interest. MCSWV scans of the training dataset were collected in vitro (0–1000 nM of DA).15 We have previously observed that the relation between charge-DA levels is best predicted by a quadratic regression. The integration of the oxidation currents, which overlapped with the predetermined binary DA kernel (i.e., total faradic current derived from DA oxidation), was then computed. In individual animals, the integrated oxidation currents were normalized according to the area of the DA kernel. In the GLM, thereafter, the integrated values of the oxidation currents with 0 and 200 nM DA concentrations were linked to the training dataset. For this linking/regression procedure (i.e., link function of GLM or model option of fitglm function in Matlab), we used the quadratic function that fits MCSWV responses to 50–1000 nM DA (Figure 1C). The resultant linking information (link function or quadratic regression model) of the GLM, determined by the in vitro training dataset, allowed a prediction of DA concentrations in the test dataset collected with in vitro post-calibration and in vivo recordings. Additional details are available in the Supporting Information.
Results and Discussion
General Principles of MCSWV
MCSWV exploits the adsorption equilibrium of DA on the surface of the carbon-fiber microelectrode to determine tonic concentrations.15,33 MCSWV parameters have been optimized to enhance sensitivity and selectivity to DA as determined empirically with in vitro experiments. Briefly, MCSWV consists of five cyclic square waveforms, each consisting of square-wave oscillations superimposed on a symmetric staircase waveform (Figure 1A,B). These waveforms are applied every 10 s (Figure 1B). When DA adsorption reaches equilibrium, multiple voltage waveforms are applied in quick succession. Dynamic DA oxidation and reduction take place with each waveform, and the amount of oxidizable DA available to each subsequent waveform is decreased (Figure 1C). This is due to the relatively rapid depletion of DA adsorbed on the surface, relatively slower depletion of DA in the diffusion compact layer immediately adjacent to the surface, and repulsion and diffusion of the positively charged DA oxidation product (dopamine-o-quinone) away from the carbon-fiber microelectrode as voltage continues to increase after the DA oxidation potential is reached.34 The extent of decrease in oxidation signal with the series of voltage waveforms correlates with the DA concentration in the medium.12,15 A rest period (10 s) after the application of each cycle of multiple waveforms allows time for re-establishment of the DA adsorption equilibrium (Figure 1B).17Figure 1C (middle) shows an MCSWV pseudo-color plot. The DA oxidation peaks are visualized in red, while the reduction peaks are seen in blue. Of these four oxidation–reduction peaks, the signal with the highest oxidation peak was deemed most sensitive for detecting DA concentration (Figure 2A) and, therefore, the high values of DA oxidation current were used to estimate the DA level.
Peak-Based Estimation of MCSWV Signal
To determine DA concentrations, the peak-based method was used earlier for the post-processing of MCSWV data. In this method, 60% value of the peak oxidation current from post-calibration recordings and in vivo (gray plane in Figure 2A, a representative example for in vitro with 200 nM of DA) were used, respectively, as the threshold to generate DA kernels (Figure 2B).15 The oxidation current within this DA kernel (Figure 2B) was summated to determine the DA concentration in vivo from the post-calibration in vitro data. Then, the GLM29 was used to estimate the DA concentrations by linking the in vitro MCSWV dataset recorded with the known DA concentration (i.e., 0 and 200 nM), to the dataset to be predicted with the unknown DA concentration (details in the Methods section). As depicted in Figure 2B, the size and shape of the DA kernel in vivo appear different from the DA kernel in vitro. This is because the peak oxidation potential and overall oxidation patterns for in vitro and in vivo recordings are different. The in vitro DA kernel is relatively compact compared to the in vivo DA kernel because of a sharper DA oxidation current peak in the former (Figure 2D). The peak-based method does not consider the shape and kurtosis of the DA response recorded by MCSWV and, therefore, appears to result in a higher error in in vivo DA estimation. In Figure 2C,D, estimations of DA concentration using the peak-based method are shown for a representative in vivo and in vitro post-calibration dataset. The values of each oxidation current within the DA kernels in Figure 2B were integrated and predicted the in vivo concentration based on the GLM trained by the in vitro 200 nM DA. The in vivo recordings utilizing the peak-based method estimated the tonic level of DA in the striatum of anesthetized rat to be approximately 1000 nM for this animal, which is 9- to 25-fold higher than previous reports.15,16,18,19
Analytical Distribution of MCSWV Signal
To systematically determine an oxidation current cutoff for generating DA kernels, the analytical distribution of the oxidation current in the MCSWV pseudo-color plot was used for less subjective post-processing of MCSWV data. A probability density function modeling the distribution of the oxidation current was determined and used to predict the DA concentration for the same dataset shown in Figure 2. The intensity distribution of MCSWV pseudo-color plot was observed to approximate a lognormal distribution (Figures 3 and 4A; in vitro: n = 6 electrodes, R2 = 0.95 ± 0.01; in vivo: n = 6 rats, R2 = 0.93 ± 0.02; goodness-of-fit tests, P < 10–10 for each fitting; validation procedures are demonstrated in the Supporting Information). The top 5th percentile of each analytical distribution (in vivo and post-calibration in vitro) was chosen to generate the DA kernel and infer the concentration of DA (see also discussion of using top 1st and 10th percentiles in the Supporting Information). Here, the analytical distribution is presumed to be the distribution under the null hypothesis that there is no relationship with DA. Given the null distribution, if an oxidation value exists in the one-sided critical area greater than 5% significance level, that value is presumed to be significantly different from the null population and, thus, is identified as a threshold; it is analogous to a one-sided statistical test with 5% significance level.28 Accordingly, values above the threshold were classified as units of 1 in the binary DA kernel. The cutoff levels for the DA-related signal (i.e., top 5th percentiles for in vivo and for in vitro) are shown for a representative dataset in Figure 3. These cutoff values were then used to create the DA kernels for further data analysis to estimate tonic DA concentrations.
Probabilistic Inference Method
The data were further analyzed using the analytical distribution inferred for the distribution of MCSWV oxidation currents as shown in Figure 2. Each in vivo and post-calibration in vitro dataset was analyzed to create a new DA kernel based on the top 5th percentile cutoff of the analytical distribution (Figure 4A). Increased similarity in the shape and size of the in vivo and post-calibration in vitro DA kernels was observed in the new DA kernels (Figure 4B) compared to those obtained using the previous peak-based method (Figure 2B). This is because the probabilistic inference method considers the shape of oxidation response, which can be different between in vivo and post-calibration in vitro. Therefore, this could potentially reduce the error in estimations of in vivo tonic DA concentrations from a post-calibration performed in a different environment (i.e., in vivo). Estimated DA concentration using the new DA kernels showed significantly reduced values by a factor of 12 for in vivo measurements for the representative dataset (49.7 ± 0.1 nM, mean ± SEM; Figure 4D), compared to the peak-based analysis (1002.2 ± 2.0 nM, mean ± SEM; Figure 2D). This indicates the possibility of an overestimation of tonic DA with the peak-based method. In addition, the variability of measured tonic DA concentration in vivo over a given period is reduced by a factor of 5, mainly as a result of generating a much sharper peak in the distribution of tonic DA (Figure 4D) compared to that with the peak-based method (Figure 2D). We have thus developed an automatic and robust method for MCSWV data post-processing based on the analytical distribution of the oxidation currents in the MCSWV pseudo-color plot.
Increased Precision for In Vivo Tonic Dopamine-Level Estimation
The reliability of DA concentration estimation using the probabilistic inference method was compared to the peak-based method. Figure 5A compares the variance of the predicted values of MCSWV responses to 200 nM of DA over 15 min for the post-calibration in vitro data shown in Figure 4D versus Figure 2D (n = 6 electrodes). The coefficient of variation (CV), a statistical assessment of the level of dispersion around the mean, was computed in each post-calibration in vitro dataset for both methods. In both cases, the CV was relatively small among samples. This is not surprising given the stable beaker environment and lack of other electroactive interferents. The variance for the probabilistic inference method (CV: 1.6 ± 0.2%, mean ± SEM), compared to the variance of the peak-based method (CV: 1.6 ± 0.4%), was significantly smaller in four animals (Bartlett’s test, P < 0.05 for four rats; P = 0.43 and 0.52 for two rats), demonstrating increased precision for DA recordings in vitro.
Figure 5.
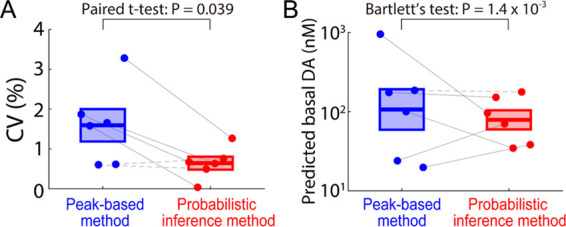
Comparison of the two methods. (A) Coefficient of variation (CV) in the predicted DA concentrations for the in vitro post-calibration (n = 6 electrodes; mean in vertical bar ± SEM in box; peak-based method: 1.6 ± 0.4%; probabilistic inference method: 0.4 ± 0.1% peak-based versus probabilistic inference, paired t-test, t5 = 2.77, P = 0.039). Four solid lines indicate significantly lower variance within an in vitro session in the probabilistic inference method compared to the peak-based method (Bartlett’s test, P < 0.05). (B) Comparison of the predicted tonic DA concentrations in vivo (n = 6 rats). Variance of predicted tonic DA across rats was significantly lower in the probabilistic inference method compared to the peak-based method (Bartlett’s test, χ2 = 10.14, P = 1.4 × 10⁻³; mean in vertical bar ± SEM in box at log10 scale). Five solid lines indicate significantly lower variance within an in vivo session in the probabilistic inference method compared to the peak-based method (Bartlett’s test, P < 0.05).
Next, it was sought to determine if the probabilistic inference method reduces variance across animals in the prediction of in vivo tonic DA concentrations over a 40 min period shown in Figure 4D versus Figure 2D (Figure 5B, n = 6 rats). The predicted tonic DA levels in the striatum of anesthetized rats were estimated to be 252.4 ± 142.8 nM with the peak-based method and 94.7 ± 24.1 nM with the probabilistic inference method. The two methods were not found to be significantly different in the mean value of tonic DA levels (paired t-test, t5 = 1.12, P = 0.31), and the tonic values are in line with previous work by Oh et al.,15Atcherley et al.,16 and Barath et al.25 However, the probabilistic inference method demonstrated significantly reduced variance in the tonic DA level prediction across animals (Bartlett’s test, χ2 = 10.14, P = 1.4 × 10⁻³). This finding indicates that the probabilistic inference method is a more precise and reliable method for determining in vivo tonic DA concentrations.
This increased precision, automation, and probabilistic quantification is important not only for research purposes but also for clinical applications.35 Neurotransmitter concentrations, especially DA, are thought to be correlated with and involved in the mechanisms of various neuropsychiatric conditions like PD.36 Deep brain stimulation (DBS) for PD may act by altering the level of DA, which can, in turn, be used as a biomarker for closed-loop feedback.37 For a robust closed-loop DBS system, it is imperative to have a reliable technique for objective quantification of the neurotransmitters to be used as biomarkers. Recently, invasive neurotransmitter measurements have been performed in the human brain using voltammetry techniques in the setting of DBS neurosurgical procedures.6 This allows an excellent opportunity to investigate the role of these neurotransmitters in learning, reward, motivation, and valance states of individuals in addition to the disease process.38 However, so far, only phasic measurements have been performed with little progress on tonic levels.6,39 Thus, MCSWV and the data processing technique described in this study can aid in advancing the field of human tonic voltammetry.
Conclusions
MCSWV is a state-of-the-art technique permitting measurement of tonic extracellular DA levels with high spatiotemporal resolution. Although MCSWV is advanced for quantifying tonic DA levels in vivo, the post-analysis process was susceptible to DA kernel and other variables. We have developed a novel signal analysis technique that uses modeling of analytical distribution and probabilistic inference for high-fidelity estimation of tonic dopamine concentrations. Importantly, we have demonstrated the ability of this technique for reliable and robust tonic dopamine quantification in vitro and in vivo with improved precision. Further development (e.g., improving calibration accuracy) will likely make the technique more feasible for future applications. This technique advances the electrochemical measurement of tonic extracellular dopamine levels, bringing it closer to future applications, i.e., applying it to improve understanding of the tonic DA role in neurological and psychiatric disorders, as well as utilizing tonic DA levels as biomarkers for closed-loop deep brain stimulation.
Acknowledgments
This research was supported by the NIH (R01NS112176), Minnesota Partnership for Biotechnology and Medical Genomics (MNP #19.13), the National Research Foundation of Korea (2017R1A2B2006896), the Grainger Foundation, the Basic Science Research Program through the National Research Foundation of Korea (2018R1A6A3A03013031 to J.K.), Boston Scientific Fellowship Grant (A.S.B.), and the NIH (F31NS115202-01A1, R25GM055252-23, TL1TR002380-03, T32GM065841-17 to A.E.R.).
Supporting Information Available
The Supporting Information is available free of charge at https://pubs.acs.org/doi/10.1021/acsomega.0c05217.
Electrode fabrication; biological experiments protocol; post-calibration in vitro recordings; DA kernel method; validation of theoretical distribution; generalized linear model; testing cutoff levels generating DA kernel; sample data and source code are available upon request (PDF)
The authors declare no competing financial interest.
Supplementary Material
References
- Goto Y.; Otani S.; Grace A. A. The Yin and Yang of dopamine release: a new perspective. Neuropharmacology 2007, 53, 583–587. 10.1016/j.neuropharm.2007.07.007. [DOI] [PMC free article] [PubMed] [Google Scholar]
- Salamone J. D. Complex motor and sensorimotor functions of striatal and accumbens dopamine: involvement in instrumental behavior processes. Psychopharmacology 1992, 107, 160–174. 10.1007/BF02245133. [DOI] [PubMed] [Google Scholar]
- Collins A. L.; Aitken T. J.; Greenfield V. Y.; Ostlund S. B.; Wassum K. M. Nucleus accumbens acetylcholine receptors modulate dopamine and motivation. Neuropsychopharmacology 2016, 41, 2830–2838. 10.1038/npp.2016.81. [DOI] [PMC free article] [PubMed] [Google Scholar]
- Radke A. K.; Kocharian A.; Covey D. P.; Lovinger D. M.; Cheer J. F.; Mateo Y.; Holmes A. Contributions of nucleus accumbens dopamine to cognitive flexibility. Eur. J. Neurosci. 2019, 50, 2023–2035. 10.1111/ejn.14152. [DOI] [PMC free article] [PubMed] [Google Scholar]
- Caron M.; Beaulieu M.; Raymond V.; Gagne B.; Drouin J.; Lefkowitz R.; Labrie F. Dopaminergic receptors in the anterior pituitary gland. Correlation of [3H] dihydroergocryptine binding with the dopaminergic control of prolactin release. J. Biol. Chem. 1978, 253, 2244–2253. 10.1016/S0021-9258(17)38065-1. [DOI] [PubMed] [Google Scholar]
- Kishida K. T.; Saez I.; Lohrenz T.; Witcher M. R.; Laxton A. W.; Tatter S. B.; White J. P.; Ellis T. L.; Phillips P. E.; Montague P. R. Subsecond dopamine fluctuations in human striatum encode superposed error signals about actual and counterfactual reward. Proc. Natl. Acad. Sci. U.S.A. 2016, 113, 200–205. 10.1073/pnas.1513619112. [DOI] [PMC free article] [PubMed] [Google Scholar]
- Grace A. A. Phasic versus tonic dopamine release and the modulation of dopamine system responsivity: a hypothesis for the etiology of schizophrenia. Neuroscience 1991, 41, 1–24. 10.1016/0306-4522(91)90196-U. [DOI] [PubMed] [Google Scholar]
- Volkow N. D.; Fowler J. S.; Wang G. J.; Swanson J. M.; Telang F. Dopamine in drug abuse and addiction: results of imaging studies and treatment implications. Arch. Neurol. 2007, 64, 1575–1579. 10.1001/archneur.64.11.1575. [DOI] [PubMed] [Google Scholar]
- Silverstone T. Dopamine in manic depressive illness. A pharmacological synthesis. J. Affect. Disord. 1985, 8, 225–231. 10.1016/0165-0327(85)90020-5. [DOI] [PubMed] [Google Scholar]
- Koo M. S.; Kim E. J.; Roh D.; Kim C. H. Role of dopamine in the pathophysiology and treatment of obsessive-compulsive disorder. Expert Rev. Neurother. 2010, 10, 275–290. 10.1586/ern.09.148. [DOI] [PubMed] [Google Scholar]
- Davis K. L.; Kahn R. S.; Ko G.; Davidson M. Dopamine in schizophrenia: a review and reconceptualization. Am. J. Psychiatry 1991, 148, 1474–1486. 10.1176/ajp.148.11.1474. [DOI] [PubMed] [Google Scholar]
- Kim D. H.; Oh Y.; Shin H.; Park C.; Blaha C. D.; Bennet K. E.; Kim I. Y.; Lee K. H.; Jang D. P. Multi-waveform fast-scan cyclic voltammetry mapping of adsorption/desorption kinetics of biogenic amines and their metabolites. Anal. Methods 2018, 10, 2834–2843. 10.1039/C8AY00352A. [DOI] [PMC free article] [PubMed] [Google Scholar]
- Shin H.; Lee S. Y.; Cho H. U.; Oh Y.; Kim I. Y.; Lee K. H.; Jang D. P.; Min H. K. Fornix Stimulation Induces Metabolic Activity and Dopaminergic Response in the Nucleus Accumbens. Front. Neurosci. 2019, 13, 1109 10.3389/fnins.2019.01109. [DOI] [PMC free article] [PubMed] [Google Scholar]
- Oh Y.; Park C.; Kim D. H.; Shin H.; Kang Y. M.; DeWaele M.; Lee J.; Min H. K.; Blaha C. D.; Bennet K. E.; Kim I. Y.; Lee K. H.; Jang D. P. Monitoring In Vivo Changes in Tonic Extracellular Dopamine Level by Charge-Balancing Multiple Waveform Fast-Scan Cyclic Voltammetry. Anal. Chem. 2016, 88, 10962–10970. 10.1021/acs.analchem.6b02605. [DOI] [PubMed] [Google Scholar]
- Oh Y.; Heien M. L.; Park C.; Kang Y. M.; Kim J.; Boschen S. L.; Shin H.; Cho H. U.; Blaha C. D.; Bennet K. E.; Lee H. K.; Jung S. J.; Kim I. Y.; Lee K. H.; Jang D. P. Tracking tonic dopamine levels in vivo using multiple cyclic square wave voltammetry. Biosens. Bioelectron. 2018, 121, 174–182. 10.1016/j.bios.2018.08.034. [DOI] [PMC free article] [PubMed] [Google Scholar]
- Atcherley C. W.; Wood K. M.; Parent K. L.; Hashemi P.; Heien M. L. The coaction of tonic and phasic dopamine dynamics. Chem. Commun. 2015, 51, 2235–2238. 10.1039/C4CC06165A. [DOI] [PMC free article] [PubMed] [Google Scholar]
- Atcherley C. W.; Laude N. D.; Parent K. L.; Heien M. L. Fast-scan controlled-adsorption voltammetry for the quantification of absolute concentrations and adsorption dynamics. Langmuir 2013, 29, 14885–14892. 10.1021/la402686s. [DOI] [PubMed] [Google Scholar]
- Johnson J. A.; Rodeberg N. T.; Wightman R. M. Measurement of basal neurotransmitter levels using convolution-based nonfaradaic current removal. Anal. Chem. 2018, 90, 7181–7189. 10.1021/acs.analchem.7b04682. [DOI] [PMC free article] [PubMed] [Google Scholar]
- Taylor I. M.; Patel N. A.; Freedman N. C.; Castagnola E.; Cui X. T. Direct in vivo electrochemical detection of resting dopamine using Poly (3, 4-ethylenedioxythiophene)/Carbon Nanotube functionalized microelectrodes. Anal. Chem. 2019, 91, 12917–12927. 10.1021/acs.analchem.9b02904. [DOI] [PMC free article] [PubMed] [Google Scholar]
- Rusheen A. E.; Gee T. A.; Jang D. P.; Blaha C. D.; Bennet K. E.; Lee K. H.; Heien M. L.; Oh Y. Evaluation of electrochemical methods for tonic dopamine detection in vivo. TrAC, Trends Anal. Chem. 2020, 132, 116049 10.1016/j.trac.2020.116049. [DOI] [PMC free article] [PubMed] [Google Scholar]
- Venton B. J.; Cao Q. Fundamentals of fast-scan cyclic voltammetry for dopamine detection. Analyst 2020, 145, 1158–1168. 10.1039/C9AN01586H. [DOI] [PMC free article] [PubMed] [Google Scholar]
- Espín L.; Asp A. J.; Trevathan J. K.; Ludwig K. A.; Lujan J. L.. Integral methods for automatic quantification of fast-scan-cyclic-voltammetry detected neurotransmitters. bioRxiv, 2020. 10.1101/2020.04.24.060368. [DOI] [PMC free article] [PubMed]
- Paxinos G.; Watson C.. The Rat Brain in Stereotaxic Coordinates: Hard Cover Edition; Elsevier, 2006. [Google Scholar]
- Lee K. H.; Lujan J. L.; Trevathan J. K.; Ross E. K.; Bartoletta J. J.; Park H. O.; Paek S. B.; Nicolai E. N.; Lee J. H.; Min H.-K.; et al. WINCS Harmoni: Closed-loop dynamic neurochemical control of therapeutic interventions. Sci. Rep. 2017, 7, 46675 10.1038/srep46675. [DOI] [PMC free article] [PubMed] [Google Scholar]
- Barath A. S.; Rusheen A. E.; Rojas Cabrera J. M.; Price J. B.; Owen R. L.; Shin H.; Jang D. P.; Blaha C. D.; Lee K. H.; Oh Y. Hypoxia-Associated Changes in Striatal Tonic Dopamine Release: Real-Time in vivo Measurements With a Novel Voltammetry Technique. Front. Neurosci. 2020, 14, 869 10.3389/fnins.2020.00869. [DOI] [PMC free article] [PubMed] [Google Scholar]
- Park C.; Oh Y.; Shin H.; Kim J.; Kang Y.; Sim J.; Cho H. U.; Lee H. K.; Jung S. J.; Blaha C. D.; et al. Fast cyclic square-wave voltammetry to enhance neurotransmitter selectivity and sensitivity. Anal. Chem. 2018, 90, 13348–13355. 10.1021/acs.analchem.8b02920. [DOI] [PubMed] [Google Scholar]
- Shin H.; Oh Y.; Park C.; Kang Y.; Cho H. U.; Blaha C. D.; Bennet K. E.; Heien M. L.; Kim I. Y.; Lee K. H.; et al. Sensitive and Selective Measurement of Serotonin in Vivo Using Fast Cyclic Square-Wave Voltammetry. Anal. Chem. 2020, 92, 774–781. 10.1021/acs.analchem.9b03164. [DOI] [PMC free article] [PubMed] [Google Scholar]
- Fisher R. A.Statistical Methods for Research Workers. In Breakthroughs in Statistics; Springer, 1992; pp 66–70. [Google Scholar]
- Nelder J. A.; Wedderburn R. W. Generalized linear models. J. R. Stat. Soc.: Ser. A 1972, 135, 370–384. 10.2307/2344614. [DOI] [Google Scholar]
- Chong E.; Moroni M.; Wilson C.; Shoham S.; Panzeri S.; Rinberg D. Manipulating synthetic optogenetic odors reveals the coding logic of olfactory perception. Science 2020, 368, aba2357 10.1126/science.aba2357. [DOI] [PMC free article] [PubMed] [Google Scholar]
- Das A.; Fiete I. R. Systematic errors in connectivity inferred from activity in strongly recurrent networks. Nat. Neurosci. 2020, 23, 1286–1296. 10.1038/s41593-020-0699-2. [DOI] [PubMed] [Google Scholar]
- Xu Y.; Goodacre R. On splitting training and validation set: A comparative study of cross-validation, bootstrap and systematic sampling for estimating the generalization performance of supervised learning. J. Anal. Test. 2018, 2, 249–262. 10.1007/s41664-018-0068-2. [DOI] [PMC free article] [PubMed] [Google Scholar]
- Heien M. L.; Phillips P. E.; Stuber G. D.; Seipel A. T.; Wightman R. M. Overoxidation of carbon-fiber microelectrodes enhances dopamine adsorption and increases sensitivity. Analyst 2003, 128, 1413–1419. 10.1039/b307024g. [DOI] [PubMed] [Google Scholar]
- Dengler A. K.; McCarty G. S. Microfabricated microelectrode sensor for measuring background and slowly changing dopamine concentrations. J. Electroanal. Chem. 2013, 693, 28–33. 10.1016/j.jelechem.2013.01.022. [DOI] [PMC free article] [PubMed] [Google Scholar]
- Price J. B.; Rusheen A. E.; Barath A. S.; Cabrera J. M. R.; Shin H.; Chang S.-Y.; Kimble C. J.; Bennet K. E.; Blaha C. D.; Lee K. H.; et al. Clinical applications of neurochemical and electrophysiological measurements for closed-loop neurostimulation. Neurosurg. Focus 2020, 49, E6 10.3171/2020.4.FOCUS20167. [DOI] [PMC free article] [PubMed] [Google Scholar]
- Hornykiewicz O.The Discovery of Dopamine Deficiency in the Parkinsonian Brain. In Parkinson’s Disease and Related Disorders; Springer, 2006; pp 9–15. [DOI] [PubMed] [Google Scholar]
- Lee K. H.; Blaha C. D.; Harris B. T.; Cooper S.; Hitti F. L.; Leiter J. C.; Roberts D. W.; Kim U. Dopamine efflux in the rat striatum evoked by electrical stimulation of the subthalamic nucleus: potential mechanism of action in Parkinson’s disease. Eur. J. Neurosci. 2006, 23, 1005–1014. 10.1111/j.1460-9568.2006.04638.x. [DOI] [PubMed] [Google Scholar]
- Bang D.; Kishida K. T.; Lohrenz T.; White J. P.; Laxton A. W.; Tatter S. B.; Fleming S. M.; Montague P. R. Sub-second Dopamine and Serotonin Signaling in Human Striatum during Perceptual Decision-Making. Neuron 2020, 108, 999–1010. 10.1016/j.neuron.2020.09.015. [DOI] [PMC free article] [PubMed] [Google Scholar]
- Chang S.-Y.; Kim I.; Marsh M. P.; Jang D. P.; Hwang S.-C.; Van Gompel J. J.; Goerss S. J.; Kimble C. J.; Bennet K. E.; Garris P. A. Wireless Fast-Scan Cyclic Voltammetry to Monitor Adenosine in Patients with Essential Tremor During Deep Brain Stimulation. Mayo Clin. Proc. 2012, 87, 760–765. 10.1016/j.mayocp.2012.05.006. [DOI] [PMC free article] [PubMed] [Google Scholar]
Associated Data
This section collects any data citations, data availability statements, or supplementary materials included in this article.