Abstract
We conducted genome-wide association analyses in over 250,000 participants of European and African ancestry from the Million Veteran Program using electronic health record-validated posttraumatic stress disorder (PTSD) diagnosis and quantitative symptom phenotypes. Applying genome-wide multiple testing correction, we identified three significant loci in European case-control analyses and 15 loci in quantitative symptom analyses. Genomic structural equation modeling indicated tight coherence of a PTSD symptom factor that shares genetic variance with a distinct internalizing (mood-anxiety-neuroticism) factor. Partitioned heritability indicated enrichment in several cortical and subcortical regions, and imputed genetically regulated gene expression in these regions was used to identify potential drug repositioning candidates. These results validate the biological coherence of the PTSD syndrome, inform its relationship to comorbid anxiety and depressive disorders, and provide new considerations for treatment.
Posttraumatic stress disorder (PTSD) is a serious mental disorder that can occur after exposure to extreme, life-threatening stress1,2. Although 50–85% of Americans experience traumatic events over a lifetime, most do not develop PTSD – lifetime PTSD prevalence is approximately 7%3, suggesting differential resilience to stress and vulnerability to the disorder4. There is a substantial heritable basis for PTSD risk5,6, and evidence from genome-wide association studies (GWAS) shows that PTSD, like other mental disorders7, is highly polygenic8–13. PTSD symptoms vary widely among individuals, and the current DSM-5 definition permits up to 163,120 unique conformations for assembly of the disorder14. Recognizing that this phenotypic heterogeneity may impede the detection of genetic risk factors15, alternate phenotypes or sub-phenotypes (e.g., re-experiencing – also known as intrusion – symptoms) that may reflect more biologically homogeneous entities have been examined16.
The use of biobanks with relatively large numbers of PTSD cases offers the opportunity to provide unprecedented sample size and, importantly, uniformity of phenotypic and genotypic platforms17. This investigation was conducted within the US Veterans Affairs Million Veteran Program (MVP)18 and included several PTSD phenotypic definitions: a validated, algorithmically-defined case-control definition using data from the electronic health record (EHR), which was subsequently meta-analyzed with the case-control PGC-PTSD GWAS13; and quantitative trait definitions encompassing PTSD subdomains based on recent self-reported symptoms: re-experiencing (in an expanded sample from that previously reported16), avoidance, hyperarousal, and a total index of recent symptom severity (PCL-Total). These analyses were conducted separately in veterans of European and African ancestry (and in trans-ancestral meta-analyses)19,20. Heritability of each of these phenotypes as well as phenotypic and genetic (rg) correlations were examined with the aim of determining coherence among them; rg with other behavioral and health-related traits was also examined. Results for the phenotype with the largest SNP heritability estimate were used to characterize PTSD genomic architecture with partitioned heritability and transcriptome-wide analyses21 to identify genes regulated in brain regions of greatest relevance. Genomic structural equation modeling was used to determine genetic relationships between PTSD and clinically comorbid phenotypes from the internalizing spectrum22: major depressive disorder, anxiety, and neuroticism.
Aims of these analyses are to provide: (i) a large, uniformly phenotyped GWAS of PTSD in military veterans; (ii) thorough exploration of sub-phenotypes; (iii) replication of key associations in other datasets; (iv) demonstration of the architecture of genetic association with other health-related phenotypes; (v) investigation of brain regions implicated, and; (vi) extension to possible drug targets. These aims were all accomplished with the overarching goal of deepening biological understanding to advance precision medicine for PTSD.
RESULTS
GWAS of algorithmically defined case-control PTSD.
We first performed GWAS of PTSD in American veterans of European (EUR) and African (AFR) ancestry, basing diagnosis on a validated VA EHR algorithm23 that had excellent discriminative ability for lifetime PTSD cases vs. controls as determined by chart review (0.90 sensitivity, 0.97 specificity, 0.87 positive predictive value, and 0.90 negative predictive value), and substantial agreement with gold-standard Clinician-Administered PTSD Scale (CAPS) interview (90.2% agreement and κ = 0.75 (95% CI: 0.62, 0.88))17. GWAS analyses were carried out (on two tranches of data genotyped on the same array platform at two different times) on SNP dosages imputed from 1000 Genomes Phase 3 using logistic regression for case-control traits and linear regression for continuous traits in PLINK 2.024, separately by ancestry, adjusting for age, sex, and the first 10 principal components of ancestry. Meta-analysis by tranche (and later by ancestral group) was performed using METAL25. Combat exposure information was available for only a subset (51.2%) of the sample (Supplementary Table 1), and GWAS of that subset yielded no genome-wide significant (GWS) findings (Supplementary Table 2 shows findings at P < 10−6). However, genetic correlation (rg) between the categorical trait (i.e., diagnosis of) PTSD in those combat-exposed and in all subjects irrespective of combat exposure status was 0.969 (s.e. 0.049, P = 7.64 × 10−89), and therefore results for the latter larger, more informative, sample are presented here.
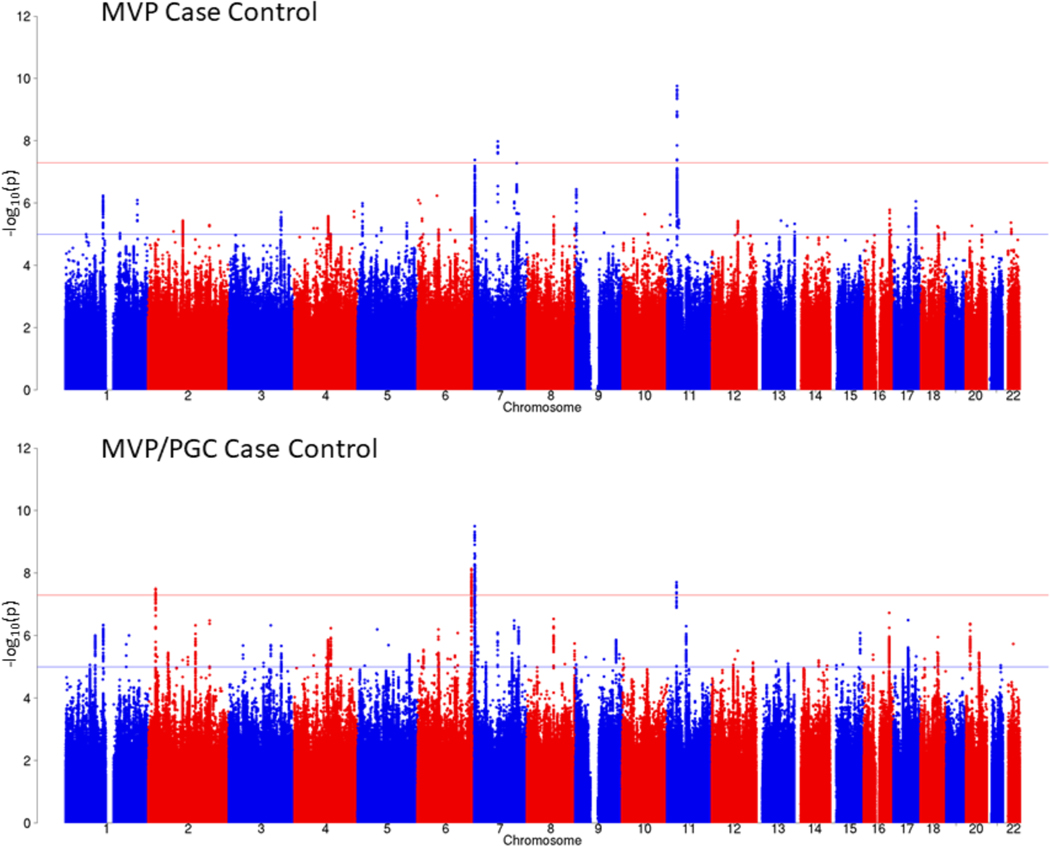
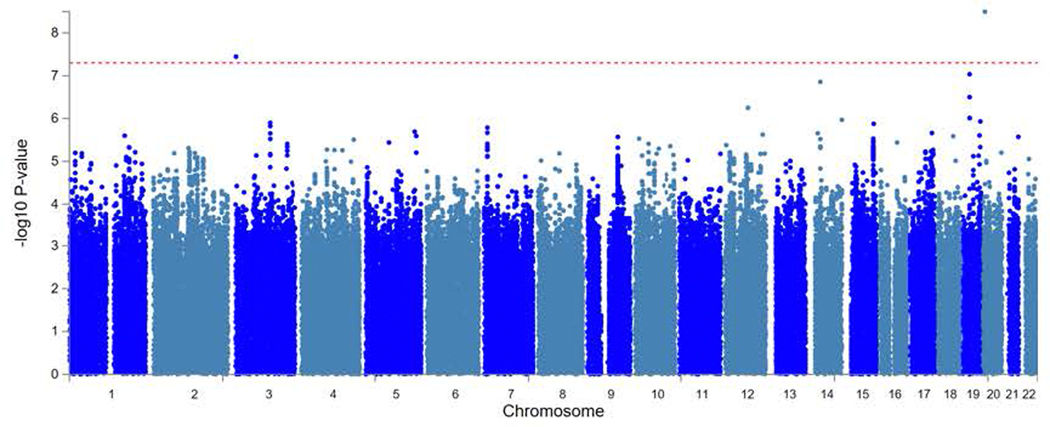
The PTSD case-control GWAS for the EUR sample included 36,301 algorithmically defined probable PTSD cases and 178,107 controls. Considering LD-independent loci (r2 > 0.1), we identified three distinct GWS (P < 5 × 10⁻⁸) genomic risk loci (Fig. 1 (top) and Supplementary Table 3a) on Chr11:28707675, rs10767744 (MAF = 0.39, P = 1.75 × 10⁻¹⁰), proximity mapped to METTL15; on Chr7:70219946, rs137999048 (MAF = 0.047, P = 1.03 × 10⁻⁸), proximity mapped to AUTS2; and on Chr7:1855531, rs7680 (MAF = 0.14, P = 4.17 × 10⁻⁸), proximity mapped to MAD1L1, respectively. Regional Manhattan plots for each region are presented in Supplementary Figure 1a–c.
Figure 1 |. Manhattan plot for the MVP case-control GWAS (top) and for the MVP/PGC GWAS meta-analysis in EUR samples (bottom).
GWAS was performed using logistic regression, co-varying for age, sex, and the first 10 principal components of ancestry. Meta-analysis was conducted with METAL25 using the inverse variance weighting method. Bonferroni correction was used to correct for multiple comparisons; associations with P ≤ 5 × 10⁻⁸ (indicated by the horizontal red bar) were considered to be genome-wide significant.
The GWAS for the AFR sample included 11,920 probable PTSD cases and 39,116 controls (Extended Data Fig. 1 and Supplementary Table 3b) and identified two distinct GWS loci, one on Chr3:1259951, rs4684090 (MAF = 0.04, P = 3.59 × 10⁻⁸) intronic to CNTN6, and one on Chr20:6724577, rs112149412 (MAF = 0.02, P = 3.19 × 10⁻⁹) near BMP2. GWAS for the 48,221 cases and 217,223 controls in the trans-ancestral analysis (meta-analysis of EUR and AFR samples) (Supplementary Table 3c) identified as GWS SNPs in two of the same regions found GWS in the EUR GWAS: a different lead SNP on Chr7:1959634 (rs137944087, an indel/deletion) in moderate LD with the variant identified in the EUR sample (r2 = 0.38), and a different lead SNP on Chr11:28678870 (rs10767739) in LD with the variant identified in the EUR sample (r2 = 0.54).
Meta-analysis of MVP and PGC PTSD case-control GWAS.
We next conducted meta-analyses of the EUR MVP and PGC PTSD case-control GWAS13 (Fig. 1 (bottom) and Supplementary Table 4a). The EUR meta-analysis yielded four distinct GWS loci, two of which were nearest to genes found GWS in the MVP case-control analysis (MAD1L1 and METTL15) although with different lead SNPs: one new SNP (nearest to LOC645949) and one lead SNP closest to PACRG, a gene linked in a head-to-head arrangement and co-regulated with PARK2 – a gene found GWS in PGC. There were no GWS SNPs for the AFR MVP/PGC PTSD meta-analysis, but two SNPs were GWS in the trans-ancestral meta-analysis with lead SNPs closest to PARK2 and MAD1L1, respectively (Supplementary Table 4b,c).
GWAS of PTSD symptom sub-phenotypes and total symptoms.
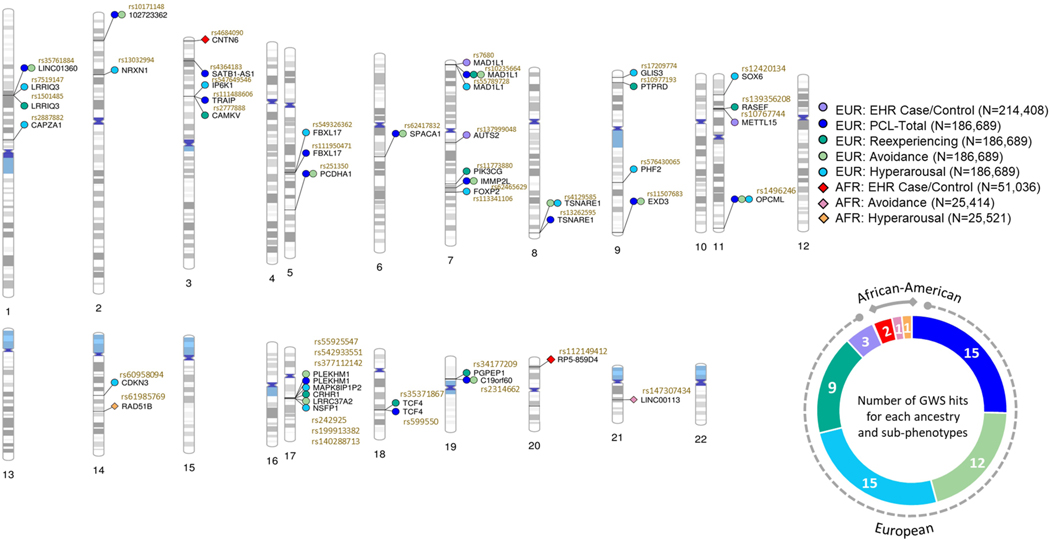
The MVP surveys included the PTSD Checklist for DSM-IV (PCL), a widely used 17-item self-report measure of past-month PTSD symptoms covering the three DSM-IV symptom cluster criteria – re-experiencing, avoidance, and hyperarousal – and a total symptom severity score (PCL-Total) as the sum of those three sub-phenotypes26. GWAS with these phenotypes in the EUR sample (n = 186,689 individuals) using linear regression identified multiple independent GWS SNPs, including some that were associated with PCL-Total as well as multiple sub-domains, and others that were more strongly associated with specific sub-domains (Table 1). Overlap in risk loci for the case-control and the quantitative phenotypes in the EUR and AFR samples is shown in Figure 2. Supplementary Table 5 shows PCL-Total GWAS results in the trans-ancestral sample.
Table 1 |.
Genome-wide significant (P < 5 × 10⁻⁸) findings using linear regression with lead SNPs for EUR PCL-Total and sub-phenotype GWAS analyses (n = 186,689 individuals)
| PCL-Total | LD independent lead SNP | Chr | Effect allele | Beta | P | INFO score | SNP location | Nearest gene |
| rs542933551 | 17 | AAAAACAAAAC | 0.4585 | 2.02E-13 | 0.95 | 43557054 | PLEKHM1 | |
| rs10235664 | 7 | C | −0.3667 | 1.82E-11 | 0.93 | 2086814 | MAD1L1 | |
| rs35761884 | 1 | C | −0.3076 | 3.46E-10 | 0.92 | 73787732 | LINC01360 | |
| rs111488606 | 3 | CA | 0.3102 | 1.72E-09 | 0.83 | 49864924 | TRAIP | |
| rs13262595 | 8 | G | −0.2823 | 2.20E-09 | 1.00 | 143316970 | TSNARE1 | |
| rs2314662 | 19 | C | −0.3614 | 3.78E-09 | 0.93 | 18702515 | C19orf60 | |
| rs10171148 | 2 | A | 0.2811 | 5.87E-09 | 0.96 | 22466171 | LOC102723362 | |
| rs62465629 | 7 | C | −0.3929 | 6.30E-09 | 0.85 | 110153866 | IMMP2L | |
| rs1496246 | 11 | G | 0.2973 | 6.60E-09 | 0.90 | 133548061 | OPCML | |
| rs251350 | 5 | C | −0.2538 | 1.03E-08 | 1.12 | 140225137 | PCDHA1 | |
| rs11507683 | 9 | T | 0.4137 | 1.15E-08 | 0.96 | 140262424 | EXD3 | |
| rs599550 | 18 | A | 0.3948 | 1.18E-08 | 0.95 | 53252388 | TCF4 | |
| rs4364183 | 3 | A | 0.3043 | 1.22E-08 | 0.93 | 18809536 | SATB1-AS1 | |
| rs62417832 | 6 | T | 0.2922 | 2.90E-08 | 1.00 | 88640221 | SPACA1 | |
| rs111950471 | 5 | TATTA | −0.2769 | 4.34E-08 | 0.98 | 107450098 | FBXL17 | |
| Re-experiencing | LD independent lead SNP | Chr | Effect allele | Beta | P | INFO score | SNP location | Nearest gene |
| rs35371867 | 18 | A | 0.1006 | 1.24E-10 | 0.97 | 53193027 | TCF4 | |
| rs2777888 | 3 | G | 0.0929 | 2.26E-10 | 0.98 | 49898000 | CAMKV | |
| rs10235664 | 7 | C | −0.1055 | 4.66E-10 | 0.93 | 2086814 | MAD1L1 | |
| rs242925 | 17 | T | −0.0931 | 5.50E-10 | 0.94 | 43888866 | CRHR1 | |
| rs139356208 | 11 | CACAAAACAAA | −0.0897 | 9.63E-09 | 0.90 | 28631779 | RASEF | |
| rs1501485 | 1 | G | −0.0839 | 1.22E-08 | 0.97 | 73995259 | LRRIQ3 | |
| rs11773880 | 7 | G | −0.0977 | 1.97E-08 | 0.93 | 106540171 | PIK3CG | |
| rs34177209 | 19 | A | 0.1205 | 2.34E-08 | 0.62 | 18474978 | PGPEP1 | |
| rs10977193 | 9 | A | −0.0934 | 4.17E-08 | 0.96 | 8542019 | PTPRD | |
| Avoid-ance | LD independent lead SNP | Chr | Effect allele | Beta | P | INFO score | SNP location | Nearest gene |
| rs55925547 | 17 | C | 0.1932 | 2.08E-13 | 0.98 | 43556807 | PLEKHM1 | |
| rs199913382 | 17 | C | 0.1772 | 1.05E-12 | 0.98 | 44625866 | LRRC37A2 | |
| rs35761884 | 1 | C | −0.1388 | 9.72E-11 | 0.92 | 73787732 | LINC01360 | |
| rs251350 | 5 | C | −0.1192 | 8.15E-10 | 1.12 | 140225137 | PCDHA1 | |
| rs4129585 | 8 | C | −0.125 | 1.25E-09 | 1.00 | 143312933 | TSNARE1 | |
| rs2314662 | 19 | C | −0.1599 | 2.74E-09 | 0.93 | 18702515 | C19orf60 | |
| rs62465629 | 7 | C | −0.175 | 3.54E-09 | 0.85 | 110153866 | IMMP2L | |
| rs62417832 | 6 | T | 0.1335 | 7.04E-09 | 1.00 | 88640221 | SPACA1 | |
| rs11507683 | 9 | T | 0.1834 | 7.74E-09 | 0.96 | 140262424 | EXD3 | |
| rs10171148 | 2 | A | 0.1211 | 1.07E-08 | 0.96 | 22466171 | LOC102723362 | |
| rs10235664 | 7 | C | −0.1337 | 2.17E-08 | 0.93 | 2086814 | MAD1L1 | |
| rs1496246 | 11 | G | 0.1234 | 3.66E-08 | 0.90 | 133548061 | OPCML | |
| Hyper-arousal | LD independent lead SNP | Chr | Effect allele | Beta | P | INFO score | SNP location | Nearest gene |
| rs377112142 | 17 | CT | 0.1323 | 3.06E-13 | 0.84 | 43663455 | MAPK8IP1P2 | |
| rs55789728 | 7 | G | −0.1303 | 4.62E-13 | 0.93 | 2107649 | MAD1L1 | |
| rs576430065 | 9 | CA | −0.1206 | 1.67E-11 | 0.78 | 96373697 | PHF2 | |
| rs140288713 | 17 | A | 0.1286 | 3.11E-11 | 0.90 | 44690708 | NSFP1 | |
| rs1496246 | 11 | G | 0.1037 | 1.77E-10 | 0.90 | 133548061 | OPCML | |
| rs547649546 | 3 | CA | −0.0937 | 1.59E-09 | 0.91 | 49789921 | IP6K1 | |
| rs2887882 | 1 | T | −0.1118 | 1.89E-09 | 0.98 | 113170389 | CAPZA1 | |
| rs7519147 | 1 | T | −0.0906 | 1.90E-09 | 0.96 | 73994416 | LRRIQ3 | |
| rs13032994 | 2 | C | −0.0968 | 3.73E-09 | 1.00 | 52709559 | NRXN1 | |
| rs113341106 | 7 | GC | 0.0923 | 3.82E-09 | 0.93 | 114039998 | FOXP2 | |
| rs12420134 | 11 | G | 0.1229 | 6.45E-09 | 0.87 | 16260861 | SOX6 | |
| rs17209774 | 9 | C | −0.0907 | 7.97E-09 | 0.97 | 4145163 | GLIS3 | |
| rs60958094 | 14 | T | 0.0961 | 1.99E-08 | 0.81 | 54711168 | CDKN3 | |
| rs4129585 | 8 | C | −0.0835 | 2.07E-08 | 1.00 | 143312933 | TSNARE1 | |
| rs549326362 | 5 | T | −0.0884 | 4.46E-08 | 0.94 | 107444481 | FBXL17 | |
Figure 2 |. Genome-wide significant (P < 5 × 10⁻⁸) findings, by European (circles) and African (diamonds) ancestry, for PTSD EHR case-control, PCL-Total score and each of the PTSD subcomponents (avoidance, hyperarousal, and re-experiencing).
There were no genome-wide significant results for the African case-control and re-experiencing traits. LD independent SNPs for each phenotype and the nearest gene are labeled. The donut chart summarizes the number of hits for each phenotype in the two populations. The genes labelled are significant following regression test for a two-sided P-value and applied Bonferroni-threshold for multiple testing (0.05/k SNPs = P < 5 × 10⁻⁸).
Fine-mapping and variant prioritization.
For PCL-Total, we identified 15 GWS loci in the EUR population. For the case-control phenotype, we observed three loci in the EUR population and two loci in the AFR population. Each locus that included more than 10 GWS SNPs was fine-mapped27 to prioritize variants in each locus, defined as credible sets (Supplementary Data 1). Regions associated with PCL-Total scores had multiple variants with Combined Annotation Dependent Depletion (CADD) scores > 10 (i.e., these variants were among the top 10% of pathogenic variants across the human genome)28. For example, in the region Chr3:49734229–50176259, associated with PCL-Total, there were four sub-regions with one or more exonic SNPs with CADD scores > 10. CAVIAR (Causal Variants Identification in Associated Regions)27 fine-mapping results and CADD scores are included in Supplementary Data 1.
To understand the biological effect of SNPs associated with PTSD phenotypes, we analyzed top SNPs (at suggestive threshold P < 5 × 10⁻⁶) for their distinct and overlapping distribution across the four sub-phenotypes. The top SNPs for each phenotype were LD pruned to obtain independent signals. We found 87 (hyperarousal), 49 (avoidance), 62 (re-experiencing), and 36 (PCL-Total) SNPs that were non-overlapping or phenotype-specific (Supplementary Data 2). These non-overlapping SNPs were assessed for their QTL protein associations (all tissues), DNA methylation (brain tissues), and splicing (brain tissues) from the QTLbase29. Most of the QTL associations were observed for methylation expression. These QTL associations are shown as Venn diagrams for each phenotype (Supplementary Data 2); detailed tabular results are also shown in Supplementary Data 2.
Replication of GWAS findings.
We compared top SNP associations from the PTSD case-control and PCL-Total results against the largest available external PTSD dataset, from the PGC-PTSD13. For the EUR case-control phenotype, there was nominal replication for one of three SNPs: for rs7680*A nearest to MAD1L1, with a log(OR) of −0.0712 (s.e. 0.013, P = 4.17 × 10⁻⁸) in MVP and a log(OR) of −0.0639 (s.e. 0.0215, P = 0.00312) in PGC-PTSD. For the EUR PCL-Total symptom scores, there were six of 15 possible nominal replications (Supplementary Table 6).
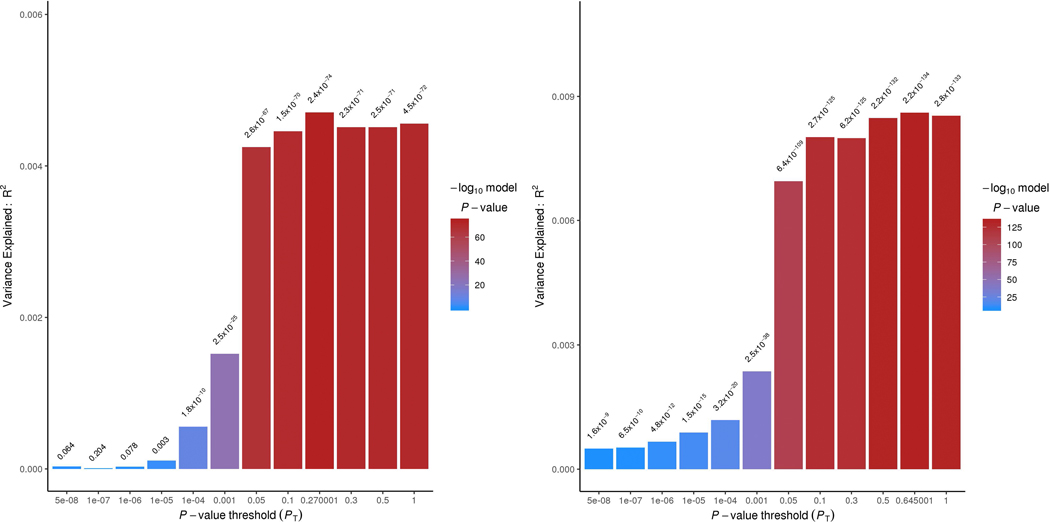
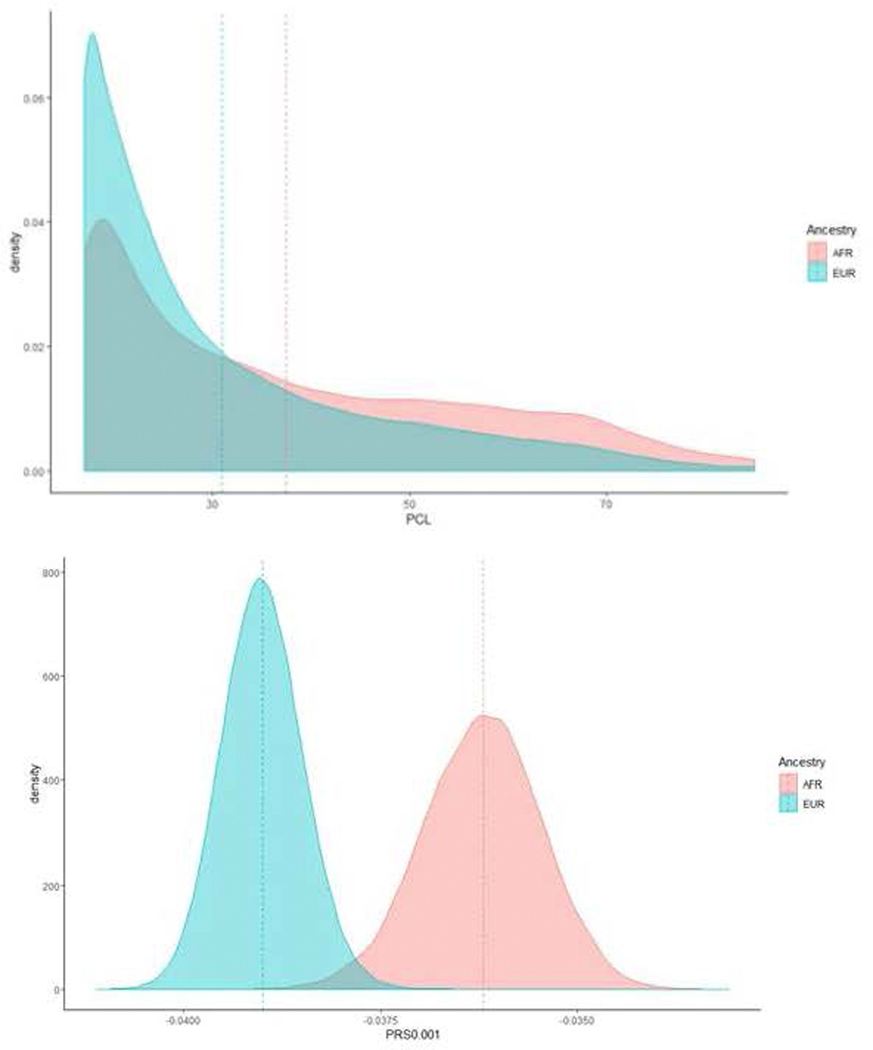
We applied a polygenic risk score (PRS) in EUR with MVP as the base and PGC as the target. The MVP case-control and MVP PCL-Total PRS explained approximately 0.4% (P = 2.4 × 10−74) and 0.7–0.8% of the variance (P = 2.2 × 10−134), respectively, in the PGC case-control phenotype at P-value thresholds (PT) ≤ 0.05 (Extended Data Fig. 2). The low phenotypic variance explained is likely due to different characteristics of the MVP and PGC-PTSD cohorts: across three MVP hold-out PRS analyses, we observed phenotypic variance explained ranging from 4% to 5.3% (P < 6 × 10−92; Supplementary Table 7). Evaluating the extent to which cross-ancestral PRS were useful, we found PRS biased by ancestry, with density plots of EUR and AFR PRS being substantially different (Extended Data Fig. 3).
SNP-based heritability estimates and genetic correlations across PTSD phenotypes and with other health-related traits.
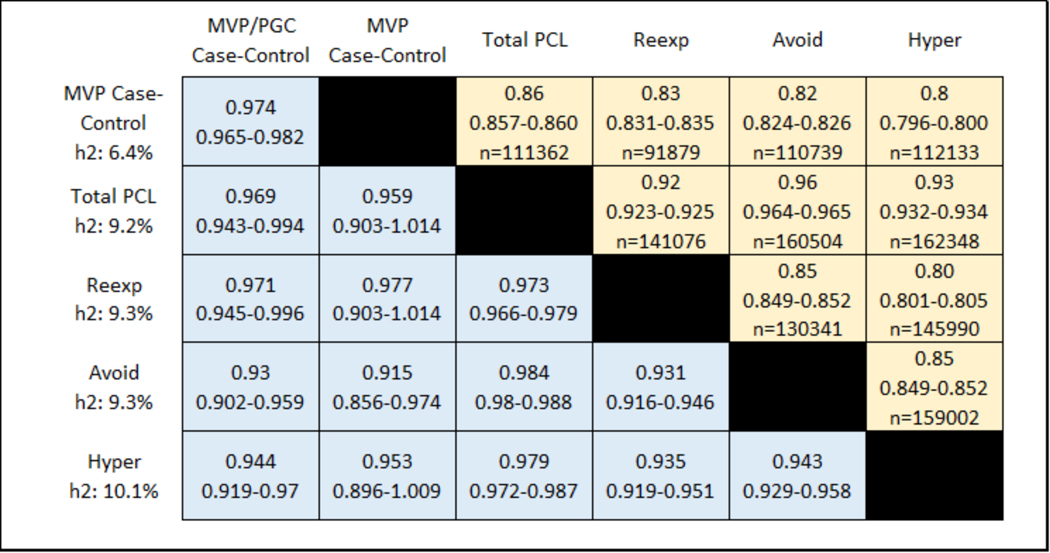
Figure 3 shows the SNP-based heritability estimates (on the left) and the phenotypic (above the diagonal) and genetic (below the diagonal) correlations in EUR between the algorithmic case-control diagnosis, and each of the four continuous PTSD symptoms (re-experiencing, avoidance, hyperarousal, and their total; and the genetic correlations for the MVP/PGC case-control meta-analysis). Genetic correlations were consistently high (rg > 0.9) across all PTSD traits, indicating that the traits investigated are all informative with respect to PTSD genetics. The PCL-Total quantitative trait (95%CI SNP-h2 = 0.08–0.10) has significantly higher SNP-based heritability than either the MVP case-control definition (95% CI SNP-h2 = 0.05–0.07, Pdifference = 1.85 × 10⁻⁴) or the MVP/PGC case-control meta-analysis (95% CI SNP-h2 = 0.07–0.08, Pdifference = 5.83 × 10⁻³), and significantly larger SNP-heritability z-score (MVP PCL-total SNP-h2 z = 17.73; MVP case-control SNP-h2 z = 11.62; MVP/PGC SNP-h2 z = 14.80).
Figure 3 |. Phenotypic (above diagonal) and genetic (below diagonal) correlations between case-control, PCL-Total and subscale scores.
Shown are correlation point estimates, 95% CIs, and n (sample size). SNP-heritability (h2) is shown in the left column. For phenotypic correlations, those for case-control are point-biserial correlations, and all others are Pearson correlations.
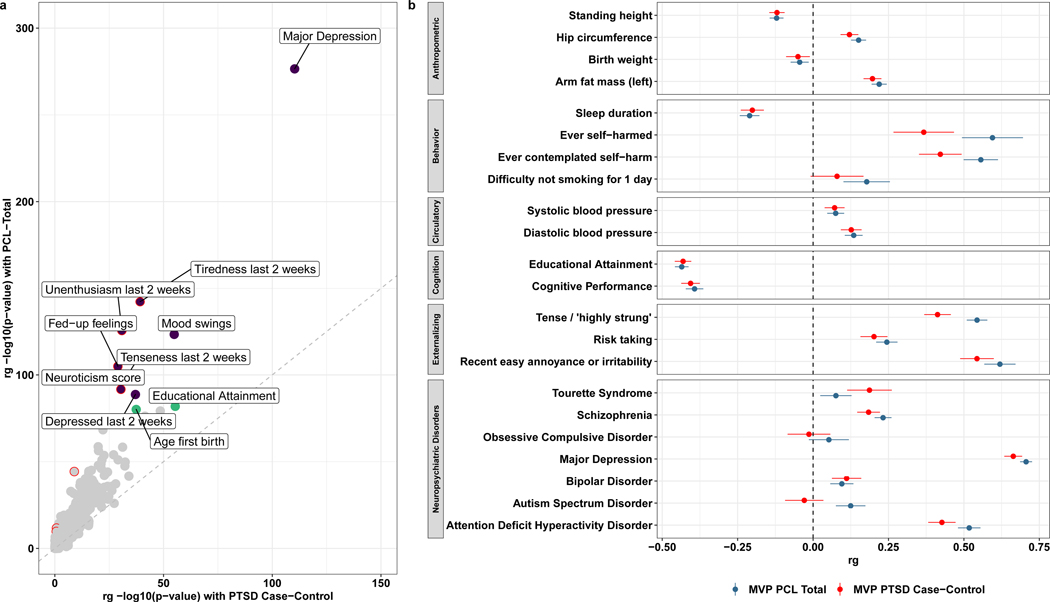
In the EUR sample, we estimated genetic correlations (rg) between the PTSD case-control and the PCL-Total score and health-related traits available from UK Biobank and the PGC (Supplementary Table 8, showing rg for all traits with h2 z-score of 4 or more). The many significant genetic correlations with both PTSD traits include positive rg with major depression, neuroticism, and related symptoms, and negative rg with educational attainment and cognitive performance (Fig. 4). Though the magnitudes of rg observed with PCL-Total and case-control PTSD were highly correlated (Spearman’s rho = 0.970, P = 2.20 × 10⁻¹⁶), ten phenotypes exhibited significantly greater rg with PCL-Total relative to case-control PTSD (Fig. 4a).
Figure 4 |. LDSC genetic correlation (rg) analyses in EUR showing traits from UK Biobank and PGC psychiatric disorders.
a, Comparison of rg between PTSD case-control definition and PCL-Total. The grey diagonal indicates perfect linearity between PTSD case-control and PCL-Total genetic correlates. The top ten genetic correlates of PCL-Total are labeled, with purple data points indicating positive rg and green data points indicating negative rg. Data points in a circled in red indicate significant difference in rg magnitude between PTSD and PCL-Total. b, Plot showing a wide range of phenotypes and their rg; the vertical dashed line indicates rg equal to zero.
Taken together, the higher heritability, the greater magnitude of the heritability z-score (indicative of a stronger polygenic signal), and the larger rg with other health-related traits confirm that PCL-Total is similar to, but more informative than, the case-control definition (for either MVP alone or the MVP/PGC meta-analysis). Accordingly, all subsequent post-GWAS analyses are based on the more powerful PCL-Total quantitative trait dataset in the EUR sample.
Genomic relationship of PTSD and other mental disorders.
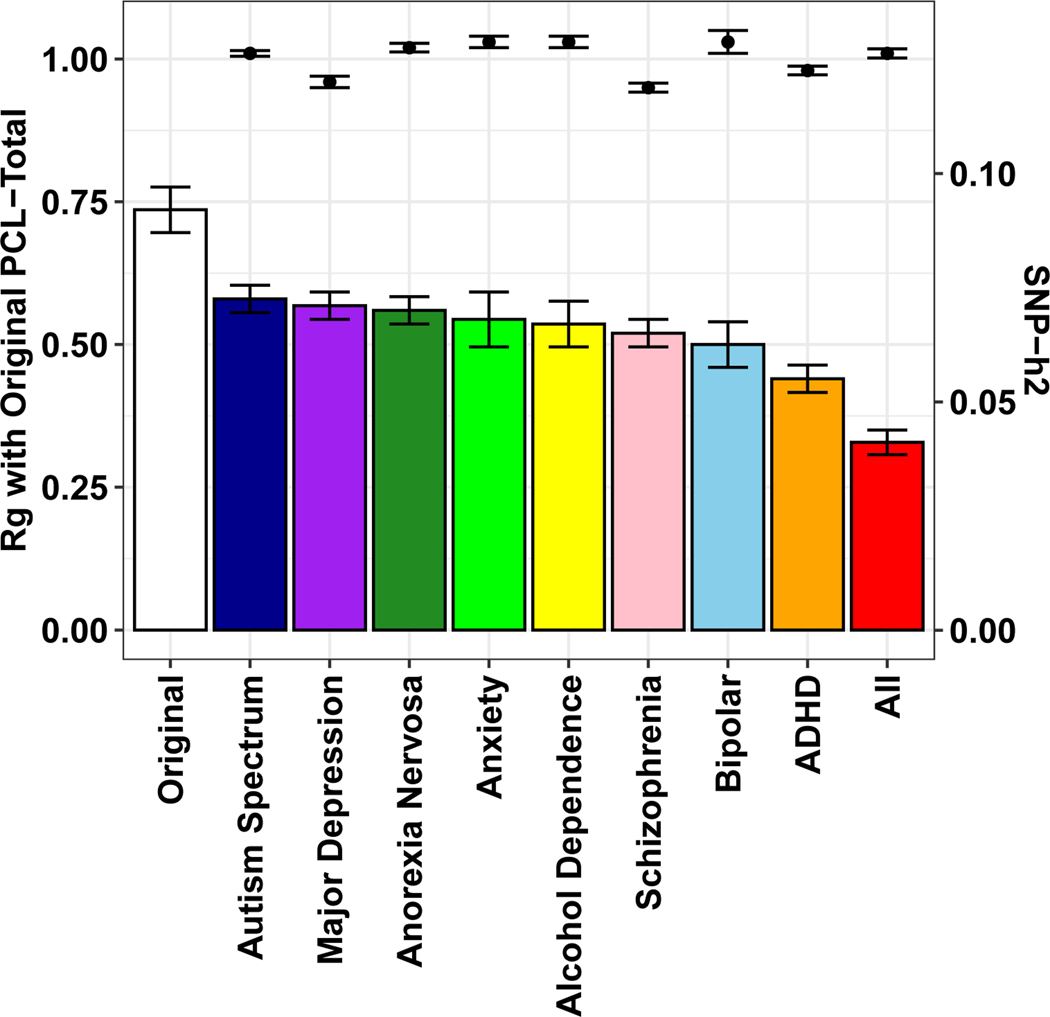
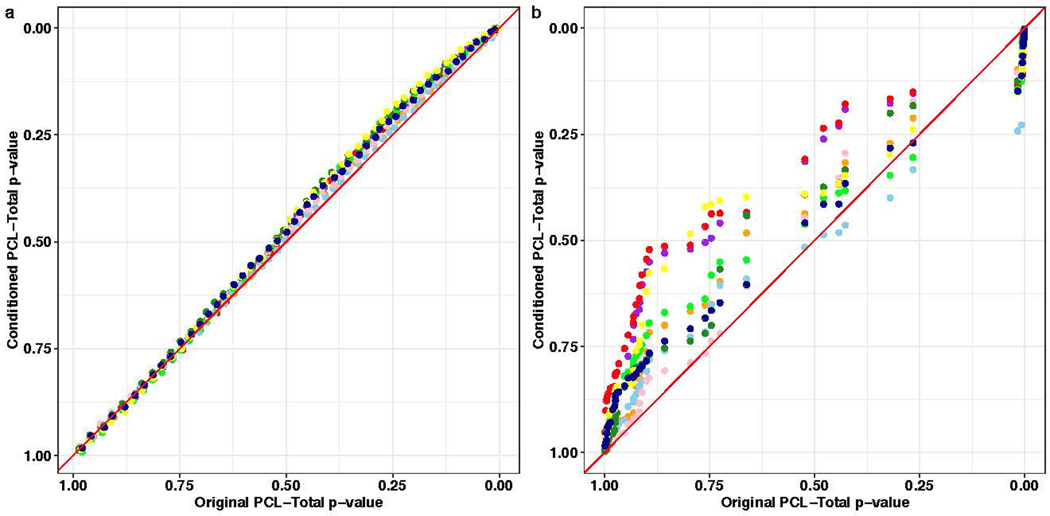
We used multi-trait conditional and joint analysis (mtCOJO)30 to address the genetic relationship between PTSD and other major mental disorders in two ways. First, we conditioned PTSD PCL-Total on a single mental disorder; then, we conditioned PTSD PCL-Total on all eight mental disorders simultaneously: autism spectrum disorder, major depression, anorexia nervosa, anxiety (case-control), alcohol dependence, schizophrenia, bipolar disorder, and attention deficit hyperactivity disorder31–38. The result of this analysis is treated as genetic signal attributable to PTSD in the absence of shared genetic liabilities of other mental disorders. PCL-Total remained highly genetically correlated with the unconditioned GWAS when conditioned on genetically correlated psychiatric disorders independently (i.e. PTSD PCL-Total conditioned on MDD) and simultaneously (i.e., PTSD PCL-Total conditioned on all eight mental disorders; Fig. 5). Conditioning on all eight mental disorder traits significantly reduced the observed-scale SNP-heritability (h2) of PCL-Total (PCL-Total original h2 = 9.21%, P = 1.39 × 10−67; PCL-Total conditioned h2 = 4.11%, P = 2.61 × 10−52) relative to the unconditioned GWAS (Pdifference = 1.52 × 10⁻¹³), but this reduction in heritability did not significantly alter associations with biological pathways or tissues associated with genetic risk for PTSD as evidenced by linear relationships between tissue and pathway enrichment effects (Extended Data Fig. 4).
Figure 5 |.
PCL-Total SNP-heritability (SNP-h2; bars and standard error; right y-axis) and genetic correlation (rg; data points and standard error; left y-axis) relative to original PCL-Total (n = 186,689) after conditioning with each mental health phenotype on the x-axis.
Genomic structural equation modeling.
Genomic structural equation models were analyzed to answer two question: (i) do PTSD subdomains (hyperarousal, re-experiencing, and avoidance) load onto one latent factor, and (ii) does latent factor architecture and subdomain loading change in the presence of PTSD genetic and phenotypic correlates: major depressive disorder, anxiety, and neuroticism. These traits – all part of the internalizing spectrum22,39 – are highly phenotypically and genetically correlated with PTSD.
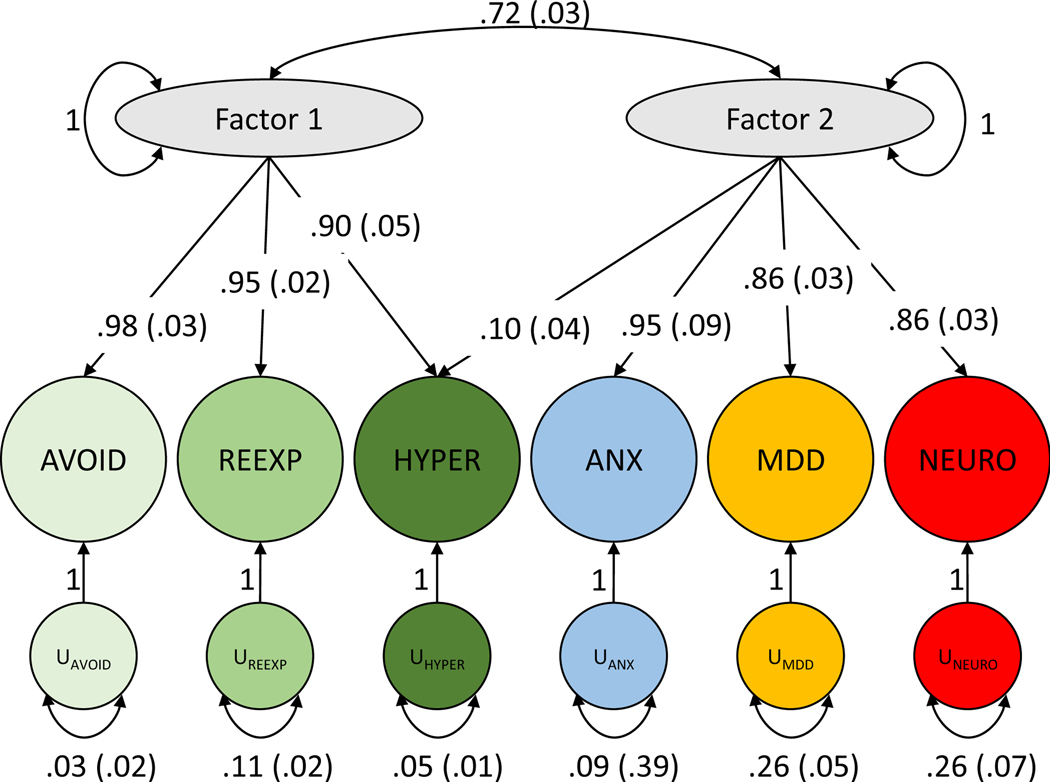
The three PTSD phenotypic subdomains loaded onto a single latent common factor (Supplementary Fig. 2). There were no significant differences in loading values between these PTSD subdomains, suggesting roughly equal contribution of all three to the common factor (comparative fit index (CFI) = 0.996). Next, we included PTSD genetic and phenotypic correlates from internalizing disorders – anxiety, neuroticism, and major depressive disorder (all from PGC). Genomic exploratory factor analysis (EFA) identified a two-factor model as best suited to represent the six phenotypes (i.e., PTSD subdomains and the three internalizing measures). In genomic confirmatory factor analysis (CFA) of the two-factor model, PTSD subdomains independently loaded onto factor 1 while the PTSD correlates loaded onto a second factor (CFI = 0.999) (Fig. 6). The PTSD subdomain hyperarousal loads onto both factors (loading onto factor 1 = 0.90 ± 0.05; loading onto factor 2 = 0.10 ± 0.04; correlation between factors 1 and 2 = 0.72 ± 0.03), indicating that this subdomain has a genetic correlation with the internalizing psychopathologies that is not shared by the other PTSD subdomains.
Figure 6 |. Genomic SEM model with confirmatory factor analysis indicating two correlated factors, the first consisting of PTSD symptoms and the second consisting of anxiety, major depressive disorder, and neuroticism.
Comparative fit index (CFI) = 0.999 (typically interpreted as 0.90–0.95 indicating marginal fit).
Partitioned heritability of PCL-Total.
Partitioning heritability of PCL-Total in EUR revealed 1.28-fold to 1.39-fold enrichment of SNPs associated with four GTEx cortical tissue types: cortex, frontal cortex (BA9), anterior cingulate cortex (BA24), and nucleus accumbens (FDR q < 0.05; Supplementary Table 9). Intronic regions had 1.29-fold enrichment (FDR q < 0.05). Cell-type partitioning analyses support SNP-h2 enrichment of the frontal cortex (BA9) gene sets (tau-c = 3.42 × 10⁻⁹, P = 0.002) above other annotations in the model, and frontal cortex (BA9), anterior cingulate cortex (BA24), and multiple basal ganglia (putamen, caudate, and nucleus accumbens) gene expression profiles (tau-c ranging from 1.02 × 10⁻⁹ to 3.43 × 10⁻⁹, FDR q < 0.05), above that of all other genomic annotations. These regions were prioritized when considering transcriptome-wide association results to constrain interpretation of those results to the most pertinent and evidence-driven tissues40.
Enrichment in biological tissues using transcriptome-wide analysis and colocalization.
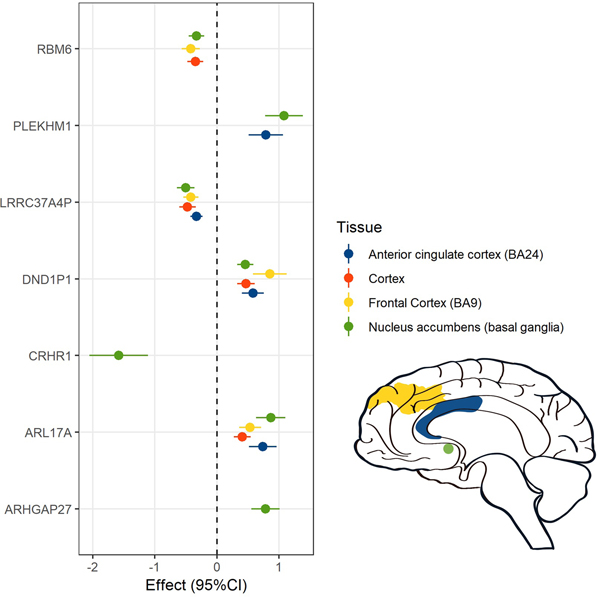
PrediXcan-S41 was used to correlate imputed tissue-specific genetically regulated gene expression determined by association with reference transcriptome datasets with PCL-Total results. We observed significant negative correlation with predicted expression of the protein product of the pseudogene LRRC37A4P in amygdala, substantia nigra, putamen, frontal and anterior cingulate cortex, adrenal gland, and whole blood tissues. Also noted were significant positive correlations with predicted expression of CRHR1 in amygdala, hippocampus, frontal and anterior cingulate cortex, adrenal, and whole blood (although negative correlation was seen for nucleus accumbens); significant positive correlation with predicted expression of PLEKHM1, ARL17A, LRRC37A2, and DND1P1 (all of which are co-localized on 17q21.31) in multiple brain regions including amygdala, anterior cingulate cortex, and basal ganglia; and significant negative correlation with predicted expression of RBM6 in frontal cortex, hippocampus, nucleus accumbens, adrenal, and whole blood. The complete list of PrediXcan-S results is available in Supplementary Table 10. The significant genes for 13 brain tissues were then tested for shared causal loci. The coloc method42 reports posterior probability for a pair of traits under the hypothesis (H4) that traits are associated and share a single causal variant. The genetically regulated transcriptomic profiles of ARL17A, LRRC37A2, RNF123, FAM212A and PLEKHM1 showed high probability (≥90%) of a shared causal locus (coloc H4) with PCL-Total across multiple brain regions. CRHR1 probability was highest (85%) for hippocampus tissue expression (Supplementary Data 2).
Drug repositioning analyses.
We selected genes significantly associated with PCL-Total in the PrediXcan-S analyses and, as recommended40, prioritized those genes with predicted expression regulation in at least one of the four tissues identified by LDSC partitioned heritability analyses: cortex, frontal cortex, anterior cingulate, and nucleus accumbens (Fig. 7).
Figure 7 |. Association of genetically-regulated transcriptomic changes with PCL-Total (n = 186,689) in the four brain regions identified by the LDSC partitioned heritability analyses.
Betas and 95% confidence intervals are reported for each association.
We imported this list of eight genes (ARHGAP27, ARL17A, CRHR1, DND1P1, LRRC37A2, LRRC37A4P, PLEKHM1, and RBM6) into the Drug Gene Interaction Database v3.0 (dgidb.genome.wustl.edu)43 to identify interactions with available drug treatments that might indicate potential novel drug strategies for PTSD. Drug repositioning analysis was also carried out in the Connectivity Map (CMap) database (https://www.broadinstitute.org/connectivity-map-cmap) and PHAROS (https://pharos.nih.gov) for the same set of eight genes44.
No currently druggable targets were identified for ARHGAP27, ARL17A, DND1P1, LRRC37A2, LRRC37A4P, or RBM6. CRHR1 was identified in all databases as being a potential drug target with experimental medications available. Given the positive association between PTSD symptoms and imputed CRHR1 expression in multiple brain regions (with the exception of nucleus accumbens) seen in our dataset, a CRHR1 antagonist would be hypothesized to be potentially therapeutic. Another gene, PLEKHM1, which was significantly associated with imputed increased expression and colocalized in caudate and nucleus accumbens, was considered by CMap as highly likely to share biological effects with several classes of drugs, including dopamine receptor antagonists, acetylcholine receptor antagonists, and alpha-2 adrenergic receptor and angiotensin receptor antagonists, all of which would be predicted to reduce expression and be associated with a reduction in PTSD symptoms.
DISCUSSION
The past decade has seen a proliferation in the use and usefulness of GWAS, with the prediction – and, to date, the experience – that continued sample size growth will result in even richer findings45. The field of psychiatric genomics has capitalized on GWAS, with substantial gains made in the understanding of serious mental disorders such as schizophrenia, major depression, bipolar disorder7,46, and their interrelatedness47. We present here a large, uniformly phenotyped and genotyped case-control GWAS of PTSD in military veterans. We augment this analysis with the GWAS of a quantitative trait corresponding to symptom severity, which proved more genetically informative than the case-control analysis even when our case-control GWAS was meta-analyzed with the next largest PTSD case-control GWAS available, from the PGC13.
These analyses revealed several genome-wide significant (GWS) associations with PTSD visible at the case-control level, and numerous GWS associations with various dimensions of symptom severity. When combined with imputed genetically regulated expression results and enrichment analyses, these results help to illuminate the neurobiology of PTSD and begin to uncover new avenues for therapeutic development.
This is the first study to compare heritability of binary (diagnostic) and continuous (symptom-based) phenotypes for PTSD directly. Although PTSD symptoms can have a very diverse phenotypic presentation14, their genetic overlap is very high (rg > 0.9). This is an important novel insight into the biology of PTSD. The quantitative (PCL-Total) trait – which reflected the most information – was the most heritable, and therefore the most informative for biological inference. Partitioned heritability analyses of that trait indicated overrepresentation of SNPs in frontal (BA9) and anterior cingulate cortex (BA24), consistent with prevailing neural circuit theories of PTSD pathophysiology2 that emphasize hypofunction of these regions and their connections with limbic cortex in the regulation of emotion and extinction of fear memories48,49. However, these analyses also pointed to the nucleus accumbens – an important component of the reward system – as being involved in PTSD symptoms. These results suggest that more extensive study of the nucleus accumbens and reward systems in PTSD may shed further light on aspects of the syndrome (e.g., its strong association with alcohol dependence)50,51 that are currently not well understood.
Several genes – most notably MAD1L1 (mitotic arrest deficient 1 like 1) – were repeatedly implicated across the various conceptualizations of the PTSD phenotype. The variants in MAD1L1 also show QTL associations with DNA methylation and splicing. MAD1L1, widely expressed in all tissues and thought to play a role in cell cycle control, has emerged as being GWS-associated with at least two other major mental disorders, schizophrenia31 and bipolar disorder 38 — both of which were excluded among participants in this study but have strong genetic correlations with PTSD in MVP and other cohorts13. These observations and the recent finding of GWS-association with anxiety52, suggest that MAD1L1 may be a general risk factor for psychopathology, possibly contributing to the p factor thought to underlie many serious mental disorders53.
Several other genes were discovered to be associated with PTSD and replicated in the largest available independent PTSD-informative dataset, the PGC-PTSD GWAS13. Included among these were TSNARE1 (T-SNARE Domain Containing 1) and EXD3 (Exonuclease 3’−5’ Domain Containing 3). TSNARE1, the product of which is involved in intracellular protein transport, has been associated with risk-taking54, which may predispose to PTSD through increasing the likelihood of exposure to traumatic events; twin studies suggest that risk for exposure to traumatic events is partially heritable5. EXD3, the product of which is involved in nucleic acid binding, has been associated with mathematical55 and other cognitive abilities, which have been found in our study and others to be genetically negatively correlated with PTSD and mediated by socioeconomic status56. The MVP/PGC case-control meta-analyses also identified associations with PARK2 and PACRG, both of which are associated with susceptibility to leprosy and to intracellular pathogens57. It remains to be determined to what extent these associations reflect systems or processes that underlie PTSD pathophysiology, but we now have gene candidates discovered and replicated through unbiased searches that can be further examined in relation to their putative biological relationships to PTSD and other stress- and anxiety-related conditions. (See Supplementary Note for discussion of fine-mapping, functional annotation, and CADD scores.)
Analyses adjusting for the genetic signals attributable to other major psychiatric disorders verified shared heritability with these other disorders while simultaneously confirming residual, distinct heritability for PTSD. The high rg between PTSD symptom subdomains, which do not include overlapping items, supports the coherence of PTSD as a diagnostic construct from a biological perspective: that is, the same genetic predisposition underlies different symptoms that have previously been identified as syndromic. Genomic structural equation modeling recapitulated genetic and phenotypic correlations between PTSD subdomains; this suggests that each PTSD subdomain is largely explained by the same genetic architectures. Our model also suggests that, whereas PTSD symptoms constitute a genetically distinct and cohesive module, hyperarousal may be a relevant subdomain linking the genetic and phenotypic relationships between PTSD, anxiety, major depressive disorder, and neuroticism.
CRHR1 is in a large LD block on chromosome 17, making it difficult to discern its association with PTSD apart from other genes in that LD block. In our previous study of intrusive re-experiencing symptoms in MVP, we supported CHRH1 as the gene with strongest association via a trans-ancestral meta-analysis16. We now provide additional biological evidence that CRHR1 may be causally related to PTSD. PrediXcan-S analyses pointed to increased expression of CRHR1 in amygdala, hippocampus (the structure with highest colocalization probability), frontal cortex and anterior cingulate, regions repeatedly implicated as structurally or functionally abnormal in PTSD2. These results must be replicated and extended to other brain regions such as ventromedial prefrontal cortex, shown to be integral to fear learning and extinction58, processes hypothesized to be central to PTSD onset and recovery, respectively2,59. In concert with strong preclinical and clinical priors for involvement of CRH in stress-related disorders60, these observations position drugs that influence CRHR1 as strong therapeutic candidates for PTSD and related conditions. Whereas a placebo-controlled trial of a CRHR1 antagonist in 128 women with PTSD produced unimpressive results61, our findings (albeit predominantly in men) suggest that there are potential unfulfilled opportunities with CRHR1 antagonists for PTSD that should be further explored, taking into account individual variation in CRHR1 – including epigenetic variation62 – as a source of differential antagonist efficacy, in keeping with the march toward precision psychiatry63. Furthermore, our unexpected finding of a negative association between PTSD symptom severity and predicted CRHR1 expression in nucleus accumbens – which suggests that an agonist might be therapeutic – requires further investigation.
Our findings also tentatively support consideration of several drug classes as therapeutic repurposing candidates for PTSD. For example, acetylcholine receptor antagonists could be considered given their association in cMAP with PLEKHM1. In a recent rodent study, the muscarinic receptor antagonist, scopolamine, augmented extinction in conjunction with exposure64 (although other studies suggest that positive allosteric modulation of M1 muscarinic activity enhances contextual fear conditioning)65. These results together suggest that a therapeutic role for cholinergic modulation in PTSD and other fear-related conditions, possibly in concert with exposure therapy, should be investigated. Angiotensin receptor antagonists, also identified as drug candidates through cMAP, have a strong preclinical rationale for use in PTSD66–68 and are, in fact, currently undergoing testing in a randomized placebo-controlled trial of losartan for PTSD (ClinicalTrials.gov Identifier: NCT02709018P).
Our study has limitations. It is not currently known whether genetic risk for PTSD differs by trauma type (e.g., combat exposure vs. civilian trauma exposure) or developmental timing (e.g., childhood maltreatment vs. adult assault). Such differences could possibly underlie clinically and biologically important heterogeneity69. Studies of even larger sample size (which MVP will attain in the coming years) and greater granularity with regard to types and chronology of trauma exposure, will be needed to address these questions. It is also important to note that the PCL is a state, not a trait measure, and therefore reflects current – but not necessarily worst-ever lifetime – severity. Our study also reports on the largest African ancestry sample in any PTSD study to date – which we leveraged by inclusion of those individuals in our trans-ancestral meta-analyses – but we relied, out of necessity, on the European ancestry sample for the post-GWAS analyses. We found, as might have been anticipated given prior work70, that PRS derived in the European sample did not predict well into the African sample. Nevertheless, we aspire to using novel tools in the future to make better use of the ancestral diversity in MVP20.
We used transcriptome-wide association approaches to inform our drug repurposing inquiries. As recommended40, we attempted to limit tissue biases inherent to these approaches by constraining our sphere of interest to brain regions that were associated with PTSD severity through our partitioned heritability analyses. Nonetheless, the drug repurposing propositions, while hypothesis-generating and intriguing, are just that. They are one piece of information that might increase interest in testing the proposed drug classes in patients with PTSD; they must be buttressed by additional preclinical models, postmortem PTSD brain studies71, and complementary bioinformatic approaches72 supporting their use, as well as serious consideration of their safety in this population. We also remind readers that the present analyses rested solely on GWAS, thereby limiting inquiry to common genetic variants (to MAF 0.01, which still capture significant heritable variance) and that roles for rare variants and structural variation should also be explored. Epigenetic factors almost certainly also play a role in a disorder such as PTSD10,73, which has traumatic stress as its precursor. Many other functional genomics tools can and should be brought to bear on the study of PTSD, expanding the scope of inquiry to encompass a holistic, integrative functional genomic analysis74 of this common, serious, and yet still poorly understood and inadequately treated neuropsychiatric disorder.
METHODS
Subjects.
All subjects are enrollees in the VA Million Veteran Program (MVP)18. Active users of the Veterans Health Administration healthcare system learn of MVP via an invitational mailing and/or through MVP staff while receiving clinical care with informed consent and HIPAA authorization as the only inclusion criteria. As of July 2020, > 825,000 veterans have enrolled in the program; for the current analyses, genotype data were available from approximately 375,000 participants. Individuals with EHR diagnoses of schizophrenia or bipolar disorder were excluded from participation in this study of PTSD. Research involving MVP is approved by the VA Central IRB; the current project was also approved by VA IRBs in Boston, San Diego, and West Haven.
PTSD case-control (binary) electronic health record derived phenotype.
Details on the validation and psychometric properties of this phenotype are reported in our recent publication23. In brief, we used manual chart review (n = 500) as the gold standard. For both the algorithm and chart review, three classifications were possible: likely PTSD, possible PTSD, or no PTSD. We used Lasso regression with cross-validation first to select statistically significant predictors of PTSD from the electronic health record (EHR) and then to generate a predicted probability score of being a PTSD case for every participant in the study population. Probability scores ranged from 0–1.00. Comparing the performance of our probabilistic approach (Lasso algorithm) to a rule-based approach (ICD algorithm), the Lasso algorithm showed modestly higher overall percent agreement with chart review compared to the ICD algorithm (80% vs. 75%), higher sensitivity (0.95 vs. 0.84), and higher overall accuracy (AUC = 0.95 vs. 0.90). For purposes of the case-control binary EHR-derived phenotype used here, we applied a 0.7 probability cut point to the Lasso results to determine final PTSD case and control status; we also selected a threshold score of 30 on the PCL from the MVP survey to minimize false negative classifications (e.g., due to an absence of PTSD screening information in the EHR). This final algorithm had a 0.96 sensitivity, 0.98 specificity, 0.91 positive predictive value, and 0.99 negative predictive value for PTSD classification in the trans-ancestral sample as determined by chart review.
PTSD symptom severity (quantitative trait) sub-phenotypes.
The second optional questionnaire, the MVP Lifestyle Survey, includes the PTSD Symptom Checklist (PCL; DSM-IV version)26, which asks respondents to report how much they have been bothered in the past month by symptoms in response to stressful life experiences. The PCL has 17 items, each scored on a 5-point severity scale (1 = “Not at All” though 5 = “Extremely”). The re-experiencing (REX) symptom domain is covered by 5 items (score range 5–25), the avoidance (AVOID) domain by 7 items (score range 5–35), and the hyperarousal (HYPER) domain by 5 items (score range 5–25), yielding an overall severity score (TOTAL) for the 17 items (score range 17–85). PCL items and their distributions in European Americans and African Americans are shown in Supplementary Table 1. After accounting for missing phenotype data, the final sample size for TOTAL was 186,689 in the EUR sample and 25,318 in the AFR sample.
Genotyping, imputation and quality control.
Genotyping, imputation, and quality control within MVP has been previously described18. Briefly, samples were genotyped using a 723,305-SNP Affymetrix Axiom biobank array, customized for MVP. Imputation was performed with minimac375 using data from the 1000 Genomes Project. For post-imputation QC, SNPs with imputation INFO scores of < 0.3 or minor allele frequencies (MAF) below 0.01 were removed from analysis. For the first tranche of data, 22,183 SNPs were selected through linkage disequilibrium (LD) pruning using PLINK24,76, and then Eigensoft77 was used to conduct principal component analysis on 343,286 MVP samples and 2,504 1000 Genomes Project samples78. The reference population groups in the 1000 Genomes samples were used to define EUR (n = 241,541) and AFR (n = 61,796) groups used in these analyses. Similar methods were used in the second data tranche, which contained 108,416 new MVP samples and the same 2,504 1000 Genomes Project samples. In Tranche 2, 80,694 participants were defined as EUR and 20,584 as AFR. In this manuscript, we report results as the meta-analysis of Tranche 1 and 2 data, either for EUR and AFR separately, or as a trans-ancestral meta-analysis.
Association analyses.
GWAS analysis was carried out by logistic (for the two binary traits) or linear (for the quantitative traits) regression for each ancestry group and tranche using PLINK 2.024 on dosage data, covarying for age, sex, and the first 10 PCs. Meta-analysis was performed using METAL25. We applied a standard genome-wide multiple testing correction (P < 5 × 10⁻⁸). No additional multiple testing correction was applied with respect to the number of phenotypes tested due to their high genetic correlation (rg > 0.9). The association results were populated and visualized using Phenogram79. The risk loci were enumerated using FUMA80, and each locus containing more than 10 SNPs was fine-mapped using CADD28 and CAVIAR27 for PCL-Total in the EUR population only as no significant associations were observed in the AFR population, and EHR case-control phenotypes for both populations. To understand the biological effect of SNPs associated with PTSD phenotypes, we analyzed top SNPs (at suggestive threshold P < 5 × 10⁻⁶) for their unique and overlapping distribution across the five phenotypes. The top SNPs for each phenotype were LD pruned (r2 = 0.2, kb = 250) to obtain independent signals and investigated for their role as quantitative trait loci for protein expression, DNA methylation, and splicing (brain tissues) from the QTLbase29.
LD score regression (LDSC) and SNP-based heritability.
SNP-heritability was calculated using LDSC81 on the observed-scale for continuous phenotypes and the liability scale (using prevalence = 10%) for the PTSD case-control definition. Genetic correlation was estimated between PTSD case-control, PCL-Total, and all phenotypes from UK Biobank with suitable h2 accuracies for reliable rg estimation (h2 z-score ≥ 4). Heritability and genetic correlation analyses were performed using the 1000 Genomes Project European LD reference panel.
Conditional analysis with other psychiatric disorders.
Considering the extensive comorbidity between major depression and PTSD82, we conducted conditional analysis with Multi-trait Conditional and Joint Analysis (mtCOJO)30 using GCTA software with the MVP PCL-total symptom severity summary statistics as the primary analysis and the PGC MDD2 (excluding 23andMe due to data unavailability)83 summary statistics to condition the analysis for depression. Additional summary statistics for autism spectrum disorder, anorexia nervosa, anxiety (case-control), alcohol dependence, schizophrenia, bipolar disorder, and attention deficit hyperactivity disorder were obtained from https://www.med.unc.edu/pgc/results-and-downloads/.
Genomic structural equation modeling.
Genomic structural equation modeling (GenomicSEM) was performed in R using the GenomicSEM package84. Multivariable linkage disequilibrium matrices were created using the 1000 Genomes Project Phase 3 European reference. Exploratory factor analysis (EFA) was used to estimate the most appropriate number of latent factors represented by the psychiatric phenotypes and psychopathologies tested assuming a maximum number of latent factors equal to Ntraits-1. Confirmatory factor analysis (CFA) was used to calculate factor loadings onto each latent factor(s). Standardized loading values are reported.
Polygenic risk score (PRS) analysis.
The PRS (Extended Data Figure 2) were calculated after using P-value-informed clumping with an LD cutoff of r2 = 0.05 within a 500-kb window, excluding the MHC region of the genome because of its complex LD structure. The European samples of the 1000 Genomes Project were used as the LD reference panel. PRS analysis was conducted based on the GWAS summary association data using the gtx R package incorporated in PRSice v1.25 software81. For each PRS analysis, we calculated an approximate estimate of the explained variance from a multivariate regression model85. For comparison of cross-ancestry PRS (Extended Data Figure 3), we clumped summary statistics from a recent PTSD GWAS13, applying an LD cutoff of r2 = 0.3 within a 500-kb window. These clumped summary statistics were used as a base for calculating the PRS in MVP individuals of European and African ancestry, independently, using PRSice 2.0 software86.
PrediXcan-S methods.
To perform transcriptome-wide association analysis, PrediXcan-S (also known as MetaXcan)41 was used to impute gene expression based on the GWAS summary statistics (meta-analysis of tranche 1 and 2 EAs) of PCL-Total with the reference gene expression data of 48 tissues from GTEx Release V7. Gene-expression association with PTSD PCL-Total was performed for each tissue (13 of which are brain tissues) individually.
Colocalization analysis.
Colocalization analysis was performed using the coloc R package42 for genes that were significant from the TWAS results of brain tissues with gene expression data from GTEx Release V8. The coloc.abf function was used to test for shared causal loci under four alternative hypotheses. Loci with posterior probability >90% were considered as strong evidence for the H4 hypothesis, i.e. both traits are associated and share a single causal variant.
Drug repositioning analysis.
CMap (https://clue.io/cmap) provides expression similarity scores for a specific expression profile with other drug-induced transcriptional profiles, including consensus transcriptional signatures of 83 drug classes, i.e., transcriptional profiles induced by 2,837 drugs grouped into 83 drug classes. Expression similarity is evaluated by means of scores that vary from −100 to 100, with −100 the most extreme opposite expression profile and 100 the most extreme similar expression profile.
Extended Data
Extended Data Fig. 1. Manhattan plot of MVP AFR case-control GWAS.
Horizontal red line indicates P < 5 × 10⁻⁸. P-values are uncorrected. Results are based on logistic regression.
Extended Data Fig. 2. Polygenic risk scores in MVP and PGC-PTSD.
Polygenic risk score (PRS) from MVP EUR case-control (left) and EUR PCL-total (right) applied to PGC-PTSD13 case-control phenotype with varying P-value thresholds (PT) on the x-axis and explained variance (R2) on the y-axis. The approximate estimate of the explained variance was calculated using a multivariate regression model. P values reported are two sided, and Bonferroni correction accounting for the number of P-value thresholds tested is P = 2.38 × 10⁻⁴.
Extended Data Fig. 3. Symptom and polygenic risk scores in veterans of African and European ancestry.
Top shows density plot of PCL-total scores in veterans of AFR (salmon color) and EUR (teal color) ancestry. Bottom shows density plot of PRS scores (at P-value threshold 0.001) for MVP PCL AFR (salmon color) and MVP PCL EUR (teal color) into PGC PTSD EUR.
Extended Data Fig. 4. Gene Ontology (GO) term and GTEx tissue enrichment.
a, Quantile-quantile plots between Gene Ontology (GO) term enrichment (one-sided test for positive relationship between tissue and genetic association) in original PCL-Total and conditioned PCL-Total (blue, autism spectrum disorder; purple, major depression; dark green, anorexia nervosa; light green, anxiety; pink, schizophrenia; light blue, bipolar disorder; orange, attention deficit hyperactivity disorder; red, all eight disorders simultaneously). b, Quantile-quantile relationship between GTEx tissue enrichment (one-sided test for positive relationship between tissue and genetic association) in original PCL-total and conditioned PCL-Total. To avoid over-plotting, enrichment P-values were divided into quantiles. Red diagonal lines indicate a one-to-one relationship between original and conditioned PCL-Total gene set and tissue enrichments. Two-sided tests were used to compare enrichment results.
Supplementary Material
ACKNOWLEDGEMENTS
This research is based on data from the Million Veteran Program, Office of Research and Development, Veterans Health Administration and was supported by funding from the VA Cooperative Studies Program CSP575B and the Veterans Affairs Office of Research and Development Million Veteran Program grant MVP000 and VA Merit grant MVP025. The views expressed in this article are those of the authors and do not necessarily reflect the position or policy of the Department of Veterans Affairs or the United States government.
We are grateful to the veterans who participated in this study, and the members of the VA Cooperative Studies Program (CSP) and Million Veteran Program (MVP) study teams, without whom this work would not have been possible.
APPENDIX.
CONSORTIA
Department of Veterans Affairs Cooperative Studies Program (#575B)
Murray B. Stein1, Daniel F. Levey4, Zhongshan Cheng4, Frank R. Wendt4, Gita A. Pathak4, Krishnan Radhakrishnan9, Mihaela Aslan9, Hongyu Zhao9, Renato Polimanti4, John Concato9, and Joel Gelernter4
A full list of members and their affiliations appears in the Supplementary Information.
VA Million Veteran Program
Murray B. Stein1, Daniel F. Levey4, Zhongshan Cheng4, Frank R. Wendt4, Kelly Harrington6, Gita A. Pathak4, Kelly Cho6, Rachel Quaden6, Yuk-Lam Anne Ho6, Daniel Posner6, Renato Polimanti4, John Concato9, and Joel Gelernter4
A full list of members and their affiliations appears in the Supplementary Information.
Footnotes
COMPETING INTERESTS STATEMENT
M.B.S. has in the past 3 years been a consultant for Actelion, Acadia Pharmaceuticals, Aptinyx, Bionomics, BioXcel Therapeutics, Clexio, EmpowerPharm, Epivario, GW Pharmaceuticals, Janssen, Jazz Pharmaceuticals, Roche/Genentech, and Oxeia Biopharmaceuticals. M.B.S. has stock options in Oxeia Biopharmaceuticals and Epivario. J.G. is named as co-inventor on PCT patent application #15/878,640 entitled: “Genotype-guided dosing of opioid agonists,” filed January 24, 2018. None of the other authors declare any competing interests.
Data Availability
The GWAS summary statistics generated during and/or analyzed during the current study will be made available via dbGAP; the dbGaP accession assigned to the Million Veteran Program is phs001672.v1.p. The website is: https://www.ncbi.nlm.nih.gov/projects/gap/cgi-bin/study.cgi?study_id=phs001672.v1.p1
REFERENCES
- 1.American Psychiatric Association, Diagnostic and Statistical Manual of Mental Disorders, 5th Edition, (Arlington, VA, 2013). [Google Scholar]
- 2.Shalev A, Liberzon I. & Marmar C. Post-traumatic stress disorder. N. Engl. J. Med. 376, 2459–2469 (2017). [DOI] [PubMed] [Google Scholar]
- 3.Kessler RC & Wang PS The descriptive epidemiology of commonly occurring mental disorders in the United States. Annu. Rev. Public Health 29, 115–129 (2008). [DOI] [PubMed] [Google Scholar]
- 4.Atwoli L, Stein DJ, Koenen KC & McLaughlin KA Epidemiology of posttraumatic stress disorder: prevalence, correlates and consequences. Curr. Opin. Psychiatry 28, 307–11 (2015). [DOI] [PMC free article] [PubMed] [Google Scholar]
- 5.Stein MB, Jang KL, Taylor S, Vernon PA & Livesley WJ Genetic and environmental influences on trauma exposure and posttraumatic stress disorder symptoms: a twin study. Am. J. Psychiatry 159, 1675–1681 (2002). [DOI] [PubMed] [Google Scholar]
- 6.Wolf EJ et al. A classical twin study of PTSD symptoms and resilience: Evidence for a single spectrum of vulnerability to traumatic stress. Depress. Anxiety 35, 132–139 (2018). [DOI] [PMC free article] [PubMed] [Google Scholar]
- 7.Sullivan PF et al. Psychiatric genomics: an update and an agenda. Am. J. Psychiatry 175, 15–27 (2018). [DOI] [PMC free article] [PubMed] [Google Scholar]
- 8.Stein MB et al. Genome-wide association studies of posttraumatic stress disorder in 2 cohorts of US Army soldiers. JAMA Psychiatry 73, 695–704 (2016). [DOI] [PMC free article] [PubMed] [Google Scholar]
- 9.Duncan LE et al. Largest GWAS of PTSD (N=20 070) yields genetic overlap with schizophrenia and sex differences in heritability. Mol. Psychiatry 23, 666–673 (2018). [DOI] [PMC free article] [PubMed] [Google Scholar]
- 10.Daskalakis NP, Rijal CM, King C, Huckins LM & Ressler KJ Recent genetics and epigenetics approaches to PTSD. Curr. Psychiatry Rep. 20, 30 (2018). [DOI] [PMC free article] [PubMed] [Google Scholar]
- 11.Benjet C. et al. The epidemiology of traumatic event exposure worldwide: results from the World Mental Health Survey Consortium. Psychol. Med. 46, 327–343 (2016). [DOI] [PMC free article] [PubMed] [Google Scholar]
- 12.Xie P. et al. Genome-wide association study identifies new susceptibility loci for posttraumatic stress disorder. Biol. Psychiatry 74, 656–663 (2013). [DOI] [PMC free article] [PubMed] [Google Scholar]
- 13.Nievergelt CM et al. International meta-analysis of PTSD genome-wide association studies identifies sex- and ancestry-specific genetic risk loci. Nat. Commun. 10, 4558 (2019). [DOI] [PMC free article] [PubMed] [Google Scholar]
- 14.Galatzer-Levy IR & Bryant RA 636,120 ways to have posttraumatic stress disorder. Perspect. Psychol. Sci. 8, 651–662 (2013). [DOI] [PubMed] [Google Scholar]
- 15.Stein MB Genomics of posttraumatic stress disorder: sequencing stress and modeling misfortune. Biol. Psychiatry 83, 795–796 (2018). [DOI] [PMC free article] [PubMed] [Google Scholar]
- 16.Gelernter J. et al. Genome-wide association study of post-traumatic stress disorder reexperiencing symptoms in >165,000 US veterans. Nat. Neurosci. 22, 1394–1401 (2019). [DOI] [PMC free article] [PubMed] [Google Scholar]
- 17.Radhakrishnan K. et al. Genomics of posttraumatic stress disorder in veterans: Methods and rationale for Veterans Affairs Cooperative Study #575B. Int. J. Methods Psychiatr. Res. 28, e1767 (2019). [DOI] [PMC free article] [PubMed] [Google Scholar]
- 18.Gaziano JM et al. Million Veteran Program: a mega-biobank to study genetic influences on health and disease. J. Clin. Epidemiol. 70, 214–223 (2016). [DOI] [PubMed] [Google Scholar]
- 19.Martin AR et al. Clinical use of current polygenic risk scores may exacerbate health disparities. Nat. Genet. 51, 584–591 (2019). [DOI] [PMC free article] [PubMed] [Google Scholar]
- 20.Peterson RE et al. Genome-wide association studies in ancestrally diverse populations: opportunities, methods, pitfalls, and recommendations. Cell 179, 589–603 (2019). [DOI] [PMC free article] [PubMed] [Google Scholar]
- 21.Gamazon ER et al. A gene-based association method for mapping traits using reference transcriptome data. Nat. Genet. 47, 1091–1098 (2015). [DOI] [PMC free article] [PubMed] [Google Scholar]
- 22.Genetics of Personality Consortium et al. Meta-analysis of genome-wide association studies for neuroticism, and the polygenic association with major depressive disorder. JAMA Psychiatry 72, 642–650 (2015). [DOI] [PMC free article] [PubMed] [Google Scholar]
- 23.Harrington KM et al. Validation of an electronic medical record-based algorithm for identifying posttraumatic stress disorder in U.S. veterans. J. Trauma Stress 32, 226–237 (2019). [DOI] [PMC free article] [PubMed] [Google Scholar]
- 24.Chang CC et al. Second-generation PLINK: rising to the challenge of larger and richer datasets. Gigascience 4, 7 (2015). [DOI] [PMC free article] [PubMed] [Google Scholar]
- 25.Willer CJ, Li Y. & Abecasis GR METAL: fast and efficient meta-analysis of genomewide association scans. Bioinformatics 26, 2190–2191 (2010). [DOI] [PMC free article] [PubMed] [Google Scholar]
- 26.Blanchard EB, Jones-Alexander J, Buckley TC & Forneris CA Psychometric properties of the PTSD Checklist (PCL). Behav. Res. Ther. 34, 669–673 (1996). [DOI] [PubMed] [Google Scholar]
- 27.Hormozdiari F, Kostem E, Kang EY, Pasaniuc B. & Eskin E. Identifying causal variants at loci with multiple signals of association. Genetics 198, 497–508 (2014). [DOI] [PMC free article] [PubMed] [Google Scholar]
- 28.Rentzsch P, Witten D, Cooper GM, Shendure J. & Kircher M. CADD: predicting the deleteriousness of variants throughout the human genome. Nucleic Acids Res. 47, D886-D894 (2019). [DOI] [PMC free article] [PubMed] [Google Scholar]
- 29.Zheng Z. et al. QTLbase: an integrative resource for quantitative trait loci across multiple human molecular phenotypes. Nucleic Acids Res. 48, D983-D991 (2020). [DOI] [PMC free article] [PubMed] [Google Scholar]
- 30.Zhu Z. et al. Causal associations between risk factors and common diseases inferred from GWAS summary data. Nat. Commun. 9, 224 (2018). [DOI] [PMC free article] [PubMed] [Google Scholar]
- 31.Schizophrenia Working Group of the Psychiatric Genomics Consortium. Biological insights from 108 schizophrenia-associated genetic loci. Nature 511, 421–427 (2014). [DOI] [PMC free article] [PubMed] [Google Scholar]
- 32.Otowa T. et al. Meta-analysis of genome-wide association studies of anxiety disorders. Mol. Psychiatry 21, 1391–1399 (2016). [DOI] [PMC free article] [PubMed] [Google Scholar]
- 33.Howard DM et al. Genome-wide meta-analysis of depression identifies 102 independent variants and highlights the importance of the prefrontal brain regions. Nat. Neurosci. 22, 343–352 (2019). [DOI] [PMC free article] [PubMed] [Google Scholar]
- 34.Walters RK et al. Transancestral GWAS of alcohol dependence reveals common genetic underpinnings with psychiatric disorders. Nat. Neurosci. 21, 1656–1669 (2018). [DOI] [PMC free article] [PubMed] [Google Scholar]
- 35.Martin J. et al. A genetic investigation of sex bias in the prevalence of attention-deficit/hyperactivity disorder. Biol. Psychiatry 83, 1044–1053 (2018). [DOI] [PMC free article] [PubMed] [Google Scholar]
- 36.Grove J. et al. Identification of common genetic risk variants for autism spectrum disorder. Nat. Genet. 51, 431–444 (2019). [DOI] [PMC free article] [PubMed] [Google Scholar]
- 37.Duncan L. et al. Significant locus and metabolic genetic correlations revealed in genome-wide association study of anorexia nervosa. Am. J. Psychiatry 174, 850–858 (2017). [DOI] [PMC free article] [PubMed] [Google Scholar]
- 38.Stahl E. et al. Genomewide association study identifies 30 loci associated with bipolar disorder. Nat. Genet. 51, 793–803 (2019). [DOI] [PMC free article] [PubMed] [Google Scholar]
- 39.Kotov R. et al. The Hierarchical Taxonomy of Psychopathology (HiTOP): a dimensional alternative to traditional nosologies. J. Abnorm. Psychol. 126, 454–477 (2017). [DOI] [PubMed] [Google Scholar]
- 40.Wainberg M. et al. Opportunities and challenges for transcriptome-wide association studies. Nat. Genet. 51, 592–599 (2019). [DOI] [PMC free article] [PubMed] [Google Scholar]
- 41.Barbeira AN et al. Exploring the phenotypic consequences of tissue specific gene expression variation inferred from GWAS summary statistics. Nat. Commun. 9, 1825 (2018). [DOI] [PMC free article] [PubMed] [Google Scholar]
- 42.Giambartolomei C. et al. Bayesian test for colocalisation between pairs of genetic association studies using summary statistics. PLoS Genet. 10, e1004383 (2014). [DOI] [PMC free article] [PubMed] [Google Scholar]
- 43.Cotto KC et al. DGIdb 3.0: a redesign and expansion of the drug-gene interaction database. Nucleic Acids Res. 46, D1068-D1073 (2018). [DOI] [PMC free article] [PubMed] [Google Scholar]
- 44.Subramanian A. et al. A next generation Connectivity Map: L1000 platform and the first 1,000,000 profiles. Cell 171, 1437–1452 e17 (2017). [DOI] [PMC free article] [PubMed] [Google Scholar]
- 45.Visscher PM et al. 10 years of GWAS discovery: biology, function, and translation. Am. J. Hum. Genet. 101, 5–22 (2017). [DOI] [PMC free article] [PubMed] [Google Scholar]
- 46.Smoller JW Psychiatric genetics begins to find its footing. Am. J. Psychiatry 176, 609–614 (2019). [DOI] [PubMed] [Google Scholar]
- 47.Cross-Disorder Group of the Psychiatric Genomics Consortium. Genomic relationships, novel loci, and pleiotropic mechanisms across eight psychiatric disorders. Cell 179, 1469–1482 e11 (2019). [DOI] [PMC free article] [PubMed] [Google Scholar]
- 48.Dunsmoor JE, Niv Y, Daw N. & Phelps EA Rethinking extinction. Neuron 88, 47–63 (2015). [DOI] [PMC free article] [PubMed] [Google Scholar]
- 49.Phelps EA & Hofmann SG Memory editing from science fiction to clinical practice. Nature 572, 43–50 (2019). [DOI] [PubMed] [Google Scholar]
- 50.Suh J. & Ressler KJ Common biological mechanisms of alcohol use disorder and post-traumatic stress disorder. Alcohol Res. 39, 131–145 (2018). [PMC free article] [PubMed] [Google Scholar]
- 51.Smith NDL & Cottler LB The epidemiology of post-traumatic stress disorder and alcohol use disorder. Alcohol Res. 39, 113–120 (2018). [PMC free article] [PubMed] [Google Scholar]
- 52.Levey DF et al. Reproducible genetic risk loci for anxiety: results from approximately 200,000 participants in the Million Veteran Program. Am. J. Psychiatry 177, 223–232 (2020). [DOI] [PMC free article] [PubMed] [Google Scholar]
- 53.Selzam S, Coleman JRI, Caspi A, Moffitt TE, & Plomin R. A polygenic p factor for major psychiatric disorders. Transl. Psychiatry 8, 205 (2018). [DOI] [PMC free article] [PubMed] [Google Scholar]
- 54.Karlsson Linner R. et al. Genome-wide association analyses of risk tolerance and risky behaviors in over 1 million individuals identify hundreds of loci and shared genetic influences. Nat. Genet. 51, 245–257 (2019). [DOI] [PMC free article] [PubMed] [Google Scholar]
- 55.Lee JJ et al. Gene discovery and polygenic prediction from a genome-wide association study of educational attainment in 1.1 million individuals. Nat. Genet. 50, 1112–1121 (2018). [DOI] [PMC free article] [PubMed] [Google Scholar]
- 56.Polimanti R. et al. Association of economic status and educational attainment with posttraumatic stress disorder: a Mendelian randomization study. JAMA Netw. Open 2, e193447 (2019). [DOI] [PMC free article] [PubMed] [Google Scholar]
- 57.Meschede J. et al. The parkin-coregulated gene product PACRG promotes TNF signaling by stabilizing LUBAC. Sci. Signal. 13, eaav1256 (2020). [DOI] [PMC free article] [PubMed] [Google Scholar]
- 58.Dunsmoor JE et al. Role of human ventromedial prefrontal cortex in learning and recall of enhanced extinction. J. Neurosci. 39, 3264–3276 (2019). [DOI] [PMC free article] [PubMed] [Google Scholar]
- 59.Maddox SA, Hartmann J, Ross RA & Ressler KJ Deconstructing the gestalt: mechanisms of fear, threat, and trauma memory encoding. Neuron 102, 60–74 (2019). [DOI] [PMC free article] [PubMed] [Google Scholar]
- 60.Chrousos GP & Zoumakis E. Milestones in CRH research. Curr. Mol. Pharmacol. 10, 259–263 (2017). [DOI] [PubMed] [Google Scholar]
- 61.Dunlop BW et al. Corticotropin-releasing factor receptor 1 antagonism is ineffective for women with posttraumatic stress disorder. Biol. Psychiatry 82, 866–874 (2017). [DOI] [PMC free article] [PubMed] [Google Scholar]
- 62.Pape JC et al. DNA methylation levels are associated with CRF1 receptor antagonist treatment outcome in women with post-traumatic stress disorder. Clin. Epigenetics 10, 136 (2018). [DOI] [PMC free article] [PubMed] [Google Scholar]
- 63.Stein MB & Smoller JW Precision psychiatry - will genomic medicine lead the way? JAMA Psychiatry 75, 663–664 (2018). [DOI] [PubMed] [Google Scholar]
- 64.Craske MG, Fanselow M, Treanor M. & Bystritksy A. Cholinergic modulation of exposure disrupts hippocampal processes and augments extinction: proof-of-concept study with social anxiety disorder. Biol. Psychiatry 86, 703–711 (2019). [DOI] [PMC free article] [PubMed] [Google Scholar]
- 65.Maksymetz J. et al. M1 muscarinic receptors modulate fear-related inputs to the prefrontal cortex: implications for novel treatments of posttraumatic stress disorder. Biol. Psychiatry 85, 989–1000 (2019). [DOI] [PMC free article] [PubMed] [Google Scholar]
- 66.Marvar PJ et al. Angiotensin type 1 receptor inhibition enhances the extinction of fear memory. Biol. Psychiatry 75, 864–872 (2014). [DOI] [PMC free article] [PubMed] [Google Scholar]
- 67.Shekhar A. Angiotensin type 1 receptor antagonists-a novel approach to augmenting posttraumatic stress disorder and phobia therapies? Biol. Psychiatry 75, 836–837 (2014). [DOI] [PubMed] [Google Scholar]
- 68.Pulcu E. et al. The effects of the angiotensin II receptor antagonist losartan on appetitive versus aversive learning: a randomized controlled trial. Biol. Psychiatry 86, 397–404 (2019). [DOI] [PubMed] [Google Scholar]
- 69.Huckins LM et al. Analysis of genetically regulated gene expression identifies a prefrontal PTSD gene, SNRNP35, specific to military cohorts. Cell Rep. 31, 107716 (2020). [DOI] [PMC free article] [PubMed] [Google Scholar]
- 70.Martin AR et al. Human demographic history impacts genetic risk prediction across diverse populations. Am. J. Hum. Genet. 100, 635–649 (2017). [DOI] [PMC free article] [PubMed] [Google Scholar]
- 71.Girgenti MJ & Duman RS Transcriptome alterations in posttraumatic stress disorder. Biol. Psychiatry 83, 840–848 (2018). [DOI] [PubMed] [Google Scholar]
- 72.Le-Niculescu H. et al. Towards precision medicine for stress disorders: diagnostic biomarkers and targeted drugs. Mol. Psychiatry 25, 918–938 (2020). [DOI] [PMC free article] [PubMed] [Google Scholar]
- 73.Smith AK et al. Epigenome-wide meta-analysis of PTSD across 10 military and civilian cohorts identifies methylation changes in AHRR. Nat. Commun. 11, 5965 (2020). [DOI] [PMC free article] [PubMed] [Google Scholar]
- 74.Li M. et al. Integrative functional genomic analysis of human brain development and neuropsychiatric risks. Science 362, eaat7615 (2018). [DOI] [PMC free article] [PubMed] [Google Scholar]
METHODS-ONLY REFERENCES
- 75.Das S. et al. Next-generation genotype imputation service and methods. Nat. Genet. 48, 1284–1287 (2016). [DOI] [PMC free article] [PubMed] [Google Scholar]
- 76.Purcell S. et al. PLINK: a tool set for whole-genome association and population-based linkage analyses. Am. J. Hum. Genet. 81, 559–575 (2007). [DOI] [PMC free article] [PubMed] [Google Scholar]
- 77.Price AL et al. Principal components analysis corrects for stratification in genome-wide association studies. Nat. Genet. 38, 904–909 (2006). [DOI] [PubMed] [Google Scholar]
- 78.Genomes Project C. et al. A global reference for human genetic variation. Nature 526, 68–74 (2015). [DOI] [PMC free article] [PubMed] [Google Scholar]
- 79.Wolfe D, Dudek S, Ritchie MD & Pendergrass SA Visualizing genomic information across chromosomes with PhenoGram. BioData Min. 6, 18 (2013). [DOI] [PMC free article] [PubMed] [Google Scholar]
- 80.Watanabe K, Taskesen E, van Bochoven A. & Posthuma D. Functional mapping and annotation of genetic associations with FUMA. Nat. Commun. 8, 1826 (2017). [DOI] [PMC free article] [PubMed] [Google Scholar]
- 81.Bulik-Sullivan BK et al. LD Score regression distinguishes confounding from polygenicity in genome-wide association studies. Nat. Genet. 47, 291–295 (2015). [DOI] [PMC free article] [PubMed] [Google Scholar]
- 82.Koenen KC et al. Common genetic liability to major depression and posttraumatic stress disorder in men. J. Affect. Disord. 105, 109–115 (2008). [DOI] [PMC free article] [PubMed] [Google Scholar]
- 83.Wray NR et al. Genome-wide association analyses identify 44 risk variants and refine the genetic architecture of major depression. Nat. Genet. 50, 668–681 (2018). [DOI] [PMC free article] [PubMed] [Google Scholar]
- 84.Grotzinger AD et al. Genomic structural equation modelling provides insights into the multivariate genetic architecture of complex traits. Nat. Hum. Behav. 3, 513–525 (2019). [DOI] [PMC free article] [PubMed] [Google Scholar]
- 85.Dastani Z. et al. Novel loci for adiponectin levels and their influence on type 2 diabetes and metabolic traits: a multi-ethnic meta-analysis of 45,891 individuals. PLoS Genet. 8, e1002607 (2012). [DOI] [PMC free article] [PubMed] [Google Scholar]
- 86.Choi SW & O’Reilly PF PRSice-2: Polygenic Risk Score software for biobank-scale data. Gigascience 8, giz082 (2019). [DOI] [PMC free article] [PubMed] [Google Scholar]
Associated Data
This section collects any data citations, data availability statements, or supplementary materials included in this article.


