

Abstract
Breathing tracking is critical for the assessment of lung functions, exercise physiologies, and energy expenditure. Conventional methods require using a face mask or mouthpiece that is connected to a stationary equipment through a tube, restricting the location, movement, or even the posture. To obtain accurate breathing physiology parameters that represent the true state of the patient during different scenarios, a wearable technology that has less intervention to patient’s activities in free-living conditions is highly preferred. Here, we propose a miniaturized, reliable, and wide-dynamic ranged flow sensing technology that is immune to orientation, movement, and noise. As far as we know, this is the first work of introducing a fully integrated mask device focusing on breath tracking in free-living conditions. There are two key challenges for achieving this goal: miniaturized flow sensing and motion-induced artifacts elimination. To address these challenges, we come up with two technical innovations: 1) in hardware wise, we have designed an integrated flow sensing technique based on differential pressure Pneumotach approach and motion sensing; 2) in software wise, we have developed comprehensive algorithms based baseline tracking and orientation and motion compensation. The effectiveness of the proposed technology has been proven by the experiments. Experimental results from simulator and real breath conditions show high correlation (R2 = 0.9994 and 0.9964 respectively) and mean error within 2.5% for Minute Volume (VE), when compared to values computed from reference methods. These results show that the proposed method is accurate and reliable to track the key breath parameters in free-living conditions.
Keywords: breathing tracking, differential pressure pneumotach, face mask, wearable device
I. Introduction
BREATHING, or pulmonary ventilation, is a cardiopulmonary process, which is essential to the metabolism of human body. The primary role of the respiratory process is to support the gas exchange between the ambient air and the body by supplying O2 and removing CO2 from the blood. Two processes are involved in the O2 and CO2 exchange pathway: ventilation, a mechanical process that allows air move in and out of lung; and diffusion, a gas exchange process to transfer the O2 into and CO2 from alveoli, blood and cells.
The ventilation process carries rich health information, including pulmonary functions, breath biomarkers, and metabolic rate. Pulmonary function tests (PFTs) are used for lung disease diagnosis and spirometry is the most widely used PFTs method. By measuring breathing parameters such as vital capacity (VC), Forced vital capacity (FVC), Forced expiratory volume (FEV), Peak expiratory flow (PEF), and Tidal volume (TV) from breath patterns, lung diseases, such as Chronic Obstructive Pulmonary Disease (COPD) and asthma, can be diagnosed by spirometry [1]–[4]. The breath flow rate measurement is the key function of the spirometer [5]–[7].
Breath biomarkers are widely used for disease diagnosis [8]–[11]. Since the concentration of biomarkers can be influenced by the exhalation flow rate, in practice, breath analyzers are usually integrated with flow sensors. For example, it is recommended to measure fractional exhaled nitric oxide (FeNO) at exhalation flow rate of 50 ml/s [12]. Some breath biomarkers are required to be measured during the end of exhalation phase, i.e., the end-tidal region [13], [14]. Thus, breath flow rate tracking is also essential for accurately measuring the breath biomarkers concentration. As for metabolic rate or energy expenditure measurement, breathing tracking is the key for determining the minute ventilation and then the metabolic rate [15]–[17]. In summary, Breath flow rate monitoring is a key step in all of the above-mentioned breath analysis based diagnosis techniques: spirometry, breath analyzers, and indirect calorimetry.
Measurement equipment itself can be an intervention to patient’s physical or psychological status. Maintaining a natural state in free-living condition is very important for measuring true physiology parameters. Wearable devices are considered to be the ideal solution for monitoring true physiology parameters in free living conditions since they provide unobtrusive sensing methods [18]–[20]. Smart watch, ring, glasses, and wrist band have been developed or even commercialized for monitoring heart rate, SpO2, or some biomarkers [21]–[27]. Since wearable devices can be easily deployed to a large population of users in their daily life, large scale epidemiologic studies can be performed. A recent study by analyzing the sleep patterns of millions of Fitbit users’ data provided insights of sleep and revealed how age, gender, and duration affect sleep quality [28].
As for breathing tracking, we believe a wearable, lightweight, less flow resistant mask device will be a competitive candidate. Though using wearables for breath tracking is attractive, there are two technical challenges to overcome: 1)find an effective way to deal with the motion-induced artifacts; 2) find a miniaturized, reliable, and wide dynamic range flow sensing technology. Motion-induced artifact is an intrinsic challenge for wearable healthcare devices. Several approaches have been applied to address this issue on different wearable platforms, such as respiratory rate monitor, photoplethysmography (PPG) monitor, and heart rate monitor [29]–[33]. Typically, redundant sensors such as gyroscope and accelerator are implemented in the device together with the signal processing algorithms for compensation and correction [34].
There are three common ways for breath flow rate measurement: turbine flow meter, ultrasonic flow meter, and differential pressure Pneumotach approach. In the turbine flow meter, the volumetric flow rate is determined by measuring the speed of the rotor [7]. This method has wide dynamic range and low flow resistance, but the accuracy and response time are compromised because of the inertial effect. The ultrasonic flow meter measures the gas flow rate by detecting the frequency shift of an ultrasonic wave transmitted through flowing gas due to the Doppler effect [35]. This method is reliable and requires less maintenance, but it is expensive and sensitive to temperature. The differential pressure Pneumotach approach quantifies the gas volume flow rate by measuring pressure difference created by the orifice in the flow channel [36]–[38]. This method is a simple and fast-response way for breath flow rate measurement. Since there is no breath passing through the pressure sensor, the contamination to the sensor is avoided, which is important to preserve the stability and accuracy of the sensor. This method has been widely used for breathing detection, such as spirometers and metabolic carts. Since the size of the MEMS based pressure sensor is tiny and the dimension of the mechanical orifice can be small, the entire flow measurement module could be miniaturized for wearable breathing tracking. Moreover, MEMS based pressure sensor has wide tolerance to humidity and temperature variance in breath condition and is less power-hungry, which makes it attractive for wearable platforms.
Here we have reported an integrated flow sensing method based on differential pressure Pneumotach approach, motion sensing, and smart data processing algorithms for breathing tracking in free-living conditions. Results show that this technology can be easily implemented in a face mask for wearable breathing tracking in free-living conditions. The reported technology can be widely used in the development of wearable healthcare devices for pulmonary function diagnosis, breath biomarkers detection, and metabolic rate measurement.
II. System Design and Sensing Principle
A. Design of Differential Pressure-Based Flow Measurement Module
As shown in Fig. 1 (a), the differential pressure-based flow measurement module consists of a miniaturized Venturi tube and a D6F-P MEMS flow sensor for breath flow rate measurement. The Venturi tube is widely used for fluid flow rate measurement, such as water meter, gasoline meter, and gas flow meter. Its geometry helps to build pressure change by varying the diameter along the flow channel. As shown in Fig. 1 (b) and (c), the face mask covers the nose and the mouth of the patient. The face mask uses one-way valves in two channels to separate inhalation and exhalation during breathing. The Venturi tube is connected to the exhalation channel of the mask. Thus, only the exhalation flow is monitored by the MEMS sensor and recorded by the circuit.
Fig. 1.
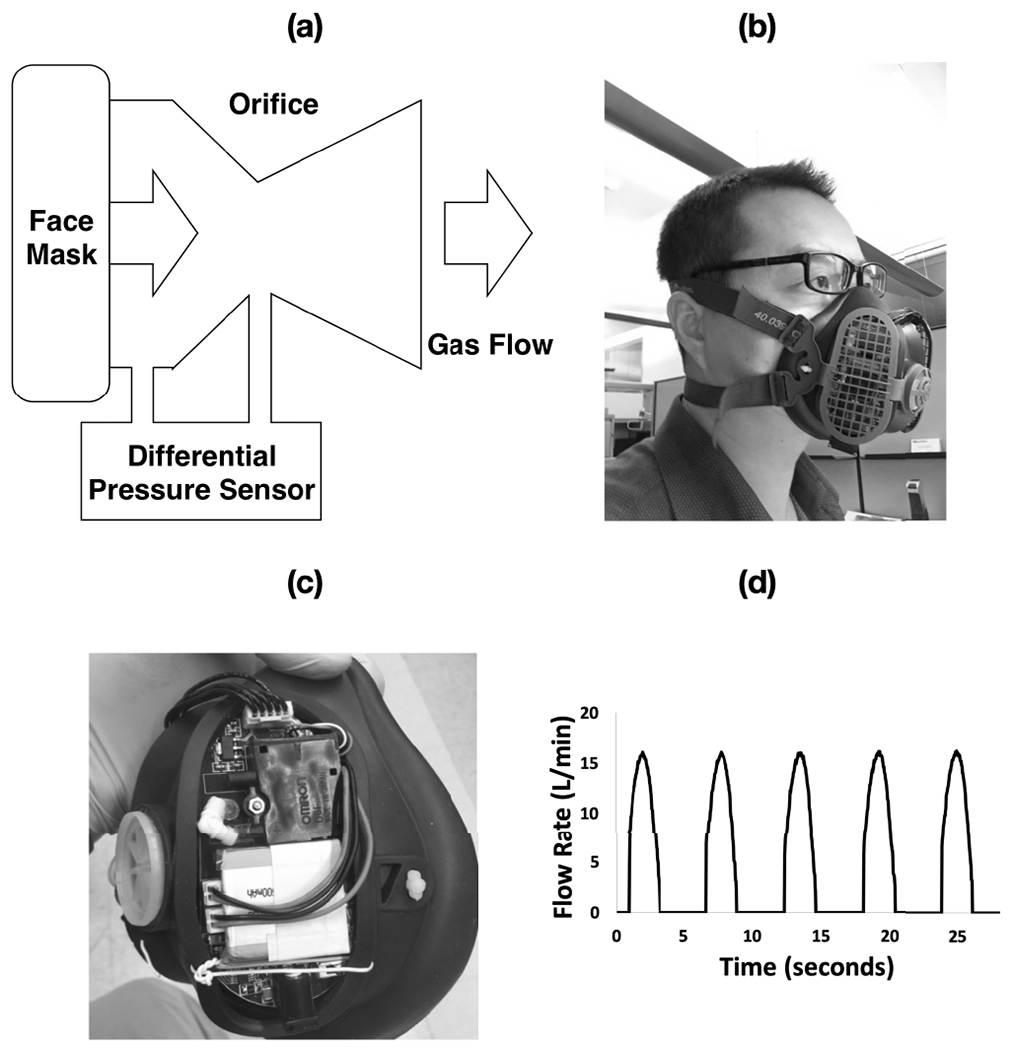
The differential pressure Pneumotach setup integrated on face mask. (a)flow module configuration, (b) mask device worn by subject, (c) integrated components, and (d) profile of breath signal.
B. Sensing Principle
As for this application, the relationship between differential pressure and the flow velocity can be quantitatively described by the simplified Bernoulli equation, assuming the potential energy component to be zero:
| (1) |
where ΔP is the pressure difference, ρ is the breath density, and V is the flow velocity at the orifices. The volume flow rate can be determined from the flow velocity at the orifice and the area of the orifice cross section.
Fig. 1 (d) shows the typical exhalation flow pattern measured by the MEMS sensor. The peaks correlate with the flow rate profile of each exhalation cycle. The flat baselines between two consecutive peaks indicate that there is no back flow via the Venturi tube during inhalation cycles since the gas moves into the mask through the inhalation channel.
III. Materials and Methods
A. Materials
The lung simulator used ambient air for flow tests. Gas cylinder with breathing grade air (Praxair Certified Breath Air) was used to calibrate the flow module.
B. Apparatus
The D6F-P MEMS flow sensor from Omron Electronics Inc (Manufacturer Part number: D6F-P0010A2) was used as the differential pressure transducer to measure the pressure difference at the orifice of the flow channel in the configuration illustrated in Fig. 1. The D6F-P MEMS flow sensor is a compact (10 mm× 27 mm × 35 mm), light-weighted (8.5 g), high-accuracy (±5% FS) flow sensor with superior resistance to environments.
A low-power three-axis angular rate sensor, the MEMS Motion Sensor 3-Axis Digital Output Gyroscope from STMi-croelectronics (Manufacturer Part number: L3GD20H), is integrated in the circuit to measure the orientation change of the mask device during breathing monitoring and the its signal is used to compensate the baseline drift of the MEMS pressure sensor.
A home-made integrated circuit was built to provide input voltage to the D6F-P MEMS flow sensor, read the output voltage signal, perform signal processing, and wirelessly transmit the data from the circuit to a customized smart phone app.
Android & iOS-based applications were developed to wirelessly receive the data transmitted from the circuit, store the data, and perform further data processing and analysis.
A compact (5 mm × 30 mm × 35 mm) lithium ion polymer battery (3.7 V, 500 mAh) was used to provide the power to the entire circuit.
A miniaturized Venturi tube with the orifice diameter of 7.4 mm and length of 46 mm was machined and installed on the exhalation channel of a face mask.
A face mask with separated channels for inhalation and exhalation was used in the test. One-way valves were used in the inhalation and exhalation channels.
Sensirion flow sensor (SFM3000, Sensirion AG) is used as the reference flow meter for the flow module calibration.
A lung simulator from VacuMed was used to simulate breathing patterns with different tidal volume and breath frequency to test the accuracy of the differential pressure-based flow measurement module.
C. Methods
The face mask integrated with circuit, D6F-P MEMS flow sensor, battery, and Venturi tube was worn by subjects via a headgear during the measurement.
For the tests involving lung simulator, the integrated mask device was connected to the gas outlet of the lung simulator via a customized adaptor.
The differential pressure was obtained by connecting D6F-P MEMS flow sensor to the venturi in the bypass configuration to measure high flow rate, as depicted in Fig. 1 (a) [39]. The differential pressure was calculated from the pressure sensor signal using the following equation:
| (2) |
where Δ P is the differential pressure (in Pa), Output (no flow) and Output (flow) is the voltage measured on the output pin of the pressure sensor (in mV) during no flow and active flow through the venturi tube, respectively.
The flow calibration was performed by connecting the mask device in series with a Sensirion flow sensor (SFM3000, Sensirion AG) through a connector. Dry air from an air cylinder was introduced to the device through tubing. The flow rate was adjusted in the range of 0 - 150 L/min to calibrate the flow module of the mask device.
IV. Results and Discussion
A. Breathing Profile Monitoring
The breathing profile from a subject for 11 minutes measurement is shown in Fig. 2 (a). The exhalation flow pattern has been reliably detected by the MEMs sensor. since the MEMs sensor has a fast response time (a sampling rate of 25 ms has been used during the measurement), detailed dynamic features can be captured, as shown in zoom-in plots in Fig. 2 (b) and (c). There are no obvious peaks during the first ~ 30 s because that is the time for the subject to wear the mask. By looking at the entire breath profile, we have noticed that it takes about 1 minute for the subject to stabilize their breathing. There are several high peaks in the middle of the test, which is correlated with the deep breath the subject has taken.
Fig. 2.
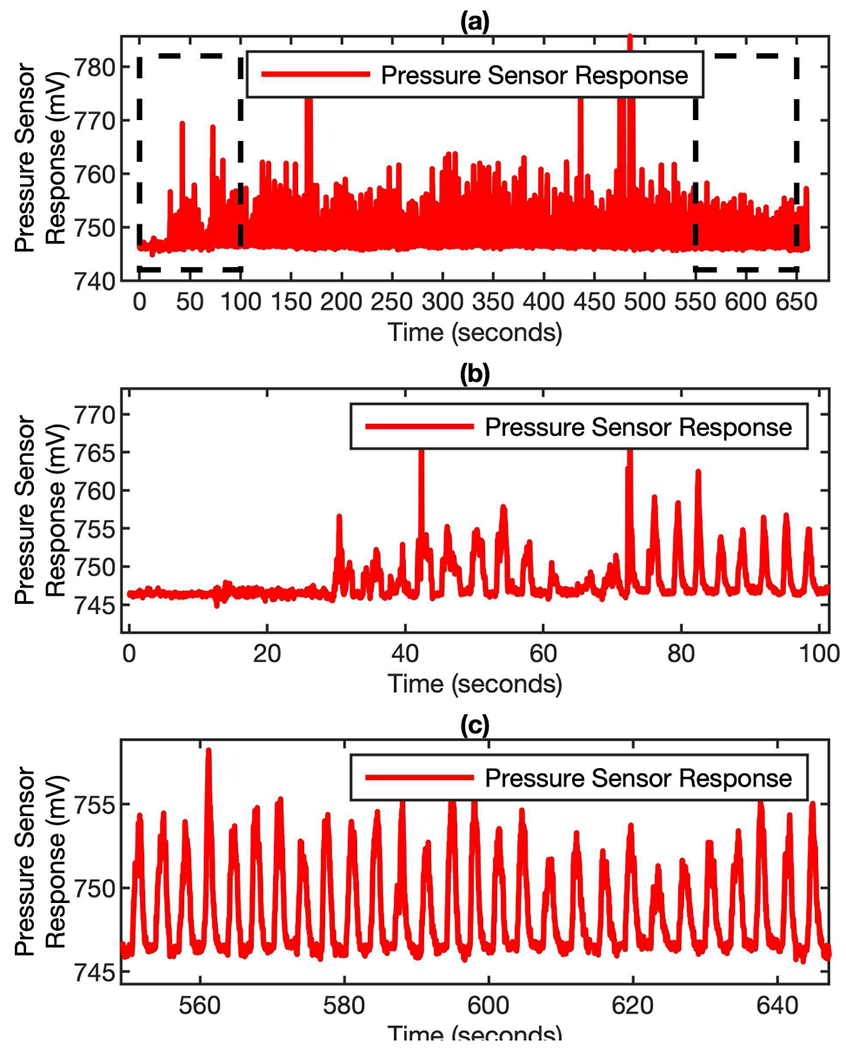
Pressure signal of breathing profile from real breath. (a) the entire breathing profile recorded by the MEMS sensor for 11 minutes monitoring. (b) and (c) are the zoom-in plots of the profile at the beginning and the end of the measurement.
To convert the pressure signal into breathing flow rate, a flow calibration needs to be performed. By connecting the mask device in serial with a reference flow sensor, sensirion flow sensor (sFM3000, sensirion AG), and introducing air from an air cylinder to the system, the pressure reading at different flow rate can be measured and recorded. The flow rate is adjusted in the range of 0 - 150 L/min to calibrate the flow module of the mask device. This flow range is chosen because it is a typical exhalation flow rate range for adults during resting condition.
According to Bernoulli equation (1), the flow rate is proportional to the square root of the differential pressure. By running the linear regression of the flow rate and the square root of the differential pressure, a slope can be obtained. This slope serves as the converting factor to translate differential pressure reading into exhalation flow rate. The differential pressure is defined at the difference between the-real time pressure reading and the pressure baseline. The pressure baseline is the pressure sensor reading when there is no gas passing through the Venturi tube. As shown in Fig. 3, the pressure profile (Fig. 3 (a)) can be reliably converted into flow rate profile (Fig. 3 (d)). This conversion is critical for determining key breathing parameters, such as peak flow rate, tidal volume, breath frequency, and minute ventilation. From the exhalation flow rate profile, the steady state of the breathing can be easily identified, which is important for determining whether the subject has reached a stable resting condition or not in resting metabolic rate measurement.
Fig. 3.
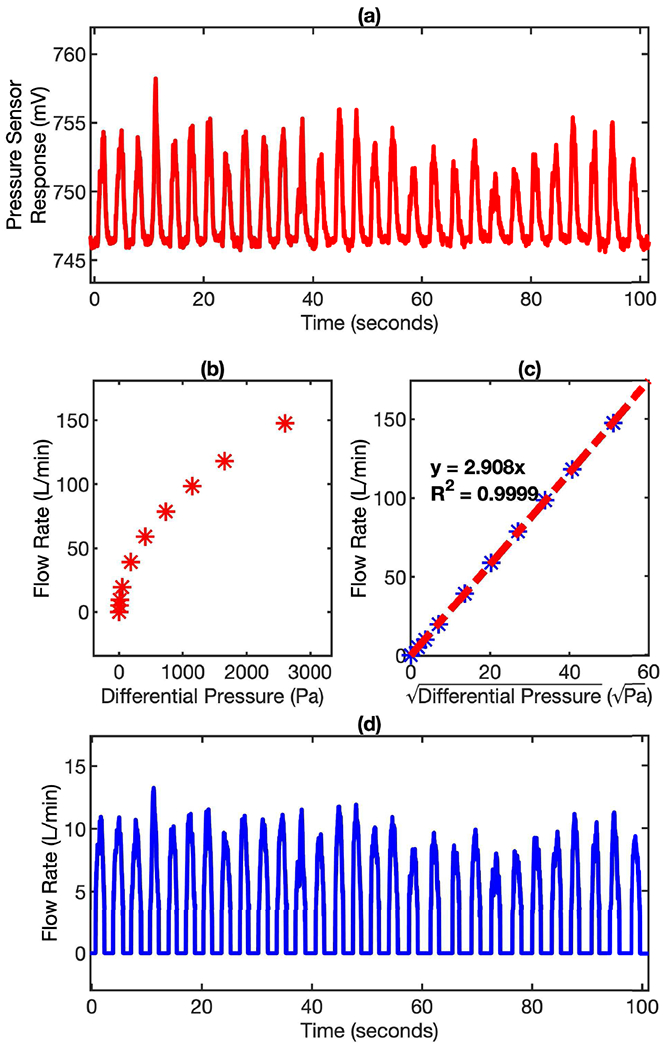
Pressure signal to flow signal conversion. (a) the pressure response profile recorded by the MEMS sensor during breathing. (b) the response of pressure sensor (Differential Pressure) for various exhalation flow rates. (c) the linear relationship between and flow rate. (d) the flow rate profile of the same breathing profile converted by applying the calibration factors to the pressure signal.
B. Algorithms for Robust Breathing Flow Rate Monitoring
It is well-known that MEMs pressure sensor are sensitive to gravity and mechanical movement. This is a key challenge for reliable and robust breathing flow rate monitoring in wearable devices, since the users can wear the devices and have different kinds of activities in the free-living conditions. The transducer inside the MEMs pressure sensor is a membrane which can deform under different pressure. Thus, when there is orientation change the gravity will cause the membrane to deform and result in signal drifting. if there is no mechanism to compensate or correct the non-flow-related signal, a high error is expected during the breathing tracking.
Two innovative strategies have been proposed to address this issue: the firmware approach and the hardware approach. The firmware approach is purely based on signal processing algorithm while the hardware approach involves the use of 3-axis digital output gyroscope to compensate the baseline drift of the MEMs pressure sensor.
The key concept of the firmware approach is to develop an algorithm that can automatically track the baseline of the MEMs pressure sensor for each breath cycle. if we zoom in the breath profile recorded by the MEMs pressure sensor, each breath cycle can be described in 4 different phases: Baseline, Ramp-Up, Positive Flow, and Ramp-Down, as illustrated in Fig. 4 (a). The algorithm can be explained in the steps below and illustrated in Fig. 4 (b).
Fig. 4.
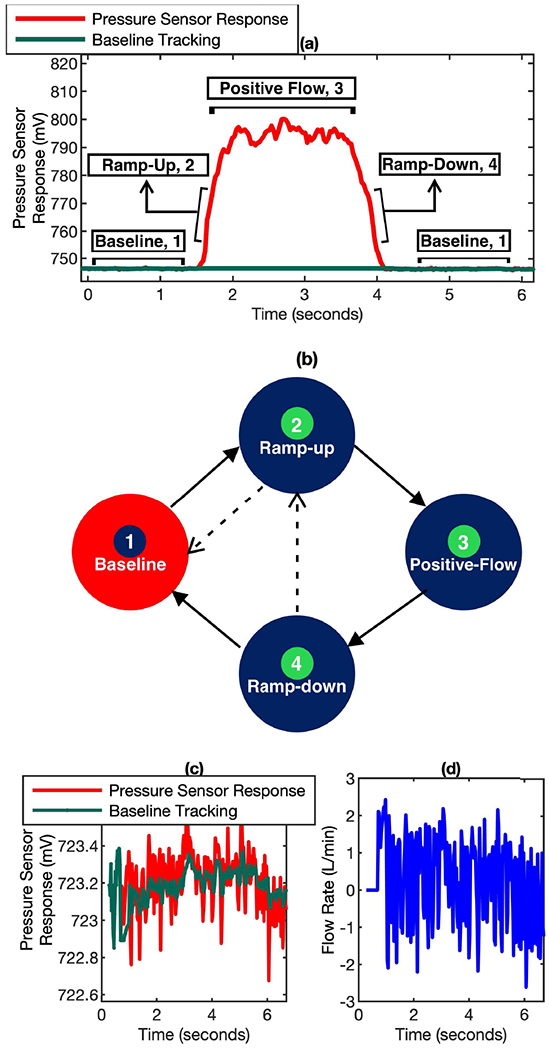
(a) A typical breath cycle with different phases (Baseline, Ramp-up, Positive Flow, Ramp-down). (b) The relationship of various phases in a breath cycle. The arrows indicate all the valid transitions possible between phases. (c) The noise of pressure sensor response at baseline, along with the weighted average tracking. (d) The noise indicated in plot (c) converted to flow rate.
1). Baseline:
Indicates the end of current cycle/start of next cycle. This is the inhalation part of breathing process. it is important to keep track of this baseline to determine the rest of the phases. In this phase, the baseline required for computing flow rate is obtained using weighted average. It gives preference to the data points closer to the ramp-up phase so that the baseline is as precise as possible, but also has weightage for the history of baseline phase involved, so that it does not drift away with noise fluctuations.
2). Ramp-Up:
Indicates the end of inhalation phase and the beginning of exhalation phase of current cycle. This phase acts as a bridge between baseline and positive flow. This is determined by using a pattern of rise in pressure. An increasing/rising pattern of pressure data for a given window of points indicates start of exhalation or ramp-up phase.
3). Positive Flow:
Indicates the exhalation part of the breathing process. The flow rate is positive during this phase, which is used to compute critical parameters like tidal volume and peak flow rate.
4). Ramp-Down:
Indicates the end of exhalation part and end of current breath cycle. This phase acts as a bridge between positive flow and baseline. A decreasing/falling pattern of pressure data for a given window of points indicates end of exhalation or ramp-down phase.
As shown in Fig. 4 (c) and Fig. 4 (d), the mean noise at baseline is 0.25 L/min (S.D. = 1.0 L/min). It is important to consider the noise at baseline to determine the right start of ramp-up phase or ramp-down phase. This is also an indicator of the lowest reliable flow rate that can be derived from the pressure signal.
Number of ramp-up or ramp-down phases encountered in a window of one minute indicates Breath Frequency (BF) of that window. The integral of flow rate over time i.e., Volume, for a window one minute indicates Minute Ventilation (VE). The average volume over the set of breath cycles in the window indicates the Tidal Volume (TV).
In Fig. 4 (b), transitions between phases with solid arrows indicates regular and repeated occurrence. The transitions with dotted arrows indicate influence of gravity or mechanical movement induced artifacts over the breath cycle. By identifying the artifacts though the analysis of the four phases, the true baseline of the MEMS pressure sensor for each breath cycle can be obtained.
The effectiveness of the baseline tracking algorithm has been verified by the data shown in Fig. 5. In the plot, the red curve is the real-time pressure sensor response and the green curve at the bottom is the simultaneous baseline data generated by the baseline tracking algorithm in a breathing test. As shown clearly in the zoom-in plot in Fig. 5 (b), the baseline of the MEMS pressure sensor keeps drifting because of the mask device orientation change during the 2 minutes breathing monitoring period. But the baseline tracking algorithm can precisely determine the baseline reading for each individual breathing cycle. The baseline reading is calculated by averaging the MEMS pressure sensor signal from the inhalation period (typically 1 – 2 seconds for most of the adult subjects) right before the exhalation period. In this way, the influence from the noise can be minimized. This algorithm ensures that only the true differential pressure signal generated by the gas flow will be used for breathing flow rate determination.
Fig. 5.
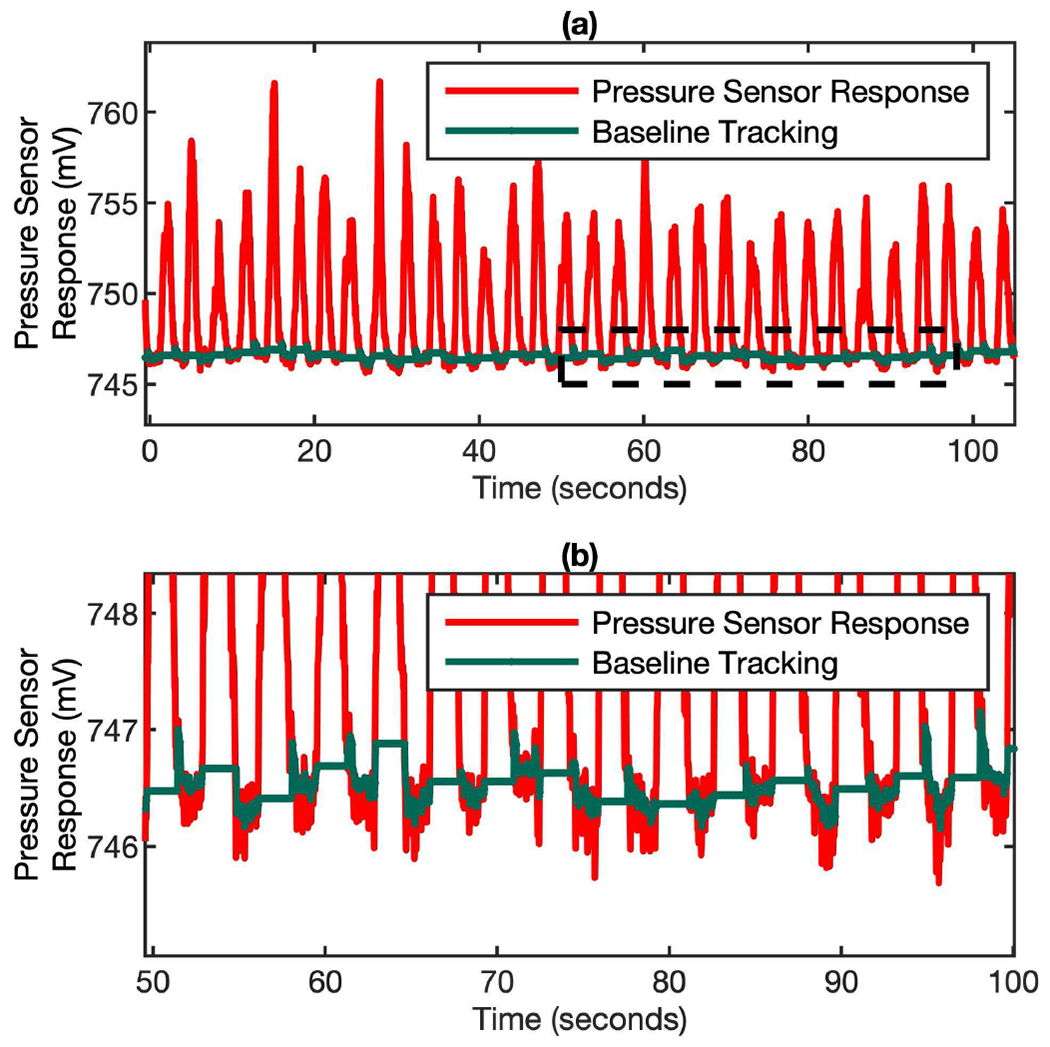
Dynamic baseline tracking on a cycle-by-cycle basis over time. (a) The pressure sensor response (red) and simultaneous baseline tracking (green) in a real breathing test. (b) The zoom-in of plot (a) to show the baseline tracking algorithm can accurately determining the baseline for each individual cycle when the pressure sensor signal is drifting.
The hardware approach has also been used to eliminate the orientation induced artificial signal from the MEMS pressure sensor. This method is complementary to the baseline tracking algorithm mentioned above. The baseline tracking algorithm is capable of dealing with gradual drift in the baseline but may not be able to catch signal jump due to sudden and dramatic orientation change, which may cause the losing of baseline tracking. In this case, the signal from gyroscope can provide the fast-response and quantitative information to compensate the baseline drift of the MEMS pressure sensor.
As shown in Fig. 6 (a) and (b), the responses of the MEMS pressure sensor and the gyroscope due to the orientation change correlate very well with each other. Because both sensors are fast-response, delay is not observed in the plots. This feature makes the signal synchronization between these two sensors easy and simple. The quantitative correlation between the pressure sensor response and the accumulated angle on Y-Axis of the gyroscope is potted in Fig. 6 (c). It’s clear that there is a linear relationship between these two responses and the correlation factor R square is as high as 0.9161. The response from Y-Axis of the gyroscope is chosen because it is the most sensitive component in our mask device configuration. Head and neck movements like forward chin touch and head back (up and down, or along the pitch axis of the mask device) correspond to the changes that show up in the Y-Axis of the gyroscope. Neck flexion towards shoulders, i.e., along other axes does not noticeably affect the response of the pressure sensors. The linear relationship between MEMS pressure sensor and gyroscope provides a solid foundation for the signal compensation algorithm in eliminating the orientation-induced artificial signal in our wearable breathing tracking device.
Fig. 6.
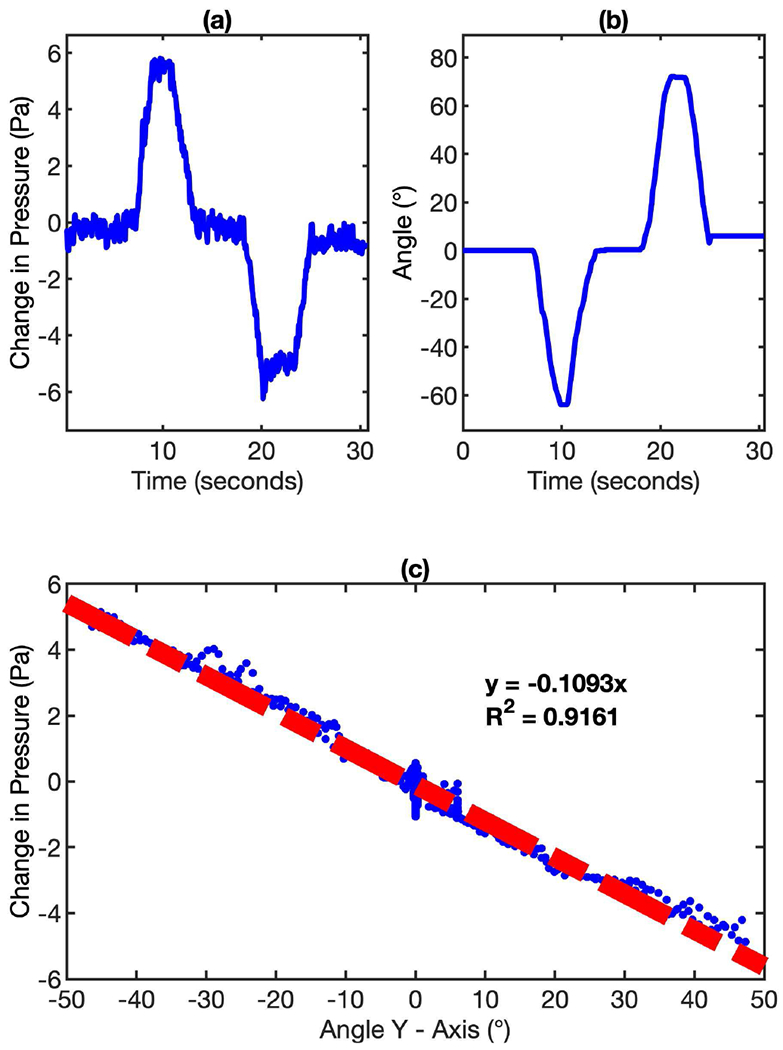
The relationship between MEMS pressure sensor response and gyroscope response due to orientation change. (a) The change of pressure sensor response due to the orientation change of the mask device. (b) The accumulated angle measured by gyroscope due to the orientation change of the mask device. (c) The linear relationship between the pressure sensor response and the accumulated angle on Y-Axis of the gyroscope.
Fig. 7 shows the effectiveness of the gyroscope-assisted MEMS pressure sensor signal correction to keep track of the correct baseline. When there is a sudden orientation change in the middle of the measurement (~ 70 s), the firmware approach is unable to keep the correct baseline tracking (Fig. 7 (a)). But when the gyroscope signal compensation algorithm is applied, the correct baseline tracking can be achieved (Fig. 7 (b)).
Fig. 7.
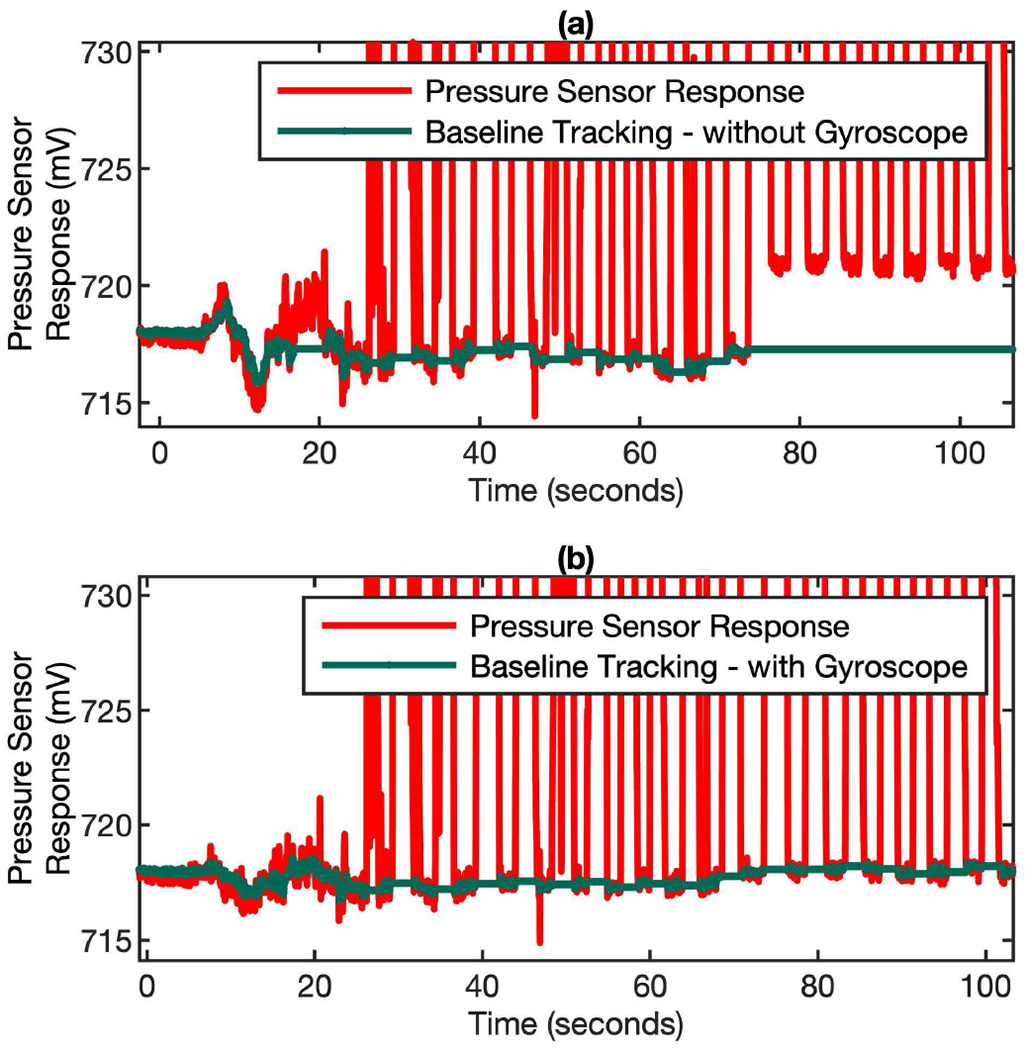
Gyroscope-assisted MEMS pressure sensor signal correction to keep track of the correct baseline for flow rate computation. (a) Baseline tracking without gyroscope correction. (b) The baseline tracking with gyroscope correction.
Though the firmware and hardware approaches can effectively get rid of the orientation-related artificial signals, in some rare cases, the permanently loss of baseline could possibly happen, as shown in Fig. 8 (a). This only happens when there is a sudden negative jump of baseline and then quickly recover to the original baseline right in the exhalation period. This is a very rare scenario. When this happens, the algorithm will consider the exhalation lasts forever and the positive flow phase will never come down to the baseline (Fig. 8 (a)). A simple remedy to this is to re-establish the baseline by exploiting the periodic pattern of the breathing. For normal breathing, the exhalation periods only last for a few seconds. Thus, if the positive flow phase is longer than a set time window (typically 15 seconds), it indicates a permanent loss of baseline. After the implementation of the window based positive flow checking algorithm, the baseline is corrected and continues to hold up well, as shown in Fig. 8 (b).
Fig. 8.
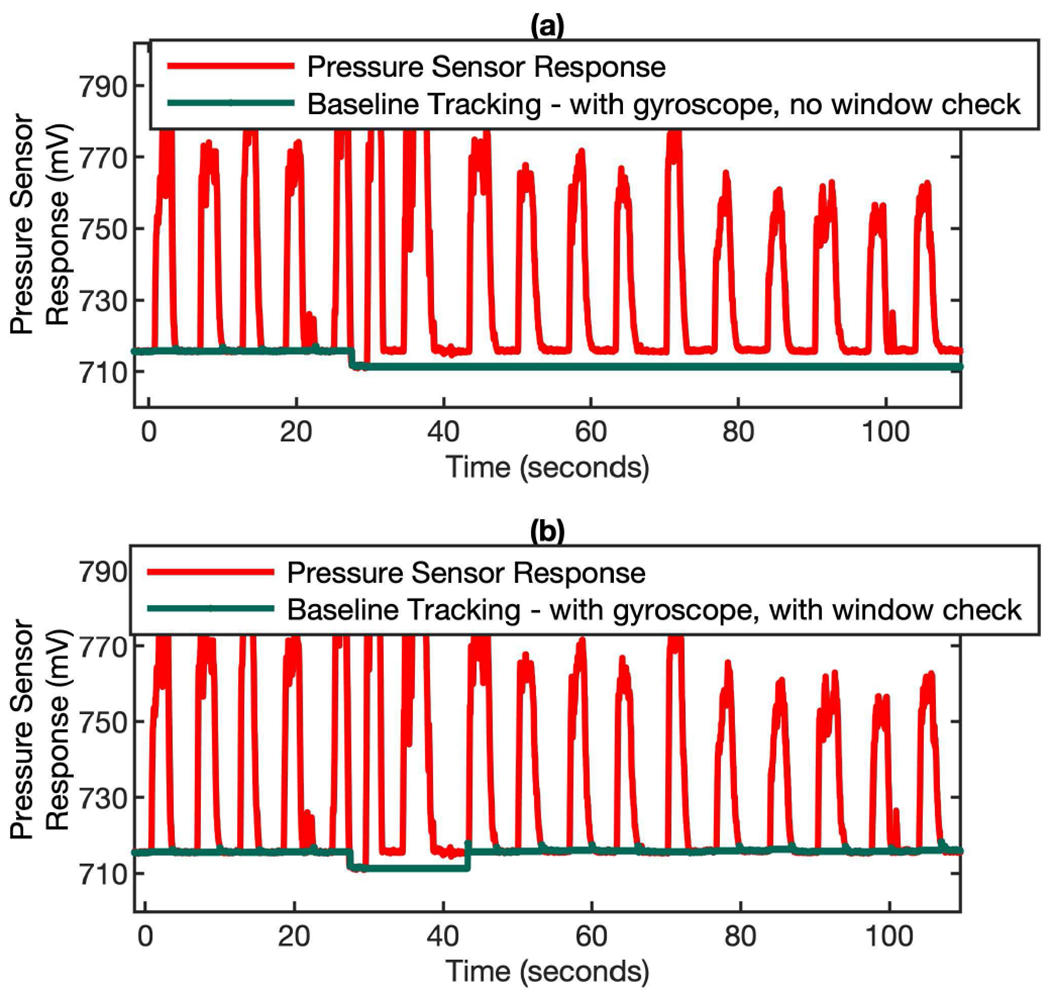
Baseline correction in the scenario of permanently lost baseline. If the positive flow phase lasts more than 15 seconds, the algorithm will re-establish the new baseline. (a) a sudden negative jump of baseline happened at ~ 30 s and then caused the permanently loss of baseline. (b) when the baseline checking algorithm is invoked periodically (every 15 sec), the new baseline can be re-established.
C. Validation of the Performance of Differential Pressure-Based Flow Measurement Module
The breathing tracking performance of the algorithm-enhanced MEMS pressure sensor was validated by both bench test and usability test. The bench test is performed by using the lung simulator to generate breathing patterns with different tidal volume (TV, 225 – 450 ml) and breath frequency (BF, 8.5 – 36 breath/min) and then deliver the gas to the mask device, which is connected with the Sensirion flow sensor in serial. In this way the algorithm-enhanced MEMS pressure sensor and the Sensirion flow sensor can measure the breathing flow rate simultaneously. Fig. 9 (a) and (b) indicate that the flow rate profiles recorded by both sensors almost overlap with each other at different breathing conditions. The minute ventilation (VE) measured by both sensors shows very high correlation in the range of 3,000 - 10,000 ml/min, with a slope of 0.9737 and R square of 0.9994. Further data analysis shows that the VE differences between these two sensors are within 2.5%, indicating a very high accuracy of the algorithm-enhanced MEMS pressure sensor.
Fig. 9.
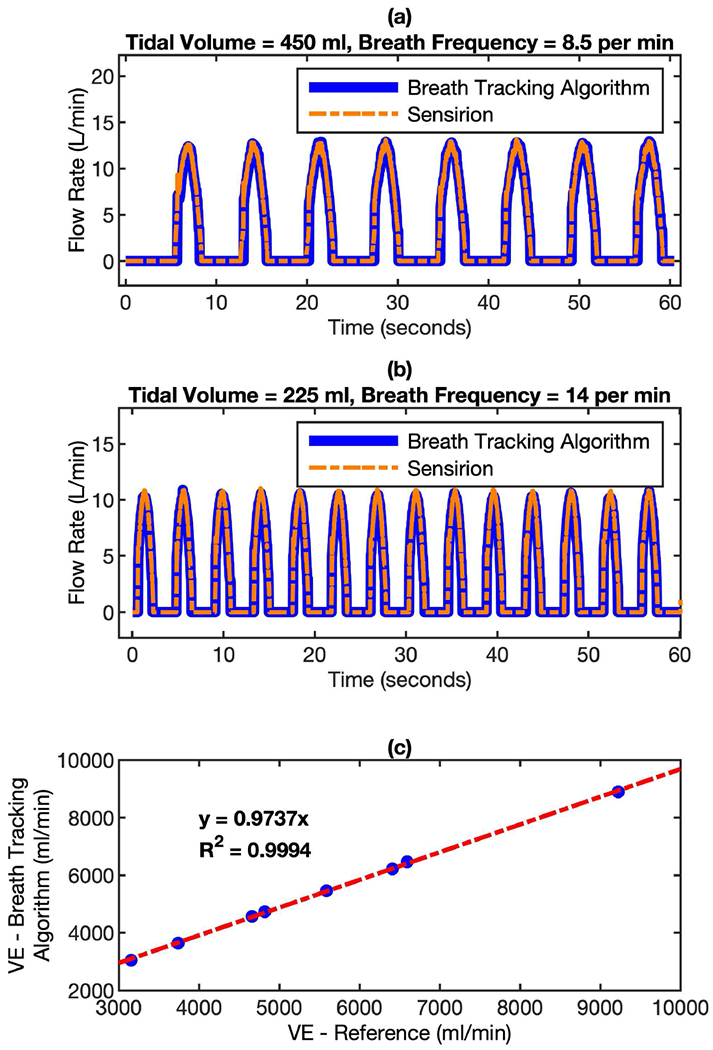
Comparison of flow rate measured by algorithm-enhanced MEMS pressure sensor with reference flow sensor using a lung simulator. The mask device and the Sensirion flow sensor were connected in serial in the setup. In this way, the gas from the lung simulator can pass through both sensors simultaneously. The breathing profiles were monitored by both sensors at different conditions. (a) tidal volume = 450 ml, breath frequency = 8.5 per minute; and (b) tidal volume = 225 ml, breath frequency = 14 per minute. (c) the correlation of minute ventilation (VE) between the readings of both sensors.
The usability test is performed on 8 different subjects (IRB Approval: STUDY00006562). Similar to the bench test configuration, the mask device, which was connected with the Sensirion flow sensor in series, was worn by the subject to complete a measurement that involves 10 minutes of continuous breathing monitoring. The test results are summarized in Fig. 10. Fig. 10 (a) and (b) show the typical breath profiles measured by algorithm-enhanced MEMS pressure sensor and Sensirion flow sensor. It’s clear that though the shape of individual breath cycles is very different, the real time flow rate measured by both sensors correlates very well, even preserving the detailed features of the breath cycles. The minute ventilation (VE) measured by both sensors has a correlation factor (R2) of 0.9964 and the mean of VE differences between these two sensors is within 2.5%. Since the real breath profiles from subjects are very diverse and can have the influence of motion-induced artifacts during the breathing tracking, the accuracy of the algorithm-enhanced MEMS pressure sensor is considered to be far more adequate.
Fig. 10.
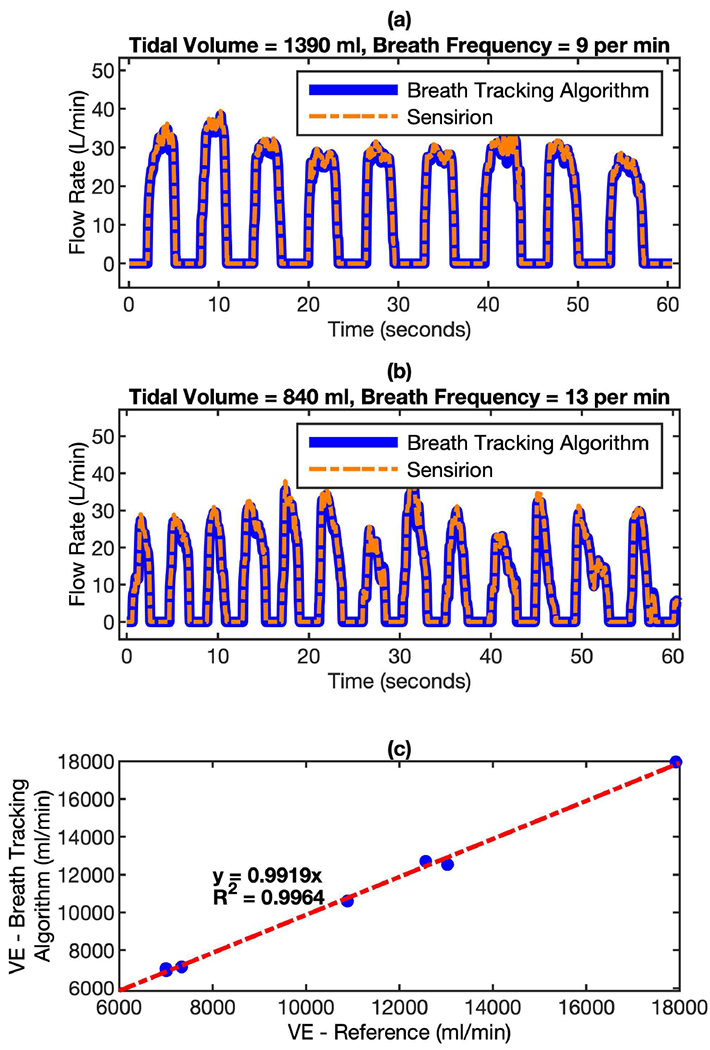
Comparison of flow rate measured by algorithm-enhanced MEMS pressure sensor with reference flow sensor for real breath test. The mask device and the Sensirion flow sensor were connected in serial in the setup. In this way, the breath from can pass through both sensors simultaneously. (a) Breath profile of subject-A: tidal volume = 1390 ml, breath frequency = 9 per minute; and (b) Breath profile of subject-B: tidal volume = 840 ml, breath frequency = 13 per minute. (c) the correlation of minute ventilation (VE) between the readings of both sensors.
To evaluate the performance of the baseline tracking algorithms under the influence of orientational changes and different motions, the device has been tested in typical daily life scenarios, such as walking, climbing etc. This experiment result demonstrates the reliability of baseline tracking algorithms under different combination of motion and orientation variations. Robust baseline tracking algorithms guarantee the reliable and accurate flow rate computation of the wearable mask device.
Fig. 11 (a) shows the dynamic baseline under different daily life scenarios and Fig. 11 (b) shows the recorded gyroscope response. It should be mentioned that these scenarios involve a lot of head and neck movements, which introduces both orientation changes and motions. Since wearing the mask requires fastening and adjusting the mask device around the head, a lot of random spikes show up in the gyroscope signal. The baseline is quite stable when the subject is sitting idle. The random forward and backward head movement causes alternating up and down signal in the gyroscope response. Steady Walking does not show any considerable baseline changing since the pressure sensor is more sensitive to orientation changes rather than translatory motion. Climbing Stairs creates significant baseline alternation because of the entangled orientation and motion changes. Overall, the baseline tracking never gets lost and the algorithms are robust enough to handle the breath tracking under different daily life scenarios.
Fig. 11.
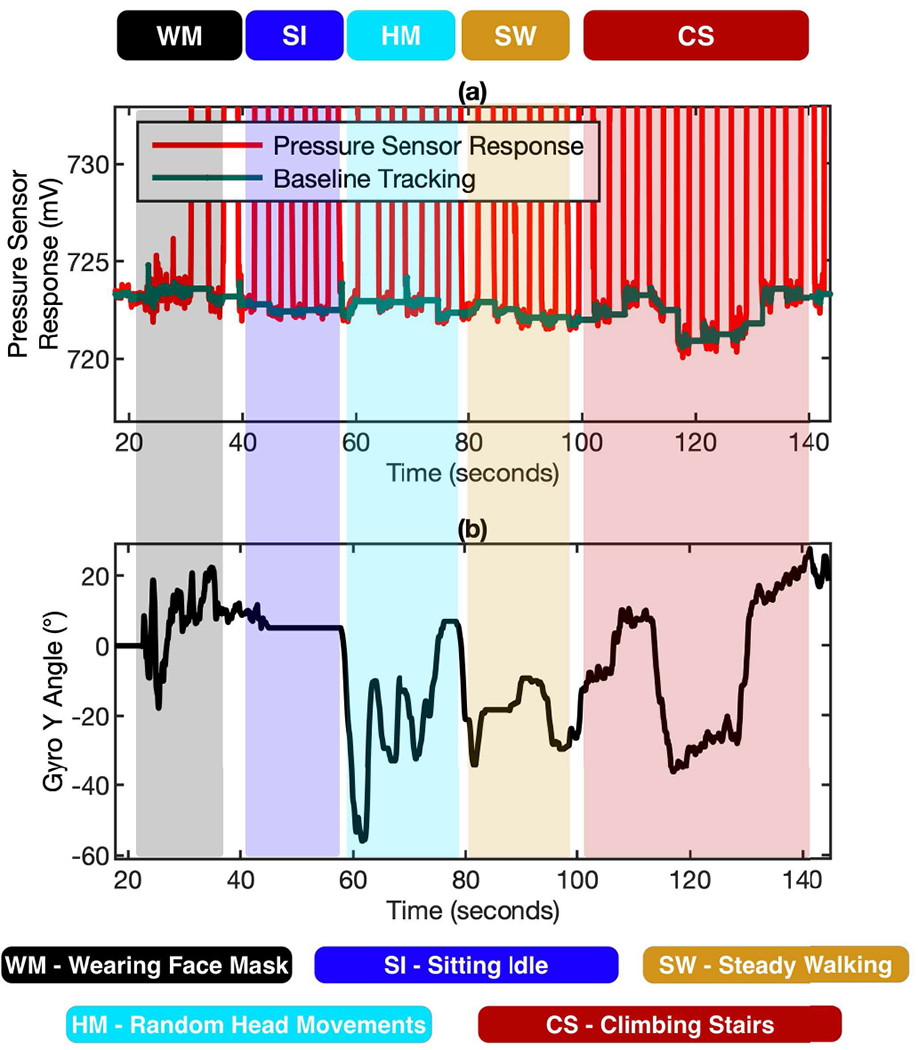
The performance of the baseline tracking algorithms under the influence of orientational changes and different motions. (a) The dynamic baseline tracked by the algorithms under 5 different daily life scenarios using the baseline correction & gyroscope compensation. (b) Gyroscope response used for correction and compensation of pressure signal.
V. Conclusion
A miniaturized, reliable, and wide-dynamic ranged flow measurement module based on algorithm-enhanced MEMS pressure sensor has been developed. The dynamic baseline tracking algorithm and the gyroscope-assisted signal compensation algorithm are implemented in the breathing flow measurement module. By integrating this flow module to a wearable mask device, accurate breathing tracking has been achieved on subjects in a wearable manner. The performance of the wearable flow measurement module has been validated by bench test and usability test. The flow measurement technology developed in this work can be used to track breathing in free-living conditions for the assessment of lung functions, exercise physiologies, and energy expenditure.
References
- [1].Hardin M et al. The clinical features of the overlap between COPD and asthma. Resp Res 12 (2011). [DOI] [PMC free article] [PubMed] [Google Scholar]
- [2].Pellegrino R et al. Interpretative strategies for lung function tests. Eur Respir J 26, 948–968, doi: 10.1183/09031936.05.00035205 (2005). [DOI] [PubMed] [Google Scholar]
- [3].Vestbo J et al. Global Strategy for the Diagnosis, Management, and Prevention of Chronic Obstructive Pulmonary Disease GOLD Executive Summary. Am J Resp Crit Care 187, 347–365, doi: 10.1164/rccm.201204-0596PP (2013). [DOI] [PubMed] [Google Scholar]
- [4].Yawn BF et al. Spirometry can be done in family physicians’ offices and alters clinical decisions in management of asthma and COPD. Chest 132, 1162–1168, doi: 10.1378/chest.06-2722 (2007). [DOI] [PubMed] [Google Scholar]
- [5].Criee CP et al. Standardization of Spirometry: 2015 Update. Pneumologie 69, 147–164, doi: 10.1055/s-0034-1391345 (2015). [DOI] [PubMed] [Google Scholar]
- [6].Gardner RM, Hankinson JL & West BJ Evaluating Commercially Available Spirometers. Am Rev Respir Dis 121, 73–82 (1980). [DOI] [PubMed] [Google Scholar]
- [7].Gunawardena KA, Houston K & Smith AP Evaluation of the Turbine Pocket Spirometer. Thorax 42, 689–693, doi: 10.1136/thx.42.9.689 (1987). [DOI] [PMC free article] [PubMed] [Google Scholar]
- [8].Amann A, Spanel P & Smith D Breath Analysis: The Approach Towards Clinical Applications. Mini-Rev Med Chem 7, 115–129, doi: 10.2174/138955707779802606 (2007). [DOI] [PubMed] [Google Scholar]
- [9].Bajtarevic A et al. Noninvasive detection of lung cancer by analysis of exhaled breath. Bmc Cancer 9, doi: 10.1186/1471-2407-9-348 (2009). [DOI] [PMC free article] [PubMed] [Google Scholar]
- [10].Cao WQ & Duan YX Breath analysis: Potential for clinical diagnosis and exposure assessment. Clin Chem 52, 800–811, doi: 10.1373/clinchem.2005.063545 (2006). [DOI] [PubMed] [Google Scholar]
- [11].Risby TH & Solga SF Current status of clinical breath analysis. Appl Phys B-Lasers O 85, 421–426, doi: 10.1007/s00340-006-2280-4 (2006). [DOI] [Google Scholar]
- [12].Dweik RA et al. An Official ATS Clinical Practice Guideline: Interpretation of Exhaled Nitric Oxide Levels (FENO) for Clinical Applications. Am J Resp Crit Care 184, 602–615, doi: 10.1164/rccm.912011ST (2011). [DOI] [PMC free article] [PubMed] [Google Scholar]
- [13].Cope KA, Watson MT, Foster WM, Sehnert SS & Risby TH Effects of ventilation on the collection of exhaled breath in humans. J Appl Physiol 96, 1371–1379, doi: 10.1152/japplphysiol.01034.2003 (2004). [DOI] [PubMed] [Google Scholar]
- [14].Vreman HJ, Baxter LM, Stone RT & Stevenson DK Evaluation of a fully automated end-tidal carbon monoxide instrument for breath analysis. Clin Chem 42, 50–56 (1996). [PubMed] [Google Scholar]
- [15].Ferrannini E The Theoretical Bases of Indirect Calorimetry - a Review. Metabolism 37, 287–301, doi: 10.1016/0026-0495(88)90110-2 (1988). [DOI] [PubMed] [Google Scholar]
- [16].Haugen HA, Chan LN & Li F Indirect calorimetry: A practical guide for clinicians. Nutr Clin Pract 22, 377–388, doi: 10.1177/0115426507022004377 (2007). [DOI] [PubMed] [Google Scholar]
- [17].Jequier E & Felber JP Indirect Calorimetry. Bailliere Clin Endoc 1, 911–935, doi: 10.1016/S0950-351x(87)80011-3 (1987). [DOI] [PubMed] [Google Scholar]
- [18].Haghi M, Thurow K & Stoll R Wearable Devices in Medical Internet of Things: Scientific Research and Commercially Available Devices. Healthc Inform Res 23, 4–15, doi: 10.4258/hir.2017.23.1.4 (2017). [DOI] [PMC free article] [PubMed] [Google Scholar]
- [19].Iqbal MH, Aydin A, Brunckhorst O, Dasgupta P & Ahmed K A review of wearable technology in medicine. J Roy Soc Med 109, 372–380, doi: 10.1177/0141076816663560 (2016). [DOI] [PMC free article] [PubMed] [Google Scholar]
- [20].Khan Y, Ostfeld AE, Lochner CM, Pierre A & Arias AC Monitoring of Vital Signs with Flexible and Wearable Medical Devices. Adv Mater 28, 4373–4395, doi: 10.1002/adma.201504366 (2016). [DOI] [PubMed] [Google Scholar]
- [21].Gao W et al. Fully integrated wearable sensor arrays for multiplexed in situ perspiration analysis. Nature 529, 509-+, doi: 10.1038/nature16521 (2016). [DOI] [PMC free article] [PubMed] [Google Scholar]
- [22].Huang CY, Chan MC, Chen CY & Lin BS Novel Wearable and Wireless Ring-Type Pulse Oximeter with Multi-Detectors. Sensors-Basel 14, 17586–17599, doi: 10.3390/s140917586 (2014). [DOI] [PMC free article] [PubMed] [Google Scholar]
- [23].Reeder B & David A Health at hand: A systematic review of smart watch uses for health and wellness. J Biomed Inform 63, 269–276, doi: 10.1016/j.jbi.2016.09.001 (2016). [DOI] [PubMed] [Google Scholar]
- [24].Apple Watch. Accessed on: Jul. 13, 2019, [Online] Available: https://www.apple.com/watch/.
- [25].Google Glass. Accessed on: Jul. 13, 2019, [Online] Available: https://www.google.com/glass/start/.
- [26].vívosmart 4 fitness tracker. Accessed on: Jul. 13, 2019, [Online] Available: https://buy.garmin.com/en-US/US/p/605739.
- [27].Motiv Ring. Accessed on: Jul. 13, 2019, [Online] Available: https://mymotiv.com/.
- [28].Exclusive: What Fitbit’s 6 billion nights of sleep data reveals about us. Accessed on: Jul. 13, 2019, [Online] Available: https://finance.yahoo.com/news/exclusive-fitbits-6-billion-nights-sleep-data-reveals-us-110058417.html.
- [29].Atalay O, Kennon WR, and Demirok E, “Weft-Knitted Strain Sensor for Monitoring Respiratory Rate and Its Electro-Mechanical Modeling,” (in English), Ieee Sensors Journal, vol. 15, no. 1, pp. 110–122, January 2015. [Google Scholar]
- [30].Lee H, Chung H, Kim JW, and Lee J, “Motion Artifact Identification and Removal From Wearable Reflectance Photoplethysmography Using Piezoelectric Transducer,” (in English), Ieee Sensors Journal, vol. 19, no. 10, pp. 3861–3870, May 15 2019. [Google Scholar]
- [31].Xu L, Rabotti C, Zhang YJ, Ouzounov S, Harpe PJA, and Mischi M, “Motion-Artifact Reduction in Capacitive Heart-Rate Measurements by Adaptive Filtering,” (in English), Ieee Transactions on Instrumentation and Measurement, vol. 68, no. 10, pp. 4085–4093, October 2019. [Google Scholar]
- [32].Zhang YF et al. , “Motion Artifact Reduction for Wrist-Worn Photoplethysmograph Sensors Based on Different Wavelengths,” (in English), Sensors, vol. 19, no. 3, February 1 2019. [DOI] [PMC free article] [PubMed] [Google Scholar]
- [33].N. D. T. Pollreisz, “Detection and Removal of Motion Artifacts in PPG Signals,” Mobile Netw Appl, pp. 1–11, 2019. [Google Scholar]
- [34].Heikenfeld J et al. , “Wearable sensors: modalities, challenges, and prospects,” (in English), Lab on a Chip, vol. 18, no. 2, pp. 217–248, January 21 2018. [DOI] [PMC free article] [PubMed] [Google Scholar]
- [35].Williams EM, Burrough SLM & Mcpeak H Measurement of Tidal Flow Using a Transit-Time Ultrasonic Breath Analyzer. Anaesthesia 50, 427–432, doi: 10.1111/j.1365-2044.1995.tb05999.x (1995). [DOI] [PubMed] [Google Scholar]
- [36].King GA, McLaughlin JE, Howley ET, Bassett DR & Ainsworth BE Validation of aerosport KB1-C portable metabolic system. Int J Sports Med 20, 304–308, doi: 10.1055/s-2007-971135 (1999). [DOI] [PubMed] [Google Scholar]
- [37].Novitsky S, Segal KR, Chatraryamontri B, Guvakov D & Katch VL Validity of a New Portable Indirect Calorimeter - the Aerosport-Teem-100. Eur J Appl Physiol O 70, 462–467, doi: 10.1007/Bf00618499 (1995). [DOI] [PubMed] [Google Scholar]
- [38].Que CL, Kolmaga C, Durand LG, Kelly SM & Macklem PT Phonospirometry for noninvasive measurement of ventilation: methodology and preliminary results. J Appl Physiol 93, 1515–1526, doi: 10.1152/japplphysiol.00028.2002 (2002). [DOI] [PubMed] [Google Scholar]
- [39].D6F-P MEMS Flow Sensor User’s Manual, Accessed on: Dec. 13, 2019, Available: https://omronfs.omron.com/en_US/ecb/products/pdf/en-D6F-P_users_manual.pdf