

Abstract
Recent studies have combined multiple neuroimaging modalities to gain further understanding of the neurobiological substrates of aphasia. Following this line of work, the current study uses machine learning approaches to predict aphasia severity and specific language measures based on a multimodal neuroimaging dataset. A total of 116 individuals with chronic left‐hemisphere stroke were included in the study. Neuroimaging data included task‐based functional magnetic resonance imaging (fMRI), diffusion‐based fractional anisotropy (FA)‐values, cerebral blood flow (CBF), and lesion‐load data. The Western Aphasia Battery was used to measure aphasia severity and specific language functions. As a primary analysis, we constructed support vector regression (SVR) models predicting language measures based on (i) each neuroimaging modality separately, (ii) lesion volume alone, and (iii) a combination of all modalities. Prediction accuracy across models was subsequently statistically compared. Prediction accuracy across modalities and language measures varied substantially (predicted vs. empirical correlation range: r = .00–.67). The multimodal prediction model yielded the most accurate prediction in all cases (r = .53–.67). Statistical superiority in favor of the multimodal model was achieved in 28/30 model comparisons (p‐value range: <.001–.046). Our results indicate that different neuroimaging modalities carry complementary information that can be integrated to more accurately depict how brain damage and remaining functionality of intact brain tissue translate into language function in aphasia.
Keywords: aphasia, CBF, chronic aphasia, FA, fMRI, lesion, multimodal, neuroimaging
The current study used machine learning approaches to predict aphasia severity and specific language measures based on a multimodal neuroimaging dataset. Our findings revealed a complementary advantage of integrating several neuroimaging modalities within the same model framework, as compared to any single modality prediction model.
1. INTRODUCTION
Current estimates suggest there are over two million individuals living with aphasia in North America alone (Simmons‐Mackie, 2018). This high prevalence is largely explained by two factors. First, although stroke rates have declined in older populations, younger populations have experienced a rise in stroke rates in high‐income countries (Feigin et al., 2014; Feigin et al., 2017; Giroud, Jacquin, & Béjot, 2014; Kissela et al., 2012; Ramirez et al., 2016). And second, this epidemiological trend is accompanied by increased regional life expectancy among stroke survivors (Feigin et al., 2015, 2017; Kim, 2014; Lackland et al., 2014; Swerdel et al., 2016). Given that roughly a third of stroke survivors are affected by aphasia (Engelter et al., 2006), it follows that more people are living longer with aphasia than ever before. Considering these statistics, it is easy to see that the societal, familial, and economic burden of aphasia is on the rise. Consequently, it serves as a highly important and clinically relevant goal to address this development by thoroughly investigating the neurobiological mechanisms underlying aphasia, which may in turn advance efforts to improve personalized treatment in aphasia.
While our understanding of the neural underpinnings of language has advanced far past the initial delineations made by Broca's (1965) and Wernicke's (1874), there is no cure for aphasia. Recent high impact studies suggest that aphasia treatment is effective in improving language function at the group level (Brady, Kelly, Godwin, & Enderby, 2012; Brady, Kelly, Godwin, Enderby, & Campbell, 2016; Breitenstein et al., 2017). However, treatment response is highly variable across individuals (Brady et al., 2016; Fridriksson, Den Ouden, et al., 2018; Fridriksson, Rorden, et al., 2018; Price, Hope, & Seghier, 2016) and less is known about the factors differentiating those who respond fractionally or not at all, and those who benefit significantly from treatment (e.g., Fridriksson, 2010). Understanding manifestations of language impairment following brain damage is an important first step toward the ultimate goal of maximizing functional recovery following stroke. Specifically, understanding how lesion size and location affect and interact with functionally intact brain regions may prove to be a promising avenue for the development of personalized rehabilitation in aphasia designed to address what we now know about individual variability in treatment response (Crosson et al., 2019; Kiran & Thompson, 2019).
Recent efforts have examined how patterns of brain damage and structurally and functionally intact cortical and subcortical regions correspond to aphasia severity (e.g., Halai, Woollams, & Lambon Ralph, 2020; Hope, Leff, & Price, 2018; Pustina et al., 2017; Yourganov, Fridriksson, Rorden, Gleichgerrcht, & Bonilha, 2016). The rationale behind this line of work lies in the commonly agreed upon notion that complex higher‐order functions, such as language, are represented in widely distributed cortical networks (Mesulam, 1990; Sporns, 2015; Ueno, Saito, Rogers, & Lambon Ralph, 2011). Frank lesion damage may affect one or more nodes of the language network, while leaving the remainder of the network intact. Nonetheless, the extent to which brain damage impairs functionality within the network remains elusive (Crosson et al., 2019). Some of our prior work has shown that damage to white matter fibers connecting intact cortical regions can affect language function in much the same way as cortical lesions (Bonilha, Nesland, et al., 2014; Fridriksson, Den Ouden, et al., 2018; Fridriksson, Rorden, et al., 2018; Marebwa et al., 2017). Corroborating findings in neurosurgical patients show that electrical stimulation of white matter pathways can induce aphasia‐like disruptions in language processing (Duffau, Peggy Gatignol, Mandonnet, Capelle, & Taillandier, 2008; Kinoshita et al., 2015). Together, these findings suggest that in order to understand how brain damage affects behavior, it may be beneficial to look beyond the effects of cortical lesion alone. The general idea is that more brain data could improve prediction of language outcomes. Consequently, a promising new approach involves examining the contribution of lesion maps, white matter integrity and functional/cortical activation for prediction of language outcomes.
Before discussing studies that have embarked on deciphering whether or not combining neuroimaging modalities leads to enhanced prediction accuracy of language impairment, it is worth noting that the idea of examining the manifestation of brain damage in aphasia by incorporating more than one neuroimaging modality within the same study design is not, per se, a novelty. Prior studies have incorporated functional and structural measures for various purposes, including delineation of neurobiological bases of language (e.g., Fridriksson, Den Ouden, et al., 2018; Fridriksson, Rorden, et al., 2018; Saur et al., 2008), examination of language recovery (e.g., Meier, Johnson, Pan, & Kiran, 2019; Stockert et al., 2020), and to model specific language functions (e.g., Halai, Woollams, & Lambon Ralph, 2018; Saur et al., 2010). While these studies have leveraged the added benefit of studying language function in aphasia from multiple angles, the purpose has not been to evaluate if combining more than one neuroimaging modality within the same prediction model improves prediction accuracy compared to single‐modality models. Motivated by these prior studies, the major aim of the current study was to gain understanding of the potential value of integrating multiple neuroimaging modalities for predicting cross‐sectional aphasia symptomology.
A handful of recent high‐impact studies have applied a similar focus, with inconsistent results. A prior study from our group (Yourganov et al., 2016) used support vector regression (SVR; Smola & Scholkopf, 2004) to predict speech and language processing based on lesion data and connectome data acquired with diffusion tensor imaging (DTI). Although the prediction accuracy of the resulting model was not better than the model based on lesion data alone, a connectome‐based analysis revealed a complementary brain‐behavior information of potential significance (e.g., the connection between the left posterior superior temporal gyrus and the left angular gyrus was predictive of several language measures). A follow‐up study applied a connectome‐dynamic lesion‐symptom mapping approach in a comparable manner, finding a significant improvement in prediction accuracy of aphasia severity (Western Aphasia Battery‐Revised Aphasia Quotient, WAB‐AQ; Kertesz, 1982) compared to a model based on lesion maps alone (combined model vs. lesion maps accuracy: r = .76 vs. .72, p <.05; Del Gaizo et al., 2017). Besides work from our group, Pustina et al. (2017) constructed a multivariate framework integrating lesion data, structural connectivity, and functional connectivity measures (“stacked multimodal predictions”; STAMP) for estimating aphasia severity. Prediction accuracy ranged between 0.79 and 0.88 (actual vs. predicted outcomes correlation) for several measures of speech and language processing in a training sample of 53 persons with aphasia. For out‐of‐sample prediction of performance on a picture naming task using the trained model, the observed accuracy was substantially lower (r = .66). While the out‐of‐sample prediction accuracy did not present a significant advantage over the best single‐modality model (structural connectivity; r = .63), the authors argue that the absolute increase in accuracy (0.03), nonetheless, might have reached statistical significance in a larger sample.
A subsequent large‐scale study by Hope et al. (2018) failed to replicate the complementarity of using multiple neuroimaging modalities for prediction of language function as shown by Yourganov et al. and Pustina et al. Specifically, Hope et al. used lesion data and structural connectivity measures to predict subscores of the Comprehensive Aphasia Test (Swinburn, Porter, & Howard, 2005) via SVR analysis. A finding of particular interest was that their results were inducer‐dependent, that is, linear and nonlinear kernels yielded different results. In effect, the results of Yourganov et al. were replicated for a naming subtest using an identical approach (SVR with a linear kernel), but a rerun of the analysis with the authors' preferred inducer yielded a different result. Results from this study suggest that subjective choices made by researchers creating predictive models could have major impacts on experimental findings, effectively “[opening] … a Pandora's box” (Hope et al., 2018, p. 25). A recent elaborate study by Halai et al. (2020) specifically examined the effects of critical parameters on prediction accuracy for four principal component analysis (PCA)‐derived language components, including brain partitions as predictive features, combination of multimodal neuroimaging, and type of machine learning algorithms. Prediction accuracy for the best models, evaluated as the correlation between actual and predicted values, ranged between r = .51–.73. Importantly, the models varied with respect to selected parameters and, in line with Hope et al. (2018), the addition of diffusion‐weighted data to lesion‐based models did not significantly improve model performance.
In light of the inconsistent findings discussed above, the current study describes an effort to elucidate the somewhat murky picture regarding the benefit of combining neuroimaging modalities for prediction of language function. We extracted behavioral and neuroimaging data from a large sample of participants (n = 202) in our prior studies. Behavioral data included an estimation of overall aphasia severity (WAB‐AQ) and impairment in specific language functions. Given that recent investigations have convincingly shown that aphasia cannot reliably be reduced to a single severity factor (Butler, Lambon Ralph, & Woollams, 2014; Halai, Woollams, & Lambon Ralph, 2017; Mirman et al., 2015), we included measures of naming, repetition, fluency, and auditory comprehension from the WAB. Presumably, these specific language functions are represented in intertwined, albeit distinguishable, neural networks which may, therefore, relate directly to whether or not multimodal prediction yields beneficial effects (Fridriksson, Den Ouden, et al., 2018; Fridriksson, Rorden, et al., 2018; Hickok & Poeppel, 2007). Neuroimaging data included measures of functional cortical activation (functional magnetic resonance imaging; fMRI), integrity of white matter connections (fractional anisotropy; FA), cerebral blood flow (CBF), and atlas‐based lesion‐load data. In line with the recent focus on incorporating multivariate statistical approaches to examine the neural substrates of aphasia (e.g., Fridriksson, Den Ouden, et al., 2018; Fridriksson, Rorden, et al., 2018; Thye & Mirman, 2018; Wilson & Hula, 2019), we constructed data‐driven multivariate prediction models for language measures. While a hypothesis‐driven approach might reduce the degrees of freedom associated with the models, we believe that such endeavors would be premature given the disparate prior findings.
Specifically, we addressed two aims. First, we examined how accurately language function can be predicted based on each of the four neuroimaging modalities separately, based on overall lesion volume alone (for comparison), and based on all modalities combined. Second, we examined the hypothesis that the combined‐modality prediction model would be statistically superior to any single‐modality prediction model and the lesion volume model. We note that as prediction accuracy was of primary interest, we did not undertake the dubious task of interpreting coefficient weights. However, we acknowledge that understanding of specific predictive features (modality and region) for language function may hold substantial value in terms of advancing knowledge of the neurobiology of language and for clinical prognosis, management and treatment paradigms. Therefore, we also investigated which brain regions and imaging modalities were most strongly associated with each language outcome and report these results in Supporting Information (online).
2. METHOD
2.1. Participants
Participant data were extracted from a data repository consisting of data gathered in several prior studies conducted in our lab. We included subjects with aphasia resulting from a single ischemic or hemorrhagic stroke to the left hemisphere. Participants who had suffered lacunar infarcts, bilateral stroke, or damage only involving the brainstem or cerebellum were excluded. Behavioral and neuroimaging data were acquired between 2007 and 2019. After removing subjects with missing data points (primarily neuroimaging data, for example, some participants did not have CBF data), a total of 116 participants were included for data analysis. The mean sample age was 58.5 ± 10.9 years (range: 29–81 years), and 41 participants were female. The mean lesion volume across participants was 122.61 cm3 (range: 2.09–472.38 cm3; Figure 1 presents the lesion distribution across participants) and mean time poststroke was 39.4 months (range: 5.6–237.1 months). All participants gave informed consent for study participation and the study was approved by the Institutional Review Boards at the University of South Carolina and Medical University of South Carolina.
FIGURE 1.
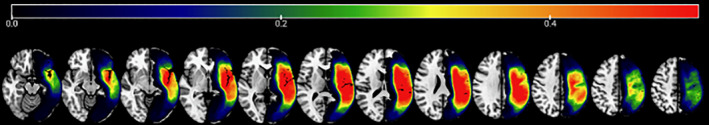
Lesion overlap map for all participants. The figure shows the lesion distribution for the sample with warmer colors representing more lesion overlap (color scale indicates proportional overlap). Greatest lesion overlap was observed in the superior portion of the insular region where 69% of the sample had lesion. Overall, lesion distribution covered the extent of the Perisylvian language regions
2.2. Behavioral data
Aphasia was assessed with the Western Aphasia Battery (WAB; Kertesz, 1982) and Western Aphasia Battery‐Revised (WAB‐R; Kertesz, 2007). Scoring of the WAB was conducted according to instructions in the testing manual. We focused on five subscores that evaluate specific domains of speech and language, including Spontaneous Speech (range: 0–20), Fluency (range: 0–10), Naming (range: 0–10), Speech Repetition (range: 0–10), Auditory Comprehension (range: 0–10), and a summary score of overall aphasia severity, termed Aphasia Quotient (WAB‐AQ; range: 0–100). Table 1 shows distribution of all language measures. Several participants scored at ceiling for various measures (WAB‐AQ ≥93.8, n = 7; Spontaneous Speech, n = 6; Fluency, n = 6; Naming, n = 2; Speech Repetition, n = 2; Auditory Comprehension, n = 7).
TABLE 1.
Descriptive statistics, distribution, and correlation across language tasks
| WAB‐AQ | Fluency | Spontaneous speech | Naming | Speech repetition | Auditory comprehension | |
|---|---|---|---|---|---|---|
| Mean | 62.9 | 5.4 | 12.1 | 5.9 | 5.5 | 7.9 |
| SD | 23.8 | 3.0 | 5.2 | 2.9 | 3.1 | 1.7 |
| Range | 5.6–99.6 | 0–10 | 0–20 | 0–10 | 0.1–10 | 2.6–10 |
| Histogram a |

|

|

|

|

|

|
| Pearson's correlation (r) | ||||||
| WAB‐AQ | — | .857** | .948** | .925** | .897** | .772** |
| Fluency | — | — | .948** | .687** | .705** | .573** |
| Spont. Sp. | — | — | — | .820** | .791** | .655** |
| Naming | — | — | — | — | .827** | .710** |
| Speech rep. | — | — | — | — | — | .612** |
| Aud. Comp. | — | — | — | — | — | — |
Histogram bins: AQ = 5; Spontaneous Speech = 2; all other = 1.
**p <.01.
2.3. Neuroimaging data
2.3.1. Data acquisition
All MRI data were acquired on the Siemens 3T MRI scanner (Siemens Medical Systems, Erlangen, Germany) housed at the McCausland Center for Brain Imaging located at the Palmetto Richland Heart Hospital in Columbia, South Carolina. Because data collection for this experiment spanned multiple years, certain sequence parameters were changed when the Siemens scanner was upgraded from a Trio (using a 12‐channel head coil) to a Prisma Fit (20‐channel head coil). Where possible, data acquisition parameters were kept consistent across scanners. Sequence parameters and deviations are shown in Table 2.
TABLE 2.
Scanning parameters and deviations across scanners
| Modality | Scanner | |
|---|---|---|
| Siemens 3T scanner (n = 77) | Prisma fit scanner (n = 40) | |
| Structural images |
T1: 160 slices; TR = 2,250 ms, TI = 900 ms, TE = 4.52 ms T2: 192 slices; TR = 2,800, TE = 402 ms |
T1: 192 slices; TR = 2,250, TI = 925, TE = 4.15 T2: 192 slices; TR = 2,800, TE = 402 ms |
| CBF | FOV = 210 mm, matrix = 70 × 70, TR = 2,500 ms, TE = 13 ms, ×2 GRAPPA, 14 axial slices (6 mm thick with 1.5 mm gap), bolus duration: 800 ms inversion time: 1,800 ms, with a total of 60 (n = 4), 74 (n = 29) or 101 volumes (n = 44; a proton density volume followed by 50 control label pairs) | FOV = 208–224 mm, matrix = 64 × 64, TR = 3,500–4,580 ms, TE = 12 ms, ×2 GRAPPA, 16–17 axial slices (5 mm thick with 1 mm gap), postlabeling delay (PLD) = 1,200 ms, with a total of 60 (n = 4), 74 (n = 29), or 80 volumes (n = 7) |
| fMRI | 60 full‐brain volumes (matrix = 64 × 64, in‐plane resolution = 3.25 × 3.25 mm, slice thickness = 3.2 mm [no gap], and 33 axial slices, 90° flip angle, TR = 10,000 ms, acquisition time = 2,000 ms, TE = 30 ms) | 60 full‐brain volumes (matrix = 64 × 64, in‐plane resolution = 3.25 × 3.25 mm, slice thickness = 3.2 mm [no gap], and 33 axial slices, 90° flip angle, TR = 10,000 ms, acquisition time = 2,000 ms, TE = 30 ms) |
| DTI (FA) |
n = 13: Sequence: bipolar; 65 volumes (2.0 mm isotropic voxel, 1× B0 s/mm2, 64× B1000 s/mm2, TR = 7,300 ms, TE = 87 ms, matrix = 96 × 96, 6/8 partial Fourier, 60 contiguous slices) n = 39: Sequence: monopolar; 82 volumes (2.3 mm isotropic voxels, 10× B0 s/mm2, 72× B1000 s/mm2, TR = 4,987 ms, TE = 79.2 ms, matrix = 90 × 90, ×2 GRAPPA, 50 contiguous slices) n = 25: Sequence: Bipolar; 131 volumes (2.7 mm isotropic voxels, 11× B0 s/mm2, 60x B1000 s/mm2, 60× B2000 s/mm2, TR = 6,100 ms, TE = 101 ms, matrix = 82 × 82, ×2 GRAPPA, 45 contiguous slices) |
n = 4: Sequence: bipolar; 131 volumes (2.7 mm isotropic voxels, 11× B0 s/mm2, 60× B1000 s/mm2, 60x B2000 s/mm2, TR = 6,100 ms, TE = 101 ms, matrix = 82 × 82, ×2 GRAPPA, 45 contiguous slices) n = 36: Sequence: split into two series with equal numbers of volumes. The series were identical except the phase encoding polarity for spatial undistortion using FSL's TOPUP (see description) (1.5 mm isotropic voxels, 14× B0 s/mm2, 72× B1000 s/mm2, TR = 5,250 ms, TE = 80 ms, matrix = 140 × 140, ×2 multi‐band, 80 contiguous slices) |
2.3.2. Acquisition of structural images
For each participant we acquired a T1‐weighted image (MP‐RAGE: 1 mm isotropic voxels, matrix = 256 × 256, 9° flip angle). The duration of T1‐weighted image acquisition was 6 min 17 s. We also obtained a T2‐weighted structural image using a 3D TSE (Turbo Spin Echo) scan. T2 acquisition time was 5 min 6 s. Sequence parameters are described in Table 2.
2.3.3. Acquisition of cerebral blood flow (ASL) images
Cerebral blood flow for the first 77 participants was measured using the Siemens product Pulsed Arterial Spin Labeling (PASL PICORE Q2T) sequence which has been shown to have high reliability (Wang et al., 2011). The selective inversion slab was 120 mm thick; the inferior saturation slab was 100 mm thick and directly below the imaging slices. The remaining 40 individuals were scanned with a 2D EPI pseudo‐continuous arterial spin labeling (pCASL) sequence (Wu, Fernandez‐Seara, Detre, Wehrli, & Wang, 2007) that has also shown good reliability (Kilroy et al., 2014).
2.3.4. Acquisition of functional magnetic resonance images
All participants were scanned while viewing and naming 40 color images of high‐frequency nouns (which they named) and 20 abstract pictures (for which they remained silent) that served as contrast in statistical analyses. Pictures were presented on an MRI‐compatible screen that was viewed through a mirror positioned in the participant's line of sight. This fMRI sequence consisted of T2* EPI (echoplanar) imaging with sparse sampling. Each participant's images were acquired during a single, 10‐min functional run. Identical sequence parameters were used for participants scanned using the Siemens Trio and the Siemens Prisma Fit scanners.
2.3.5. Acquisition of DTI
Diffusion weighted images were acquired for each participant. Parameters were kept as constant as reasonably possible throughout the study period. Unavoidable, subtle changes in sequence details occurred with the scanner update. These differences are detailed in Table 2.
2.3.6. Data preprocessing
Preprocessing was conducted using Matlab (R2017b, The MathWorks, Inc., Natick, MA) by way of nii_preprocess (Rorden, McKinnon, Hanayik, Yourganov, & Reddy, 2020), a publicly available custom image‐processing pipeline designed to work with clinical populations such as stroke (https://github.com/neurolabusc/nii_preprocess). This pipeline leverages multiple programs (SPM8; Functional Imaging Laboratory, Wellcome Trust Centre for Neuroimaging, Institute of Neurology, UCL, www.fil.ion.ucl.ac.uk/spm), FSL version 6.0.3 (Jenkinson, Beckmann, Behrens, Woolrich, & Smith, 2012), ASLtbx (http://www.cnf.upenn.edu/~zewang/ASLtbx.php), and MRItrix (https://www.mrtrix.org/) to process multiple modalities of MRI data. This pipeline outputs data in standard space which can then be queried at the voxel or region‐of‐interest (ROI) level. The quality of data preprocessing (i.e., the output of nii_preprocess) for the current study was confirmed by visual inspection of the output file generated by this set of scripts. These scripts were used to generate the following maps in standard space: lesion load, cerebral blood flow (CBF), fMRI activation (associated with object naming), and functional anisotropy (FA). For each individual, and for each map (lesion‐load, CBF, fMRI, FA), we computed the average signal intensity in each of 150 areas based on the AALCTS atlas. The AALCTS atlas is a custom‐made atlas unifying the Automated Anatomical Labeling (AAL; 116 ROIs; Tzourio‐Mazoyer et al., 2002) and Catani – Thiebaut de Schotten (CTS; 34 ROIs; Catani & Thiebaut de Schotten, 2008) atlases (for further description, see Yourganov, Smith, Fridriksson, & Rorden, 2015). The resulting four matrices (one for each modality) of the dimensions 116 (subjects) × 150 (brain regions) were used as input for our analysis.
2.3.7. Generation of lesion‐load maps
Lesions were demarcated on individual T2‐weighted images by a licensed neurologist using the MRIcron software (Rorden, Bonilha, Fridriksson, Bender, & Karnath, 2012). To begin, the T2‐weighted image on which the lesion was drawn was coregistered to the T1‐weighted image. The transformation matrix generated during this step was used to transform the lesion to native T1 space. The images were then converted to standard Montreal Neurological Institute (MNI) space using enantiomorphic (Nachev, Coulthard, Jager, Kennard, & Husain, 2008) segmentation–normalization (Ashburner & Friston, 2005) (https://github.com/rordenlab/spmScripts/blob/master/nii_enat_norm.m). Enantiomorphic mending exploits the fact that the brain is left‐right symmetrical to fill in damaged or missing (i.e., lesioned) portions of the T1 image prior to normalization, which may not perform well in damaged brains. This process involves the replacement of voxels in the T1 image falling within the lesioned area of the left hemisphere, with signal extracted from the mirrored area in the intact (right) hemisphere. Following this process, the modified T1 image can be normalized to standard (MNI) space without error. Following enantiomorphic normalization, linear interpolation was used to reslice the lesion image into standard space (1 × 1 × 1 mm isotropic voxels). The tissue segmentation maps generated by the enantiomorphic normalization–segmentation routine were used to create brain‐extracted examples of the individuals T1 and T2 scans which were then used to normalize the DTI, ASL, and fMRI scans discussed below.
2.3.8. Generation of cerebral blood flow maps
The ASL images were processed using the ASLtbx (Wang et al., 2008). Lesions drawn on the 1 mm isotropic T2‐weighted image were coregistered to T1‐weighted image. The clinical toolbox (Rorden et al., 2012) was used to enantiomorphically (Nachev, Coulthard, Jäger, Kennard, & Husain, 2007) normalize the T1‐weighted image to standard space using SPM12's unified segmentation‐normalization. The segmentation stage was used to create a scalp‐stripped image in the patient's native space. The first volume of the ASL data was linearly coregistered to this scalp‐stripped T1‐weighted image, with the linear transform applied to all the processed ASL images. Finally, the nonlinear normalization transforms were applied to the ASL data, warping these images to standard space.
2.3.9. Generation of fMRI activation maps
Motion correction was completed using SPM12's default realign and unwarp settings and the resulting images were spatially realigned with the brain‐extracted T2‐weighted image due to the similarity in contrast between the two T2‐weighted scans. Following slice time correction, stimulus onsets for the two main conditions (high‐frequency noun and abstract images) were convolved with the canonical hemodynamic response function (HRF) and its temporal derivative. We obtained a mean fMRI image by averaging all 60 volumes acquired during the fMRI session for each participant. This mean image was scalp stripped using FSL's BET normalized to the scalp‐stripped T2‐weighted scan (note this T2‐weighted image had already undergone entantiomorphic unified segmentation normalization and so was in standard space as described in the final lines of Section 2.3.7, with segmentation providing robust scalp stripping). Note the T2* fMRI image and high‐resolution, low‐disotrtion T2‐weighted image have very similar image contrast, including at the location of the lesion. The resulting normalization deformation was applied to the original (nonscalp‐stripped) fMRI series. Nonbrain tissue was ignored for the final normalization. The resulting data were smoothed with a Gaussian kernel (FWHM = 6 mm). Voxelwise data were detrended using mean signal from the white matter, and subject and independent component analysis was used to automatically identify and remove lesion‐driven artifacts in the data (Yourganov, Fridriksson, Stark, & Rorden, 2018). We then estimated the main effects of our two conditions of interest (overt naming of high‐frequency nouns and silent viewing of abstract images) using SPM12's GLM and calculated difference maps in standard space. These difference maps represented areas of greater signal during picture naming than viewing of abstract pictures (Ashburner et al., 2012).
2.3.10. Generation of FA maps
We used FSL's TOPUP tool to estimate and correct for susceptibility‐induced distortions and FSL's Eddy tool to estimate and remove eddy current induced distortions (Andersson, Skare, & Ashburner, 2003; Andersson & Sotiropoulos, 2016). FA, a value that describes directional water diffusion and may serve as a proxy for brain integrity, and is sensitive to changes in myelination, axon diameter, fiber density, and fiber organization (Beaulieu, 2002), was calculated using FSL's dtifit tool. Because we prefer to keep diffusion weighted images in native space (as we often deal with fiber tractography which does not behave well when warped), we did not normalize the resulting FA maps. Rather, we determined the nonlinear transforms necessary to warp the T1‐weighted image to match the undistorted DTI image (which both share similar image intensity), and then used this to “warp” AALCTS atlas into native DTI space. We were then able to calculate mean FA within each region of this atlas as discussed above.
2.4. Data analysis
We took several steps in constructing and comparing the prediction models (primary aims). These included an examination of the data structure (including correlations across neuroimaging modalities), preselection of predictive features for model construction, SVR to predict language measures, 5‐fold cross‐validation (CV) for parameter tuning and 10‐fold CV for evaluating prediction accuracy, prediction of language function based on lesion volume alone, and model comparison. Each step is described in detail below. Finally, as a supplementary analysis, we performed a LASSO regression analysis and a multivariable regression for prediction of WAB‐AQ and WAB subscores. Results of these final analyses are presented in online Supporting Information.
2.4.1. Preliminary data analysis
Pearson's correlation coefficients were calculated across each pair of neuroimaging modalities (CBF, FA, fMRI, and lesion‐load) to examine the relationship between brain function carried within different modalities. Specifically, we calculated the mean, minimum value, and maximal value of the correlation coefficient estimates across modalities within each brain region of interest. Table 3 presents absolute mean correlation and correlation ranges across neuroimaging modalities. Based on prior findings suggesting that age (Ellis & Urban, 2016; Kertesz & McCabe, 1977; Pedersen, Jorgensen, Nakayama, Raaschou, & Olsen, 1995; Plowman, Hentz, & Ellis, 2012), time poststroke (Hope et al., 2017; Hope, Seghier, Leff, & Price, 2013; Ramsey et al., 2017), and overall lesion volume (Hope et al., 2013; Plowman et al., 2012) may affect language measures, we examined the relationship between these variables and language scores (WAB‐AQ, Fluency, Spontaneous Speech, Naming, Speech Repetition, and Auditory Comprehension; Table 4) using a univariate linear regression analysis. Furthermore, as an exploratory data analysis, we computed the correlation between age and overall lesion volume and performed a two‐sample t‐test to examine sex differences in lesion volume.
TABLE 3.
Summary of correlation across the four neuroimaging modalities (CBF, FA, fMRI, lesion‐load) in all brain regions
| Modality | CBF | FA | fMRI | Lesion‐load |
|---|---|---|---|---|
| CBF | 1 | .185 (−.235, .535) | .088 (−.274, .220) | .205 (−.479, .128) |
| FA | .185 (−.235, .535) | 1 | .090 (−.243, .317) | .370 (−.902, .118) |
| fMRI | .088 (−.274, .220) | .090 (−.243, .317) | 1 | .084 (−.316, .219) |
| Lesion‐load | .205 (−.479, .128) | .370 (−.902, .118) | .084 (−.316, .219) | 1 |
Note: Pearson's correlation coefficients were calculated from the sample and summarized below. The values represented in the table refers to the absolute mean value of the correlation (r) and the range of the correlation coefficients (minimum, maximum).
TABLE 4.
Association between language measures and demographic/biographical variables
| Gender | Age | Time post‐stroke | Lesion volume | |||||
|---|---|---|---|---|---|---|---|---|
| Estimate (95% CI) | p‐value | Estimate (95% CI) | p‐value | Estimate (95% CI) | p‐value | Estimate (95% CI) | p‐value | |
| WAB‐AQ | −6.59 (−14.28, 1.09) | .09 | 0.012 (−0.31, 0.34) | .94 | −0.0002 (−0.0028, 0.0023) | .85 | −0.184 (−0.219, −0.150) | <2E − 16* |
| Fluency | −0.85 (−1.75, 0.06) | .07 | 0.025 (−0.01, 0.06) | .20 | 0 (0, 0) | .69 | −0.022 (−0.026, −0.018) | <2E − 16* |
| Spontaneous speech | −1.19 (−2.93, 0.56) | .18 | 0.003 (−0.07, 0.08) | .93 | −0.0002 (−0.001, 0.000) | .50 | −0.036 (−0.045, −0.028) | 9.5E − 15* |
| Naming | −0.63 (−1.54, 0.28) | .18 | −0.017 (0.055, 0.021) | .38 | 0 (0, 0) | .83 | −0.019 (−0.024, −0.015) | 1.25E − 15* |
| Repetition | −0.69 (−1.63, 0.24) | .15 | 0.009 (−0.030, 0.049) | .64 | 0 (0, 0) | .82 | −0.020 (−0.024, −0.016) | 7.2E − 16* |
| Auditory comprehension | −0.38 (−1.00, 0.24) | .23 | −0.007 (0.033, 0.018) | .57 | 0 (0, 0) | .61 | −0.013 (−0.016, −0.010) | 1.03E − 15* |
Note: Variables included gender, age, time poststroke, and lesion volume. The overall lesion volume is in the unit of cm3.
p <.05.
2.4.2. Preselection of predictive features
In order to reduce the number of potential features (represented as modality‐specific numerical values for each ROI) introduced into our predictive models, we performed a univariate regression analysis predicting language scores using data from all neuroimaging modalities. The purpose of the preselection procedure was to exclude noisy or uninformative predictors from being fed into our prediction models, which reduces the chance of model overfitting. Partial R 2 values were calculated to evaluate the proportion of variability explained by each feature adjusting for the contribution of other included covariates. As our preliminary data analysis (see Section 2.4.1. and Results) found that lesion volume differed depending on sex, we included sex as a covariate in the preselection analyses (for a discussion on sex differences in aphasia, see Wallentin, 2018). Age and time poststroke were also included as covariates given their potential contribution in predicting aphasia symptomology based on prior findings discussed in Section 2.4.1. Features were retained if they had a p‐value <.05 after applying the Benjamini–Hochberg correction for multiple comparisons (Benjamini & Hochberg, 1995). The model can be delineated as shown below:
where yi represents the language measure and xi represents the measure of one modality given location j for the i‐th patient. The analysis was repeated for all 150 ROIs and four modalities for a total of 600 analyses in order to select modality‐specific ROIs (i.e., features).
This procedure was performed separately for each language measure for a total of six sets of preselected features. It should be noted that this procedure allows for selection of different modalities in the same ROI (as an illustration, lesion‐load and CBF in the arcuate fasciculus for WAB‐AQ—see Table 5), which is precisely the proposed strength of a multimodal as opposed to a single‐modality prediction in the current study design.
TABLE 5.
Features significantly associated with WAB‐AQ
| ROI for CBF | ROI for FA | ROI for fMRI | ROI for lesion‐load |
|---|---|---|---|
|
LH caudate nucleus LH postcentral gyrus LH precentral gyrus LH arcuate fasciculus LH middle temporal gyrus LH pole of middle temporal gyrus LH thalamus LH posterior segment of AF LH inferior parietal gyrus LH inferior temporal gyrus LH supramarginal gyrus LH fornix LH putamen LH angular gyrus LH long segment of AF LH rolandic operculum LH anterior segment of AF LH superior temporal gyrus LH inferior frontal gyrus opercular |
LH arcuate fasciculus LH long segment of AF LH inferior occipito frontal fasciculus LH inferior longitudinal fasciculus LH optic radiations LH anterior segment of AF LH posterior segment of AF LH internal capsule LH uncinate LH superior temporal gyrus LH inferior frontal gyrus opercular LH cortico spinal LH middle temporal gyrus LH fornix LH Rolandic operculum LH inferior frontal gyrus triangular LH corpus callosum LH inferior parietal gyrus LH supramarginal gyrus LH caudate nucleus LH insula LH thalamusLH pole of superior temporal gyrus LH precentral gyrus LH angular gyrus LH putamen LH inferior temporal lobe LH Heschl's gyrus LH anterior commissure LH postcentral gyrus LH middle frontal gyrus LH middle occipital gyrus LH inferior frontal orbital |
RH anterior cingulate gyrus RH Heschl's gyrus |
LH arcuate fasciculus LH inferior occipito frontal fasciculus LH long segment of AF LH anterior segment of AF LH Heschl's gyrus LH superior temporal gyrus LH optic radiations LH rolandic operculum LH inferior longitudinal fasciculus LH uncinate LH insula LH posterior segment of AF LH cortico spinal LH internal capsule LH cortico ponto cerebellum LH supramarginal LH putamen LH inferior frontal gyrus opercular LH middle temporal gyrus LH anterior commissure LH angular gyrus LH pole of superior temporal gyrus LH postcentral gyrus LH inferior frontal gyrus triangular LH inferior parietal gyrus LH pallidum LH pole of middle temporal gyrus LH precentral gyrus LH fornix LH inferior temporal gyrus LH inferior frontal gyrus orbital LH middle occipital gyrus LH Corpus callosum LH middle frontal gyrus LH cingulum |
Note: Features refer to modality‐specific ROIs. Features were retained if adjusted p‐value < .05 after Benjamini & Hochberg correction for multiple comparisons.
2.4.3. Support vector regression for prediction of WAB scores
The relationship between language measures and brain damage/function was modeled using SVR with a radial kernel. Given that selection of the wrong type of kernel function may result in nonrobust prediction models (Üstün, Melssen, & Buydens, 2006), we determined the appropriate kernel experimentally by applying various kernel functions to select the most robust parameters (Table S1). Comparison of linear and radial kernels showed a substantial benefit of implementing a radial kernel (results not shown herein). This result is in line with the theoretical notion that a linear kernel is a degenerate and less accurate version of a properly tuned radial kernel (Hsu, Chang, & Lin, 2003). Thus, our SVR models incorporated a radial kernel. We assumed the nonlinear SVR model shown below:
Here, f(x, ω) represents the WAB score and each x represents a given feature, which was either the proportion of damaged voxels in the gray‐matter region (for lesion‐based mapping); degree of cerebral blood flow; fractional anisotropy, or functional activity in a brain region. N was the number of features; gi(x) denoted a set of nonlinear transformations and b was the “bias” term. It is well known that the SVR generalization performance (estimation accuracy) depends on the setting the meta‐parameter C and kernel parameters (Smola & Scholkopf, 2004). We applied a 10‐fold CV to evaluate the performance of the prediction model and a 5‐fold CV was used to find the best meta‐parameter C from the training dataset (see Section 2.4.4. below). Since the coefficients from the SVR with nonlinear kernel are not easily interpretable, we used SVR only for the purpose of prediction. We used the R package caret() for SVR analyses.
As previously noted, 116 subjects were included in this part of analysis after filtering missing data. Each predictor variable (identified in the feature preselection) was centered and standardized before being entered into the SVR models. We evaluated the prediction performance of four single‐modality models (one for each imaging modality) and one multimodal model (including all four imaging modalities). This procedure yielded a total of 30 prediction models (6 language measures * 5 prediction models). Sex, age, and time poststroke were included as features in all of these prediction models.
2.4.4. 10‐fold CV
In constructing and evaluate the fitness of the SVR prediction models, we applied 10‐fold CV procedure. The general idea behind the 10‐fold CV is to divide the dataset into a training (nine folds) and a testing dataset (one fold), leaving only 1 in 10 participants in the testing dataset and the rest of the participants in the training dataset. The information from the training data were used to estimate the parameters in the model (i.e., the coefficients ωi and the offset b in f(x, ω)) and then the model will be applied to the testing dataset to predict each language outcome. The same procedure was repeated with each one‐fold of subjects serving as the left‐out participants for a total of 10 iterations. Each subject received a predicted value of the language outcome and the prediction accuracy was therefore calculated as the Pearson's correlation coefficient between the predicted and observed values. This method of CV was applied in predicting all six language measures.
2.4.5. Prediction based on lesion volume
In addition to predictions based on specific neuroimaging modalities, we predicted the behavioral scores from lesion volume. In order to enable a fair comparison across all models, an SVR was similarly used to predict language scores based on lesion volume. Lesion volume (i.e., the number of lesioned voxels within the lesion map) served as the only main predictor variable in separate analyses for each language measure while adjusting for sex, age, and time poststroke. The predictor variable was centered and standardized before being entered into the SVR model.
2.4.6. Model comparison
The accuracy of our prediction models was evaluated by computing Pearson's correlations between actual WAB scores and predicted WAB scores. A one‐sided Hotelling–Williams test was used to test whether the multimodal prediction model was significantly more accurate than any of the single‐modality prediction models for each language measure (Steiger, 1980; Williams, 1959). Hotelling–Williams test was used for dependent correlations and thus serves as an ideal test for our hypotheses. p‐Values <.05 were considered indicative of statistically significant differences across models.
3. RESULTS
3.1. Aim 1: accuracy of single‐modality and multimodal prediction models
Our preliminary data analysis yielded several interesting results that are highly relevant for the prediction models. First, correlations across modality‐specific data matrices are shown in Table 3. In terms of specific modality‐pairs, the strongest absolute correlation for CBF was with lesion‐load data (r = .205); the strongest correlation for FA was with lesion‐load data (r = .370); the strongest correlation for fMRI was with FA data (r = .090); and, the strongest correlation for lesion‐load data was with FA data (r = .370), which was also the strongest correlation found in the analysis. Overall, fMRI had the weakest average correlation across all modalities.
As for demographic and biographical variables, our linear regression models tested the association between language measures and sex, age, time poststroke, and lesion volume (Table 4). The only significant association was found between lesion volume and all language measures (all p‐values <.001). A two‐sample t‐test revealed that mean lesion volume differed significantly by sex (females vs. males: 96.10 cm3 vs. 131.27 cm3, p = .0087). Given this confounding relationship between sex and lesion volume, we included sex as a covariate in the feature selection analysis step as noted above (Section 2.4.2). Age and time poststroke were also included as covariates in the feature selection.
These prior analysis steps were considered for preselection of features. The univariate regression analysis yielded 89 features significantly associated with WAB‐AQ (Table 5), including 19 CBF ROIs, 35 lesion‐load ROIs, 33 FA ROIs, and 2 fMRI ROIs. A total of 91, 85, 85, 75, and 78 features were selected for Fluency, Spontaneous Speech, Naming, Speech Repetition, and Auditory Comprehension, respectively (Tables [Link], [Link]). Overall, most features were identified for lesion‐load and diffusion‐based measures across all language measures, with the fewest features being identified for fMRI.
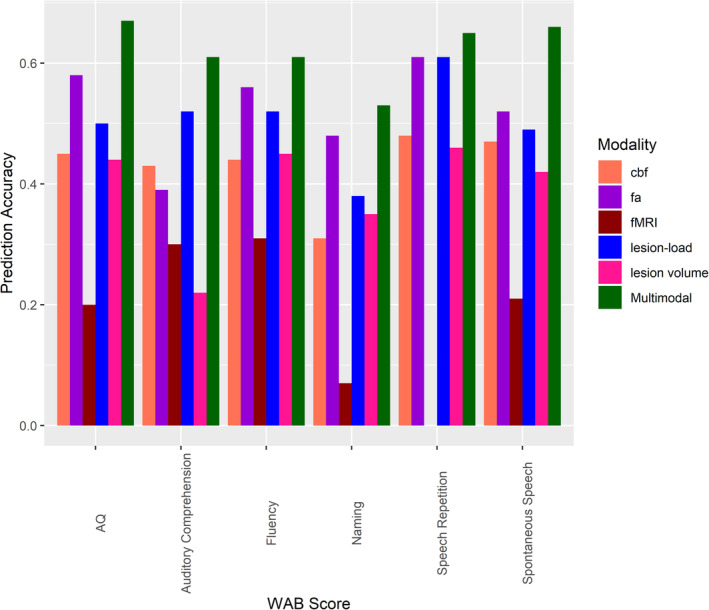
Prediction accuracy (correlation between actual and predicted scores) for all models is shown in Table 6 and plotted in Figure 2. In addition to the 30 models using single and multimodal prediction of language measures, the table includes a prediction based on lesion volume alone. The number of predictors differs depending on modality and language measure. For example, the CBF model predicting WAB‐AQ incorporated 19 predictors, whereas the multimodal model incorporated all 89 preselected features found to be significantly associated with WAB‐AQ scores for the same prediction. For clarification on this distinction, we refer to the results from our preselection analysis shown in Table 5 (WAB‐AQ) and Tables [Link], [Link] (other language measures).
TABLE 6.
Accuracy of prediction models (SVR) for all language measures
| WAB score | CBF | FA | fMRI | Lesion‐load | Lesion volume | Multimodal |
|---|---|---|---|---|---|---|
| AQ | 0.45 (445.91) | 0.58 (377.7) | 0.20 (549.48) | 0.5 (440.47) | 0.44 (469.36) | 0.67 (308.49) |
| Fluency | 0.44 (7.36) | 0.56 (6.14) | 0.31 (8.15) | 0.52 (6.63) | 0.45 (7.2) | 0.61 (5.64) |
| Spontaneous speech | 0.47 (20.77) | 0.52 (19.25) | 0.21 (25.5) | 0.49(20.05) | 0.42 (22.02) | 0.66 (15.12) |
| Naming | 0.31 (8.04) | 0.48 (6.99) | 0.07 (9.15) | 0.38(7.66) | 0.35 (7.76) | 0.53(6.27) |
| Repetition | 0.48 (8.89) | 0.61 (7.27) | 0 (0) | 0.61(7.26) | 0.46 (9.29) | 0.65(6.64) |
| Auditory comprehension | 0.43 (2.48) | 0.39 (2.62) | 0.3 (2.83) | 0.52(2.25) | 0.22 (3.06) | 0.61(1.87) |
Note: The accuracy was measured by the Pearson's correlation estimate between actual and predicted scores. Mean Square Error (MSE) is shown in brackets. CBF, cerebral blood flow; FA, fractional anisotropy; fMRI, functional magnetic resonance imaging. The multimodal prediction model incorporated all neuroimaging modalities simultaneously.
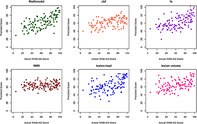
FIGURE 2.
Predictive performance of the multimodal prediction model and single‐modality models for all language measures. Model prediction performance was compared for each outcome score. The multimodal prediction model incorporated all neuroimaging modalities. All other models are based on single modalities. cbf: cerebral blood flow; fa: fractional anisotropy; fMRI: functional magnetic resonance imaging
The multimodal prediction model was more accurate than any single‐modality model in predicting all six language measures (Figure 2): WAB‐AQ (r = .67; single‐modality models: .20–.58; Figure 3), Fluency (r = .61, single‐modality models: .31–.56), Spontaneous Speech (r = .66; single‐modality models: .21–.52), Naming (r = .53; single‐modality models: .07–.48), Speech Repetition (r = .65; single‐modality models: .00–.61), and Auditory Comprehension (r = .61; single‐modality models: .22–.52). Overall, the correlation between actual and predicted scores was .04–.65 higher for the multimodal over any single‐modality model. The multimodal model predicting WAB‐AQ similarly explained a greater amount of variance in performance compared to any single‐modality model (range: .03–.36).
FIGURE 3.

Predicted WAB‐AQ scores based on the multimodal, single modality, and lesion volume prediction models. Each dot represents a patient. The multimodal prediction model yielded significantly more accurate prediction of WAB‐AQ than any single modality or lesion volume model (predicted vs. actual scores: r = .67 and MSE = 308.49)
3.2. Aim 2: comparison of prediction accuracy across models
In terms of statistical comparison of model accuracy, the multimodal prediction model was significantly more accurate than any single‐modality and the lesion‐volume model in predicting WAB‐AQ (p‐value range: <.001–.022), Spontaneous Speech (p‐value range: <.001–.003), Speech Repetition (p‐value range: <.001–.046), and Auditory Comprehension (p‐value range: <.001–.034). Furthermore, the multimodal model yielded a prediction accuracy that was significantly superior to all predictions based on the CBF, fMRI, and lesion‐load modalities alone and the lesion volume model (all p‐values <.05). However, statistical superiority was not obtained for prediction of Fluency and Naming compared to the FA modality. Although the multimodal prediction model was not statistically more accurate in these instances, a trend was always observed in favor of the multimodal. Table 7 presents the p‐values comparing the multimodal prediction accuracy to any single‐modality and lesion‐volume prediction models based on the one‐sided Hotelling–Williams test.
TABLE 7.
Hotelling–Williams test comparing the prediction accuracy of the multimodal prediction model to single modality and lesion volume models
| WAB score | CBF | FA | fMRI | Lesion‐load | Lesion volume |
|---|---|---|---|---|---|
| AQ | .0014 | .0216 | <.001 | <.001 | <.001 |
| Fluency | .0098 | .1441 | <.001 | .0291 | .0045 |
| Spontaneous speech | .003 | <.001 | <.001 | <.001 | <.001 |
| Naming | .0046 | .2949 | <.001 | .0055 | .0155 |
| Repetition | <.001 | .0353 | <.001 | .0455 | <.001 |
| Auditory comprehension | .0135 | <.001 | <.001 | .0338 | <.001 |
Note: The table presents p‐values comparing each modality‐specific model to the multimodal prediction model using a one‐sided Hotelling–Williams test. CBF, cerebral blood flow; FA, fractional anisotropy; fMRI, functional magnetic resonance imaging.
4. DISCUSSION
The current study demonstrates that a prediction model incorporating several different neuroimaging modalities yields, in most cases, a significantly more accurate prediction of aphasia severity and specific language measures compared to any single‐modality prediction model and a model based on lesion volume alone. Our findings, therefore, are consistent with the notion that different neuroimaging modalities carry, at least to a certain extent, unique information that can complement other measures and be harnessed to further our understanding of the relationship between brain damage and language function in individuals with chronic stroke‐induced aphasia (Del Gaizo et al., 2017; Pustina et al., 2017; Yourganov et al., 2016). Considering findings to the contrary (Halai et al., 2020; Hope et al., 2018), our data suggest that prediction accuracy not only depends on the construction of robust computational models, but also on the specific modalities implemented in the prediction models. Further, supplementary analyses revealed separable neural correlates associated with measures of each specific language outcome.
Our first aim examined the accuracy with which overall aphasia severity and specific language measures could be predicted based on separate SVR models for each of four different neuroimaging modalities (CBF, FA, fMRI, and lesion‐load) and from an SVR model incorporating lesion volume as a single independent predictor. Aphasia severity, measured as the Western Aphasia Battery “aphasia quotient” (WAB‐AQ), was predicted with similar accuracy across all models except the fMRI model (actual vs. predicted r = .44–.58; fMRI: r = .20). This finding is perhaps not surprising in light of prior work indicating that WAB‐AQ is associated with extensive cortical network damage (Fridriksson, Den Ouden, et al., 2018; Fridriksson, Rorden, et al., 2018). As such, white matter integrity (FA), perfusion (CBF), lesion‐load, and lesion volume may represent different means of characterizing the manifestation of brain damage in this respect. Fluency and Spontaneous Speech scores tended to be most accurately predicted by the FA‐ and lesion‐load models. Both of these measures can reasonably be thought of as multidimensional in nature, encompassing distinct aspects of speech, such as grammar, articulation, and semantic and phonological processing, and weigh heavily on the dorsal stream of speech processing (Fridriksson et al., 2016; Hickok & Poeppel, 2007). To this end, both models may be thought of as representing overall network integrity. Greater variability was observed in predicting Naming score (actual vs. predicted r = .07–.48 across models). The FA‐model was most accurate (r = .48), whereas no other single‐modality model obtained a prediction accuracy >.40. Anomia, that is, a problem with word finding, is generally considered a hallmark symptom affecting virtually all individuals with aphasia (Goodglass & Wingfield, 1997). Consistent with the commonly agreed upon view that anomia may be caused by impairment at several different processing levels, for example, phonology, lexical, or semantic, anomic aphasia has no specific lesion location (Fridriksson, Den Ouden, et al., 2018; Fridriksson, Rorden, et al., 2018; Yourganov et al., 2015). Thus, the FA‐model may be thought of as representing overall network integrity over and above the other models in this case. Speech Repetition and Auditory Comprehension scores, both weighing heavily on the ventral stream of speech processing (Fridriksson et al., 2016; Fridriksson, Den Ouden, et al., 2018; Fridriksson, Rorden, et al., 2018; Hickok & Poeppel, 2007), were most accurately predicted by leveraging lesion‐load data (r = .61 and .52, respectively) and the FA‐model was as accurate for predicting Speech Repetition only (r = .061). One potential reason for this may be that more focal neurobiological substrates underly these language functions (Baldo, Katseff, & Dronkers, 2012; Bates et al., 2003; Bonilha et al., 2017; Kristinsson et al., 2020; Kummerer et al., 2013; Pillay, Binder, Humphries, Gross, & Book, 2017; Rogalsky et al., 2015), and, thus, that lesions to or integrity of particular ROIs have more profound implications within the prediction models compared to the information captured in other neuroimaging modalities.
Our second primary aim tested the hypothesis that a model incorporating all modalities would outperform each single‐modality model. Our hypothesis was supported in 28/30 model comparisons. Prediction accuracy of the multimodal model ranged from .53 (Naming) to .67 (WAB‐AQ). The accuracy in predicting WAB‐AQ is comparable to that obtained by Yourganov et al. (2016; r = .69) and Pustina et al. (2017) in their out‐of‐sample prediction model (r = .66), albeit substantially lower than the prediction accuracy obtained by Del Gaizo et al. (2017; r = .76). We similarly obtained a lower accuracy in predicting Fluency score compared to Yourganov et al. (r = .61 vs. .75) and Del Gaizo et al. (r = .73), but our model was more accurate in predicting Auditory Comprehension score compared to Yourganov et al. (r = .61 vs. .48), and similar for other measures. It should be noted in this context that obtaining the highest possible prediction accuracy was not our primary goal. Rather, we aimed to examine the added benefit of incorporating multiple neuroimaging modalities versus single‐modality prediction models when the models were constructed from the same pool of preselected features and adjusting for variance explained by covariates of interest (in this case, sex, age, and TPS). Therefore, our results are directly comparable to those of Pustina et al. (2017) and Del Gaizo et al. (2017) in revealing statistical superiority of multimodal as compared to single‐modality prediction models.
However, our results seem to contradict the findings of Hope et al. (2018) and Halai et al. (2020), where the authors noted no added benefit of combining lesion‐load data and connectome disruption data. There are several potential reasons for this apparent discrepancy in findings. First, the key element driving these differences might lie in the precise neuroimaging modalities incorporated across these studies. We incorporated several different modalities, whereas the prior studies specifically investigated whether including connectome disruption data enhanced prediction accuracy compared to modeling based only on T1/T2‐extracted lesion‐load data. While numerous prior studies have established that disruptions in connectivity are associated with aphasia deficits (Bonilha, Rorden, et al., 2014; Forkel et al., 2014; Fridriksson, Guo, Fillmore, Holland, & Rorden, 2013; Mirman et al., 2015) and effective elicitation of aphasic features via direct electoral stimulation to white matter fasciculi (Duffau et al., 2008; Kinoshita et al., 2015), connectome and lesion data are, nonetheless, strongly correlated (Hope et al., 2018; Yourganov et al., 2016). In our analysis, we additionally incorporated modalities that are less strongly correlated (see Table 3). We intentionally leveraged imaging data that capture both the extent of lesion damage and data that reveal remaining functionality within white matter and cortical regions. The idea behind this is rather simple. Language impairment following stroke depends on multiple factors beyond lesion location (Bonilha, Nesland, et al., 2014; Corbetta et al., 2015; Ramsey et al., 2017; Thye & Mirman, 2018), such as the extent to which networks remain functional, integrity of structural networks, and dynamic reorganization of the language networks. In this context, while the predictive power of each modality is important, it is the interaction between modalities that presumably yields enhanced prediction accuracy in multimodal prediction models.
Second, our region of interest analysis utilized a brain parcellation of cortical, subcortical, and white matter tracts (AALCTS; Catani & Thiebaut de Schotten, 2008; Tzourio‐Mazoyer et al., 2002; see Yourganov et al. (2015) for a further description). This enabled us to more accurately examine the impact of both lesion to, and functionality within, major white matter tracts, such as the arcuate fasciculus and inferior frontal occipital fasciculus, and, more importantly, to account for functionality and lesions at the same time. Hope et al. implemented the same cortical parcellation template (AAL), albeit without consideration of subcortical regions, whereas Halai et al. examined the effect of various different parcellations. Indeed, Halai et al. found that prediction accuracy for PCA‐derived language functions was at least partially dependent on the brain parcellation. This finding may suggest that close consideration of how the brain is divided into parcels is necessary for predicting language processing in aphasia. While these noted analysis differences might be considered substantial, other less significant differences may similarly explain discrepant findings. These include, but are not limited to, our use of the WAB as our primary aphasia test batteries; relatively large average lesion volume in our sample (122.61 cm3; note, neither Halai and colleagues nor Hope and colleagues report average lesion volume); the fact that we derived connectivity data from subject‐specific diffusion data as opposed to deriving it from individual T1‐weighted MRI (Hope et al., 2018); and, the inter‐individual variability in the behavioral presentation of aphasia (e.g., Price et al., 2016).
There are several limitations to the present study. First, we performed feature‐selection to reduce the dimensionality of our dataset. It is certainly possible that features eliminated based on their weak correlation with language measures could potentially have improved our prediction models by interacting with other variables in the models. Similarly, features were retained based on their linear relationship with the outcome variables, which introduces the possibility of nonlinear relationships being removed. Finally, since preselection was performed on the entire sample, it is possible that the accuracy of the subsequent CV was slightly skewed. Second, our fMRI data was collected using a naming task unrelated to the dependent variables in our study. While our intention was to identify task‐based activation in the language network, we cannot reliably state that the activation is equivalent to functional recruitment of intact brain tissue in our behavioral tasks outside the scanner. This caveat may be represented in the few preselected fMRI features and the predictive value (or lack thereof) of these features. Last, we did not validate the prediction accuracy of our models in an independent sample of persons with aphasia. As noted above, the ecological value of multimodal prediction lies in predicting language function and treatment response in “new” cases. Future studies might undertake the task of constructing prediction models for treatment response—which undoubtedly will further improve our understanding of the neurobiology of treated aphasia recovery.
In conclusion, the current study reports a successful effort to improve single‐modality prediction accuracy of language measures in chronic aphasia by including multiple imaging modalities in the predictive models. As such, we consider our results to hold substantial promise for the ultimate goal of improving prediction of behavioral treatment response in aphasia. This line of research, as has been argued here, is based on the idea that poststroke brain damage can be understood as a combination of frank vascular injury and disconnection (see Bonilha, Nesland, et al., 2014; Bonilha, Rorden, et al., 2014; Marchina et al., 2011). As an illustration of this point, white matter tracts may be subject to lesion damage at various segments of the tract, which may lead to similar manifestations of aphasia symptoms, albeit stemming from seemingly spatially distant lesions. Corresponding findings include studies showing more accurate prediction of behavioral outcomes from structural disconnection compared to lesion location (Hope, Seghier, Prejawa, Leff, & Price, 2016; Kuceyeski et al., 2015, 2016). Even though convincing contradictory findings have been reported on this matter (Halai et al., 2020; Hope et al., 2018), we suggest that successfully harnessing the unique information carried within each distinct imaging modalities remains a valuable goal for researchers seeking to fully understand the neurobiological underpinnings of aphasia and personalize aphasia treatment.
Supporting information
Appendix S1: Supporting Information
Table S1 Comparison of several cross‐validation paradigms. Pearson's correlation and mean squared error compared across LOOCV, 5‐, and 10‐fold linear and radial kernels.
Table S2 Features significantly associated with Fluency. Features refer to modality‐specific ROIs. Features were retained if adjusted p‐value <.05 after Benjamini & Hochberg correction for multiple comparisons.
Table S3 Features significantly associated with Spontaneous Speech. Features refer to modality‐specific ROIs. Features were retained if adjusted p‐value <.05 after Benjamini & Hochberg correction for multiple comparisons.
Table S4 Features significantly associated with Naming. Features refer to modality‐specific ROIs. Features were retained if adjusted p‐value <.05 after Benjamini & Hochberg correction for multiple comparisons.
Table S5 Features significantly associated with Repetition. Features refer to modality‐specific ROIs. Features were retained if adjusted p‐value <.05 after Benjamini & Hochberg correction for multiple comparisons.
Table S6 Features significantly associated with Auditory Comprehension. Features refer to modality‐specific ROIs. Features were retained if adjusted p‐value < .05 after Benjamini & Hochberg correction for multiple comparisons.
Kristinsson S, Zhang W, Rorden C, et al. Machine learning‐based multimodal prediction of language outcomes in chronic aphasia. Hum Brain Mapp. 2021;42:1682–1698. 10.1002/hbm.25321
Sigfus Kristinsson and Wanfang Zhang authors contributed equally.
Funding information National Institute on Deafness and Other Communication Disorders, Grant/Award Numbers: P50 DC014664, R01 DC008355, R01 DC009571, R01 DC011739, R03 DC005915, R03 DC010262, R21 DC014170, T32 DC014435
Contributor Information
Sigfus Kristinsson, sigfus@email.sc.edu.
Feifei Xiao, Email: xiaof@mailbox.sc.edu.
DATA AVAILABILITY STATEMENT
Data sharing is not applicable to this article as no new data were created or analyzed in this study.
REFERENCES
- Andersson, J. L. , Skare, S. , & Ashburner, J. (2003). How to correct susceptibility distortions in spin‐echo echo‐planar images: Application to diffusion tensor imaging. NeuroImage, 20, 870–888. 10.1016/S1053-8119(03)00336-7 [DOI] [PubMed] [Google Scholar]
- Andersson, J. L. , & Sotiropoulos, S. N. (2016). An integrated approach to correction for off‐resonance effects and subject movement in diffusion MR imaging. NeuroImage, 125, 1063–1078. 10.1016/j.neuroimage.2015.10.019 [DOI] [PMC free article] [PubMed] [Google Scholar]
- Ashburner, J. , Chen, C. , Moran, R. , Henson, R. , Glauche, V. , & Phillips, C. (2012). SPM12 manual the FIL methods group (and honorary members). Retrieved from http://www.fil.ion.ucl.ac.uk/spm/doc/spm12_manual.pdf
- Ashburner, J. , & Friston, K. J. (2005). Unified segmentation. NeuroImage, 26, 839–851. 10.1016/j.neuroimage.2005.02.018 [DOI] [PubMed] [Google Scholar]
- Baldo, J. V. , Katseff, S. , & Dronkers, N. F. (2012). Brain regions underlying repetition and auditory‐verbal short‐term memory deficits in aphasia: Evidence from voxel‐based lesion symptom mapping. Aphasiology, 26(3–4), 338–354. 10.1080/02687038.2011.602391 [DOI] [PMC free article] [PubMed] [Google Scholar]
- Bates, E. , Wilson, S. M. , Saygin, A. P. , Dick, F. , Sereno, M. I. , Knight, R. T. , & Dronkers, N. F. (2003). Voxel‐based lesion‐symptom mapping. Nature Neuroscience, 6, 448–450. 10.1038/nn1050 [DOI] [PubMed] [Google Scholar]
- Beaulieu, C. (2002). The basis of anisotropic water diffusion in the nervous system—A technical review. NMR in Biomedicine, 15, 435–455. 10.1002/nbm.782 [DOI] [PubMed] [Google Scholar]
- Benjamini, Y. , & Hochberg, Y. (1995). Controlling the false discovery rate: A practical and powerful approach to multiple testing. Journal of the Royal Statistical Society, 57(1), 289–300. [Google Scholar]
- Bonilha, L. , Hillis, A. E. , Hickok, G. , den Ouden, D. B. , Rorden, C. , & Fridriksson, J. (2017). Temporal lobe networks supporting the comprehension of spoken words. Brain, 140(9), 2370–2380. 10.1093/brain/awx169 [DOI] [PMC free article] [PubMed] [Google Scholar]
- Bonilha, L. , Nesland, T. , Rorden, C. , Fillmore, P. , Ratnayake, R. P. , & Fridriksson, J. (2014). Mapping remote subcortical ramifications of injury after ischemic strokes. Behavioral Neurology, 2014, 1–6. 10.1155/2014/215380 [DOI] [PMC free article] [PubMed] [Google Scholar]
- Bonilha, L. , Rorden, C. , & Fridriksson, J. (2014). Assessing the clinical effect of residual cortical disconnection after ischemic strokes. Stroke, 45, 988–993. 10.1161/STROKEAHA.113.004137 [DOI] [PMC free article] [PubMed] [Google Scholar]
- Brady, M. , Kelly, H. , Godwin, J. , & Enderby, P. (2012). Speech and language therapy for aphasia following stroke. Cochrane Database of Systematic Reviews, 16(5), CD000425. 10.1002/14651858.CD000425.pub3 [DOI] [PubMed] [Google Scholar]
- Brady, M. , Kelly, H. , Godwin, J. , Enderby, P. , & Campbell, P. (2016). Speech and language therapy for aphasia following stroke. Cochrane Database of Systematic Reviews, 6, CD000425. 10.1002/14651858.CD000425.pub4 [DOI] [PMC free article] [PubMed] [Google Scholar]
- Breitenstein, C. , Grewe, T. , Flöel, A. , Ziegler, W. , Springer, L. , Martus, P. , … Haeusler, K. G. (2017). Intensive speech and language therapy in patients with chronic aphasia after stroke: A randomised, open‐label, blinded‐endpoint, controlled trial in a health‐care setting. The Lancet, 389(10078), 1528–1538. 10.1016/S0140-6736(17)30067-3 [DOI] [PubMed] [Google Scholar]
- Broca, P. (1965). Sur le Siége de la faculté du langage articlé. Bulletins of Social Anthropology, 6, 377–396. [Google Scholar]
- Butler, R. A. , Lambon Ralph, M. A. , & Woollams, A. M. (2014). Capturing multidimensionality in stroke aphasia: Mapping principal behavioural components to neural structures. Brain: A Journal of Neurology, 137(Pt 12, 3248–3266. 10.1093/brain/awu286 [DOI] [PMC free article] [PubMed] [Google Scholar]
- Catani, M. , & Thiebaut de Schotten, M. (2008). A diffusion tensor imaging tractography atlas for virtual in vivo dissections. Cortex, 44(8), 1105–1132. 10.1016/j.cortex.2008.05.004 [DOI] [PubMed] [Google Scholar]
- Corbetta, M. , Ramsey, L. , Callejas, A. , Baldassarre, A. , Hacker, C. D. , Siegel, J. S. , … Shulman, G. L. (2015). Common behavioral clusters and subcortical anatomy in stroke. Neuron, 85, 927–941. 10.1016/j.neuron.2015.02.027 [DOI] [PMC free article] [PubMed] [Google Scholar]
- Crosson, B. , Rodriguez, A. D. , Copland, D. , Fridriksson, J. , Krishnamurthy, L. C. , Meinzer, M. , … Leff, A. P. (2019). Neuroplasticity and aphasia treatments: New approaches for an old problem. Journal of Neurology, Neurosurgery & Psychiatry, 90(10), 1147–1155. 10.1136/jnnp-2018-319649 [DOI] [PMC free article] [PubMed] [Google Scholar]
- Del Gaizo, J. , Fridriksson, J. , Yourganov, G. , Hillis, A. E. , Hickok, G. , Misic, B. , … Bonilha, L. (2017). Mapping language networks using the structural and dynamic brain connectomes. eNeuro, 4(5), ENEU17.2017. 10.1523/ENEURO.0204-17.2017 [DOI] [PMC free article] [PubMed] [Google Scholar]
- Duffau, H. , Peggy Gatignol, S. T. , Mandonnet, E. , Capelle, L. , & Taillandier, L. (2008). Intraoperative subcortical stimulation mapping of language pathways in a consecutive series of 115 patients with grade II glioma in the left dominant hemisphere. Journal of Neurosurgery, 109(3), 461–471. 10.3171/JNS/2008/109/9/0461 [DOI] [PubMed] [Google Scholar]
- Ellis, C. , & Urban, S. (2016). Age and aphasia: A review of presence, type, recovery, and clinical outcomes. Topics in Stroke Rehabilitation, 23(6), 430–439. 10.1080/10749357.2016.1150412 [DOI] [PubMed] [Google Scholar]
- Engelter, S. T. , Gostynski, M. , Papa, S. , Frei, M. , Born, C. , Ajdacic‐Gross, V. , … Lyrer, P. A. (2006). Epidemiology of aphasia attributable to first ischemic stroke: Incidence, severity, fluency, etiology, and thrombolysis. Stroke, 37(6), 1379–1384. 10.1161/01.STR.0000221815.64093.8c [DOI] [PubMed] [Google Scholar]
- Feigin, V. , Abajobir, A. , Abate, K. , Abd‐Allah, F. , Abdulle, A. , Abera, S. , … Vos, T. (2017). Global, regional, and national burden of neurological disorders during 1990‐2015: A systematic analysis for the global burden of disease study 2015. The Lancet Neurology, 16, 877–897. 10.1016/S1474-4422(17)30299-5 [DOI] [PMC free article] [PubMed] [Google Scholar]
- Feigin, V. L. , Forouzanfar, M. H. , Krishnamurthi, R. , Mensah, G. A. , Connor, M. , Bennett, D. A. , … Murray, C. (2014). Global and regional burden of stroke during 1990‐2010: Findings from the global burden of disease study 2010. Lancet (London, England), 383(9913), 245–254. 10.1016/s0140-6736(13)61953-4 [DOI] [PMC free article] [PubMed] [Google Scholar]
- Feigin, V. L. , Krishnamurthi, R. V. , Parmar, P. , Norrving, B. , Mensah, G. A. , Bennett, D. A. , … Truelsen, T. (2015). Update on the global burden of ischemic and hemorrhagic stroke in 1990‐2013: The GBD 2013 study. Neuroepidemiology, 45(3), 161–176. 10.1159/000441085 [DOI] [PMC free article] [PubMed] [Google Scholar]
- Forkel, S. J. , Thiebaut de Schotten, M. , Dell'Acqua, F. , Kalra, L. , Murphy, D. G. , Williams, S. C. , & Catani, M. (2014). Anatomical predictors of aphasia recovery: A tractography study of bilateral perisylvian language networks. Brain, 137(Pt 7, 2027–2039. 10.1093/brain/awu113 [DOI] [PubMed] [Google Scholar]
- Fridriksson, J. (2010). Preservation and modulation of specific left hemisphere regions is vital for treated recovery from anomia in stroke. Journal of Neuroscience, 30(35), 11558–11564. 10.1523/JNEUROSCI.2227-10.2010 [DOI] [PMC free article] [PubMed] [Google Scholar]
- Fridriksson, J. , Den Ouden, D. B. , Hillis, A. E. , Hickok, G. , Rorden, C. , Basilakos, A. , … Bonilha, L. (2018). Anatomy of aphasia revisited. Brain, 141, 848–862. 10.1093/brain/awx363 [DOI] [PMC free article] [PubMed] [Google Scholar]
- Fridriksson, J. , Guo, D. , Fillmore, P. , Holland, A. , & Rorden, C. (2013). Damage to the anterior arcuate fasciculus predicts non‐fluent speech production in aphasia. Brain, 136, 3451–3460. 10.1093/brain/awt267 [DOI] [PMC free article] [PubMed] [Google Scholar]
- Fridriksson, J. , Rorden, C. , Elm, J. , Sen, S. , George, M. S. , & Bonilha, L. (2018). Transcranial direct current stimulation (tDCS) to treat aphasia after stroke: A prospective randomized double blinded trial. JAMA Neurology, 75(12), 1470–1476. 10.1001/jamaneurol.2018.2287 [DOI] [PMC free article] [PubMed] [Google Scholar]
- Fridriksson, J. , Yourganov, G. , Bonilha, L. , Basilakos, A. , den Ouden, D. B. , & Rorden, C. (2016). Revealing the dual streams of speech processing. Proceedings of the National Academy of Sciences of the United States of America, 113(52), 15108–15113. 10.1073/pnas.1614038114 [DOI] [PMC free article] [PubMed] [Google Scholar]
- Giroud, M. , Jacquin, A. , & Béjot, Y. (2014). The worldwide landscape of stroke in the 21st century. Lancet (London, England), 383(9913), 195–197. 10.1016/s0140-6736(13)62077-2 [DOI] [PubMed] [Google Scholar]
- Goodglass, H. , & Wingfield, A. (1997). Anomia: Neuroanatomical and cognitive correlates. San Diego, CA: Academic Press. [Google Scholar]
- Halai, A. D. , Woollams, A. M. , & Lambon Ralph, M. A. (2017). Using principal component analysis to capture individual differences within a unified neuropsychological model of chronic post‐stroke aphasia: Revealing the unique neural correlates of speech fluency, phonology and semantics. Is a “Single” Brain Model Sufficient? 86, 275–289. 10.1016/j.cortex.2016.04.016 [DOI] [PMC free article] [PubMed] [Google Scholar]
- Halai, A. D. , Woollams, A. M. , & Lambon Ralph, M. A. (2018). Predicting the pattern and severity of chronic post‐stroke language deficits from functionally‐partitioned structural lesions. NeuroImage. Clinical, 19, 1–13. 10.1016/j.nicl.2018.03.011 [DOI] [PMC free article] [PubMed] [Google Scholar]
- Halai, A. D. , Woollams, A. M. , & Lambon Ralph, M. A. (2020). Investigating the effect of changing parameters when building prediction models for post‐stroke aphasia. Nature Human Behaviour, 4(7), 725–735. 10.1038/s41562-020-0854-5 [DOI] [PMC free article] [PubMed] [Google Scholar]
- Hickok, G. , & Poeppel, D. (2007). The cortical organization of speech processing. Nature Review Neuroscience, 8(5), 393–402. 10.1038/nm2113 [DOI] [PubMed] [Google Scholar]
- Hope, T. M. H. , Leff, A. P. , Prejawa, S. , Bruce, R. , Haigh, Z. , Lim, L. , … Price, C. J. (2017). Right hemisphere structural adaptation and changing language skills years after left hemisphere stroke. Brain: A Journal of Neurology, 140(6), 1718–1728. 10.1093/brain/awx086 [DOI] [PMC free article] [PubMed] [Google Scholar]
- Hope, T. M. H. , Leff, A. P. , & Price, C. J. (2018). Predicting language outcomes after stroke: Is structural disconnection a useful predictor? NeuroImage: Clinical, 19, 22–29. 10.1016/j.nicl.2018.03.037 [DOI] [PMC free article] [PubMed] [Google Scholar]
- Hope, T. M. H. , Seghier, M. L. , Leff, A. P. , & Price, C. J. (2013). Predicting outcome and recovery after stroke with lesions extracted from MRI images. NeuroImage: Clinical, 2, 424–433. 10.1016/j.nicl.2013.03.005 [DOI] [PMC free article] [PubMed] [Google Scholar]
- Hope, T. M. H. , Seghier, M. L. , Prejawa, S. , Leff, A. P. , & Price, C. J. (2016). Distinguishing the effect of lesion load from tract disconnection in the arcuate and uncinate fasciculi. NeuroImage, 125, 1169–1173. 10.1016/j.neuroimage.2015.09.025 [DOI] [PMC free article] [PubMed] [Google Scholar]
- Hsu, C.‐W. , Chang, C.‐C. , & Lin, C.‐J. (2003). A practical guide to support vector classification. Technical Report, Department of Computer Science, National Taiwan University.
- Jenkinson, M. , Beckmann, C. F. , Behrens, T. E. J. , Woolrich, M. W. , & Smith, S. M. (2012). FSL. NeuroImage, 2, 782–790. 10.1016/j.neuroimage.2011.09.015 [DOI] [PubMed] [Google Scholar]
- Kertesz, A. (1982). Western aphasia battery test manual. New York: Psychological Corp. [Google Scholar]
- Kertesz, A. (2007). Western aphasia battery–Revised (WAB‐R). San Antonio, TX: Pearson. [Google Scholar]
- Kertesz, A. , & McCabe, P. (1977). Recovery patterns and prognosis in aphasia. Brain: A Journal of Neurology, 100(Pt 1, 1–18. 10.1093/brain/100.1.1 [DOI] [PubMed] [Google Scholar]
- Kilroy, E. , Apostolova, L. , Liu, C. , Yan, L. , Ringman, J. , & Wang, D. J. (2014). Reliability of two‐dimensional and three‐dimensional pseudo‐continuous arterial spin labeling perfusion MRI in elderly populations: Comparison with 15O‐water positron emission tomography. Journal of Magnetic Resonance Imaging, 39(4), 931–939. 10.1002/jmri.24246 [DOI] [PMC free article] [PubMed] [Google Scholar]
- Kim, J. S. (2014). Stroke in Asia: A global disaster. International Journal of Stroke: Official Journal of the International Stroke Society, 9(7), 856–857. 10.1111/ijs.12317 [DOI] [PubMed] [Google Scholar]
- Kinoshita, M. , de Champfleur, N. M. , Deverdun, J. , Moritz‐Gasser, S. , Herbet, G. , & Duffau, H. (2015). Role of fronto‐striatal tract and frontal aslant tract in movement and speech: An axonal mapping study. Brain Structure & Function, 220(6), 3399–3412. 10.1007/s00429-014-0863-0 [DOI] [PubMed] [Google Scholar]
- Kiran, S. , & Thompson, C. K. (2019). Neuroplasticity of language networks in aphasia: Advances, updates, and future challenges. Frontiers in Neurology, 10(295). 10.3389/fneur.2019.00295 [DOI] [PMC free article] [PubMed] [Google Scholar]
- Kissela, B. M. , Khoury, J. C. , Alwell, K. , Moomaw, C. J. , Woo, D. , Adeoye, O. , … La Rosa, F. D. L. R. (2012). Age at stroke temporal trends in stroke incidence in a large, biracial population. Neurology, 79(17), 1781–1787. 10.1212/WNL.0b013e318270401d [DOI] [PMC free article] [PubMed] [Google Scholar]
- Kristinsson, S. , Thors, H. , Yourganov, G. , Magnusdottir, S. , Hjaltason, H. , Stark, B. C. , … Fridriksson, J. (2020). Brain damage associated with impaired sentence processing in acute aphasia. Journal of Cognitive Neuroscience, 32(2), 256–271. 10.1162/jocn_a_01478 [DOI] [PMC free article] [PubMed] [Google Scholar]
- Kuceyeski, A. , Navi, B. B. , Kamel, H. , Raj, A. , Relkin, N. , Toglia, J. , … O'Dell, M. (2016). Structural connectome disruption at baseline predicts 6‐months post‐stroke outcome. Human Brain Mapping, 37(7), 2587–2601. 10.1002/hbm.23198 [DOI] [PMC free article] [PubMed] [Google Scholar]
- Kuceyeski, A. , Navi, B. B. , Kamel, H. , Relkin, N. , Villanueva, M. , Raj, A. , … Iadecola, C. (2015). Exploring the brain's structural connectome: A quantitative stroke lesion‐dysfunction mapping study. Human Brain Mapping, 36(6), 2147–2160. 10.1002/hbm.22761 [DOI] [PMC free article] [PubMed] [Google Scholar]
- Kummerer, D. , Hartwigsen, G. , Kellmeyer, P. , Glauche, V. , Mader, I. , Kloppel, S. , … Saur, D. (2013). Damage to ventral and dorsal language pathways in acute aphasia. Brain, 136(2), 619–629. 10.1093/brain/aws354 [DOI] [PMC free article] [PubMed] [Google Scholar]
- Lackland, D. T. , Roccella, E. J. , Deutsch, A. F. , Fornage, M. , George, M. G. , Howard, G. , … Towfighi, A. (2014). Factors influencing the decline in stroke mortality. Stroke, 45(1), 315–353. 10.1161/01.str.0000437068.30550.cf [DOI] [PMC free article] [PubMed] [Google Scholar]
- Marchina, S. , Zhu, L. L. , Norton, A. , Zipse, L. , Wan, C. Y. , & Schlaug, G. (2011). Impairment of speech production predicted by lesion load of the left arcuate fasciculus. Stroke, 42, 2251–2256. 10.1161/STROKEAHA.110.606103 [DOI] [PMC free article] [PubMed] [Google Scholar]
- Marebwa, B. , Fridriksson, J. , Yourganov, G. , Feenaughty, L. , Rorden, C. , & Bonilha, L. (2017). Chronic post‐stroke aphasia severity is determined by fragmentation of residual white matter networks. Scientific Reports, 7, 8188. 10.1038/s41598-017-07607-9 [DOI] [PMC free article] [PubMed] [Google Scholar]
- Meier, E. L. , Johnson, J. P. , Pan, Y. , & Kiran, S. (2019). A lesion and connectivity‐based hierarchical model of chronic aphasia recovery dissociates patients and healthy controls. NeuroImage: Clinical, 23, 101919. 10.1016/j.nicl.2019.101919 [DOI] [PMC free article] [PubMed] [Google Scholar]
- Mesulam, M. M. (1990). Large scale neurocognitive networks and distributed processing for attention, language, and memory. Annals of Neurology, 28, 597–613. 10.1002/ana.410280502 [DOI] [PubMed] [Google Scholar]
- Mirman, D. , Chen, Q. , Zhang, Y. , Wang, Z. , Olufunsho, K. , Faseyitan, H. , … Schwartz, M. F. (2015). Neural organization of spoken language revealed by lesion‐symptom mapping. Nature Communications, 6, 6762. 10.1038/ncomms7762 [DOI] [PMC free article] [PubMed] [Google Scholar]
- Nachev, P. , Coulthard, E. , Jäger, H. R. , Kennard, C. , & Husain, M. (2007). Enantiomorphic normalization of focally lesioned brains. NeuroImage, 39(3), 1215–1226. [DOI] [PMC free article] [PubMed] [Google Scholar]
- Nachev, P. , Coulthard, E. , Jager, H. R. , Kennard, C. , & Husain, M. (2008). Enantiomorphic normalization of focally lesioned brains. NeuroImage, 39, 1215–1226. 10.1016/j.neuroimage.2007.10.002 [DOI] [PMC free article] [PubMed] [Google Scholar]
- Pedersen, P. M. , Jorgensen, H. S. , Nakayama, H. , Raaschou, H. O. , & Olsen, T. S. (1995). Aphasia in acute stroke: Incidence, determinants, and recovery. Annals of Neurology, 38(4), 659–666. 10.1002/ana.410380416 [DOI] [PubMed] [Google Scholar]
- Pillay, S. B. , Binder, J. R. , Humphries, C. , Gross, W. L. , & Book, D. S. (2017). Lesion localization of speech comprehension deficits in chronic aphasia. Neurology, 88(10), 970–975. 10.1212/WNL.0000000000003683 [DOI] [PMC free article] [PubMed] [Google Scholar]
- Plowman, E. , Hentz, B. , & Ellis, C. J. (2012). Post‐stroke aphasia prognosis: A review of patient‐related and stroke‐related factors. Journal of Evaluation in Clinical Practice, 18(3), 689–694. 10.1111/j.1365-2753.2011.01650.x [DOI] [PubMed] [Google Scholar]
- Price, C. J. , Hope, T. M. , & Seghier, M. L. (2016). Ten problems and solutions when predicting individual outcome from lesion site after stroke. NeuroIimage, 145(Pt B, 200–208. 10.1016/j.neuroimage.2016.08.006 [DOI] [PMC free article] [PubMed] [Google Scholar]
- Pustina, D. , Coslett, H. B. , Ungar, L. , Faseyitan, O. K. , Medaglia, J. D. , Avants, B. , & Schwartz, M. (2017). Enhanced estimations of post‐stroke aphasia severity using stacked multimodal predictions. Human Brain Mapping, 38, 5603–5615. 10.1002/hbm.23752 [DOI] [PMC free article] [PubMed] [Google Scholar]
- Ramirez, L. , Kim‐Tenser, M. A. , Sanossian, N. , Cen, S. , Wen, G. , He, S. , … Towfighi, A. (2016). Trends in acute ischemic stroke hospitalizations in the United States. Journal of the American Heart Association, 5(5), e003233. 10.1161/JAHA.116.003233 [DOI] [PMC free article] [PubMed] [Google Scholar]
- Ramsey, L. E. , Siegel, J. S. , Lang, C. E. , Strube, M. , Shulman, G. L. , & Corbetta, M. (2017). Behavioural clusters and predictors of performance during recovery from stroke. Nature Human Behaviour, 1, 0038. 10.1038/s41562-016-0038 [DOI] [PMC free article] [PubMed] [Google Scholar]
- Rogalsky, C. , Poppa, T. , Chen, K.‐H. , Anderson, S. W. , Damasio, H. , Love, T. , & Hickok, G. (2015). Speech repetition as a window on the neurobiology of auditory‐motor integration for speech: A voxel‐based lesion symptom mapping study. Neuropsychologia, 71, 18–27. 10.1016/j.neuropsychologia.2015.03.012 [DOI] [PMC free article] [PubMed] [Google Scholar]
- Rorden, C. , Bonilha, L. , Fridriksson, J. , Bender, B. , & Karnath, H. O. (2012). Age‐specific CT and MRI templates for spatial normalization. NeuroImage, 61, 957–965. 10.1016/j.neuroimage.2012.03.020 [DOI] [PMC free article] [PubMed] [Google Scholar]
- Rorden, C. , McKinnon, E. , Hanayik, T. , Yourganov, G. , & Reddy, D. (2020). Rogiedodgie/nii_preprocess: Zenodo DOI release. Zenodo : 10.5281/zenodo.4027711 [DOI]
- Saur, D. , Kreher, B. W. , Schnell, S. , Kümmerer, D. , Kellmeyer, P. , Vry, M.‐S. , … Weiller, C. (2008). Ventral and dorsal pathways for language. Proceedings of the National Academy of Sciences of the United States of America, 105(46), 18035–18040. PubMed. 10.1073/pnas.0805234105 [DOI] [PMC free article] [PubMed] [Google Scholar]
- Saur, D. , Ronneberger, O. , Kümmerer, D. , Mader, I. , Weiller, C. , & Klöppel, S. (2010). Early functional magnetic resonance imaging activations predict language outcome after stroke. Brain, 133(4), 1252–1264. 10.1093/brain/awq021 [DOI] [PubMed] [Google Scholar]
- Simmons‐Mackie, N. (2018). Aphasia in North America. Moorestown, NJ: Aphasia Access. [Google Scholar]
- Smola, A. J. , & Scholkopf, B. (2004). A tutorial on support vector regression. Statistics and Computing, 14, 199–222. 10.1023/B:STCO.0000035301.49549.88 [DOI] [Google Scholar]
- Sprons, O. (2015). Contributions and challenges for network models in cognitive neuroscience. Nature Neuroscience, 17, 652–660. 10.1038/nn.3690 [DOI] [PubMed] [Google Scholar]
- Steiger, J. H. (1980). Tests for comparing elements of a correlation matrix. Psychological Bulletin, 87(2), 245–251. [Google Scholar]
- Stockert, A. , Wawrzyniak, M. , Klingbeil, J. , Wrede, K. , Kümmerer, D. , Hartwigsen, G. , … Saur, D. (2020). Dynamics of language reorganization after left temporo‐parietal and frontal stroke. Brain, 143(3), 844–861. 10.1093/brain/awaa023 [DOI] [PubMed] [Google Scholar]
- Swerdel, J. N. , Rhoads, G. G. , Cheng, J. Q. , Cosgrove, N. M. , Moreyra, A. E. , Kostis, J. B. , … Cabrera, J. (2016). Ischemic stroke rate increases in young adults: Evidence for a generational effect? Journal of the American Heart Association, 5(12), e004245. 10.1161/JAHA.116.004245 [DOI] [PMC free article] [PubMed] [Google Scholar]
- Swinburn, K. , Porter, G. , & Howard, D. (2005). The comprehensive aphasia test. Hove, UK: Psychology Press. [Google Scholar]
- Thye, M. , & Mirman, D. (2018). Relative contributions of lesion location and lesion size to predictions of varied language deficits in post‐stroke aphasia. NeuroImage: Clinical, 20, 1129–1138. 10.1016/j.nicl.2018.10.017 [DOI] [PMC free article] [PubMed] [Google Scholar]
- Tzourio‐Mazoyer, N. , Landeau, B. , Papathanassiou, D. , Crivello, F. , Etard, O. , Delcroix, N. , … Joliot, M. (2002). Automated anatomical labeling of activations in SPM using a macroscopic anatomical parcellation of the MNI MRI single‐subject brain. NeuroImage, 15(1), 273–289. 10.1006/nimg.2001.0978 [DOI] [PubMed] [Google Scholar]
- Ueno, T. , Saito, S. , Rogers, T. T. , & Lambon Ralph, M. A. (2011). Lichtheim 2: Synthesizing aphasia and the neural basis of language in a Neurocomputational model of the dual dorsal‐ventral language pathways. Neuron, 72(2), 385–396. 10.1016/j.neuron.2011.09.013 [DOI] [PubMed] [Google Scholar]
- Üstün, B. , Melssen, W. J. , & Buydens, L. (2006). Facilitating the application of support vector regression by using a universal Pearson VII function based kernel. Chemometrics and Intelligent Laboratory Systems, 81, 29–40. 10.1016/j.chemolab.2005.09.003 [DOI] [Google Scholar]
- Wallentin, M. (2018). Sex differences in post‐stroke aphasia rates are caused by age. A meta‐analysis and database query. PLoS One, 13(12), e0209571. 10.1371/journal.pone.0209571 [DOI] [PMC free article] [PubMed] [Google Scholar]
- Wang, Y. , Saykin, A. J. , Pfeuffer, J. , Lin, C. , Mosier, K. M. , Shen, L. , … Hutchins, G. D. (2011). Regional reproducibility of pulsed arterial spin labeling perfusion imaging at 3T. NeuroImage, 54(2), 1188–1195. 10.1016/j.neuroimage.2010.08.043 [DOI] [PMC free article] [PubMed] [Google Scholar]
- Wang, Z. , Aguirre, G. K. , Rao, H. , Wang, J. , Fernandez‐Seara, M.‐A. , Childress, A. R. , & Detre, J. A. (2008). Empirical optimization of ASL data analysis using an ASL data processing toolbox: ASLtbx. Magnetic Resonance Imaging, 26(2), 261–269. [DOI] [PMC free article] [PubMed] [Google Scholar]
- Wernicke, C. (1874). Der aphasische symptomencomplex. Eine psychologische Studie auf anatomischer Basis. Breslau: Kohn und Weigert. [Google Scholar]
- Williams, E. J. (1959). The comparison of regression variables. Journal of the Royal Statistical Society: Series B (Methodological), 21, 396–399. 10.1111/j.2517-6161.1959.tb00346.x [DOI] [Google Scholar]
- Wilson, S. M. , & Hula, W. D. (2019). Multivariate approaches to understanding aphasia and its neural substrates. Current Neurology and Neuroscience Reports, 19, 53. 10.1007/s11910-019-0971-6 [DOI] [PMC free article] [PubMed] [Google Scholar]
- Wu, W. C. , Fernandez‐Seara, M. , Detre, J. A. , Wehrli, F. W. , & Wang, J. (2007). A theoretical and experimental investigation of the tagging efficiency of pseudocontinuous arterial spin labeling. Magnetic Resonance in Medicine, 58(5), 1020–1027. [DOI] [PubMed] [Google Scholar]
- Yourganov, G. , Fridriksson, J. , Rorden, C. , Gleichgerrcht, E. , & Bonilha, L. (2016). Multivariate connectome‐based symptom mapping in post‐stroke patients: Networks supporting language and speech. The Journal of Neuroscience, 36(25), 6668–6679. 10.1523/JNEUROSCI.4396-15.2016 [DOI] [PMC free article] [PubMed] [Google Scholar]
- Yourganov, G. , Fridriksson, J. , Stark, B. , & Rorden, C. (2018). Removal of artifacts from resting‐state fMRI data in stroke. NeuroImage: Clinical, 17, 297–305. 10.1016/j.nicl.2017.10.027 [DOI] [PMC free article] [PubMed] [Google Scholar]
- Yourganov, G. , Smith, K. G. , Fridriksson, J. , & Rorden, C. (2015). Predicting aphasia type from brain damage measured with structural MRI. Cortex, 73, 203–215. 10.1016/j.cortex.2015.09.005 [DOI] [PMC free article] [PubMed] [Google Scholar]
Associated Data
This section collects any data citations, data availability statements, or supplementary materials included in this article.
Supplementary Materials
Appendix S1: Supporting Information
Table S1 Comparison of several cross‐validation paradigms. Pearson's correlation and mean squared error compared across LOOCV, 5‐, and 10‐fold linear and radial kernels.
Table S2 Features significantly associated with Fluency. Features refer to modality‐specific ROIs. Features were retained if adjusted p‐value <.05 after Benjamini & Hochberg correction for multiple comparisons.
Table S3 Features significantly associated with Spontaneous Speech. Features refer to modality‐specific ROIs. Features were retained if adjusted p‐value <.05 after Benjamini & Hochberg correction for multiple comparisons.
Table S4 Features significantly associated with Naming. Features refer to modality‐specific ROIs. Features were retained if adjusted p‐value <.05 after Benjamini & Hochberg correction for multiple comparisons.
Table S5 Features significantly associated with Repetition. Features refer to modality‐specific ROIs. Features were retained if adjusted p‐value <.05 after Benjamini & Hochberg correction for multiple comparisons.
Table S6 Features significantly associated with Auditory Comprehension. Features refer to modality‐specific ROIs. Features were retained if adjusted p‐value < .05 after Benjamini & Hochberg correction for multiple comparisons.
Data Availability Statement
Data sharing is not applicable to this article as no new data were created or analyzed in this study.