Summary
The germinal center is a dynamic microenvironment wherein B cells expressing high affinity antibody variants produced by somatic hypermutation are selected for clonal expansion by limiting numbers of T follicular helper cells 1,2. Although much is known about the mechanisms that control B cell selection in the germinal center, far less is understood about the clonal behavior of the T follicular helper cells that regulate this process. Here we report on the dynamic behavior of T follicular helper cell clones during the germinal center reaction. We find that like germinal center B cells, T follicular helper cells undergo antigen dependent selection throughout the germinal center reaction resulting in differential proliferative expansion and contraction. Increasing the amount of antigen presented in the germinal center leads to increased T follicular helper cell division. Competition between T follicular helper cell clones is mediated by T cell receptor affinity for peptide-MHC ligand. T cells expanding preferentially in the germinal center show increased expression of genes downstream of the T cell receptor, genes required for metabolic reprogramming, cell division and cytokine production. These dynamic changes lead to dramatic remodeling of the functional T follicular helper cell repertoire during the germinal center reaction.
Humoral immunity and effective vaccination necessitate development of high affinity antibody producing cells in germinal centers (GCs). These responses are regulated by T follicular helper cells (Tfh) that express Bcl6, the chemokine receptor CXCR5, high levels of PD-1, and B cell trophic cytokines each of which is required to orchestrate the GC reaction. Within GCs limiting numbers of Tfh interact with and select B cells based on the latter’s ability to bind, internalize and present antigen as peptide complexed with major histocompatibility proteins (pMHC). Thus, B cell selection requires competition for limiting Tfh signals 3–7.
GC B cells divide rapidly, hypermutate their antibody genes, and undergo affinity selection during the GC reaction. Productive contacts between Tfh and GC B cells leads to increases in Tfh intracellular calcium and the production of B cell trophic interleukins. Whether these signaling events also lead to Tfh proliferation, clonal selection and expansion within the GC has not been investigated 8. To examine the kinetics of Tfh development in response to antigen during the GC reaction we immunized mice with 4-hydroxyl-3-nitrophenylacetyl-ovalbumin (NP-OVA) (Fig. 1a and Extended Data Fig. 1a). Consistent with other reports, Tfh cells (CD4+, CD62low, CD44high, CXCR5high, PD1high, Bcl6+) were first detected 4-5 days after immunization and expanded exponentially thereafter, reaching a peak at day 7-10, before contracting by day 21 (Fig. 1b) 1,9,10.
Figure 1. Tfh cells continue to divide during the GC reaction.
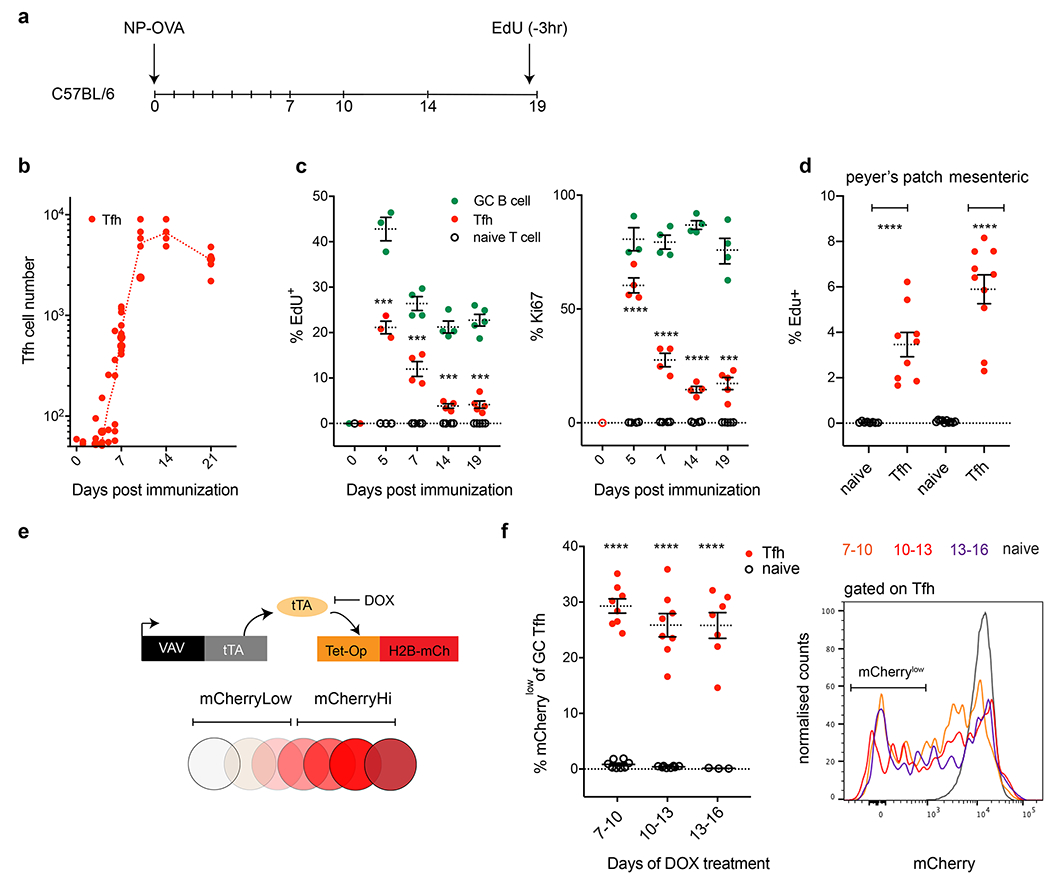
a, Schematic representation of the experimental setup. b, Kinetics of Tfh development in C57BL/6 mice following NP-OVA immunization. Y axis depicts the absolute numbers of Tfh (red) in popliteal lymph nodes, X axis days post immunization (dpi). Data are from 3-5 mice per time point, each dot represents one mouse. Gating strategies are detailed in Extended data Fig. 1. c, Plots show percentage of EdU or Ki67 positive cells, Y axis, GC B cells (green), Tfh (red) and naïve T cells (black). X axis is dpi. Data are from 3-5 mice per time point and each dot represents one mouse. EdU was delivered 3 hours before mice were culled. ***, and **** p=0.001 or p<0.0001 by unpaired Student’s t-test (two-tailed) when comparing Tfh and naïve T cells. f, Plot shows percentage of EdU, Y axis, Tfh (red) and naïve T cells (black) from peyer’s patch (left) or mesenteric lymph nodes (right). Data are from 9 mice per group and each dot represents one mouse . p<0.0001 by unpaired Student’s t-test (two-tailed) when comparing Tfh and naïve T cells. e, Diagrammatic representation of the Vav-tTA and Tet-Op-H2B-mCh transgenes that were combined (tTA-H2B-mCh mice) to measure cell division in the GC. f, Plots show frequency of naïve or Tfh T cells that became mCherrylow when treated with doxycycline (DOX) between days 7-10 (8 mice per group), 10-13 (8 mice per group) or 13-16 (7 mice per group) after immunization with NP-OVA. Rightmost panel; histogram overlays comparing relative H2B-mCh fluorescence among Tfh T cells during the three time windows of exposure to DOX or in naïve T cells. **** p<0.0001, by unpaired Student’s t-test (two-tailed) comparing Tfh and naïve T cells. All experiments were done a minimum of two times and error bars always plot standard error of the mean (SEM).
Unlike most other effector T cells, Tfh are thought to be largely quiescent, in part because limiting the size of the GC Tfh pool is required to maintain stringent B cell selection and prevent autoimmunity 7,11–15. To explore whether Tfh continue to divide once they have seeded the GC reaction, we tracked cell division by EdU incorporation and intranuclear Ki67 expression (Fig. 1c). We found that the proliferative profile of Tfh paralleled that of GC B cells and was significantly different from naïve quiescent T cells. Proliferation peaked early with a subsequent decrease to lower but significant levels of proliferation that persisted throughout the 19-day observation period (Fig. 1c). Similarly, 2-8% of Tfh in chronic GCs in mesenteric lymph nodes and peyer’s patches incorporated EdU (Fig. 1d).
To examine the extent of Tfh proliferation over time we tracked cell division using NP-OVA immunized mice that express mCherry labeled Histone-2b (H2B-mCh) under the control of a doxycycline sensitive promoter (tTA-H2B-mCh mice) 16. The tTA-H2B-mCh mice express H2B-mCh until they are exposed to doxycycline whereupon H2B-mCh expression is suppressed allowing dividing cells to dilute the indicator (tTa-H2B-mCh mice, Fig. 1e). Exposure of NP-OVA immunized tTA-H2B-mCh mice to doxycycline over three days permits the integration of Tfh division over time, as opposed to the instantaneous measurements provided by analysis of Edu incorporation or intranuclear Ki67 expression. On average 27-30% of Tfh cells in GCs diluted H2B-mCh in response to NP-OVA when exposed to doxycycline on days 7-10, or 10-13 or 13-16 after immunization (Fig. 1f). In contrast, we found little or no detectable division by naïve T cells in the same mice.
Naïve T cells proliferate extensively after activation and during their differentiation into Tfh. To ensure that the GC Tfh proliferation is not exclusively derived from newly generated Tfh cells, we used reporter mice that express tamoxifen inducible Cre under the control of CD62L, which is expressed in naïve T cells but not Tfh (SellCreERT2 ROSAtdT mice) (Extended Data Fig. 2a–c). Tamoxifen administration to immunized SellCreERT2 ROSAtdT reporter mice fate maps naïve T cells so they can be distinguished from contemporaneous resident Tfh cells if the naïve cells are subsequently recruited to the GC (Extended Data Fig. 2d). Cell division was similar among recruited and resident Tfh in indicator mice that were injected with tamoxifen 7 days after immunization as measured by EdU labeling on day 14 (Extended Data Fig. 2e).
The proliferative kinetics of Tfh cells mirrored the known decline in antigen availability in the days following immunization. To determine whether Tfh undergo cell division in response to antigen we used αDEC205 chimeric antibodies to deliver cognate OVA protein (αDEC-OVA) or an irrelevant parasite protein from Plasmodium falciparum circumsporozoite (αDEC-CS) to ongoing GC reactions. C57BL/6 mice were immunized with NP-OVA and boosted by injecting αDEC-OVA or αDEC-CS (Fig. 2a) 17,18. EdU labeling 18 hours after αDEC-OVA injection revealed antigen dependent Tfh proliferation (Fig. 2b). Whereas 8% of Tfh cells were labeled with EdU at this time point in the αDEC-CS control mice, 17% were proliferating in αDEC-OVA treated mice respectively (p<0.0001).
Figure 2. Tfh proliferate proportionately to TCR signaling.
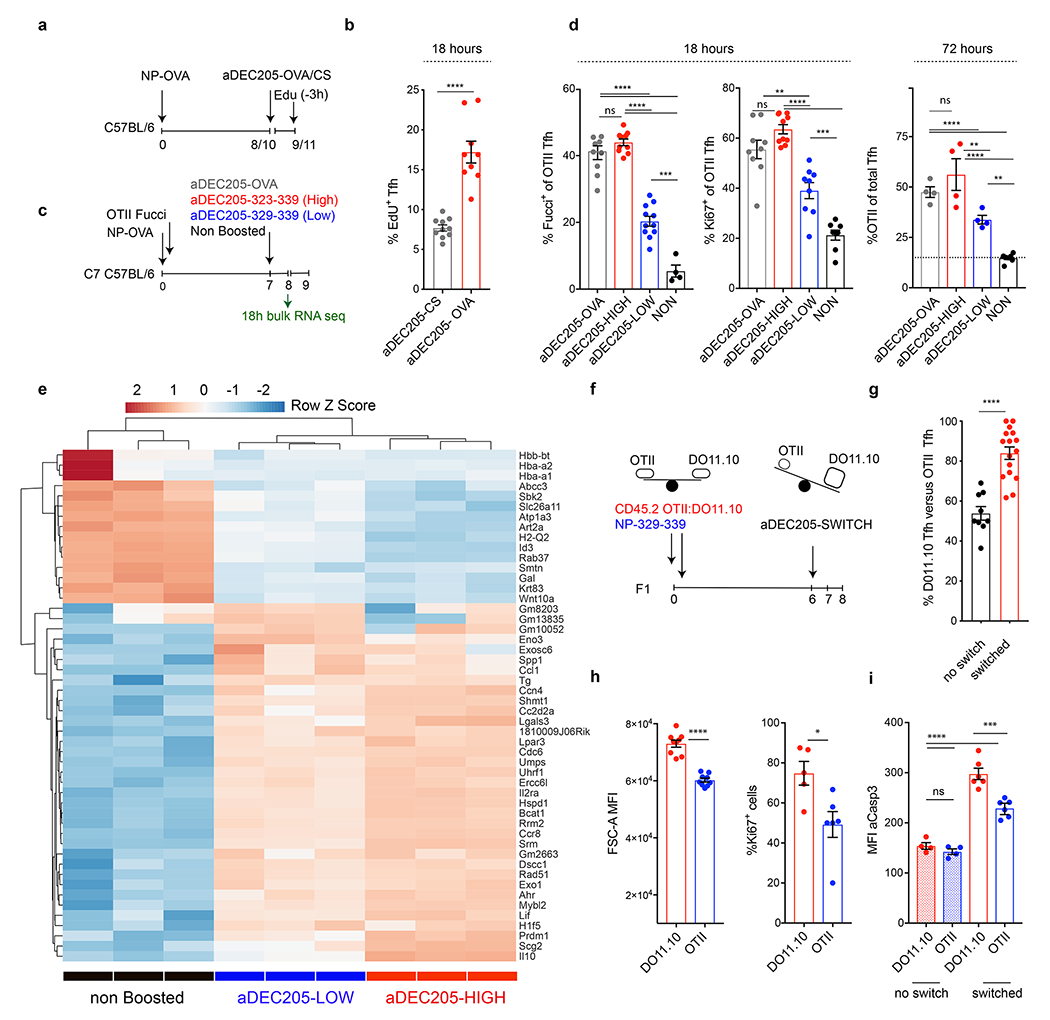
a, Schematic representation of experimental setup used in b. b, Bar graph shows the percentage of proliferating Tfh cells as defined by EdU incorporation following aDEC205-CS (10 mice) or aDEC205-OVA (9 mice) treatment. Each dot represents an individual mouse. p<0.0001 by unpaired Student’s t-test (two-tailed). c, Schematic representation of experimental setup used in d, e. d, Plots showing the percentage of OTII Tfh cells that express Fucci (10, 10, 10 and 4 mice per group from left to right) or Ki67 (9, 10, 9 and 8 mice per group from left to right) 18 hours after αDEC205-chimeric antibody injection. Each dot represents an individual mouse. **,***,**** p= 0.0012, p=0.0007 and p<0.0001 by one-way ANOVA test. Rightmost plot shows percentage of OTII T cells among Tfh cells 72 hours after αDEC205-chimeric antibody injection. Data are from 4 mice per group and each dot represents one mouse. ** ,**** p=0.005 or p=0.0068 and p<0.0001, by one-way ANOVA test. e, Heat-map of hierarchically-clustered purified populations of OTII Tfh T cells. Comparing gene expression of the 50 most differentially expressed genes. *, ***, and **** p=0.0160 or p=0.0211, <0.001, and <0.0001, by one-way ANOVA test. f, Schematic depicting experimental setup for the competition experiment between DO11.10 and OTII Tfh cells in g. g, Bar graphs compare changes in the frequency of DO11.10 versus OTII Tfh in αDEC-323-339 boosted (switched) or un-injected controls. Data are from 10 or 16 mice per group and each dot represents one mouse. p=0.0001 by unpaired Student’s t-test (two-tailed). h, Bar graphs compare the size of blasting cells (left, 8 mice per group) or the percentage of Ki67 positive cells (right, 6 or 7 mice per group) in DO11.10 or OTII Tfh populations 18 hours after αDEC205-chimeric antibody exposure. Each dot represents one mouse. *,**** p=0.0183 and p<0.0001 by unpaired Student’s t-test. j, Bar graph compares the aCasp3 expression between non-boosted populations and in the same populations 18 hours following αDEC205-boosting. ***, and **** p=0.0001, and p<0.0001 by one way ANOVA test. Each experiment was done 2-3 times and error bars plot ±SEM .
Naïve T cells proliferate in proportion to the strength of TCR signaling. Whether persistent Tfh division is governed by the quality of TCR signaling has not been explored. Examining this in a polyclonal repertoire is challenging due to the diversity and unknown constellation of TCR specificities contributing to the Tfh repertoire. To examine the role of the TCR signaling to Tfh proliferative responses we used OTII T cells that express a fixed receptor able to recognize OVA323-339 with relatively high affinity whilst remaining differentially sensitive to a set of nested altered peptide ligands (APLs, Extended Data Fig. 3a) 19. Here, the diminishing potency of each APL to elicit TCR signaling may be due to differential loading onto MHCII (altering the effective concentration of the ligand) or by altering TCR affinity or both. Accordingly OTII T cells divide and differentiate into Tfh cells in direct proportion to their ability to recognize and signal in response to the corresponding APL-pMHC ligands in vitro and in vivo (Extended Data Fig. 3b–f) 20. Thus, 46% of OTII T cells became Tfh after 7 days in response to the high NP-APL as opposed to only 12% following low NP-APL immunization (Extended Data Fig. 3e)20.
To determine whether the magnitude of the T cell response directly impacted the degree of Tfh cellular division during the GC reaction, as opposed to just pre-GC differentiation, we generated αDEC205-APL chimeric antibodies carrying either the high or low APLs (αDEC323-339 and αDEC329-339 respectively). Cell division in response to αDEC-APL injection was measured using OTII Tfh cells expressing a ubiquitin-based cell cycle indicator (Fucci) that fluorescently marks cells that are in the cell cycle 21,22. OTII Fucci cells were adoptively transferred into C57BL/6 mice that were immunized with NP-OVA and then injected on day 7 with high and low αDEC-APLs or nothing and analyzed after 18 hours (Fig. 2c). A significantly greater number of OTII Tfh entered the cell cycle in response to the high, as compared to low αDEC-APLs conjugates as measured by Fucci or Ki67 staining (Fig. 2d, top right panels). Moreover, increased proliferation at 18 hours was associated with the proportional outgrowth of OTII Tfh over endogenous Tfh cells after 72 hours (Fig. 2d, top rightmost panel).
In addition to activated B cells, dendritic cells also express high levels of αDEC205 23. To confirm that Tfh proliferation was driven by cognate interactions between Tfh and GC B cells we limited αDEC-boosting exclusively to B cells by adoptively transferring B1-8+ B cells and OTII Fucci T cells into DEC-205 deficient mice (Extended Data Fig. 3g). OTII Tfh cells showed significant proliferation when antigen presentation was limited to GC B cells (p=0.0048) (Extended Data Fig. 3h).
To next verify that the proliferating cells responding to αDEC-boosting were GC resident Tfh, we used mice that carry a photoactivatable green fluorescent protein (OTII PAGFP) 24,25. OTII PAGFP T cells were transferred into NP-OVA immunized C57BL/6 mice and subsequently injected with αDEC-OVA on day 10 after immunization and GC resident Tfh labeled by photoactivation 18 hours later (Extended Data Fig. 4a–d). Flow cytometric analysis showed that 20% of GC (GFP+) Tfh cells were in the S or G2M phases of the cell cycle (Extended Data Fig. 4e). Altogether the data indicate that in addition to providing help, GC Tfh can undergo proliferative expansion in response to pMHC presented in the GC.
To examine the transcriptional programs associated with TCR driven Tfh division we performed mRNA sequencing on total OTII Tfh isolated 18 hours after boosting with nothing as controls (non-boosted), high or low αDEC-APLs. Unsupervised hierarchical clustering segregated samples according to each condition and revealed a unique signature in the boosted OTII Tfh cells (Fig. 2e). Gene set enrichment analysis comparing Tfh responding to high APLs versus control showed increased representation of pathways that regulate the cell cycle, metabolism, glycolysis and oxidative phosphorylation (Fig. 2e and Extended Data Fig. 5a). Comparison of high and low APL groups revealed 533 differentially expressed genes with an enrichment in cytokine and interleukin signaling in the high APL group consistent with wider roles for TCR signaling in Tfh function (Extended Data Fig. 5b). Altogether the data indicate that Tfh cells proliferate in direct proportion to their ability to recognize pMHC presented on GC B cells and that this behavior is sustained through metabolic reprogramming.
High affinity B cells outcompete their low affinity counterparts during the GC reaction 6,16,17,26. We next asked whether Tfh cells also undergo clonal competition based on their affinity for pMHC. To do so, we made use of two transgenic T cells that express OVA323-339 specific TCRs with different affinities, DO11.10 (H-2d) and OTII (H-2b). The DO11.10 TCR recognizes ovalbumin with approximately 50 fold higher affinity for antigen than OTII in the context of H2d 19,27,28. To characterize relative affinities of DO11.10 and OTII cells, which have different genetic backgrounds and so could carry distinct genes that might affect TCR signaling or responsiveness, to the APLs in the context of H2b/d and to prevent rejection of either T cell population we adoptively transferred them into immunized C57BL/6 X Balb/c F1 mice recipients (Extended Data Fig. 6a). The two cell types showed similar proliferative responses to OVA329-339, but DO11.10 cells displayed significantly greater responses than OTII when mice were immunized with longer APL variants OVA323-339, OVA327-339, and OVA328-339 (Extended Data Fig. 6b, c).
To determine whether Tfh cells continue to undergo competitive affinity-based selection once in the GC we transferred a mixture of DO11.10 and OTII cells into H-2b/d F1 mice and immunized them with the shorter OVA329-339 peptide, which they recognize with relatively equal affinity, to allow both T cell types to seed GC reactions (Extended Data Fig. 6d, e). In mice that received no further intervention, the average percentage of DO11.10 Tfh cells was 54% and comparable to their input values (Fig. 2 f, g and Extended Data Fig. 6d, e). Boosting with cognate OVA329-339 maintained the same relative proportion of the 2 transgenic T cells in the GC (Extended Data Fig. 6f). In contrast, the relative representation of DO11.10 Tfh cells increased to 84% 48 hours after OVA323-339 boosting (αDEC-Switch) on day 6 (p<0.0001, Fig. 2g, right panel). The outgrowth of DO11.10 Tfh cells, in response to boosting with an APL which increased its relative affinity over competitor OTII Tfh, was driven by proliferation as determined by an increase in cell size and Ki67 staining despite a concomitant increase in aCasp3 expression (Fig. 2h, i and Extended Data Fig. 6g). We conclude that DO11.10 and OTII Tfh cells, albeit different genetic backgrounds withstanding, undergo competitive proliferative expansion in GCs of C57BL/6 X Balb/c F1 recipients based on their affinities for pMHC.
Tfh numbers in the GC must be limiting in order to maintain stringent B cell selection 7,11,13–15,29,30. Whether the quality of the Tfh TCR repertoire also influences the products of the GC reactions remains to be determined. To examine how signals that induce Tfh proliferative expansion impact the quality of help provided to cognate B cells, we performed RNA sequencing on purified positively selected light zone (LZ) GC B cells 14 hours after boosting with the αDEC-APLs (Fig. 3a, b and Extended Data Fig. 7a) 17,31. Unsupervised hierarchical clustering separated the mRNAs obtained from B cells responding to control (no boost), high and low αDEC-APL into 3 distinct groups (Fig. 3b). Comparison of the differentially expressed genes showed that high APLs induced higher levels of mRNAs associated with positive selection including Myc, mTORC1 and cell division pathways than the non-boosted or low APL boosted conditions (Fig. 3c and Extended Data Fig. 7b) 31. Thus, the T cells’ ability to recognize cognate pMHC governs their ability to divide and the extent of trophic cytokine production and the magnitude of the selection signals provided to GC B cells.
Figure 3. TCR signaling dictates the quality of T cell help delivered.
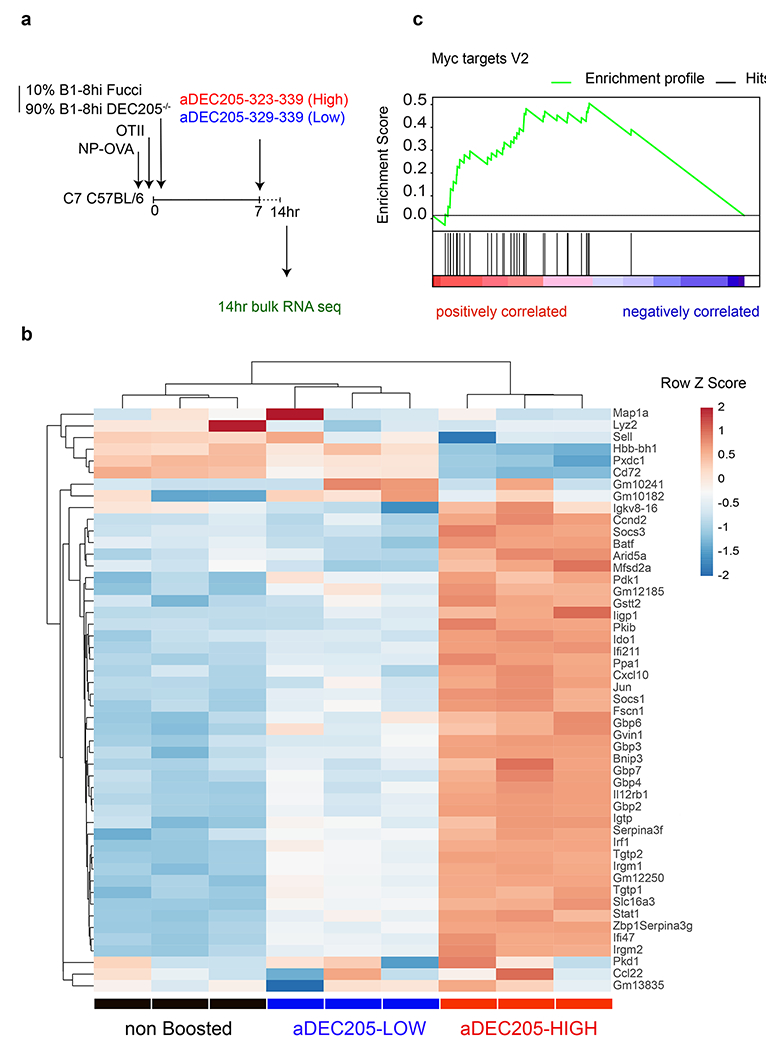
a, Schematic representation of experimental setup used in b. The Flow cytometric plots showing the gating strategy to isolate positively selected light zone germinal center B cells 14 hours after αDEC205-APL antibody injection is detailed in Extended data 8. b, Heat-map of hierarchically-clustered purified populations of Fucci+ LZ B cells. Comparing gene expression of the 50 most differentially expressed genes. c, Plot is a graphical representation of GSEA and the rank-ordered gene lists found upregulated in αDEC205-HIGH versus αDEC205-LOW boosted in recently selected Fucci+ GC LZ B cells. Nominal p-value p=0.0. Enrichment Score (ES)=0.4911. Normalized ES= 2.64. FDR q-value=0.0.
Unlike GC B cells, Tfh distribute among nascent GCs in lymph nodes and continue to emigrate between GCs during the immune response 32. To determine whether Tfh clones also disseminate throughout GCs in the spleen, we compared their distribution in the two halves of spleens obtained 7 days after NP-OVA immunization (Extended Data Fig. 8a, b). As expected, Tfh clones were shared and their relative distribution was similar between the 2 halves of the spleen as determined by TCR-alpha and -beta sequencing (Extended Data Fig. 8c).
To determine whether there is dynamic redistribution of Tfh clones during a polyclonal immune response we followed Tfh clonotypes in the same mouse longitudinally by performing hemi-splenectomy on day 7 and the remaining half of the spleen was harvested on day 21 after immunization with NP-OVA, a procedure that did not measurably alter the size of the GC compartment per se (Fig. 4a and Extended Data Fig. 9a, b). To ensure that we assayed T cells entering spleen GCs de novo during the immunization period we used SellCreERT2 ROSAtdT mice (Extended Data Fig. 2 and Fig. 9d, e). Naïve cells were labeled in reporter mice 5 days before immunization and Tfh responding to the immunization were purified from hemisplenectomized mice on days 7 and 21 based on tdTomato expression (Fig. 4a and Extended Data Fig. 10a). Single cell RNA sequencing revealed a significant dynamic re-distribution of Tfh clones between the 2 time points in all 6 mice analyzed (Fig. 4b, c and Extended Data Fig. 10 b–d). TCR-alpha and -beta sequencing showed that 55% and 73% of all Tfh cells were members of expanded clones on days 7 and 21, respectively. A total of 86% of the day 7 clones expanded, or contracted between days 7-21, and only 13% were relatively conserved (examples noted by red, blue and green arrows on Fig. 4c).
Figure 4. Extensive Tfh clonal evolution.
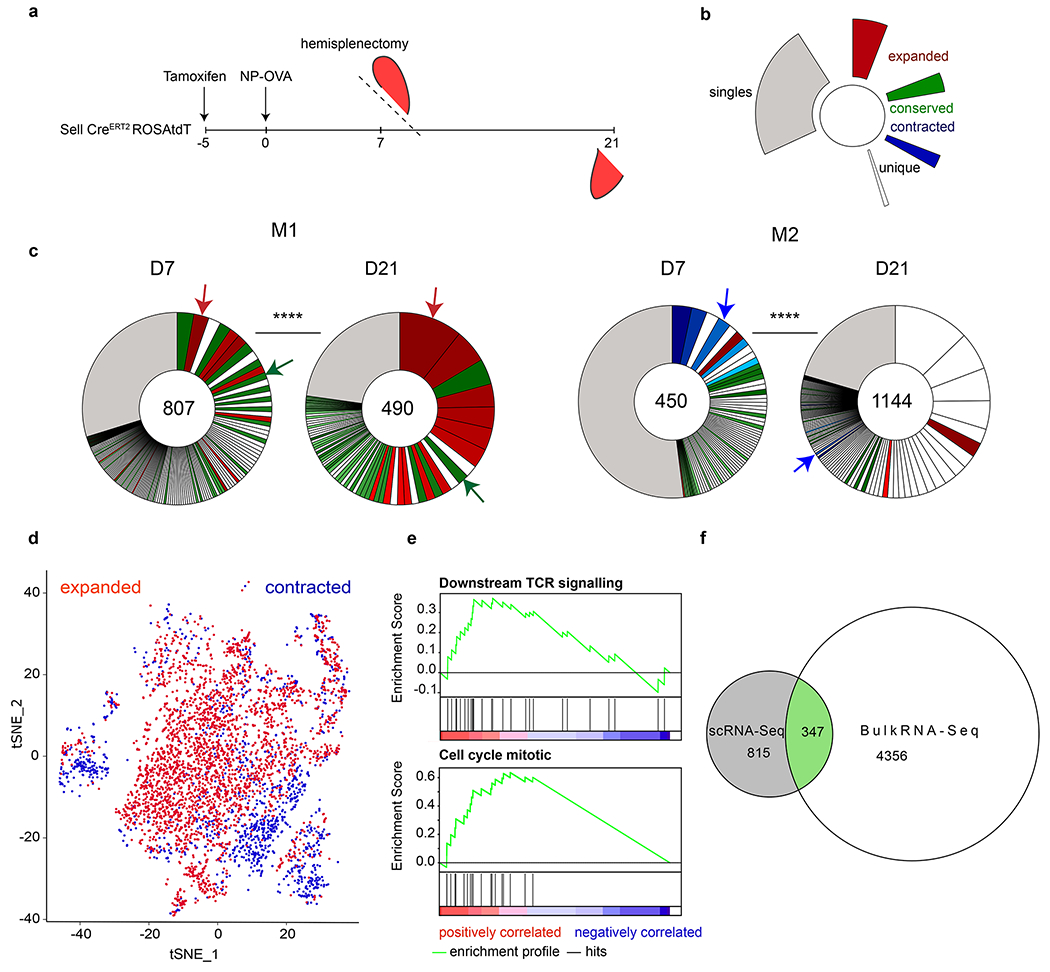
a, Schematic representation of experimental setup. b, Color coded indexing for the clonal behaviors between d7 and d21. Expanded (red), conserved (green), contracted (blue), singles (grey). Clones that appear white were novel to each time point, either contracting or expanding between the time points. c, Pie charts show clonal populations of Tfh within each mouse at each time point. Segments within the pie charts report the proportional representation of each clone. Clonotypes containing the same CDR3 sequence (nt) for alpha or/and beta chain. **** Fisher Exact test (p=0.000016). Red, green and blue arrows denote examples of clones found between time point that either expanded, contracted or were relatively conserved, respectively. Numbers inside the pie charts refer to the total number of TCR sequences. d, t-SNE plot calculated using 20 PCA dimensions on scRNA-Seq data, comparing transcriptome of all expanded clones versus all contracted clones (pooled between all mice). e, GSEA of differentially expressed genes between clones that expanded or contracted. Downstream TCR signaling: nominal p-value p=0.0029 Enrichment Score (ES)=0.37. Normalized ES= 1.84. FDR q-value=0.036. Regulation of Mitotic Cell cycle: nominal p-value p=0.00 Enrichment Score (ES)=0.63. Normalized ES= 2.71. FDR q-value=0.00.f, Euler Diagram comparing the number of shared genes between the scRNA-Seq (grey) and OTII bulk RNA-Seq (white) that have the same behavior, either up or down-regulated (green).
To determine whether there are gene expression signatures associated with Tfh clonal expansion or contraction we analyzed the transcriptome of single cells belonging to clones exhibiting these behaviors. Cells belonging to clones that expand or contract were segregated by principle component analysis (Fig. 4d). In agreement with the RNA sequencing data obtained from OTII Tfh (Fig. 2e), gene set enrichment analysis revealed that the mRNAs expressed by clones that expand after day 7 differed from those that contracted in expression of genes involved in TCR signaling and cell division (Fig. 4e). In addition, 347 of the 815 differentially expressed genes between the clones that expanded or contracted after day 7 did so in parallel to the genes that were up- or down-regulated in response to increased antigen presentation (Fig. 4f). We conclude that clones of T follicular helper cells undergo significant dynamic changes in response to antigen during polyclonal immune responses in the germinal center.
The GC reaction is governed by Tfh cells that select high affinity B cells that present the highest levels of pMHC 24. Although T cells cannot mutate their receptors and must remain limiting in order to maintain stringent B cell selection, our data indicate that ongoing T cell selection shapes Tfh repertoires during the immune response 33.
Limiting numbers of Tfh cells govern selection in the GC 2,34–36. A paucity of Tfh results in diminished antibody responses to viral infections in mice and macaques 13–15. Conversely, overabundance of Tfh interferes with affinity maturation and is associated with auto-immunity 11,30. To maintain homeostasis Tfh are thought to limit their own proliferative responses to TCR stimulation by high level expression of negative regulators such as PD1, SLAMF6 and LAG-3 12,29. Nevertheless, Tfh remain sufficiently responsive to pMHC to provide help to cognate B cells in the form of trophic cytokines. Our data indicate that in addition to triggering T cell help, interaction between Tfh and cognate pMHC also favors affinity-based selection of Tfh in the GC.
Selection of Tfh with increased sensitivity to pMHC across GCs during the reaction is likely to prolong the immune response in the face of ever decreasing amounts of antigen. In addition, enhanced TCR signaling by affinity selected Tfh may account for increased plasma cell production in the later stages of the GC reaction 37. In conclusion, the clonal dynamics that govern the relationship between GC B cells and Tfh is even more dynamic and symbiotic than previously envisaged.
Mice
Mice were housed at a temperature of 72 °F and humidity of 30–70% in a 12-h light/dark cycle with ad libitum access to food and water. Male and female mice aged 8–10 weeks at the start of the experiment were used throughout. C57BL/6J, Balbc, OTII (C57BL/6J) and DO11.10 (Balbc) mice were purchased from Jackson Laboratories. Fucci transgenic mice were obtained from T. Kurosaki and A. Miyawaki. C7 mice were obtained from the S. Rudensky Lab. OTII Fucci, tTa-H2B-mCh mice, OTII PAGFP and DEC205−/− mice were generated and maintained at Rockefeller University. SellCreERT2 ROSAtdT reporter mice were generated in B6 ES cells and exclusively crossed to B6 animals for 10 generations and maintained at Rockefeller University. C57BL/6 X Balb/c F1 mice were bred to be used as recipients of OTII (C57BL/6J) and DO11.10 (Balbc) CD4 T cells in competition experiments. It should be noted that transferred OTII (C57BL/6J) and DO11.10 (Balbc) remained on their original genetic background and so might have a range of intrinsic differences that could not be fully controlled for in these experiments. All mouse experiments were performed under Institutional Review Board approved protocols. Sample sizes were not calculated a priori. Given the nature of the comparisons, mice were not randomized into each experimental group and investigators were not blinded to group allocation.
Immunizations and treatments
C57BL/6J, SellCreERT2 ROSAtdT, C7 or F1 recipient mice (6–12 weeks old) were immunized with 20μg or 50μg of NP17–OVA (Biosearch Technologies) precipitated in alum in footpads or intraperitoneally respectively. For NP-APL immunizations, 100μM of each hapten was precipitated in alum at a 2:1 ratio and injected into footpads.
αDEC–OVA, αDEC–CS and αDEC-APL chimeric antibodies were transiently expressed in 293-6E cells using polyethylenimine (PEI, Sigma 408727) for transfection. The supernatant was collected 7 days later and the chimeric antibodies were concentrated by ammonium sulphate precipitation. After centrifugation the pellet was resuspended in PBS and affinity purified on Protein G columns (Protein G Sepharose 4 Fast Flow, 17-0618-05, GE Healthcare).
2μg of chimeric antibody in PBS was injected into footpads of the recipient mice at indicated time points. Deletion of loxP-flanked alleles was induced by intraperitoneal injection of tamoxifen (Sigma) dissolved in corn oil (Sigma) at indicated doses and time points. For tTA–H2B–mCherry dilution experiments, mice were administered DOX (doxycycline hyclate, Sigma) by intraperitoneal injection of 2mg DOX in PBS and footpad injection of 0.2mg DOX in PBS. Mice were maintained on DOX by adding DOX (2mg/mL) and sucrose (50mg/mL) to the drinking water for the indicated time periods. Draining lymph nodes were collected for flow cytometric analysis. H2B-mCherry dilution was monitored by flow cytometry.
Hemi-splenectomy
Mice were kept on antibiotics as prophylaxis against infection following surgical intervention. On d7 post immunization mice were anesthetized with isoflurane. The left side of the mouse was shaved and cleaned before an incision was made in the skin followed by a smaller incision in the peritoneal wall to allow access to the spleen. The section of spleen to be removed was tied off by using sutures to prevent bleeding, and then cut out while leaving the splenic artery intact. The peritoneal wall was closed and stitched using perma-hand silk 5-0 sutures (Ethicon). The skin was closed using 9 mm wound clips (Clay Adams brand, Becton Dickinson). Following recovery from anesthesia mice were transferred to a new clean cage with a heating pad.
T cell transfer and culture
Single-cell suspensions were prepared from the spleens and lymph nodes of donor mice. CD4+ T cells were enriched using immunomagnetic negative selection (StemCell Technologies). For adoptive transfer experiments 0.5-1x10⁶ CD4+ T cells were injected into recipient mice by intravenous injection.
Peptide Synthesis
The peptides were created using a Protein Technologies Symphony peptide synthesizer on pre-coupled Fmoc-Lysine(e-biotinyl)-OH Wang resins (Bachem). Reactions were conducted at a 100 μMol scale and elongated using 9-Fluorenylmethoxycarbonyl (Fmoc) protected amino acids. Deprotection of the amine was accomplished with 20% piperidine in NMP (N-methylpyrrolidinone). Repetitive coupling reactions were conducted using 0.3M HATU / Cl-HOBT and 0.6M DIEA using NMP as the primary solvent.
The peptides were capped at amine terminus with a 4-hydroxy-3-nitrophenyl acetic acid label. Resin cleavage and side-chain deprotection was achieved by transferring beads to a 100 ml round bottom flask which are then reacted (rt in fume hood) with 8.0 mL concentrated, sequencing grade, trifluoroacetic acid including a scavenger mixture of triisopropylsilane and degassed water, in a ratio of 94:3:3 over 6 hours. Column filtration removed the resin, dispensing it into a 50ml round bottom flask. The TFA/peptide solution volume was then reduced to 2 ml through these of a rotary evaporator. A standard ether precipitation was conducted on the peptides by transferring the solution to a 50 mL falcon tube containing 40 mL of cold TBME (tert-butyl methyl ether). Tube was then placed in an ice bath for 2 hours to aid in precipitation, followed by pellet formation using centrifugation (3,300 rpm for 5 min). Excess ether was removed by vacuum aspiration and the peptide pellet was then allowed to dry overnight in a fume hood. Peptide was then dissolved in 20% acetonitrile and 10 ml HPLC grade water, subsampled for LC/MS and lyophilized. This crude product was analyzed by reversed-phase Aquity UPLC using a Waters BEH C18 column and monitoring 220 nm absorbance. Peptide integrity was simultaneously verified by a capillary split flow into a tandem electrospray mass spectrometer using a ThermoFinnigan LTQ system. Preparative chromatography purification was accomplished on a Vydac C18 RP preparative column on a Waters 600 Prep HPLC. Fractions are collected in 30 second intervals, with each characterized using LC/MS on the above system and the fractions containing desired product are then lyophilized, weighed and provided to Nussenzweig lab.
B cell transfer
Single-cell suspensions were prepared from the spleens and lymph nodes of donor mice. Resting B cell suspensions were enriched using immunomagnetic positive selection using CD43 (StemCell Technologies). Approximately ~5 × 10⁶ B1-8+ B cells (5 × 10⁵ Igλ+, NP-specific B cells) composed of the indicated populations were injected into recipient mice by intravenous injection.
T-cell activation in vitro
Peritoneal macrophages or B cells were harvested and plated in flat bottomed 96-well plates as a source of antigen presenting cells (APCs). On the following day CD4+ T cells were enriched from spleens by magnetic bead selection (StemCell Technologies) and labelled with CTV. 100,000 CTV labeled or unlabeled cells were then co-cultured with the APCs and the indicated amount of the APLs and T-cell activation was assessed 18 hours later by flow cytometry.
T-cell activation in vivo
CD4+ T cells were enriched from spleens by magnetic bead selection (StemCell Technologies) and labelled with CTV. CTV labeled cells were then injected into mice and the quality of the T-cell response assessed 3-7 days later by flow cytometry.
Flow cytometry
Single-cell suspensions were stained with antibodies directly conjugated to surface markers. Intracellular stains were performed using commercially available Fix and permeabilization solutions coupled to incubation with ki67 or DAPI antibodies. Multi-color cytometry was performed on the Symphony flow cytometer (BD biosciences) and analyzed with FlowJo v10.4.2.
Photoactivation
To label LZ-resident follicular dendritic cells, 10μl of 1mg/mL of B-Phycoerthrin (Invitrogen) was mixed with 1μl of 10mg/ml rabbit α-PE (Thermo) and injected into pre-immunized mice, 2 days before imaging. LNs were harvested and then cleared of adipose tissue under a dissecting microscope and placed in PBS between two coverslips held together by vacuum grease. FDC networks were identified by imaging at l=950 nm, at which no photoactivation is observed, and 3D regions of interest were photoactivated by higher-power scanning at l=830 nm. Imaging experiments were performed using an Olympus FV1000 upright microscope fitted with a 25X 1.05NA Plan water-immersion objective and a Mai-Tai DeepSee Ti-Sapphire laser (Spectraphysics).
RNA sequencing
For bulk RNA sequencing experiments congenic OTII Tfh cells (CD4+, CD62low, CXCR5hi, PD-1hi) or positively selected B cells (500 cells) were purified by flow cytometry 18 hours after pre-immunized host mice were injected with αDEC-205 chimeric antibodies. 1ng of total RNA was used to generate full length cDNA using Clontech’s SMART-Seq v4 Ultra Low Input RNA Kit (Cat # 634888). The cDNA was used to prepare libraries using Illumina Nextera XT DNA sample preparation kit (Cat # FC-131-1024). Libraries with unique barcodes were pooled at equal molar ratios and sequenced on an Illumina NextSeq 500 sequencer to produce 75bp reads, following manufacture protocol (Cat # 15048776).
For single cell RNA sequencing, single cell suspensions were prepared from half-spleens of NP-OVA immunized SellCreERT2 ROSAtdT mice on day 7 and 21 after immunization. Samples were indexed with TotalSeqC (BioLegend) cell surface antibodies and CD4+, CD62low, CD44hi, PD1hi, CXCR5high, tdTomato+ Tfh cells were purified by flow cytometry, pooled and loaded onto a Chromium Controller (10x Genomics). Single-cell RNA-seq libraries were prepared using the Chromium Single Cell 5′ v2 Reagent Kit (10x Genomics) according to manufacturer’s protocol. Libraries were loaded onto an Illumina NextSeq with the mid-Output Kit (150 paired end) for V-D-J analysis or NOVAseq for single cell gene expression. Hashtag indexing was used to demultiplex the sequencing data and generate gene-barcode matrices, respectively.
Statistical analyses
Statistical tests were conducted using Prism (GraphPad) software. Unpaired, two-tailed Student’s t-tests and one-way ANOVA with Tukey’s post hoc tests to further examine pairwise differences were used. Data were considered statistically significant at *p ≤ 0.05, **p ≤ 0.01, ***p ≤ 0.001, and ****p ≤ 0.0001. The number of mice per group, number of replicates and the nature of error bars are indicated in the legend of each figure. Center bars always indicate mean and error bars always plot s.e.m.
Computational analysis
For differential gene expression analysis in the bulk RNA sequencing experiments we used kallisto (v.0.46) to map sequence reads to Mus musculus transcriptome (GRCm38/ Ensembl release 99). Kallisto TPM values were converted to absolute counts using tximport (v1.12.3) R package and DESeq2 (v.1.24.0) was utilized for differential expression analysis. Differentially expressed genes were defined by having an adjusted p-value < 0.05 and | logFC| > log2(1.5). In the Venn diagrams common differentially expressed genes also had common behavior between groups, i.e. up and down between the two data sets. Hierarchical clustering was based on combined data from three experimental repeats. Hierarchical clustering done based on data from the individual repeats gave similar results.
For Single-cell RNA-Seq analysis we used Cell Ranger (v3.0.2) 10X Genomics for single-cell UMI quantification and TCR clonotype assembly. Hashtag-oligos (HTOs) UMI counts were processed using CITE-Seq-Count (v1.4.0). We used Seurat (v3.1.2), an R package to analyze single cell RNA-seq data, to identify differentially expressed genes. Genes expressed in at least 10% of all cells belonging to clones exhibiting expansion or contraction, with the adjusted p-value by Bonferroni correction less than 0.05 and with |average logeFC| > loge(1.1) were selected as statistically significant differentially expressed genes.
To define Tfh clonal behaviors we used multiple binomial tests to interrogate whether the frequency of cells of a specific clone in the second time point is greater or less than expected, according to the frequency of the same clone in the first time point. Adjusted p-values (q-value) were calculated using the false discovery rate (FDR) correction. Expanded clones were defined as having cell frequency greater than expected in the second time point (q-value<0.05), while contracted clones were defined as having cell frequency less than expected in the second time point (q-value<0.05). Clones without statistical significance for any test were classified as conserved clones.
Extended Data
Extended Data Fig. 1. Tfh gating strategy.
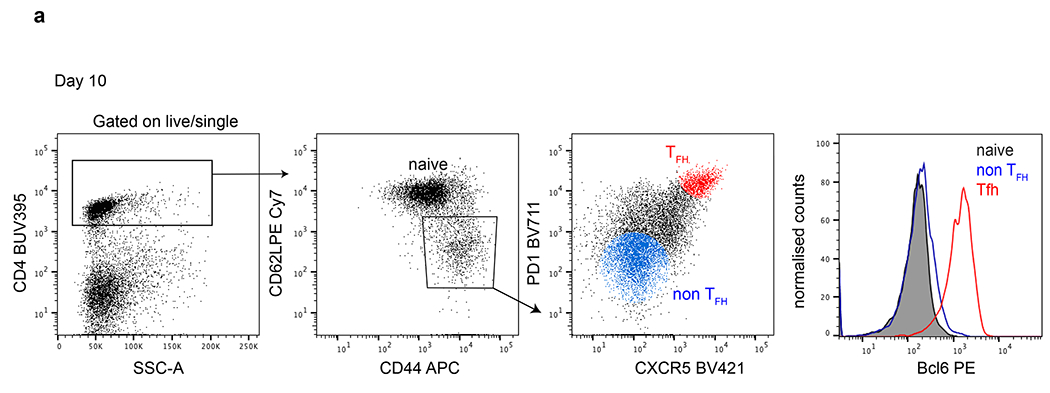
a, Flow cytometry plots detailing the Tfh gating strategy. Rightmost histogram compares Bcl6 expression in naïve (grey) and non Tfh (blue) versus Tfh (red) populations on d10 post immunization.
Extended Data Fig. 2. Production of SellCreERT2 ROSAtdT indicator mice.
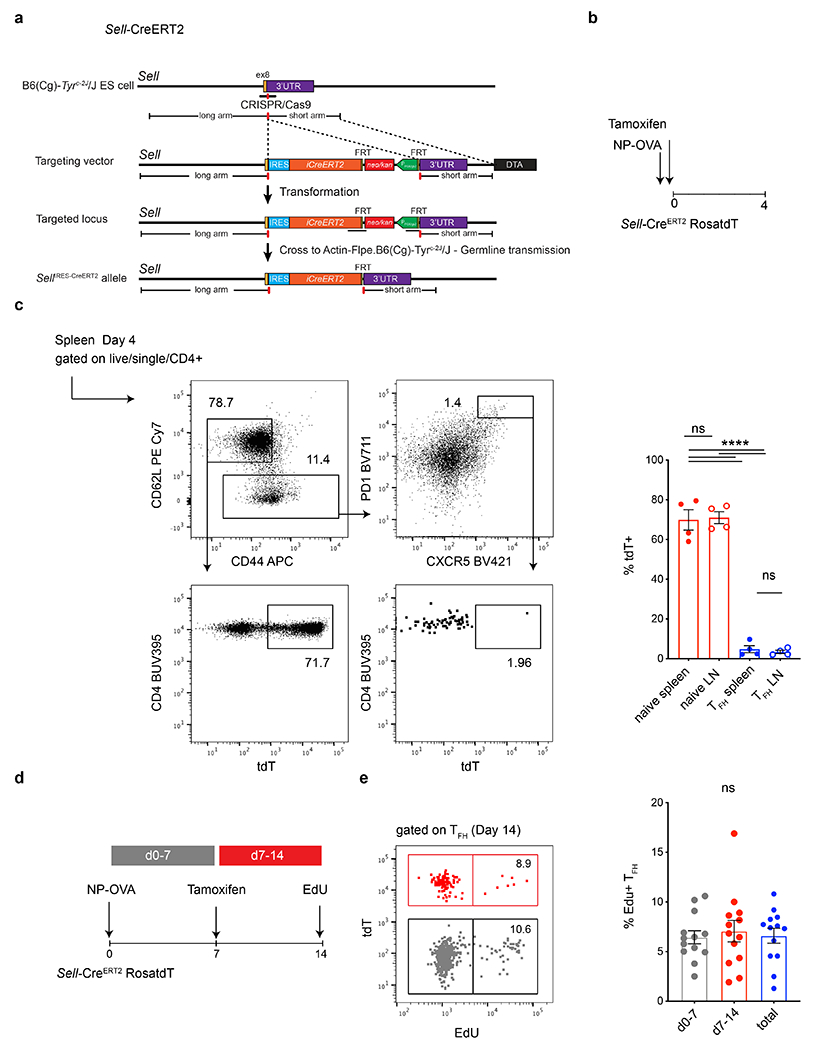
a, Targeting strategy and the configuration of the SellIRES-CreERT2 allele. The mice were produced at Rockefeller University and crossed to ROSA tdTomatoloxP/loxP to generate SellCreERT2 ROSAtdT indicator mice. b, Schematic representation of the experimental strategy used in c. c, Flow cytometry plots profiling tdT expression in naïve and Tfh splenic compartments in tamoxifen treated, mice culled 4 dpi. Rightmost plots compare the percentage of tdT labelling in naïve T cells (red) or Tfh cells (blue) residing in spleens (closed circle) or lymph nodes (open circle) of mice following the regime outlined in b. Data are from 4-5 mice per group and each dot represents one mouse .**** p <0.0001 by one-way ANOVA test. The experiment was performed 2 times. d, Schematic representation of the experimental setup. e, Flow cytometry plot showing EdU incorporation in labelled (red) or unlabeled (grey) Tfh populations on 14 dpi. Rightmost plot shows the frequency of EdU positive Tfh T cells 14 dpi, in population generated in the first 7 days (grey) or between days 8-14 (red) or the cumulative (blue). Flow cytometry plot showing EdU incorporation in labelled (red) or unlabeled (grey) Tfh populations on 14 dpi. EdU was delivered 3 hours before mice were culled. Numbers inside the gates denote the relative representation of EdU positive cells from within tdT positive or negative populations. Each dot represents one mouse. Data are from 14 mice and the experiment was performed twice.
Extended Data Fig. 3. OTII have disparate abilities to recognize the truncated APLs.
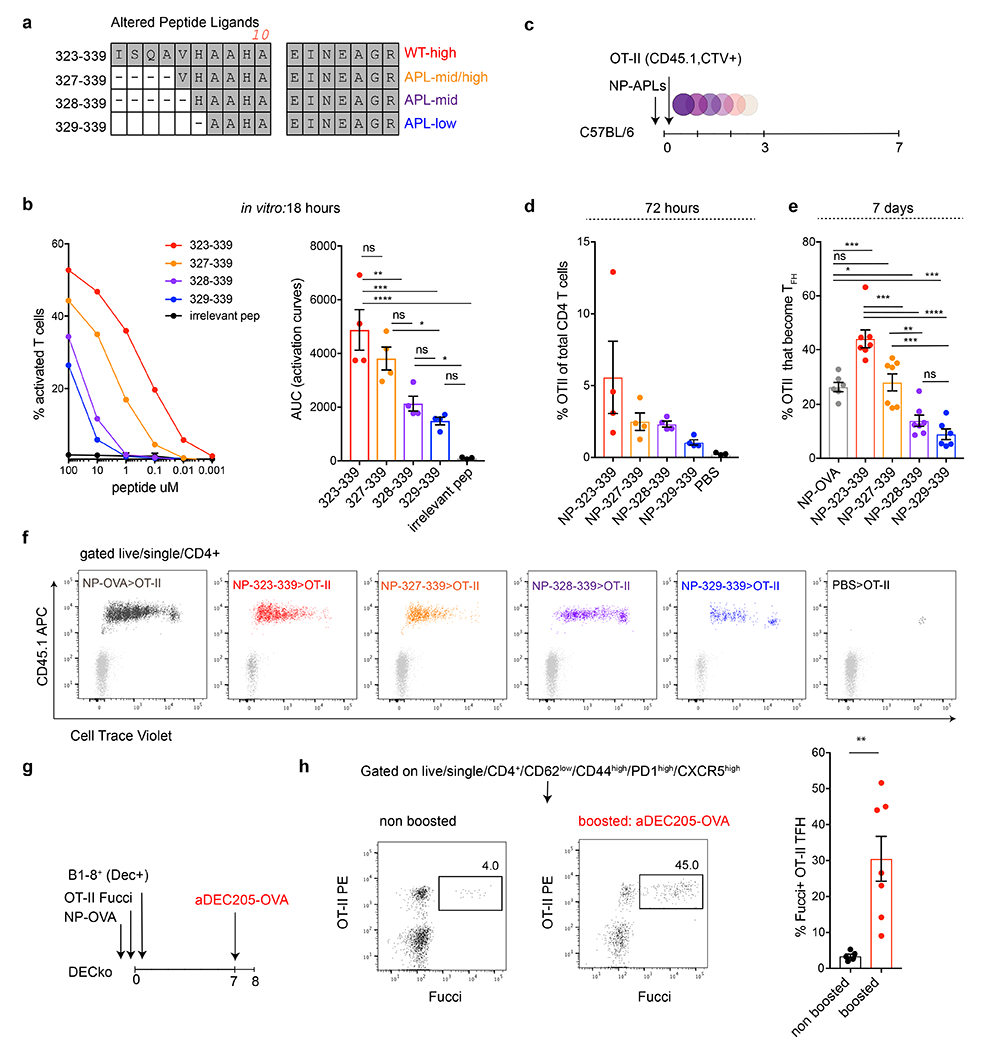
a, Description and sequence alignment of the nested altered peptide ligands (APLs). b, Graph shows OTII T cell responses to decreasing concentrations of APLs in vitro as measured by CD69 upregulation following 18 hours of exposure. Y axis shows the percentage of activated T cells and X axis is the peptide concentration. Bar graph shows the area under the adjacent response curves (AUC). *, ***, and **** p=0.0130, =0.0001, and <0.0001 tested by one-way ANOVA test. Each dot represents a distinct experimental well. This experiment was repeated 4 times. c, Schematic representation of experimental setup used in d-f. d, Bar graph shows percentage of OTII among all CD4 T cells in adoptive transfer recipients 72 hours after immunization with the indicated NP-APLs. e, Bar graph shows percentage of OTII T cells that become Tfh 7 days after NP-APL immunization. *, **, ***, and **** p=0.0186, =0.0039, <0.001 and <0.0001, by one-way ANOVA test. Each dot represents one mouse, with 6 or 7 mice per group and repeated a total of 2 times. f, Flow cytometry plots showing dilution of CellTrace Violet by OTII T cells responding to the NP-APL immunization in vivo after 72 hours. Each plots is an individual mouse. g, Schematic representation of experimental setup used in h. h, Flow cytometry plots profiling Fucci expression in non-boosted (5 mice) control or 18 hours following αDEC205-OVA (7 mice) injection. Rightmost bar graph compares the percentage of Fucci+ OTII Tfh in the respective conditions. Each dot represents a mouse and this experiment was performed twice. ** p=0.0048 by unpaired Student’s t-test.
Extended Data Fig. 4. GC resident Tfh proliferate.
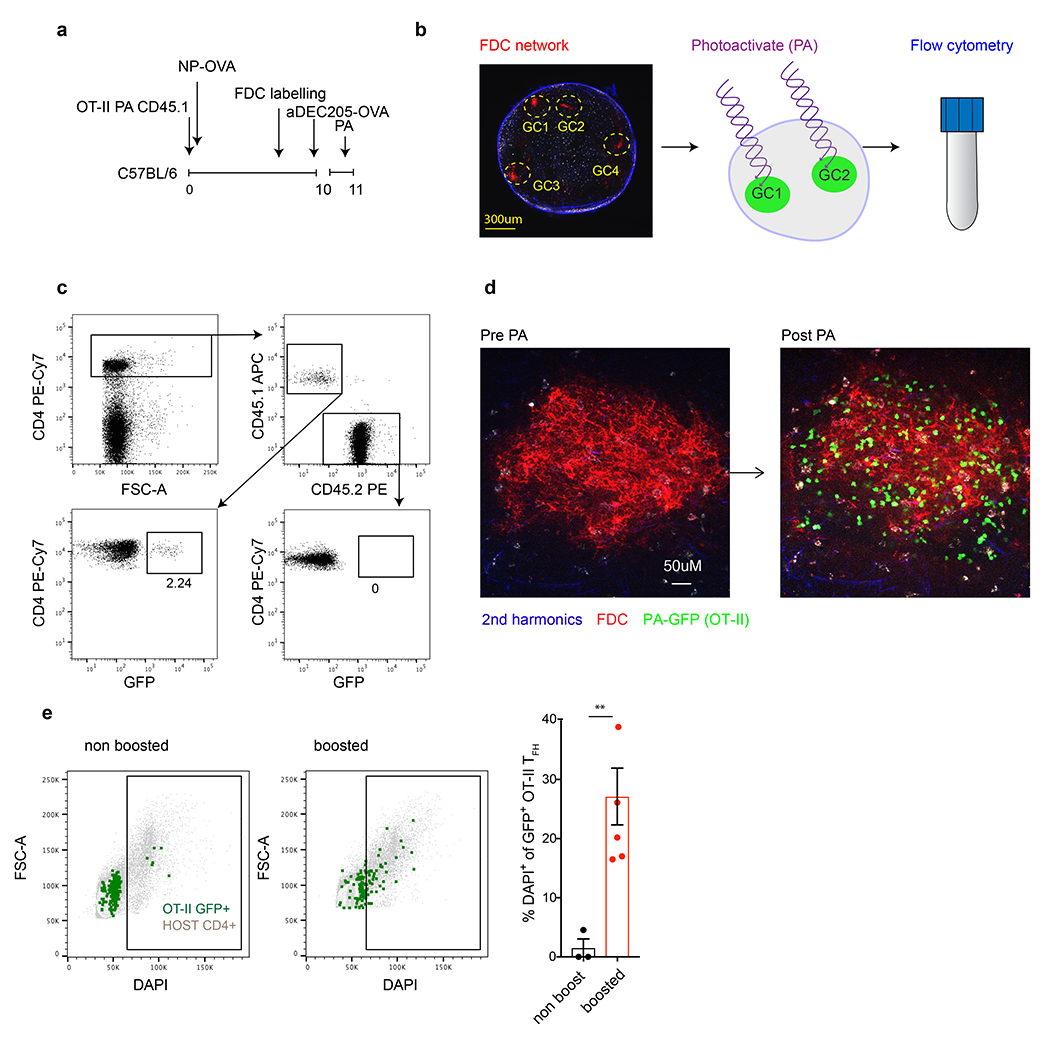
a, Schematic representation of experimental set up used in b-e. b, GCs in popliteal lymph nodes, as defined by the fluorescently labelled FDC network (red), were photoactivated (green) 18 hours after αDEC205-OVA injection, stained with a cocktail of fluorescent antibodies to allow analysis by downstream flowcytometry. c, Representative flow cytometry plots showing the gating of photoactivated OTII Tfh cells. d, A single GC from a popliteal lymph nodes as defined by fluorescently labelled FDC networks (red) pre and post photoactivation (left to right, respectively). OTII GC resident Tfh were photoactivated (green) 18 hours after αDEC205-OVA injection. e, Representative flow cytometry plots comparing DAPI staining in host (grey) or OTII GC resident GFP+ cells (green) in unperturbed mice (left) or 18 hours after boosting with an αDEC205-OVA injection (right). Bar graph shows the percentage of photoactivated OTII Tfh that entered the cell cycle (DAPI+) following αDEC205-OVA injection (5 mice) or in un-injected controls (4 mice). Each dot represents pooled lymph nodes from a single mouse.**, p=0.0086 by unpaired Student’s t-test. This experiment was repeated 2 times.
Extended Data Fig. 5. Increased TCR signaling enforces proliferation supported by a switch in metabolic status.
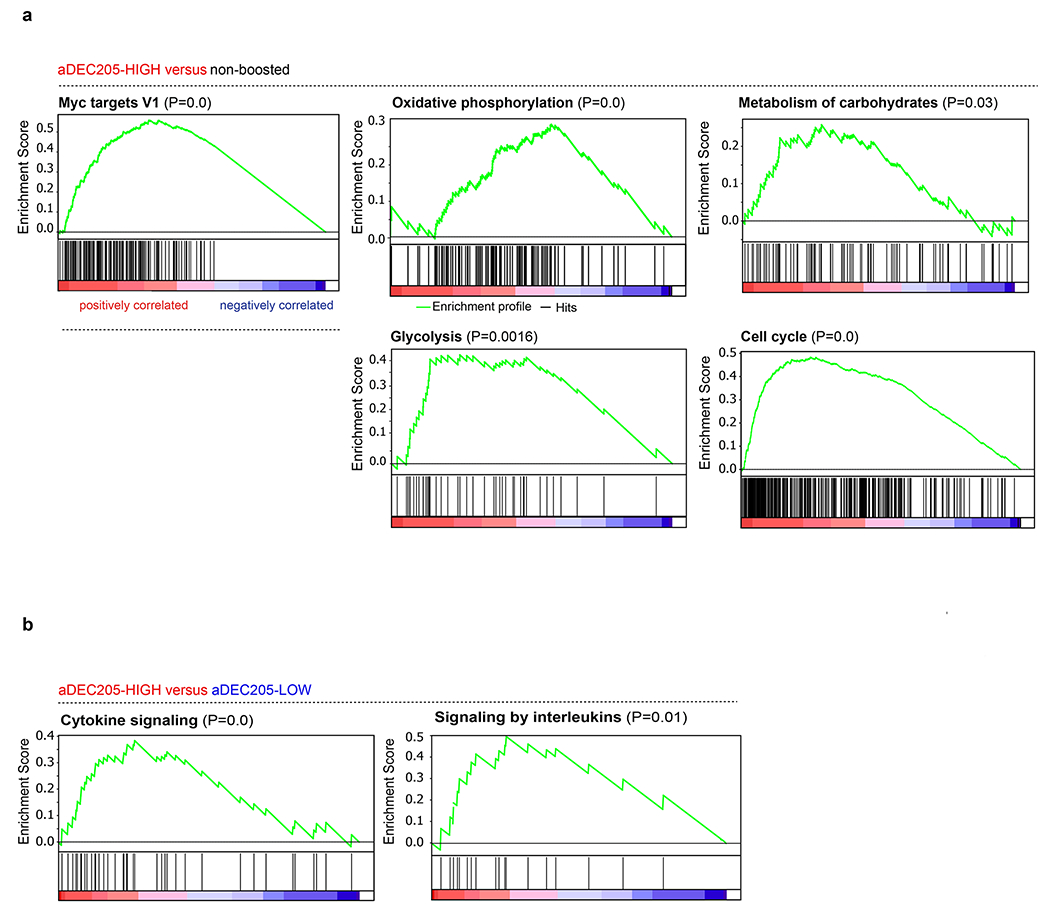
a, Gene Set Enrichment Analysis and the rank-ordered gene lists found upregulated in αDEC205-HIGH versus non boosted or b, αDEC205-HIGH versus αDEC205-LOW groups.
Extended Data Fig. 6. DO11 and OTII have different affinities for APLs.
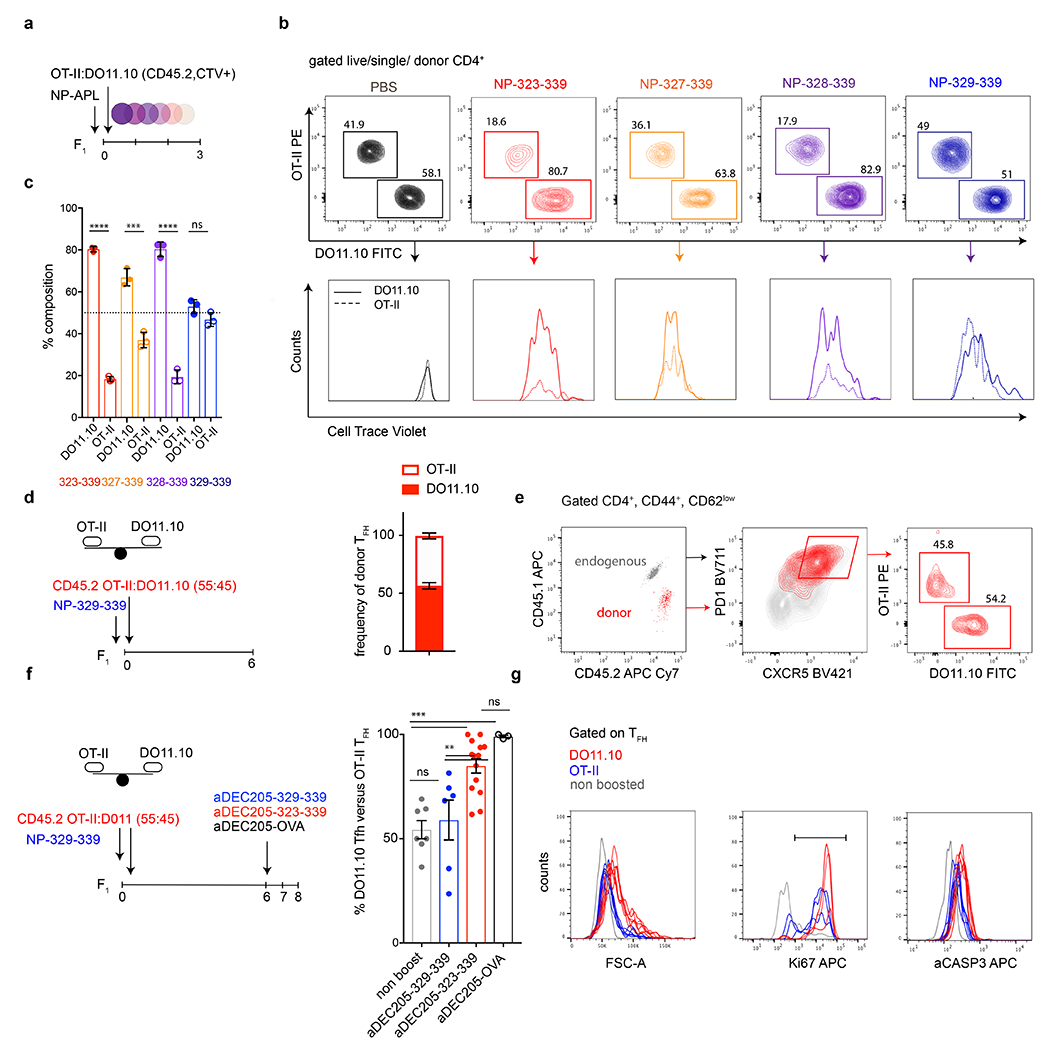
a, Schematic depicts the experimental setup. CTV labelled DO11.10 and OTII T cells were adoptively transferred into F1 mice and subsequently immunized with the NP-APLs. b, Representative flow cytometry plots compare the relative distribution and CellTrace Violet dilution of DO11.10 and OTII T cells in adoptive transfer recipients 3 dpi. Each panel of plots represents an individual mouse from the group. c, Bar graph shows the aggregate relative contribution of DO11.10 and OTII T cells 3 days after immunization in 3 mice per condition. Dotted line depicts the input ratio of DO11.10 and OTII at the time of transfer.***,**** p=0.0007, <0.0001 by unpaired Student’s t-test. This experiment was done twice but data for one experiment is plotted. d, Schematic depicting experiment in which adoptive transfer recipients of DO11.10 and OTII T cells were immunized with NP-329-339. Adjacent bar graph shows the aggregate relative contribution of DO11.10 and OTII T cells 6/7 days after immunization with NP-329-339. e, Representative flow cytometry plots showing the distribution of DO11.10 and OTII T cells in the Tfh compartment 7 days after immunization. f, Schematic depicting experiment in which adoptive transfer recipients of DO11.10 and OTII T cells were immunized with different NP-329-339 and boosted with the respective αDEC205 chimeric antibodies. Bar graph compares changes in the frequency of DO11.10 versus OTII Tfh when boosted with different αDEC205 chimeric antibodies on 6 dpi. Each dot represents an individual mouse and group size varied from 3-13 mice per condition. **,*** p=0.9, p<0.01, p<0.001 by one-way ANOVA test. g, Histogram overlays compare cell size (FSC-A), Ki67 expression and aCasp3 expression in OTII and DO11.10 Tfh populations from individual mice 18 hours following αDEC205-323-339 boosting. These experiments were repeated 2-3 times.
Extended Data Fig. 7. TCR signaling dictates the quality of T cell help delivered to cognate B cells.
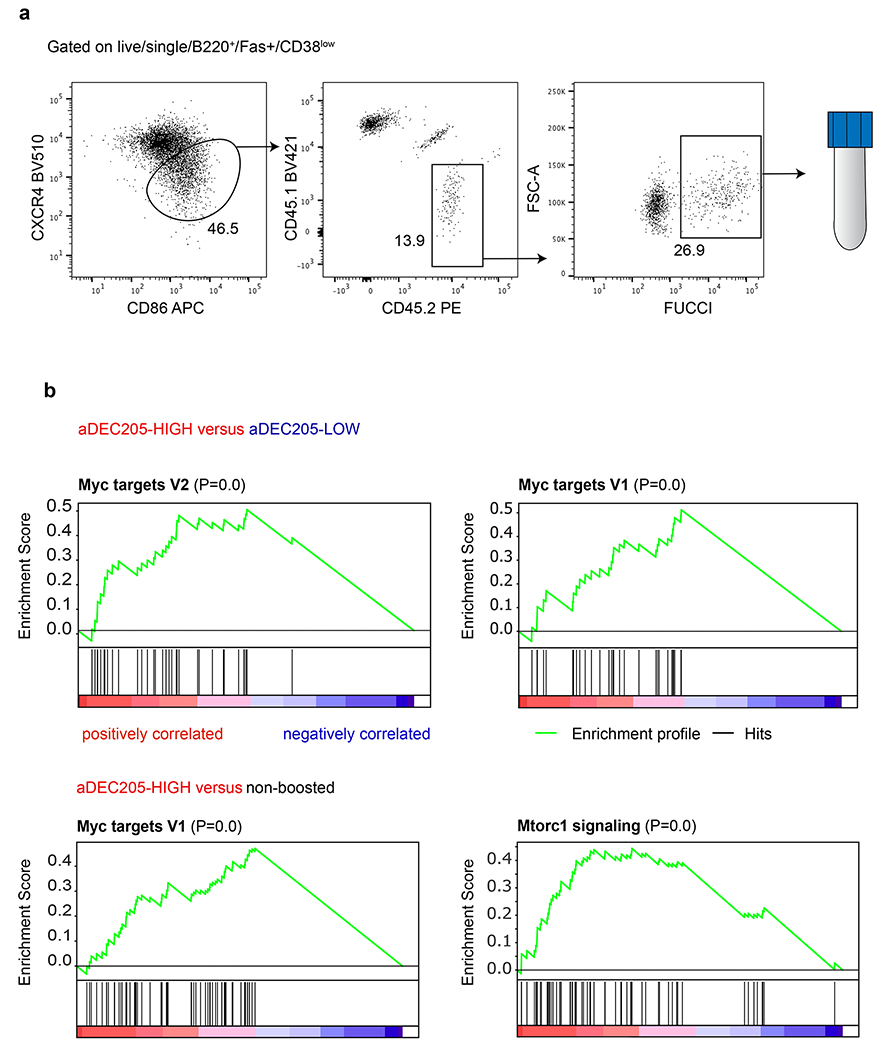
a, Flow cytometric plots showing the gating strategy to isolate positively selected light zone germinal center B cells 14 hours after αDEC205-APL antibody injection. b, Upper plots are a graphical representation of GSEA and the rank-ordered gene lists found upregulated in αDEC205-HIGH versus αDEC205-LOW boosted and recently selected Fucci+ GC LZ B cells. Lower plots are a graphical representation of GSEA and the rank-ordered gene lists found upregulated in αDEC205-HIGH boosted versus non-boosted controls.
Extended Data Fig. 8. Conservation of Tfh clonal families and clonal dominance in the spleens of d7 immunized mice.
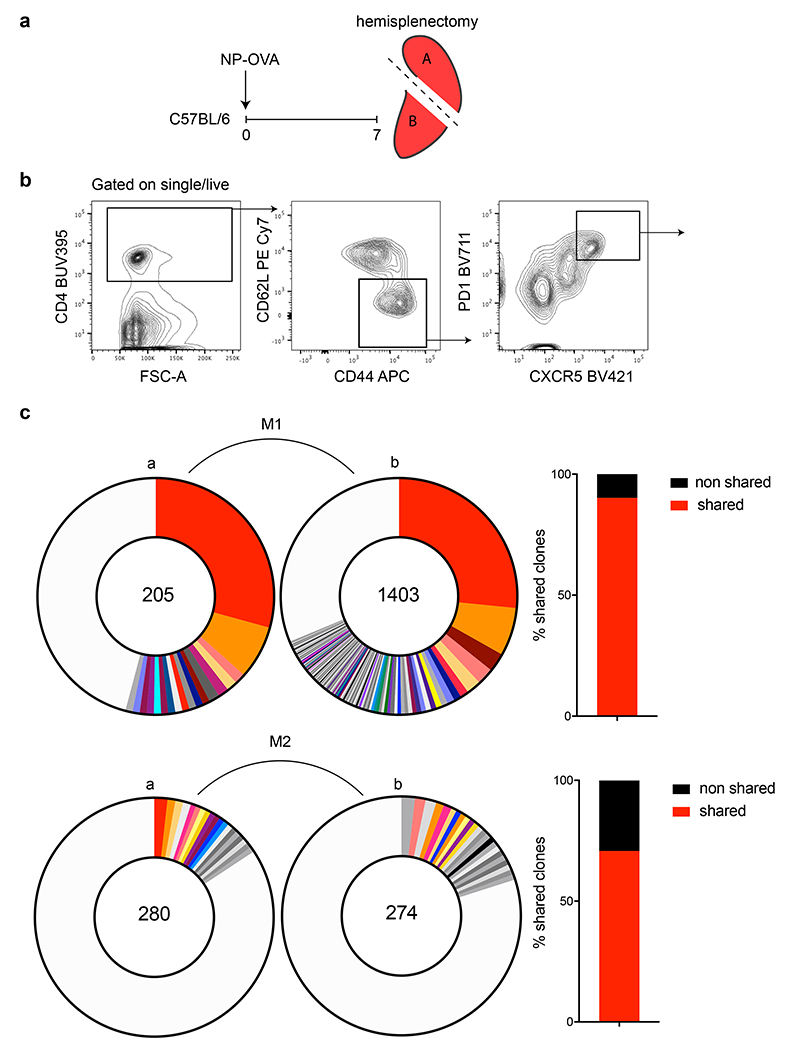
a, Schematic representation of the experimental strategy used in b, c. b, Flow cytometric plots depict the gating strategy used to define Tfh populations in c. Briefly, wt mice were immunized with NP-OVA and 7 days later Tfh cells were purified from the 2 halves of the spleen and then sequenced. c, Pie charts show expanded clonal families in each half of the spleen. Slices are proportional to the number of clones within a family. Colors indicate shared clones between the 2 spleen halves, a and b, from an individual mouse. Grey tones indicate unique clones not shared between the 2 halves. The total number of paired TCR chains recovered is indicated by the number in the center of the pie charts. Clonal distribution between adjacent spleen halved in M1 (top) is ns (p=0.2279) and M2 (bottom, p=0.009) by Fisher’s Exact test. Adjacent bar graphs show the relative conservation of clonotypes between the 2 halves of the spleen. Here, shared is that a clone can be found in both segments of the spleen and non-shared here is referring to anatomically novel clones.
Extended Data Fig. 9. Hemi-splenectomized mice have normal GC reactions.
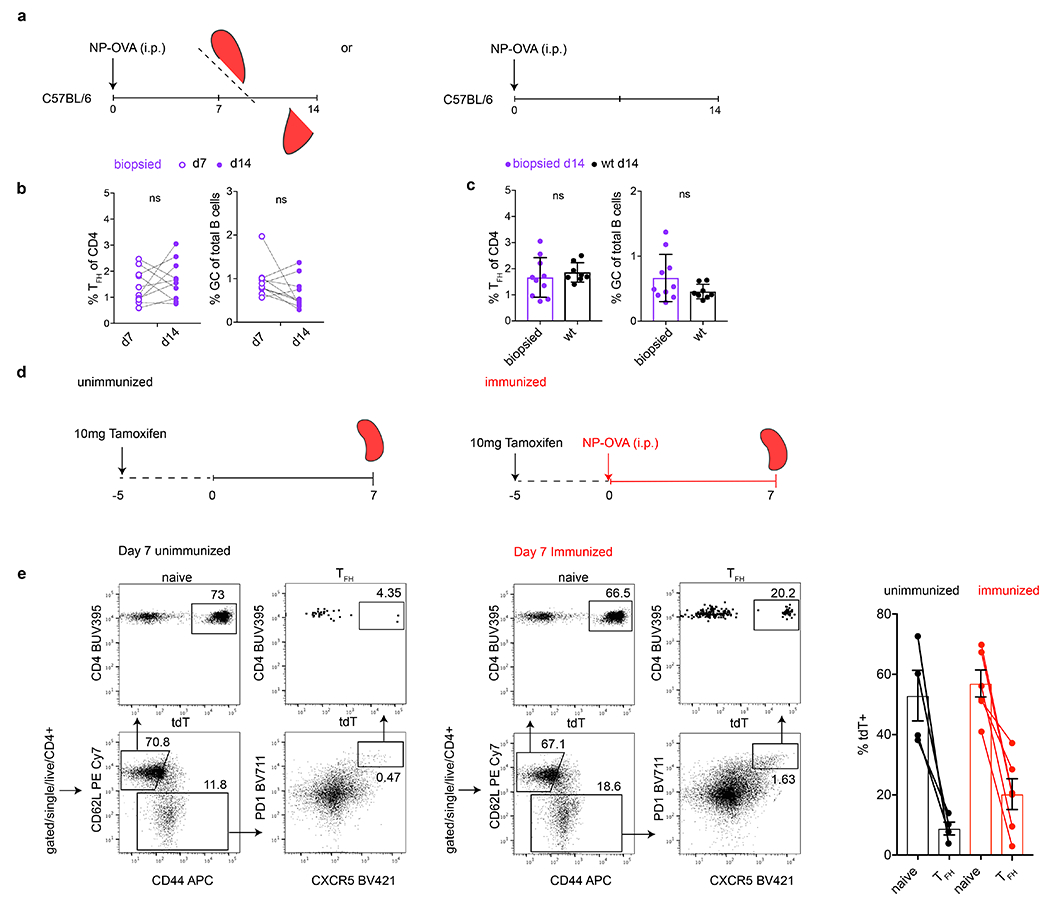
a, Schematic representation of the experimental strategy used in b, c. Briefly, NP-OVA immunized C57BL/6 mice were biopsied on 7 dpi and culled on 14 dpi in order to interrogate changes that might occur in the GC compartment following surgical intervention (left). NP-OVA immunized C57BL/6 mice who did not receive surgical intervention served as controls for biopsied mice (right). b, Adjacent plots show the frequency of Tfh within total CD4+ T cells (left) or GC B cells within total B cells (right) in individual biopsied mice between time points 7 dpi (open purple) and 14 dpi (closed purple). Data was tested by paired Student’s t-test (p=0.43 and p=0.14) and so revealed no significant differences between the time points. Dotted lines trace individual mice over time. c, Adjacent plots compare the frequency of Tfh within total CD4 T cells (left) or GC B cells within total B cells (right) on 14 dpi in mice who were either biopsied (purple) or C57BL/6 mice who were not (black). Student’s t-test p=0.52, p=0.13 revealed no significant differences between the experimental groups. d, Schematic representation of the experimental strategy used in e. e, Flow cytometry plots profiling of tdT expression in splenic naïve and Tfh compartments in tamoxifen treated mice but unimmunized mice (left quadrants) or similarly in tamoxifen treated mice 7 days after NP-OVA immunization (right quadrants). Rightmost bar graph compares the percentage of tdT+ populations between labeled populations in the unimmunized and immunized mice (13 days after tamoxifen administration and 7 dpi).
Extended Data Fig. 10. scRNA-seq reveals extensive clonal evolution of Tfh.
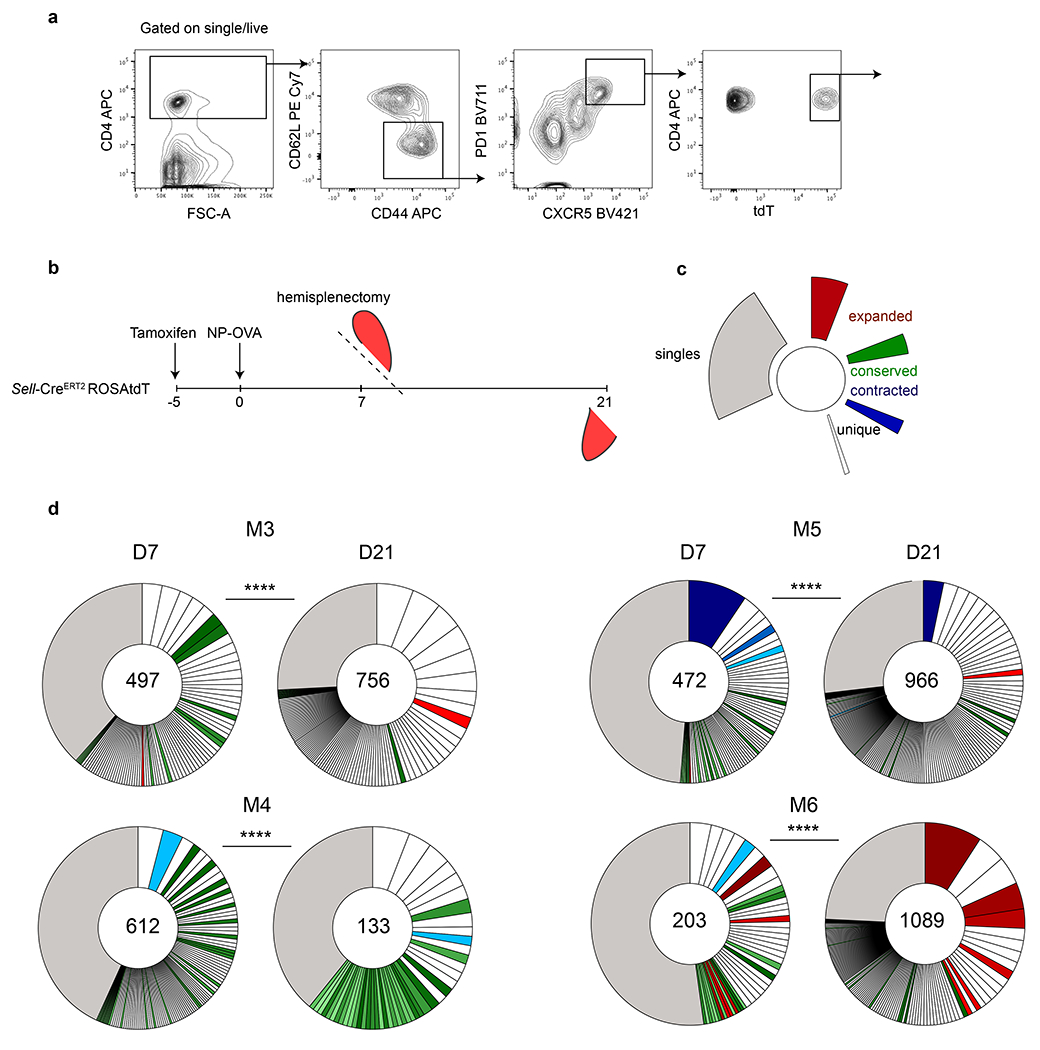
a, Flow cytometry plots depicting gating strategy used to define responding Tfh cells. b, Schematic representation of the experimental strategy used in d. c, Color coded indexing for the clonal behaviors categorized in mice between d7 and d21. Expanded (red), conserved (green), contracted (blue) and singles (grey). Clones that are not colored were novel to each time point. d, Pie charts show clonal populations of Tfh within each mouse at each time point. Segments within the pie charts report the proportional representation of each clone. Clonotypes containing the same CDR3 sequence for alpha or/and beta chain. **** by Fisher Exact test, p= 0.000016 reveals that clonal composition is significantly different between time points within the same mouse. Numbers inside the pie charts refer to the total number of alpha and beta TCR sequences recovered.
Supplementary Material
Supplementary Table S1. List of mABs produced and their characteristics.
Acknowledgements
We thank A. Miyawaki, T. Kurosaki for the FUCCI mice, Ervin E. Kara and Thomas Hagglof for the generation and maintenance of SellCreERT2 ROSAtdT reporter mice, Henry Zebroski for the generation of the APLs and the NP-APL conjugates in house, T. Eisenreich for help with mouse colony management, and technical help, Amelia Escolano for advice, B. Zhang and C. Zhao at The Rockefeller University Genomics Resource Center for assistance with 10X genomics and high-throughput sequencing, K. Gordon and K. Chhosphel for assistance with cell sorting, and all members of the Nussenzweig laboratory for discussion. We thank G. Victora for discussions involving the photoactivation experiments. This work was supported by NIH grant 5R37 AI037526 and NIH Center for HIV/AIDS Vaccine Immunology and Immunogen Discovery (CHAVID) 1UM1AI144462-01 to M.C.N. J.M. is an EMBO fellow. M.C.N. is an HHMI investigator.
Footnotes
Data Availability Statement
The data discussed in this publication have been deposited in NCBI’s Gene Expression Omnibus (Edgar et al., 2002) and are accessible through GEO Series accession number GSE147182 (https://www.ncbi.nlm.nih.gov/geo/query/acc.cgi?acc=GSE147182).
Ethical Statement
All procedures in mice were performed in accordance to protocols approved by the Rockefeller University IACUC. All animal experiments were performed according to the protocols approved by the Institutional Animal Care and Use Commitee of NIAID, NIH. The authors declare no competing financial interests.
References
- 1.Shulman Z et al. T Follicular Helper Cell Dynamics in Germinal Centers. Science 341, 673, doi: 10.1126/science.1241680 (2013). [DOI] [PMC free article] [PubMed] [Google Scholar]
- 2.Schwickert TA et al. A dynamic T cell-limited checkpoint regulates affinity-dependent B cell entry into the germinal center. J Exp Med 208, 1243–1252, doi: 10.1084/jem.20102477 (2011). [DOI] [PMC free article] [PubMed] [Google Scholar]
- 3.Crotty S T Follicular Helper Cell Biology: A Decade of Discovery and Diseases. Immunity 50, 1132–1148, doi: 10.1016/j.immuni.2019.04.011 (2019). [DOI] [PMC free article] [PubMed] [Google Scholar]
- 4.Vinuesa CG, Linterman MA, Yu D & MacLennan ICM Follicular Helper T Cells. Annual Review of Immunology 34, 335–368, doi: 10.1146/annurev-immunol-041015-055605 (2016). [DOI] [PubMed] [Google Scholar]
- 5.Cyster JG & Allen CDC B Cell Responses: Cell Interaction Dynamics and Decisions. Cell 177, 524–540, doi: 10.1016/j.cell.2019.03.016 (2019). [DOI] [PMC free article] [PubMed] [Google Scholar]
- 6.Victora GD & Nussenzweig MC Germinal Centers. Annual Review of Immunology 30, 429–457, doi: 10.1146/annurev-immunol-020711-075032 (2012). [DOI] [PubMed] [Google Scholar]
- 7.Pratama A & Vinuesa CG Control of TFH cell numbers: why and how? Immunology and cell biology 92, 40–48, doi: 10.1038/icb.2013.69 (2014). [DOI] [PubMed] [Google Scholar]
- 8.Shulman Z et al. Dynamic signaling by T follicular helper cells during germinal center B cell selection. Science (New York, N.Y.) 345, 1058–1062, doi: 10.1126/science.1257861 (2014). [DOI] [PMC free article] [PubMed] [Google Scholar]
- 9.Kitano M et al. Bcl6 Protein Expression Shapes Pre-Germinal Center B Cell Dynamics and Follicular Helper T Cell Heterogeneity. Immunity 34, 961–972, doi: 10.1016/j.immuni.2011.03.025 (2011). [DOI] [PubMed] [Google Scholar]
- 10.Crotty S Follicular Helper CD4 T Cells (TFH). Annual Review of Immunology 29, 621–663, doi: 10.1146/annurev-immunol-031210-101400 (2011). [DOI] [PubMed] [Google Scholar]
- 11.Linterman MA et al. Follicular helper T cells are required for systemic autoimmunity. Journal of Experimental Medicine 206, 561–576, doi: 10.1084/jem.20081886 (2009). [DOI] [PMC free article] [PubMed] [Google Scholar]
- 12.Cubas RA et al. Inadequate T follicular cell help impairs B cell immunity during HIV infection. Nat Med 19, 494–499, doi: 10.1038/nm.3109 (2013). [DOI] [PMC free article] [PubMed] [Google Scholar]
- 13.Harker JA, Lewis GM, Mack L & Zuniga EI Late interleukin-6 escalates T follicular helper cell responses and controls a chronic viral infection. Science 334, 825–829, doi: 10.1126/science.1208421 (2011). [DOI] [PMC free article] [PubMed] [Google Scholar]
- 14.Fahey LM et al. Viral persistence redirects CD4 T cell differentiation toward T follicular helper cells. The Journal of experimental medicine 208, 987–999, doi: 10.1084/jem.20101773 (2011). [DOI] [PMC free article] [PubMed] [Google Scholar]
- 15.Locci M et al. Human circulating PD-1+CXCR3-CXCR5+ memory Tfh cells are highly functional and correlate with broadly neutralizing HIV antibody responses. Immunity 39, 758–769, doi: 10.1016/j.immuni.2013.08.031 (2013). [DOI] [PMC free article] [PubMed] [Google Scholar]
- 16.Gitlin AD, Shulman Z & Nussenzweig MC Clonal selection in the germinal centre by regulated proliferation and hypermutation. Nature 509, 637–640, doi: 10.1038/nature13300 (2014). [DOI] [PMC free article] [PubMed] [Google Scholar]
- 17.Gitlin AD et al. T cell help controls the speed of the cell cycle in germinal center B cells. Science 349, 643–646, doi: 10.1126/science.aac4919 (2015). [DOI] [PMC free article] [PubMed] [Google Scholar]
- 18.Hawiger D et al. Dendritic cells induce peripheral T cell unresponsiveness under steady state conditions in vivo. The Journal of experimental medicine 194, 769–779, doi: 10.1084/jem.194.6.769 (2001). [DOI] [PMC free article] [PubMed] [Google Scholar]
- 19.Robertson JM, Jensen PE & Evavold BD DO11.10 and OT-II T Cells Recognize a C-Terminal Ovalbumin 323–339 Epitope. The Journal of Immunology 164, 4706–4712, doi: 10.4049/jimmunol.164.9.4706 (2000). [DOI] [PubMed] [Google Scholar]
- 20.Tubo NJ et al. Single naive CD4+ T cells from a diverse repertoire produce different effector cell types during infection. Cell 153, 785–796, doi: 10.1016/j.cell.2013.04.007 (2013). [DOI] [PMC free article] [PubMed] [Google Scholar]
- 21.AsakoSakaue-Sawano AM Visualizing Spatiotemporal Dynamics of Multicellular Cell-Cycle Progression. Cell 132, 487–498 (2008). [DOI] [PubMed] [Google Scholar]
- 22.Aiba Y et al. Preferential localization of IgG memory B cells adjacent to contracted germinal centers. Proceedings of the National Academy of Sciences 107, 12192–12197, doi: 10.1073/pnas.1005443107 (2010). [DOI] [PMC free article] [PubMed] [Google Scholar]
- 23.Jiang W et al. The receptor DEC-205 expressed by dendritic cells and thymic epithelial cells is involved in antigen processing. Nature 375, 151–155, doi: 10.1038/375151a0 (1995). [DOI] [PubMed] [Google Scholar]
- 24.Victora GD et al. Germinal center dynamics revealed by multiphoton microscopy with a photoactivatable fluorescent reporter. Cell 143, 592–605, doi: 10.1016/j.cell.2010.10.032 (2010). [DOI] [PMC free article] [PubMed] [Google Scholar]
- 25.Patterson GH & Lippincott-Schwartz J A photoactivatable GFP for selective photolabeling of proteins and cells. Science 297, 1873–1877, doi: 10.1126/science.1074952 (2002). [DOI] [PubMed] [Google Scholar]
- 26.Lau AW & Brink R Selection in the germinal center. Current opinion in immunology 63, 29–34, doi: 10.1016/j.coi.2019.11.001 (2019). [DOI] [PubMed] [Google Scholar]
- 27.Barnden MJ, Allison J, Heath WR & Carbone FR Defective TCR expression in transgenic mice constructed using cDNA-based alpha- and beta-chain genes under the control of heterologous regulatory elements. Immunology and cell biology 76, 34–40, doi: 10.1046/j.1440-1711.1998.00709.x (1998). [DOI] [PubMed] [Google Scholar]
- 28.Hu J, Qi Q & August A Itk Derived Signals Regulate the Expression of Th-POK and Controls the Development of CD4+ T Cells. PLOS ONE 5, e8891, doi: 10.1371/journal.pone.0008891 (2010). [DOI] [PMC free article] [PubMed] [Google Scholar]
- 29.Crotty S T follicular helper cell differentiation, function, and roles in disease. Immunity 41, 529–542, doi: 10.1016/j.immuni.2014.10.004 (2014). [DOI] [PMC free article] [PubMed] [Google Scholar]
- 30.Vinuesa CG, Tangye SG, Moser B & Mackay CR Follicular B helper T cells in antibody responses and autoimmunity. Nature reviews. Immunology 5, 853–865, doi: 10.1038/nri1714 (2005). [DOI] [PubMed] [Google Scholar]
- 31.Finkin S, Hartweger H, Oliveira TY, Kara EE & Nussenzweig MC Protein Amounts of the MYC Transcription Factor Determine Germinal Center B Cell Division Capacity. Immunity 51, 324–336. e325, doi: 10.1016/j.immuni.2019.06.013 (2019). [DOI] [PMC free article] [PubMed] [Google Scholar]
- 32.Shulman Z et al. T Follicular Helper Cell Dynamics in Germinal Centers. Science 341, 673–677, doi: 10.1126/science.1241680 (2013). [DOI] [PMC free article] [PubMed] [Google Scholar]
- 33.Merkenschlager J et al. Stepwise B-cell-dependent expansion of T helper clonotypes diversifies the T-cell response. Nature Communications 7, 10281, doi: 10.1038/ncomms10281 (2016). [DOI] [PMC free article] [PubMed] [Google Scholar]
- 34.de Vinuesa CG et al. Germinal Centers without T Cells. Journal of Experimental Medicine 191, 485–494, doi: 10.1084/jem.191.3.485 (2000). [DOI] [PMC free article] [PubMed] [Google Scholar]
- 35.Johnston RJ et al. Bcl6 and Blimp-1 Are Reciprocal and Antagonistic Regulators of T Follicular Helper Cell Differentiation. Science 325, 1006, doi: 10.1126/science.1175870 (2009). [DOI] [PMC free article] [PubMed] [Google Scholar]
- 36.Rolf J et al. Phosphoinositide 3-Kinase Activity in T Cells Regulates the Magnitude of the Germinal Center Reaction. The Journal of Immunology, 1001730, doi: 10.4049/jimmunol.1001730 (2010). [DOI] [PubMed] [Google Scholar]
- 37.Weisel FJ, Zuccarino-Catania GV, Chikina M & Shlomchik MJ A Temporal Switch in the Germinal Center Determines Differential Output of Memory B and Plasma Cells. Immunity 44, 116–130, doi: 10.1016/j.immuni.2015.12.004 (2016). [DOI] [PMC free article] [PubMed] [Google Scholar]
Associated Data
This section collects any data citations, data availability statements, or supplementary materials included in this article.
Supplementary Materials
Supplementary Table S1. List of mABs produced and their characteristics.


