

Summary
The lack of access to fruit/vegetable markets (FVMs) is thought to be a risk factor for childhood obesity by discouraging healthy dietary behaviours while encouraging access to venues that offer more unhealthy food (and thus the compensatory intake of those options). However, findings remain mixed, and there has not been a review of the association between FVM access and childhood obesity. A comprehensive and systematic understanding of this epidemiologic relationship is important to the design and implementation of relevant public health policies. In this study, a literature search was conducted in the Cochrane Library, PubMed, and Web of Science for articles published before 1 January 2019 that focused on the association between neighbourhood FVM access and weight‐related behaviours and outcomes among children and adolescents. Eight cross‐sectional studies, two longitudinal studies, and one ecological study conducted in five countries were identified. The median sample size was 2142 ± 1371. Weight‐related behaviours and outcomes were used as the outcome variable in two and eight studies, respectively, with one study using both weight‐related behaviours and outcomes as outcome variables. We still found a negative association between access to FVMs in children's residential and school neighbourhoods and weight‐related behaviours and an inconclusive association between FVM access and overweight or obesity. This conclusion should be regarded as provisional because of a limited amount of relevant evidence and may not be a strong guide for policymaking. Nonetheless, it points to an important research gap that needs to be filled if successful public health interventions are to be undertaken.
Keywords: access, child, food environment, fruit, obesity, vegetable
1. INTRODUCTION
Obesity is a leading cause of morbidity and premature mortality, and the prevalence of overweight and obesity is increasing worldwide. 1 Their prevalence in childhood has also risen. 2 , 3 From 1980 to 2013, the prevalence of overweight and obesity rose by 47.1% among children and adolescents worldwide. 4 In particular, from 1975 to 2016, the global age‐standardized mean body mass index (BMI) increased by 0.32 and 0.40 kg/m 2 per decade for girls and boys, respectively. 5 Childhood obesity, if left unchecked, is associated throughout the life course with a greater risk and the earlier onset of chronic disorders, such as metabolic syndrome, cardiovascular disease, diabetes mellitus and its associated retinal and renal complications, nonalcoholic fatty liver disease, obstructive sleep apnea, polycystic ovarian syndrome, infertility, asthma, and orthopaedic complications. 6 Also, childhood obesity results in adverse psychosocial consequences and lowers educational attainment. 7 , 8 , 9 Since it is much more difficult to treat adulthood obesity, creating initiatives to prevent and mitigate childhood obesity is considered one of the major public health challenges of the 21st century.
The neighbourhood environment may interact with personal characteristics to affect individual weight status and, at times, even outweigh personal factors. Some studies have examined the influence of the neighbourhood food environment on health‐related behaviours and weight gain, through the availability, accessibility, affordability, acceptability, and accommodation of food. 10 , 11 , 12 , 13 Fruit and vegetable markets (FVMs) are among the most important venues providing healthy food, as fruit and vegetables have low energy density and high dietary fibre content. Increased consumption of fruit and vegetables has been associated with the increasing satiety effect, which may play a critical role in preventing overweight and obesity. 14 , 15 Children and adolescents are more likely to be affected by their food environment and by marketing than adults, 7 , 16 and hence, it is necessary to improve children's exposure to a healthy food environment to protect them from the risk of developing obesity. 7 The World Health Organization (WHO) has also emphasized the need for initiatives to make fruit and vegetables more accessible in residential neighbourhoods. 17
Some studies have suggested that greater availability and higher density of FVMs in the neighbourhood were associated with healthy eating habits and lower risk of overweight/obesity among children. 10 , 18 , 19 , 20 , 21 However, other studies reported inconsistent results. For example, one study found that students living in neighbourhoods with higher densities of FVMs showed no association with the risk for obesity 22 ; a study conducted in the United States reported that the number of FVMs around children's homes was not associated with overweight/obesity. 23 Therefore, it is necessary to perform a systematic review to understand the role of FVM accessibility in childhood obesity. To the best of our knowledge, there has not been any study reviewing this association until this one.
This review contributes to the literature in the following respects: First, we expanded the concept of the access to FVMs to a full range of measurements (eg, number of FVMs, density of FVMs, and proximity to the nearest FVM) around multiple sites (eg, home, school, and workplace), for a comprehensive understanding of the influence of FVMs on children's weight‐related outcomes. Second, we examined both body‐weight status and weight‐related behaviours (eg, diet, physical activity, and sedentary behaviours). We tested our hypothesis that better FVM accessibility may be associated with healthier eating behaviours and lower risk for overweight and obesity among children and adolescents.
2. METHODS
A systematic review was conducted in accordance with the Preferred Reporting Items for Systematic Reviews and Meta‐Analyses. 24
2.1. Study selection criteria
Studies that met all the following criteria were included in the review: (a) They were peer‐reviewed ecological, cross‐sectional, or longitudinal studies (including prospective and retrospective cohort studies), rather than review or other types of nonoriginal research articles (eg, letters, editorials, and study/review protocols); (b) they examined the association between FVM accessibility and weight‐related behaviours/outcomes among children and/or adolescents aged 18 years and below, rather than lacking the measures of either FVM accessibility or weight‐related behaviours/outcomes or examining that association among adults aged above 18 years; (c) they were published in English and prior to 31 December 2018.
2.2. Search strategy and data extraction
A keyword search was performed in three electronic bibliographic databases: Cochrane Library, PubMed, and Web of Science. The search strategy included all possible combinations of keywords from the three groups related to FVMs, children, and weight‐related behaviours or outcomes. A full description of search strategies is provided in Appendix A.
Two reviewers (P.F. and R.T.) independently screened titles and abstracts of the articles identified through the keyword search against the study selection and excluded the irrelevant records. Interrater agreement was assessed by the Cohen kappa, which was 0.964, indicating a high agreement. Discrepancies were screened by a third reviewer (S.Y.), and the list of articles for the full‐text review was jointly determined by three reviewers after discussion. Then, two reviewers (P.F. and R.T.) independently reviewed the full texts of all articles in the list and determined the final pool of articles included in the review. Interrater agreement was again assessed by the Cohen kappa, which was 0.883. Discrepancies were resolved also by the third reviewer (S.Y.).
A standardized form of data extraction was used to collect key variables from each selected study whenever applicable, including (a) author(s) and year of publication, (b) study design, area, scale, and subject, (c) sample size, age, and characteristics, (d) statistical model used, (e) measures of FVM accessibility and weight‐related behaviours and/or outcomes, and (f) the reported association between FVM accessibility and weight‐related behaviours and/or outcomes. P.F. and R.T. independently extracted data from each included study, with discrepancies resolved by S.Y.
2.3. Study quality assessment
We used the National Institutes of Health's Quality Assessment Tool for Observational Cohort and Cross‐Sectional Studies to assess the quality of each included study. 25 This assessment tool rates each study based on 14 criteria (Table S1). For each criterion, a score of 1 was assigned if “yes” was the response, whereas a score of 0 was assigned otherwise (ie, an answer of “no,” “not applicable,” “not reported,” or “cannot determine”). A study‐specific global score ranging from 0 to 14 was calculated by summing up scores across all criteria. The study quality assessment was used to measure the strength of scientific evidence but not to determine the inclusion of studies.
3. RESULTS
3.1. Study selection
Figure 1 shows the study selection flowchart. We extracted 1732 articles through the keyword search. After excluding 522 repeated articles, we screened titles and abstracts and excluded 1045 articles. The full texts of the remaining 165 articles were reviewed against the study selection criteria, and 154 articles were further excluded. The remaining 11 studies that examined the relationship between FVM access and children's weight‐related behaviours and/or outcomes were included in this review.
FIGURE 1.
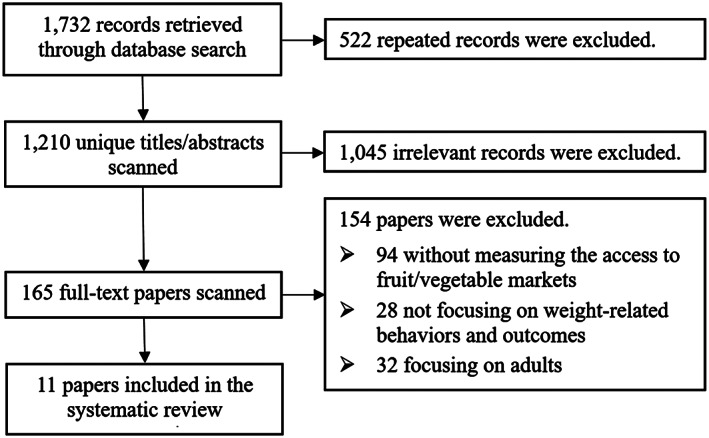
Study exclusion and inclusion flowchart
3.2. Study characteristics
Table 1 summarizes the basic characteristics of the 11 included studies, including eight cross‐sectional studies, two longitudinal studies, and one ecological study. Most studies were conducted in the United States (n = 6), followed by Brazil (n = 2), Australia (n = 1), China (n = 1), and South Korea (n = 1). The sample size ranged from 120 to 12 954, with a mean of 2142 ± 1371. The age of samples ranged from 4 to 19 years, with two studies not reporting the sample size and age. Seven studies focused on schoolchildren, two studies on urban children, one on both urban and rural children, and one on young girls alone. The statistical models used were composed of linear regression (n = 5), logistic regression (n = 5), and generalized estimating equation (n = 2).
TABLE 1.
Basic characteristics of 11 included studies
| First Author (y) | Study Area (scale) a | Sample Size | Sample Age (y, Range and/or Mean ± SD) b | Sample Characteristics (Follow‐up Status for Longitudinal Studies) | Statistical Model |
|---|---|---|---|---|---|
| Longitudinal studies | |||||
| Leung (2011) 10 | San Francisco Bay Area, USA (CT4) | 353 | 6‐7 (7.4 ± 0.4) in 2005 | Girls (followed up from 2005 to 2008 with three repeated measures and an attrition rate of 20.5%) | General linear and logistic regression |
| Zhang (2016)32 | China (N) | 348 | 6‐17 (10.9 ± 2.8) in 2009 | Urban/rural children (followed up from 2009 to 2011) | Generalized Estimating Equation |
| Cross‐sectional studies | |||||
| Bullock (2016) 23 | North Carolina, USA (S) | NA | NA | Preschool children | Linear regression |
| Burd (2013) 26 | New York, USA (C) | 120 | 4‐6 (5.2 ± 0.8) in 2005‐2010 | Urban children | Multilevel linear regression |
| Corrêa (2017) 27 | Florianópolis, Brazil (C) | 2506 | 7‐14 in 2010 | Schoolchildren | Logistic regression |
| Jilcott (2011) 28 | Pitt County, USA (CT) | 744 | 8‐18 (12.9 ± 2.5) in 2007‐2008 | Schoolchildren | General linear regression |
| Nogueira (2018) 29 | São Paulo, Brazil (C) | 521 | 12‐19 (15.5 ± 2.29) in 2015 | Urban children | Multilevel logistic regression |
| Park (2013) 22 | Seoul, South Korea (C) | 939 | 12.1 ± 1.8 in 2011 | Elementary and middle schoolchildren | Multilevel linear regression; generalized estimating equation |
| Tang (2014) 30 | New Jersey, USA (C4) | 12 954 | 13.47 ± 3.46 in 2008‐2009 | Middle and high schoolchildren | Multivariate linear regression |
| Timperio (2008) 31 | Victoria, Australia (C2) | 801 | 5‐6 and 10‐12 in 2002‐2003 | Schoolchildren | Logistic regression |
| Ecological study | |||||
| Dwicaksono (2017) 21 | New York, USA (S) | NA | NA | Schoolchildren | Multivariable logistic regression |
Abbreviation: NA, not available.
Study scale: [N] = National; [S] = State (eg, in the United States) or equivalent unit (eg, province in China, Canada); [Sn] = n states or equivalent units; [CT] = county or equivalent unit; [CTn] = n counties or equivalent units; [C] = City; [Cn] = n cities.
Sample age: Age in baseline year for longitudinal studies or mean age in survey year for cross‐sectional studies.
Table 2 summarizes the measures of the access to FVMs and weight‐related behaviours/outcomes in the included studies. The measures of FVM access included the number or density of FVMs (n = 10), the presence or availability of FVMs (n = 3), and the distance from home or school to the nearest FVM (n = 3). One study measured FVM access as the number of farmer's markets per county and per 10 000 persons. 23 One study measured the number of produce stands/farmers' markets within 0.4/0.8/1.6/8‐km radii straight‐line buffer around home. 28 Other studies created buffer zones with different radii and around either homes or schools: Two studies used a 0.4‐km radius straight‐line buffer around schools 22 or homes, 28 and another two used a 0.4‐km radius road‐network buffer around schools 30 or homes 10 ; three used a 0.8‐km radius road‐network 31 or straight‐line 26 , 28 buffer around homes; two used a 1.0‐km radius road‐network 29 and straight‐line 32 buffer around homes; and two used a 1.6‐km radius straight‐line buffer around home, 28 , 29 and another two used a 1.6‐km radius road‐network around home or school. 10 , 21
TABLE 2.
Measures of access to fruit/vegetable markets, weight‐related behaviours, and body‐weight status in the included studies
| First Author (year) | Measures of Access to Fruit/Vegetable Market | Other Environmental Factors Adjusted for in the Model | Measures of Weight‐Related Behavior | Measures of Weight‐Related Outcomes | Results of Weight‐Related Behavior | Results of Weight‐Related Outcomes |
|---|---|---|---|---|---|---|
| Longitudinal studies | ||||||
| Leung (2011) 10 | ● Number of FVMs (produce stands/farmers’ markets) in 0.4/1.6‐km home road‐network buffer | ● Demographic features: baseline weight status, race/ethnicity, parent's/caregiver's highest education level, household income, county of residence | NA | ● Weight status (BMI for age) Normal (<85th percentile on the 2000 US CDC growth charts) | NA | ● Presence of FVMs within 0.4‐km buffer was not associated with overweight/obesity (OR = 2.83; 95% CI, 0.62‐12.85) and 3‐ychange in BMI z score (β = .10; 95% CI, −0.06 to 0.26) |
| ● Overweight (85th percentile‐ < 95th percentile on the 2000 US CDC growth charts); obese (≥95th percentile on the 2000 US CDC growth charts) | ||||||
| ● Availability of produce vendors/farmer's markets within a 1.6‐km buffer was inversely associated with overweight/obesity (OR 0.22; 95% CI, 0.05‐1.06), but not association with 3‐y change in BMI z score (β = −.03; 95% CI, −0.10 to 0.15). | ||||||
| BMI z scores | ||||||
| Zhang (2016) 32 | ● Density of FVMs (free markets) in 1.0‐km home straight‐line buffer | ● SES features: household income per capita, and urbanicity index | NA | ●BMI | NA | ● Distance to the nearest FVMs was negatively associated with the BMI for boys: Q1 (ref), Q2 (β = −2.10; 95% CI, −.3.44 to −0.77), Q3 (β = 0.63; 95% CI, −0.96 to 2.22), and Q4 (β = −0.24; 95% CI, −2.22 to 1.73) |
| ● Straight‐line distance from home to the nearest FVM | ||||||
| ● Density of food establishments | ||||||
| ● Distance to the nearest FVMs was negatively associated with the BMI for girls: Q1 (ref), Q2 (β = −.36; 95% CI, −1.98, 1.27), Q3 (β = .08; 95% CI, −1.38 to 1.55), and Q4 (β = −1.57; 95% CI, −4.03 to 0.90) | ||||||
| Cross‐sectional studies | ||||||
| Bullock (2016) 23 | ● Number of FVMs (farmers' markets) per county | ● Population density | NA | ● Children county‐level obesity prevalence (obtained from the USDA Food Environment Atlas). | NA | No associations were found between obesity rate and the number of farmers' markets (r = −0.00, P = .978), obesity rate and farmers' markets per capita(r = −0.04, P = .671), obesity rate and farmers' markets accepting SNAP/EBT (r = −0.05, P = .656), and obesity rate and farmers' markets accepting SNAP/EBT per capita (r = −0.06, P = .540) |
| ● Number of farmers’ markets per 10,000 persons in home country | ||||||
| Burd (2013) 26 | ● Number of FVMs (farmers' markets) in 0.8‐km home straight‐line buffer | ● Family income, and population density | NA | ● BMI z‐score (based on the 2000 US CDC growth charts) | NA | ● Food environment had association with child BMI z score [F (df) ¼ 4.6 (1,95); P < .05] |
| ● Children in healthy food environments and unhealthy food environments had BMI z scores of 0.8 ± 1.2 and 1.3 ± 1.1, respectively | ||||||
| Corrêa (2017) 27 | ● Presence of FVMs (greengrocers/public markets) in 0.4‐km home straight‐line buffer | ● SES features: income in home census tract, type of school, mother's education level | NA | ● Overweight/obesity (BMI > z score + 1SD, equivalent to a BMI ≥25 kg/m2 at 19 y of age, based on the 2007 WHO growth reference) | NA | ● No association was found between presence of FVMs and overweight/obesity (OR = 0.92; 95% CI, 0.71‐1.19]) |
| ● Presence/absence of restaurant, snack bars/FF outlets, street vendors, supermarkets, minimarkets, butchers, and bakeries | ● A child's family utilizing FVMs was positively associated with overweight/obesity (OR = 1.54; 95% CI, 1.06‐2.24) | |||||
| Jilcott (2011) 28 | ● Number of FVMs (produce stands/farmers’ markets) in 0.4/0.8/1.6/8‐km home straight‐line buffer | ● Rural/urban residence, race, and insurance status | NA | ● BMI percentile (based on the 2000 US CDC growth charts) | NA | ● No correlation was found between proximity to closest farmers' markets and BMI percentile (r = 0.069, P = .059) and between the number of farmers' markets and BMI percentile within 8‐km buffer (r = 0.018, P = .619) |
| ● Straight‐line distance from home to the nearest FVM | ||||||
| ● Inverse associations were found between BMI percentile and coverage of farmers' markets/produce markets within 0.4‐km (r = −0.07, P = .0423) and 0.8‐km (r = −0.11, P = .0036) buffer, or within 0.8‐km (r = −0.08, P = .0308) and 1.6‐km buffers (r = −0.10, P = .0086) | ||||||
| Nogueira (2018) 29 | ● Density of FVMs (street markets) within a 0.5/1.0/1.5‐km home straight‐line buffer | ● Years of residence, health administrative areas, and HDI intramunicipal | Fruit and vegetable consumption. | NA | The density of FVMs was positively association with FV consumption (0.5‐km buffer: street market density = 0 (ref); density = 1 (OR = 1.73; 95% CI, 1.01‐3.00); density ≥ 2 (OR = 0.70; 95% CI, 0.35‐1.42]);1‐km buffer: density ≤ 1 (ref); street market density = 2‐4 (OR = 1.33; 95% CI, 0.70‐2.53]); street market density ≥ 5 (OR = 0.93; 95% CI, 0.41‐2.12]); 1.5‐km buffer: density ≤ 2 (ref); street market density = 3‐7 (OR = 1.97; 95% CI, 0.96‐4.04]); street market density ≥ 8 (OR = 1.51; 95% CI, 0.67‐3.44]) | NA |
| Adequacy of consumption of at least 400 g per day of FV | ||||||
| FV consumption in grams, categorized as <75th percentile or >75th percentile | ||||||
| Park (2013) 22 |
● Density of FVMs (supermarkets, traditional markets, FVMs) in 0.5‐km school straight‐line buffer |
NA | NA | ● BMI based on measured weight and height, Ow/ob and obese (≥85th and ≥95th percentile, respectively, based on the 2007 Korean National Growth Charts) | ● No association was found between high density of FVMs and healthy eating habits (β = −.06, SE = 0.06). | ● Density of FVMs were positively associated with BMI (β = .19; 95% CI, 0.04‐0.34), but no association with overweight/obese (OR = 1.05; 95% CI, 0.87‐1.27]), and obese (OR = 1.37; 95% CI, 1.12‐1.54) |
| Tang (2014) 30 | ● Presence of FVMs (small grocery stores) in 0.4‐km school road‐network buffer | ● Number of convenience stores, limited‐service restaurants, and supermarkets | NA |
● BMI z score (based on the 2000 US CDC growth charts) ● Overweight/obese (≥85th percentile based on 2000 US CDC growth charts) |
NA |
● Presence of FVMs was negatively associated with BMI Z‐scores (β = .12; 95% CI, −0.24 to −0.01), but was not with overweight/obese (β = −.02; 95% CI, −0.06 to 0.02) |
| ● Number of FVMs within a 0.4‐km school road‐network buffer | ||||||
| ● Number of FVMs was associated with BMI z scores (β = −.10; 95% CI, −0.17 to −0.03]) but was not with overweight/obese (β = −.004, 95% CI, −0.03 to 0.02) | ||||||
| Timperio (2008) 31 | ● Presence of FVMs (fruit, and vegetables grocers) in 0.8‐km home road‐network buffer | ● Maternal education | ● Frequency of FV consumption (collected by parents' answered) | NA | No association was found between FV intake and presence or number of FVMs; no association was found between FV intake and straight‐line distance from home to the nearest FVMs | NA |
| ● Potential clustering by school | ||||||
| ● Fruit ≥2 times/d or vegetables ≥3 times/d | ||||||
| ● Number of FVMs in 0.8‐km home road‐network buffer | ||||||
| ● Straight‐line distance from home to the nearest FVM | ||||||
| Ecological study | ||||||
| Dwicaksono (2017) 21 | ● Density of FVMs (farmers' market) in 1.6‐km school road‐network buffer | ● Poverty, racial and ethnic composition, urbanicity | NA | ● Obesity rate (≥95th percentile) | NA | ● Density of FVMs was negatively associated with lower obesity rates (β = −.116, SE = 0.0027, P < .01) |
Abbreviations: BMI, body mass index; CDC, Center for Disease Control and Prevention; CI, confidence interval; GIS, Geographic Information Systems; FV, fruit/vegetable; FVM, fruit/vegetable markets; OR, odd ratio; SES, socio‐economic status; SNAP/EBT, Supplemental Nutrition Assistance Program/Electronic Benefit Transfer; WHO, World Health Organization; WHZ, weight‐for‐height z score; Straight‐line buffer, a regular (eg, circular) zone with a certain radius around a given address/location or a street to represent a catchment or influential area of that address/location or street; road‐network buffer, an irregular zone around a given address/location, where it covers the same distance (or takes the same time) to travel from any point on the boundary of the zone to that address/location along the shortest road network path.
A variety of indicators were used to measure weight‐related behaviours and outcomes. Two studies used fruit and vegetable consumption. 29 , 31 Children's and adolescents' body‐weight status was assessed by overweight or obesity in six studies, 10 , 21 , 22 , 23 , 27 , 30 by BMI z score in three studies, 10 , 26 , 30 by BMI in two studies, 22 , 32 and by BMI percentile in one study. 28
3.3. Associations between FVM access and weight‐related behaviours/outcomes
Three studies reported an association between FVM access and weight‐related behaviours. 22 , 29 , 31 Two studies, conducted in South Korea 22 and Australia, 31 did not find a significant association with healthy eating habits, where FVM access was measured as the density of FVMs within a 0.5‐km radius straight‐line buffer around schools and the presence of FVMs within a 0.8‐km road‐network buffer around homes, respectively. Another study in Brazil showed that the presence of FVMs within a 0.5‐km radius straight‐line buffer around homes was associated with higher consumption of fruit and vegetables (OR = 1.73; 95% CI, 1.01‐3.00). 29
Nine studies investigated the association between FVM access and weight‐related outcomes. Three of these did not observe a significant association, 10 , 23 , 27 where the weight‐related outcome was described as overweight/obese (FVM access was measured as the presence of FVMs within a 0.4‐km radius straight‐line buffer around home), 27 county‐level obesity rate (FVM access as the density of farmer's markets), 23 and change in the BMI z score and overweight/obese (FVM access as the presence of FVMs within 0.4‐/1.6‐km radii road‐network buffer around homes). 10 Three studies reported a negative association between the distance to the nearest FVM and BMI, 32 between the density of FVMs within a 1.6‐km road‐network buffer around schools and obesity, 21 and between the number of FVMs within a 0.8‐km radius straight‐line buffer around homes and BMI z scores. 26 One study reported that the presence of FVMs within a 0.4‐km road‐network buffer around homes was negatively associated with BMI z scores but not with overweight/obese. 30 Another study revealed an inverse association between BMI percentiles and the coverage of FVMs within 0.4‐/0.8‐/1.6‐km radii straight‐line buffer around homes but not with the proximity to the nearest FVM and the number of FVMs within a 8‐km road‐network buffer around homes. 28 Only one study reported a positive association between the density of FVMs and BMI (β = .19; 95% CI, 0.04‐0.34) and obesity (OR = 1.37; 95% CI, 1.12‐1.54), while no association was reported between the density of FVMs within a 0.5‐km radius straight‐line buffer around schools and overweight/obese. 22
3.4. Study quality assessment
Table S1 reports criterion‐specific and global ratings from the study quality assessment. The eleven studies were scored 8.82 out of 11 on average, with a range from 5 to 12.
4. DISCUSSION
This is the first systematic review of the association between access to FVMs and the risk for childhood obesity. Some previous studies have reviewed the association between access to some commonly studied food outlets and childhood obesity, such as supermarkets, 33 convenience stores, 34 full‐service restaurants, 35 and fast‐food restaurants. 36 However, studies on the association between FVM access and childhood obesity have not yet been systematically reviewed. We found that, although some studies reported negative associations between FVM access and the consumption of fruit and vegetables, 37 , 38 , 39 , 40 there was not a conclusive association between FVM access and overweight or obesity among children and adolescents, on the basis of the current literature.
Access to certain types of food stores has been widely considered to contribute to childhood obesity, 41 , 42 as children do not always have significant control over their food choices during the transition to adolescence. However, there is no consensus regarding the access to food measure. Children and adolescents do not have unfettered access to private motorized travel, so a network buffer with a 0.8‐km radius may better reflect a walkable distance for children, 43 and they are more likely to be exposed to or become aware of available FVMs on their way home or to school. Long‐lasting exposure to healthy foods increases the visibility of those foods, 44 and as a result, children living in such environments may be more likely to accept and prefer healthy foods. However, results on the association between access to FVMs and childhood obesity are generally inconsistent. For example, six studies in the systematic review reported no association between FVM access and risk for overweight or obesity, 10 , 22 , 23 , 27 , 30 five reported a negative association, 21 , 26 , 28 , 30 , 32 and only one reported a positive association. 22 Possible explanations include (a) access to fruit and vegetables is ubiquitous, and food shoppers are mobile, so measuring the density of FVMs and/or the distance to the nearest FVM in the neighbourhood may not reflect the actual accessibility of such healthy foods; and (b) other factors related to obesity in and food purchase choices by children may be not be considered in the analyses, such as cultural factors, mobility, and access to public transportation.
Although some studies reported a significant association between food environments and dietary behaviours and thus obesity, a critical pathway is purchasing behaviours. Children may eat meals at home and/or school, and they may not make the food purchase choices as often by themselves as do adults. 45 , 46 Thus, the fresh fruit and vegetable environment around children's homes/schools may not affect their dietary behaviours and weight status. Instead, adolescents may be more likely to make food purchase choices. However, the data from all the included studies are insufficient to enable a good‐quality meta‐analysis for evaluating the association between FVM access and dietary behaviours and weight status. Another reason for not being able to conduct meta‐analyses is a variety of definitions for dietary behaviours, even for weight‐related outcomes.
The present study has several limitations. First, FVM was not examined as an independent factor in most included studies. Many studies evaluated the influence on weight‐related behaviours and outcomes of FVMs together with other types of food venues (eg, supermarkets) as one category. This may amplify or weaken the association detected, as supermarkets provide both fruit/vegetables and energy‐dense and low‐nutrient—ie, unhealthy—foods. To construct latent diet factors on the basis of intake categories of foods typically offered at each type of food outlets should be considered in future research. 47 , 48 Second, FVM as a category was termed differently across studies, such as “greengrocer,” “farmers' market,” “street market,” “free market,” and “healthy food outlets.” This has reduced the comparability among studies. This could happen because of low‐quality reporting in studies or just different cultures or business registration systems (ie, points of interest) across countries/regions. Future studies should provide clearer definitions of FVM in their specific contexts, and this suggestion also applies to research on other types of food environments (eg, convenience stores). Third, FVM access was also defined differently across studies, for example, by using different buffer types (ie, straight‐line and road‐network) and/or radii and measuring the proximity to FVM from different destinations (eg, home and school). This further contributes to difficulties in comparing different studies, and a reporting guideline is needed to guide more multiscale studies or more comprehensive sensitivity tests in one study. 49 , 50 Also, more spatial analysis methods should be used to examine FVM access, on the basis of the limited FVM data. 51 , 52 Fourth, we only included studies written in English, and consequently, some relevant studies published in other languages may have been neglected. Lastly, more longitudinal studies that spatially and temporally match business registration data to diet, nutrition, and health survey data should be conducted to strengthen the causality of the association. 53
This study has important implications for future research and practice. First, given the differently termed FVMs and independently estimated FVM variables in most of the included studies, further studies should provide clearer and more standardized definitions of FVMs to more effectively evaluate the effect of FVMs on child obesity. Second, the food environment is one of the most important social determinants for child obesity and influences health and obesity disparities. Our study did not find a significant association between the accessibility of FVMs and weight‐related outcomes in children and adolescents, which may be the result of the small number of relevant studies and low sample size. Therefore, further research should be carried out to understand the impact of the accessibility and availability of FVMs on childhood obesity.
5. CONCLUSIONS
This systematic review revealed no relationship between the availability and accessibility of FVMs and weight‐related behaviours and outcomes among children and adolescents. Nonetheless, the findings have important methodological implications for future research and practice. It can guide researchers in several relevant fields to collaborate on designing more spatial longitudinal studies in order to generate more high‐quality research findings and, subsequently, evidence‐based policies for building healthy and sustainable cities.
CONFLICT OF INTEREST
We declare no conflicts of interest.
Supporting information
Data S1.
Supporting Information
Table S1.
Study quality assessment using the National Institutes of Health's Quality Assessment Tool for observational cohort and cross‐sectional studies
ACKNOWLEDGEMENTS
We thank the International Institute of Spatial Lifecourse Epidemiology (ISLE) and the National Natural Science Foundation of China (81703279) for research support. Guo Cheng, Director of the Healthy Food Evaluation Research Center, thanks the research grant from the New Century Excellent Talents in University Program (NCET‐12‐0377) and Sichuan Outstanding Young Scholars Foundation (2014JQ0005). [Correction added on 8 February 2021, after first online publication: Acknowledgements have been revised.]
Yang S, Zhang X, Feng P, et al. Access to fruit and vegetable markets and childhood obesity: A systematic review. Obesity Reviews. 2021;22(S1):e12980. 10.1111/obr.12980
[Correction added on 8 February 2021, after first online publication: (1) Peng Jia's affiliations have been updated; (2) Funding Information has been revised.]
Contributor Information
Guo Cheng, Email: gcheng@scu.edu.cn.
Peng Jia, Email: jiapengff@hotmail.com.
REFERENCES
- 1. Roberto CA, Swinburn B, Hawkes C, et al. Patchy progress on obesity prevention: emerging examples, entrenched barriers, and new thinking. Lancet. 2015;385(9985):2400‐2409. [DOI] [PubMed] [Google Scholar]
- 2. Dietz WH. Periods of risk in childhood for the development of adult obesity—what do we need to learn? J Nutr. 1997;127(9):1884s‐1886s. [DOI] [PubMed] [Google Scholar]
- 3. Singh AS, Mulder C, Twisk JWR, van Mechelen W, Chinapaw MJM. Tracking of childhood overweight into adulthood: a systematic review of the literature. Obes Rev. 2008;9(5):474‐488. [DOI] [PubMed] [Google Scholar]
- 4. Ng M, Fleming T, Robinson M, et al. Global, regional, and national prevalence of overweight and obesity in children and adults during 1980‐2013: a systematic analysis for the Global Burden of Disease Study 2013. Lancet. 2014;384(9945):766‐781. [DOI] [PMC free article] [PubMed] [Google Scholar]
- 5. Ezzati M, Bentham J, Di Cesare M, et al. Worldwide trends in body‐mass index, underweight, overweight, and obesity from 1975 to 2016: a pooled analysis of 2416 population‐based measurement studies in 128.9 million children, adolescents, and adults. Lancet. 2017;390(10113):2627‐2642. [DOI] [PMC free article] [PubMed] [Google Scholar]
- 6. Kelsey MM, Zaepfel A, Bjornstad P, Nadeau KJ. Age‐related consequences of childhood obesity. Gerontology. 2014;60(3):222‐228. [DOI] [PubMed] [Google Scholar]
- 7. World Health Organization . Consideration of the evidence on childhood obesity for the Commission on Ending Childhood Obesity: report of the Ad hoc Working Group on Science and Evidence for Ending Childhood Obesity. Geneva: World Health Organization; 2016. [Google Scholar]
- 8. Caird J, Kavanagh J, O'Mara‐Eves A, et al. Does being overweight impede academic attainment? A systematic review. Health Educ J. 2014;73(5):497‐521. [Google Scholar]
- 9. Quek YH, Tam WWS, Zhang MWB, Ho RCM. Exploring the association between childhood and adolescent obesity and depression: a meta‐analysis. Obes Rev. 2017;18(7):742‐754. [DOI] [PubMed] [Google Scholar]
- 10. Leung CW, Laraia BA, Kelly M, et al. The influence of neighborhood food stores on change in young girls' body mass index. Am J Prev Med. 2011;41(1):43‐51. [DOI] [PMC free article] [PubMed] [Google Scholar]
- 11. Wang MC, Gonzalez AA, Ritchie LD, Winkleby MA. The neighborhood food environment: sources of historical data on retail food stores. Int J Behav Nutr Phys Act. 2006;3:15. [DOI] [PMC free article] [PubMed] [Google Scholar]
- 12. Morland K, Wing S, Diez RA. The contextual effect of the local food environment on residents' diets: the atherosclerosis risk in communities study. Am J Public Health. 2002;92(11):1761‐1767. [DOI] [PMC free article] [PubMed] [Google Scholar]
- 13. Jia P, Xue H, Cheng X, Wang Y. Effects of school neighborhood food environments on childhood obesity at multiple scales: a longitudinal kindergarten cohort study in the USA. BMC Med. 2019;17(1):99. [DOI] [PMC free article] [PubMed] [Google Scholar]
- 14. Tetens I, Alinia S. The role of fruit consumption in the prevention of obesity. J Hortic Sci Biotech. 2009;86(6):47‐51. [Google Scholar]
- 15. Ello‐Martin JA, Roe LS, Ledikwe JH, Beach AM, Rolls BJ. Dietary energy density in the treatment of obesity: a year‐long trial comparing 2 weight‐loss diets. Am J Clin Nutr. 2007;85(6):1465‐1477. [DOI] [PMC free article] [PubMed] [Google Scholar]
- 16. Kraak VI, Vandevijvere S, Sacks G, et al. Progress achieved in restricting the marketing of high‐fat, sugary and salty food and beverage products to children. Bull World Health Organ. 2016;94(7):540‐548. [DOI] [PMC free article] [PubMed] [Google Scholar]
- 17. World Health Organization . Fruit and vegetables for health: report of a Joint FAO/WHO Workshop, 1‐3 September, 2004. Kobe, Japan: World Health Organization; 2005. [Google Scholar]
- 18. Baker‐Ipek R. Preventing childhood obesity. J Youth Adolesc. 2013;42(1):151‐153. [Google Scholar]
- 19. Wingert K, Zachary DA, Fox M, Gittelsohn J, Surkan PJ. Child as change agent. The potential of children to increase healthy food purchasing. Appetite. 2014;81:330‐336. [DOI] [PubMed] [Google Scholar]
- 20. Larson NI, Story MT, Nelson MC. Neighborhood environments: disparities in access to healthy foods in the U.S. Am J Prev Med. 2009;36(1):74‐81. [DOI] [PubMed] [Google Scholar]
- 21. Dwicaksono A, Brissette I, Birkhead GS, Bozlak CT, Martin EG. Evaluating the contribution of the built environment on obesity among New York State students. Health Educ Behav. 2018;45(4):480‐491. [DOI] [PubMed] [Google Scholar]
- 22. Park S, Choi BY, Wang Y, Colantuoni E, Gittelsohn J. School and neighborhood nutrition environment and their association with students' nutrition behaviors and weight status in Seoul, South Korea. J Adolesc Health. 2013;53(5):655‐662. [DOI] [PubMed] [Google Scholar]
- 23. Bullock SL, Pitts SBJ, Listenfelt B, et al. Availability of farmers' markets and Supplemental Nutrition Assistance Program/Electronic Benefit Transfer systems and Associations With Rurality, Poverty, Race/Ethnicity, and Obesity among North Carolina Counties. J Hunger Environ Nutr. 2016;11(1):102‐121. [Google Scholar]
- 24. Moher D. Preferred reporting items for systematic reviews and meta‐analyses: the PRISMA statement. Int J Surg. 2010;8(5):336‐341. [DOI] [PubMed] [Google Scholar]
- 25. Higgins JPT, Altman DG, Gøtzsche PC, et al. The Cochrane Collaboration's tool for assessing risk of bias in randomized trials. BMJ Open. 2011;343:d5928. [DOI] [PMC free article] [PubMed] [Google Scholar]
- 26. Burd C, Senerat A, Chambers E, Keller KL. PROP taster status interacts with the built environment to influence children's food acceptance and body weight status. Obesity (Silver Spring). 2013;21(4):786‐794. [DOI] [PMC free article] [PubMed] [Google Scholar]
- 27. Corrêa EN, Rossi CE, das NJ , Silva DAS, de Vasconcelos FAG. Utilization and environmental availability of food outlets and overweight/obesity among schoolchildren in a city in the south of Brazil. J Public Health (Oxf). 2018;40(1):106‐113. [DOI] [PubMed] [Google Scholar]
- 28. Jilcott SB, Wade S, McGuirt JT, Wu Q, Lazorick S, Moore JB. The association between the food environment and weight status among eastern North Carolina youth. Public Health Nutr. 2011;14(9):1610‐1617. [DOI] [PubMed] [Google Scholar]
- 29. Nogueira LR, Fontanelli MM, Aguiar BS, et al. Access to street markets and consumption of fruits and vegetables by adolescents living in São Paulo, Brazil. Int J Environ Res Public Health. 2018;15(3):E517. [DOI] [PMC free article] [PubMed] [Google Scholar]
- 30. Tang X, Ohri‐Vachaspati P, Abbott JK, et al. Associations between food environment around schools and professionally measured weight status for middle and high school students. Child Obes. 2014;10(6):511‐517. [DOI] [PMC free article] [PubMed] [Google Scholar]
- 31. Timperio A, Ball K, Roberts R, Campbell K, Andrianopoulos N, Crawford D. Children's fruit and vegetable intake: associations with the neighbourhood food environment. Prev Med. 2008;46(4):331‐335. [DOI] [PubMed] [Google Scholar]
- 32. Zhang J, Xue H, Cheng X, et al. Influence of proximities to food establishments on body mass index among children in China. Asia Pac J Clin Nutr. 2016;25(1):134‐141. [DOI] [PMC free article] [PubMed] [Google Scholar]
- 33. Zhou Q, Zhao L, Zhang L, et al. Neighborhood supermarket access and childhood obesity: A systematic review. Obes Rev. 2021;22(Suppl 1):e12937. [DOI] [PMC free article] [PubMed] [Google Scholar]
- 34. Xin J, Zhao L, Wu T, et al. Association between access to convenience stores and childhood obesity: A systematic review. Obes Rev. 2021;22(Suppl 1):e12908. [DOI] [PMC free article] [PubMed] [Google Scholar]
- 35. Jia P, Cheng X, Xue H, Wang Y. Applications of geographic information systems (GIS) data and methods in obesity‐related research. Obes Rev. 2017;18(4):400‐411. [DOI] [PubMed] [Google Scholar]
- 36. Jia P, Luo M, Li Y, Zheng JS, Xiao Q, Luo J. Fast‐food restaurant, unhealthy eating, and childhood obesity: a systematic review and meta‐analysis. Obes Rev. 2021;22(Suppl 1):e12944. [DOI] [PMC free article] [PubMed] [Google Scholar]
- 37. He M, Tucker P, Gilliland J, Irwin JD, Larsen K, Hess P. The influence of local food environments on adolescents' food purchasing behaviors. Int J Environ Res Public Health. 2012;9(4):1458‐1471. [DOI] [PMC free article] [PubMed] [Google Scholar]
- 38. Berge JM, Wall M, Larson N, Forsyth A, Bauer KW, Neumark‐Sztainer D. Youth dietary intake and weight status: healthful neighborhood food environments enhance the protective role of supportive family home environments. Health Place. 2014;26:69‐77. [DOI] [PMC free article] [PubMed] [Google Scholar]
- 39. Hearst MO, Pasch KE, Laska MN. Urban v. suburban perceptions of the neighbourhood food environment as correlates of adolescent food purchasing. Public Health Nutr. 2012;15(2):299‐306. [DOI] [PMC free article] [PubMed] [Google Scholar]
- 40. Laska MN, Hearst MO, Forsyth A, Pasch KE, Lytle L. Neighbourhood food environments: are they associated with adolescent dietary intake, food purchases and weight status. Public Health Nutr. 2010;13(11):1757‐1763. [DOI] [PMC free article] [PubMed] [Google Scholar]
- 41. Timperio A, Crawford D, Leech RM, Lamb KE, Ball K. Patterning of neighbourhood food outlets and longitudinal associations with children's eating behaviours. Prev Med. 2018;111:248‐253. [DOI] [PubMed] [Google Scholar]
- 42. Rahmanian E, Gasevic D, Vukmirovich I, Lear SA. The association between the built environment and dietary intake—a systematic review. Asia Pac J Clin Nutr. 2014;23(2):183‐196. [DOI] [PubMed] [Google Scholar]
- 43. Timperio A, Crawford D, Telford A, Salmon J. Perceptions about the local neighborhood and walking and cycling among children. Prev Med. 2004;38(1):39‐47. [DOI] [PubMed] [Google Scholar]
- 44. Birch LL, Fisher JO. Development of eating behaviors among children and adolescents. Pediatrics. 1998;101:1‐49. [PubMed] [Google Scholar]
- 45. Morland K, Wing S, Diez Roux A, Poole C. Neighborhood characteristics associated with the location of food stores and food service places. Am J Prev Med. 2002;22(1):23‐29. [DOI] [PubMed] [Google Scholar]
- 46. Turrell G, Blakely T, Patterson C, Oldenburg B. A multilevel analysis of socioeconomic (small area) differences in household food purchasing behaviour. J Epidemiol Community Health. 2004;58(3):208‐215. [DOI] [PMC free article] [PubMed] [Google Scholar]
- 47. Wang Y, Jia P, Cheng X, Xue H. Improvement in food environments may help prevent childhood obesity: evidence from a 9‐year cohort study. Pediatr Obes. 2019;14(10):e12536. [DOI] [PMC free article] [PubMed] [Google Scholar]
- 48. Richardson AS, Meyer KA, Howard AG, et al. Multiple pathways from the neighborhood food environment to increased body mass index through dietary behaviors: a structural equation‐based analysis in the CARDIA study. Health Place. 2015;36:74‐87. [DOI] [PMC free article] [PubMed] [Google Scholar]
- 49. Jia P, Xue H, Yin L, Stein A, Wang M, Wang Y. Spatial Technologies in obesity research: current applications and future promise. Trends Endocrinol Metab. 2019;30(3):211‐223. [DOI] [PubMed] [Google Scholar]
- 50. Jia P, Yu C, Remais J. V, Stein A, Liu Y, Brownson R. C, … & Amer S. Spatial Lifecourse Epidemiology Reporting Standards (ISLE‐ReSt) statement. Health & Place 102243. [DOI] [PMC free article] [PubMed] [Google Scholar]
- 51. Jia P, Anderson JD, Leitner M, Rheingans R. High‐resolution spatial distribution and estimation of access to improved sanitation in Kenya. PLoS ONE. 2016;11(7):e0158490. [DOI] [PMC free article] [PubMed] [Google Scholar]
- 52. Charreire H, Casey R, Salze P, et al. Measuring the food environment using geographical information systems: a methodological review. Public Health Nutr. 2010;13(11):1773‐1785. [DOI] [PubMed] [Google Scholar]
- 53. Jia P. Spatial lifecourse epidemiology. Lancet Planet Health. 2019;3(1):e57‐e59. [DOI] [PubMed] [Google Scholar]
Associated Data
This section collects any data citations, data availability statements, or supplementary materials included in this article.
Supplementary Materials
Data S1.
Supporting Information
Table S1.
Study quality assessment using the National Institutes of Health's Quality Assessment Tool for observational cohort and cross‐sectional studies