

Abstract
The deep population history of East Asia remains poorly understood due to a lack of ancient DNA data and sparse sampling of present-day people1,2. We report genome-wide data from 166 East Asians dating to 6000 BCE – 1000 CE and 46 present-day groups. Hunter-gatherers from Japan, the Amur River Basin, and people of Neolithic and Iron Age Taiwan and the Tibetan plateau are linked by a deeply-splitting lineage likely reflecting a Late Pleistocene coastal migration. We follow Holocene expansions from four regions. First, hunter-gatherers of Mongolia and the Amur River Basin have ancestry shared by Mongolic and Tungusic language speakers but do not carry West Liao River farmer ancestry contradicting theories that their expansion spread these proto-languages. Second, Yellow River Basin farmers at ~3000 BCE likely spread Sino-Tibetan languages as their ancestry dispersed both to Tibet where it forms up ~84% to some groups and to the Central Plain where it contributed ~59–84% to Han Chinese. Third, people from Taiwan ~1300 BCE to 800 CE derived ~75% ancestry from a lineage also common in modern Austronesian, Tai-Kadai and Austroasiatic speakers likely deriving from Yangtze River Valley farmers; ancient Taiwan people also derived ~25% ancestry from a northern lineage related to but different from Yellow River farmers implying an additional north-to-south expansion. Fourth, Yamnaya Steppe pastoralist ancestry arrived in western Mongolia after ~3000 BCE but was displaced by previously established lineages even while it persisted in western China as expected if it spread the ancestor of Tocharian Indo-European languages. Two later gene flows affected western Mongolia: after ~2000 BCE migrants with Yamnaya and European farmer ancestry, and episodic impacts of later groups with ancestry from Turan.
East Asia was one of the earliest centres of animal and plant domestication, and harbours an extraordinary diversity of language families including Sino-Tibetan, Tai-Kadai, Austronesian, Austroasiatic, Hmong-Mien, Indo-European, Mongolic, Turkic, Tungusic, Koreanic, Japonic, Yukaghiric, and Chukotko-Kamchatkan1. Current understanding of human population history in the region remains poor due to minimal sampling of genetic diversity of present-day people on the Tibetan Plateau and southern China2, and a paucity of ancient DNA data compared to West Eurasia3–6.
We collected DNA from 383 people from 46 populations from China (n=337) and Nepal (n=46) who provided informed consent for broad studies of population history; we carried out community consultation with minority group leaders as an integral part of the consent process (see Ethics Statement). We genotyped DNA using the Affymetrix Human Origins array at about 600,000 single nucleotide polymorphisms (SNPs) (Extended Data Table 1 and Supplementary Information section 1).
For ancient individuals, we obtained permission for analysis from sample custodians, following protocols to minimize damage to skeletal material and including members of local minority groups as part of our study team when there was a plausible cultural connection between modern communities and ancient individuals (Ethics Statement). We prepared powder from bones and teeth, extracted DNA, and prepared double or single-stranded libraries for sequencing on Illumina instruments (Methods). For most samples we enriched the DNA for a set of about 1.2 million SNPs3,7; for the Chinese samples we used exome enrichment (Supplementary Information section 1) (Methods, Online Table 1). We sequenced the DNA, and processed the data using one of two nearly identical bioinformatic procedures (Methods, Online Table 2) that we found gave indistinguishable results from the perspective of analyses of population history (Online Table 3). We considered samples to fail screening if they had fewer than 5000 of the targeted SNPs covered at least once; if they had a too-low rate of cytosine to thymine substitution in the terminal nucleotide; or if they had evidence of major contamination based on polymorphism in mitochondrial DNA sequences8 or the X chromosome in males9 or a ratio of Y to X chromosome unexpected for a male or female (Online Table 1, Online Table 2). We newly report data from 166 individuals (Figure 1, Online Table 1): from Mongolia 82 between ~5700 BCE to ~1400 CE, from China 11 at a ~3000 BCE site in the Yellow River Basin, from Japan 7 Jomon hunter-gatherers dating to ~2500–800 BCE, from the Russian Far East 18 individuals at the Boisman-2 cemetery at ~5400–3600 BCE as well as an individual at ~900 BCE and another at ~1100 CE, and from two sites in Taiwan 46 individuals spanning ~1300 BCE - 800 CE (Online Table 1). For analysis we focused on 130 individuals after excluding 16 with evidence of low but non-zero contamination, 10 with 5000–15000 SNPs covered, and 11 that are close relatives of another higher coverage individual in the dataset (Extended Data Table 2). We merged with published data: 1079 ancient individuals reported in 30 publications (Online Table 4A), and 3265 present-day individuals reported in 16 publications (Online Table 4B). We grouped individuals by geography, time (aided by 108 newly reported direct dates; Online Table 5), archaeological context, and finally genetic cluster (Online Table 1).
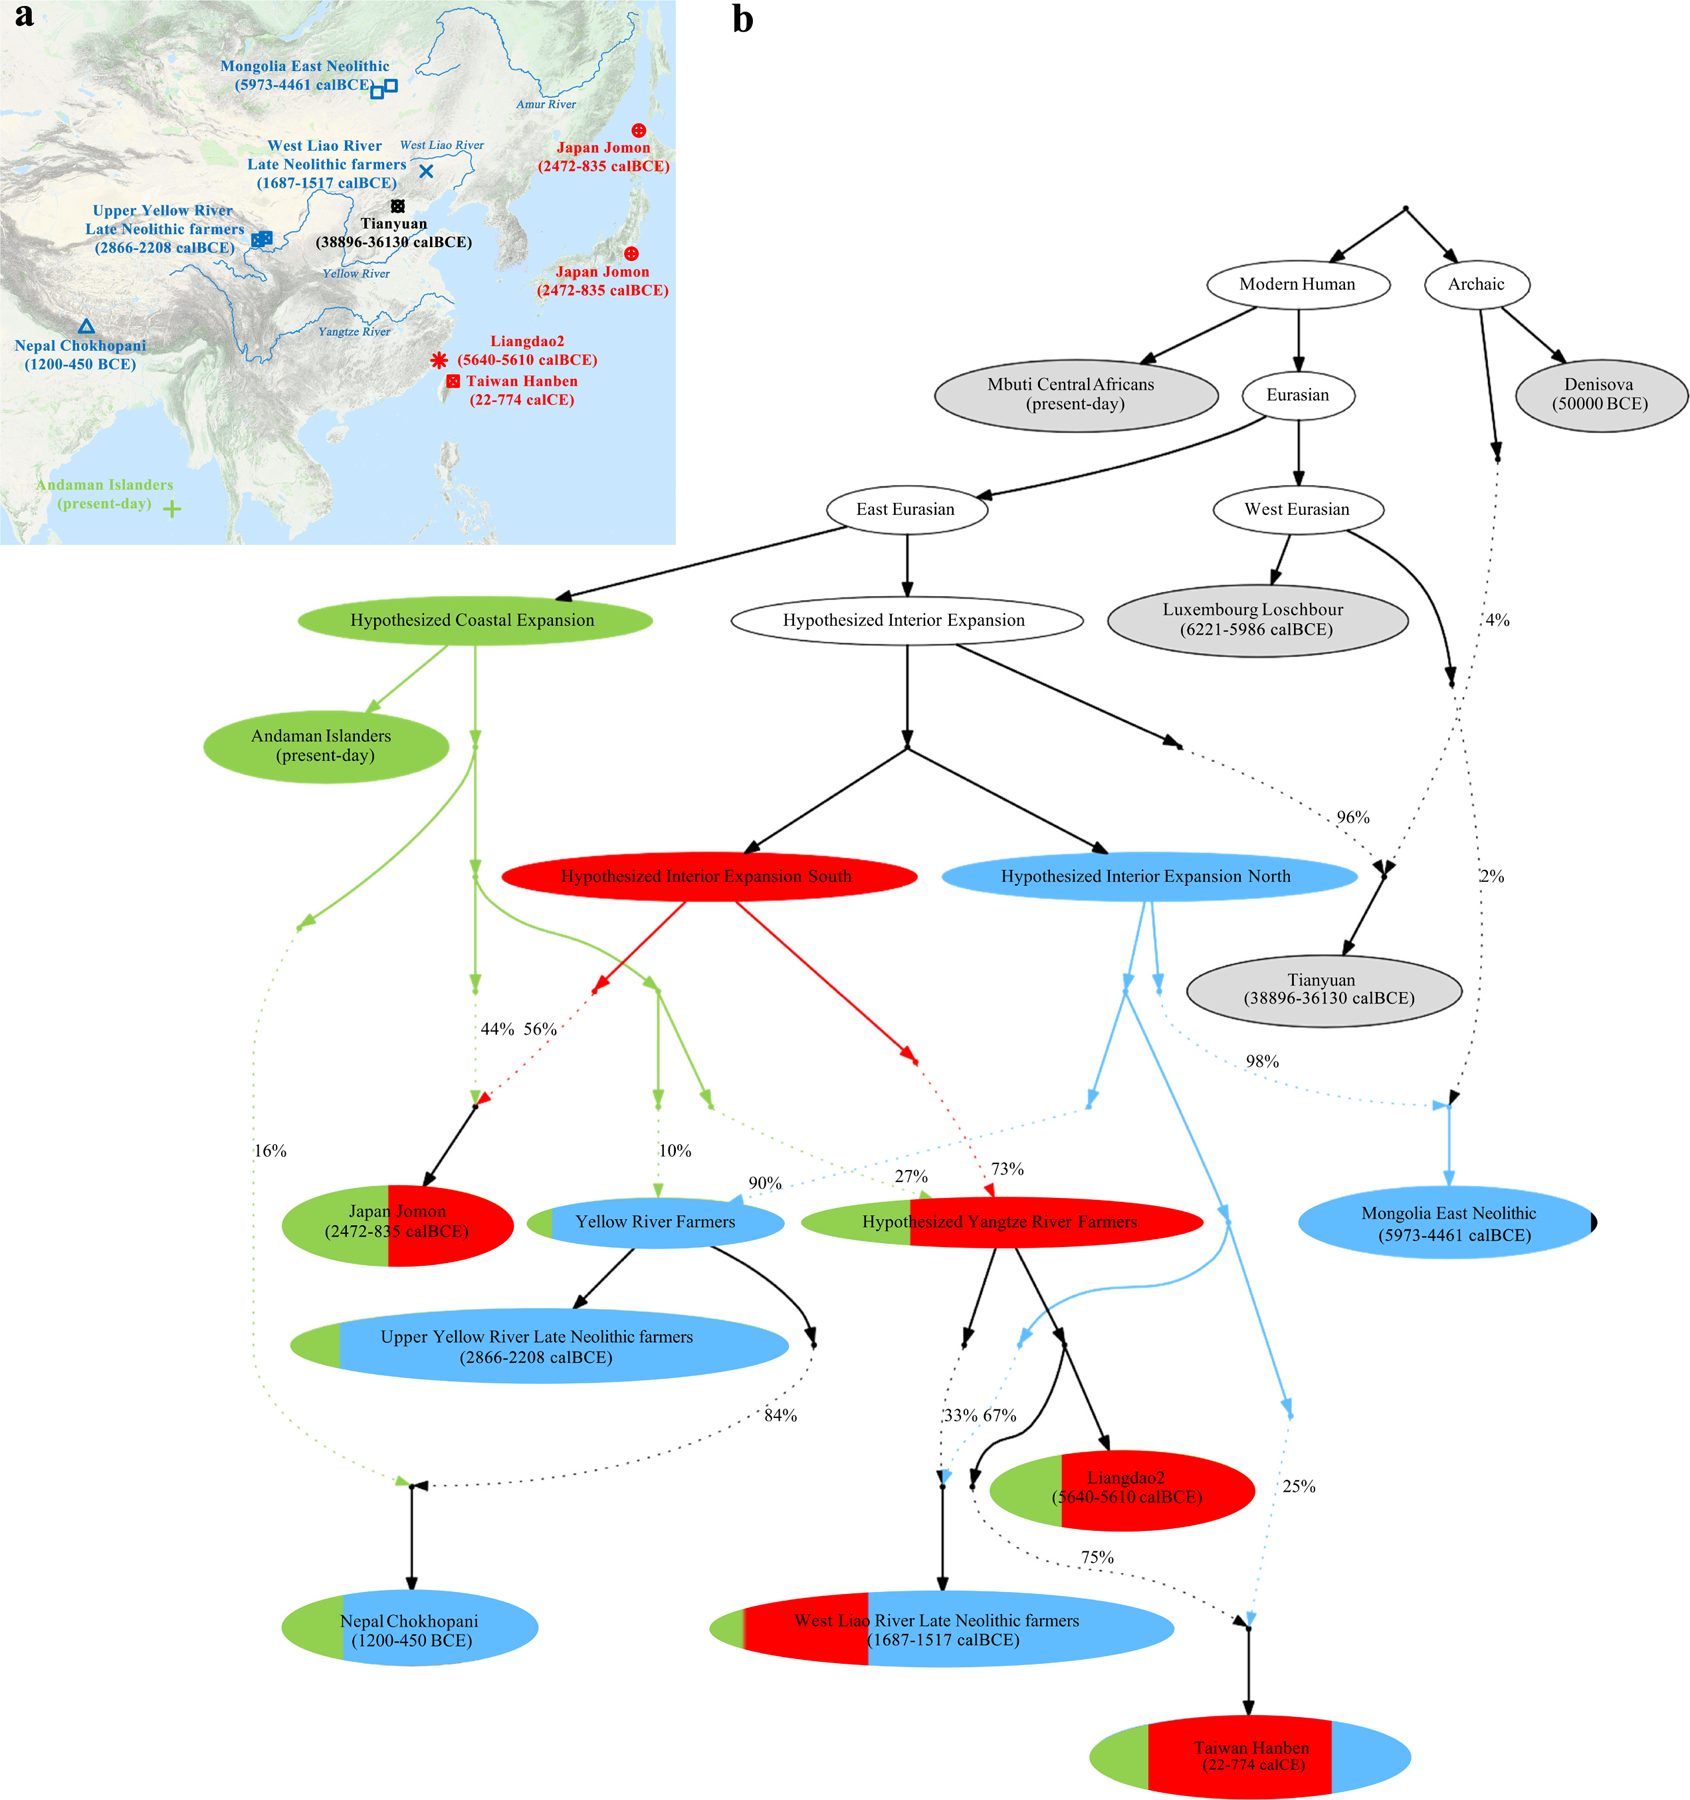
Figure 1: Overview.
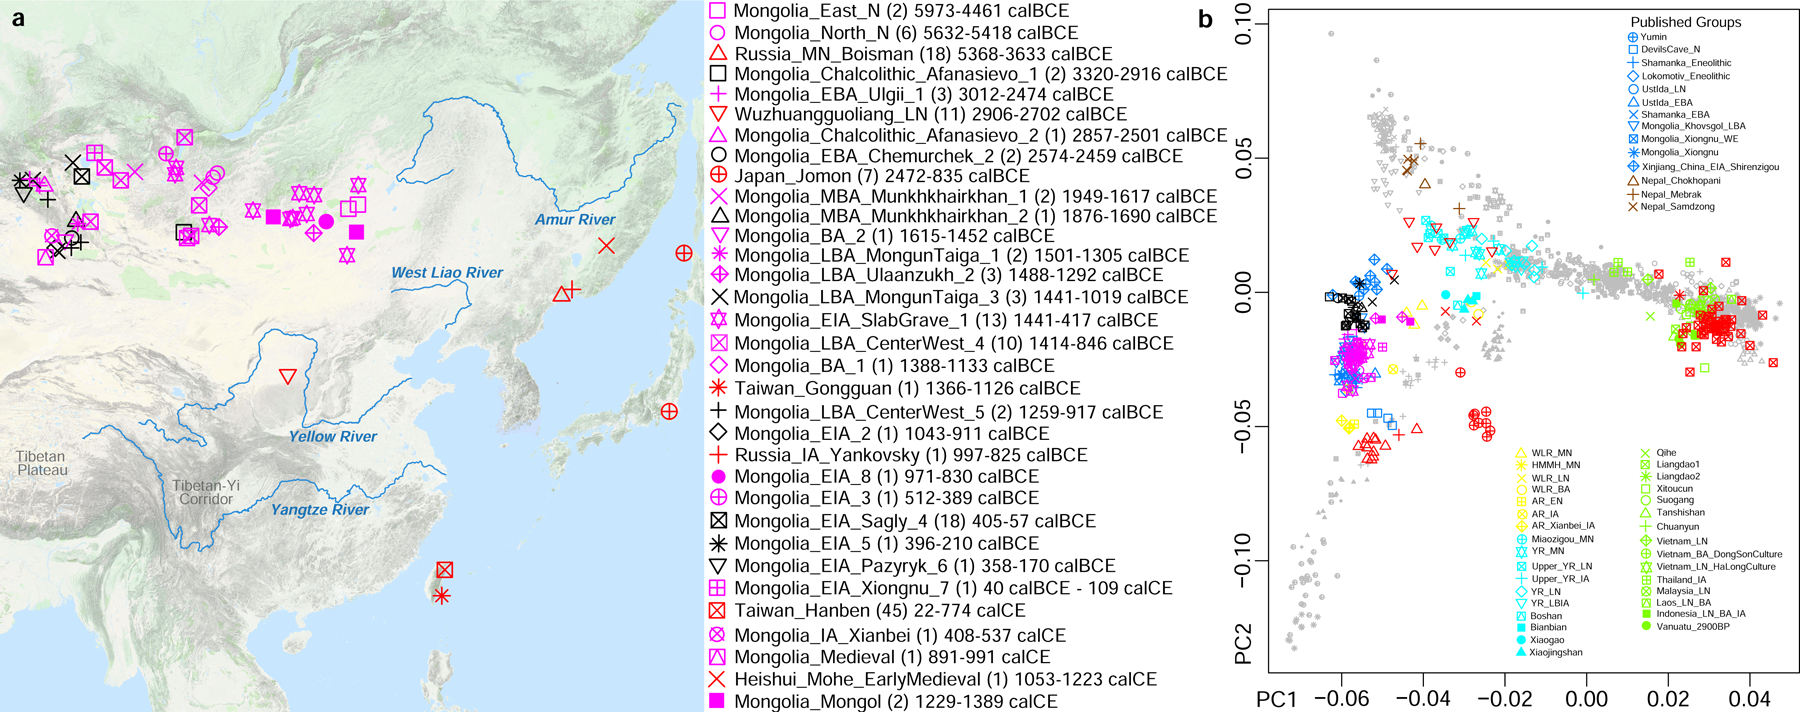
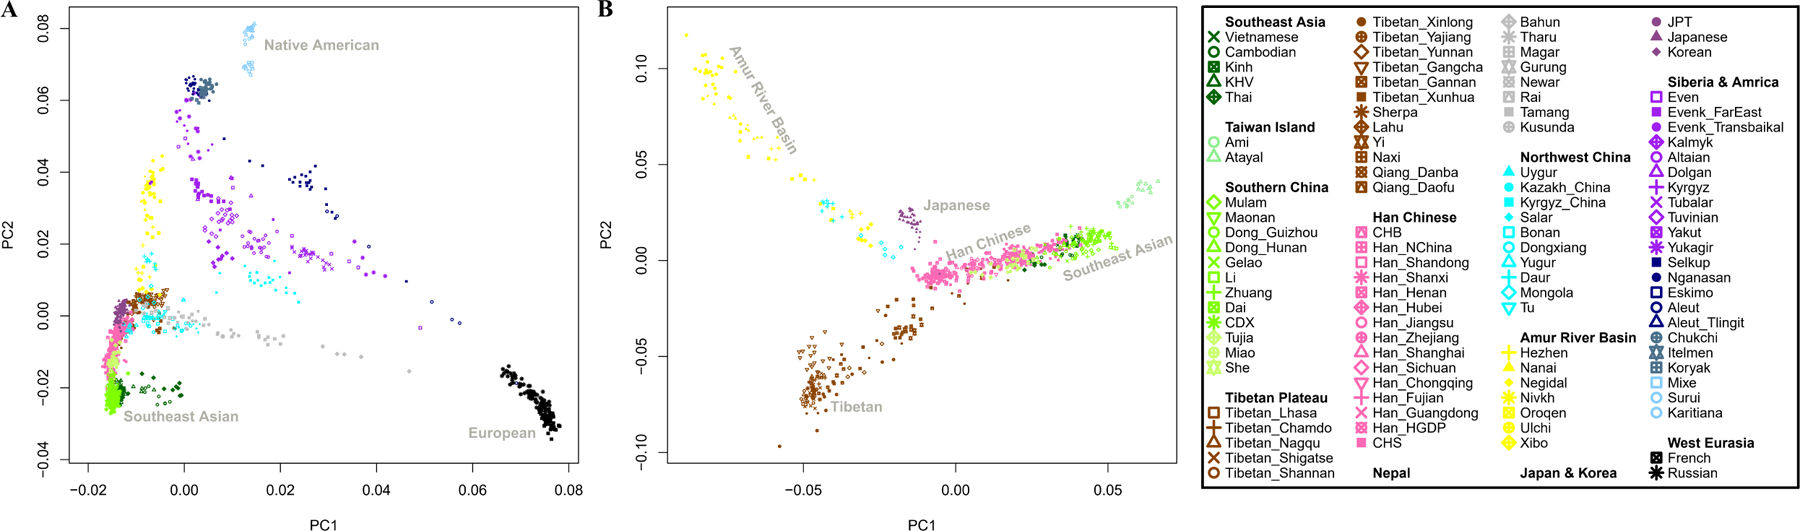
(a) Locations, sample size (in brackets) and temporal distribution of newly reported ancient individuals, plotted using the “Google Map Layer” from ArcGIS Online Basemaps (Map data ©2020 Google). (b) Plot of first and second Principal Components defined in an analysis of East Asians with minimal West Eurasian-related mixture.
We carried out Principal Component Analysis (PCA)10, projecting ancient individuals onto axes computed using present-day people. Population structure is correlated with geography (R2=0.261; P<0.0001) and language (R2= 0.087; P<0.0001) (Online Table 6), with exceptions. Groups in Northwest China, Nepal, and Siberia deviate toward West Eurasians (Supplementary Information section 2), reflecting admixture averaging 5 to 70 generations ago11 (Online Table 7 and Online Table 8). Differentiation was much higher in East Asians living in the early Holocene (FST=0.067) compared to today (FST=0.013) (Online Table 9), reflecting mixture between deep East Asian lineages. Today, East Asians with minimal West Eurasian-related ancestry grade between three poles. The “Amur Basin Cluster” correlates with ancient and present-day people in the Amur River Basin, and linguistically with Tungusic speakers and the Nivkh. The “Tibetan Plateau Cluster” is most strongly represented in ancient people from Nepal15 and Indigenous Tibetans. The “Southeast Asian Cluster” is maximized in ancient Taiwan and in East Asians speaking Tai-Kadai, Austroasiatic, and Austronesian languages (Extended Data Fig. 1, Extended Data Fig. 2, Extended Data Fig. 3). Automated clustering12 provides similar results (Extended Data Fig. 4, Supplementary Information section 2).
We organize our findings around themes. First we considered deep time: what are the early-branching lineages contributing to East Asians? Second to fourth, we shed light on how population structure came to be how it is today by testing three hypotheses about language expansions and their possible connection to farming spreads. Finally, we document how West and East Eurasians mixed along their geographic contact zone.
A Late Pleistocene Coastal Expansion
Only two pre-Ice Age genomes are available from East Asia: the ~40,000-year-old individual from Tianyuan Cave in northern China13 and the ~35,000-year-old Salkhit individual from Mongolia14. Nevertheless, important insights can be gleaned from analysis of post-Ice Age genomes. One question concerns the extent to which the modern human peopling of East Asia occurred via a coastal or interior route. Suggestive genetic evidence for a coastal route comes from Y chromosome data as Tibetans have a high frequency (~50%) of the deeply branching haplogroup D-M174, which is shared with modern Japanese (and ancient Jomon hunter-gatherers of Japan) along with Indigenous Andaman islanders of the Bay of Bengal15.
We used qpGraph16 to explore scenarios of population splits and gene flow consistent with the data and thus to identify a parsimonious working model for the deep history of key lineages contributing to ancestry extremes in our PCA (Supplementary Information section 3) (Extended Data Fig. 5). Our fit (Figure 2, Extended Data Fig. 6), suggests that much of East Asian ancestry can be derived from mixtures in different proportions of two ancient populations: one from the same lineage as the ~40,000-year-old Tianyuan10,13 and the other from the same lineage as Indigenous Andaman Islanders (Onge).
Figure 2: Model of deep population relationships.
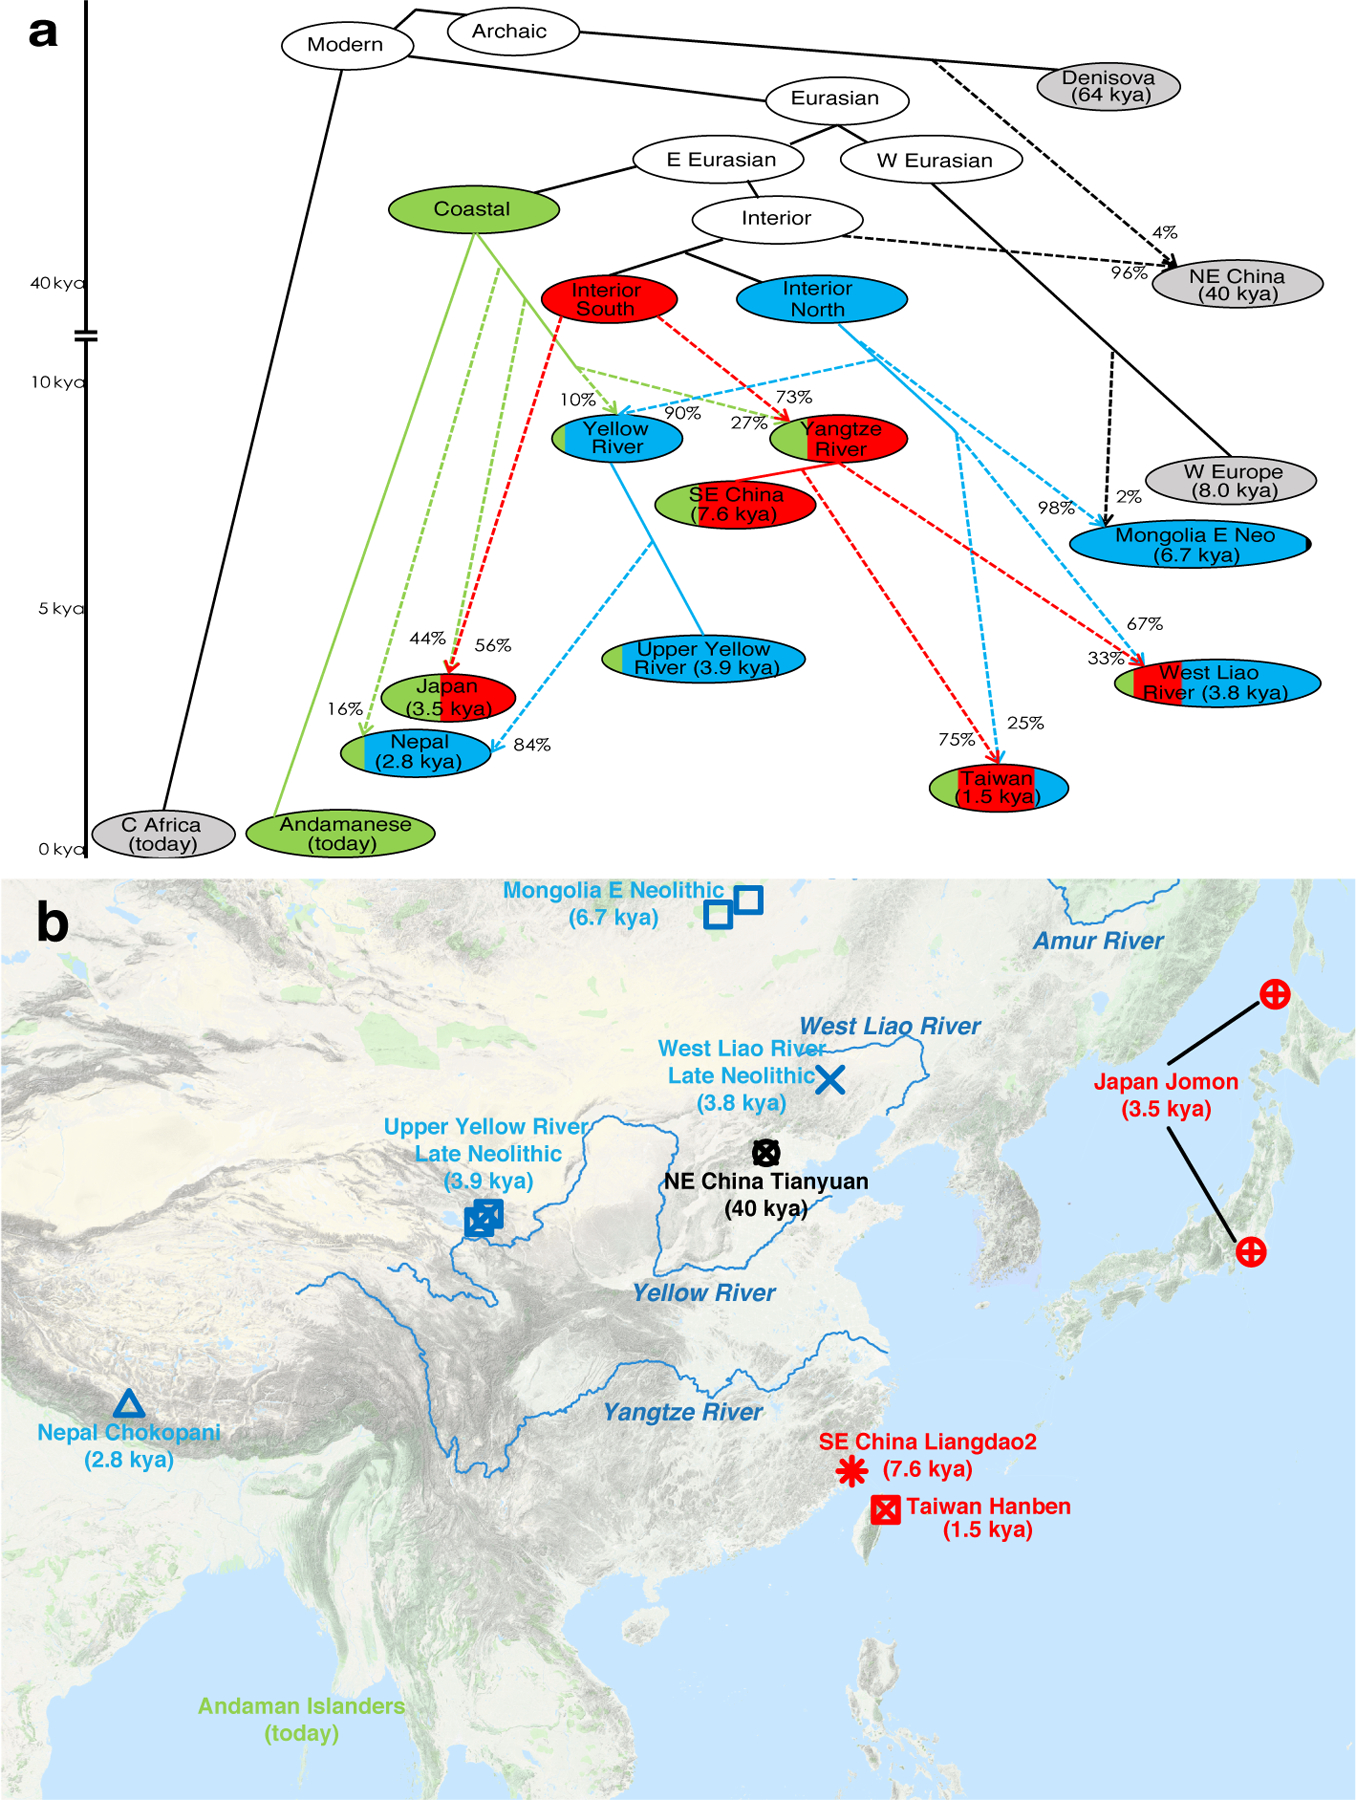
We start with a skeleton tree with one admixture event that when run on all SNPs fits the data for Denisova, Mbuti, Onge, Tianyuan and Loschbour according to qpGraph. We grafted on Mongolia East Neolithic, Upper Yellow River Late Neolithic farmers, Liangdao2, Japan Jomon, Nepal Chokhopani, Taiwan Hanben, and West Liao River Late Neolithic farmers, adding them consecutively to all possible edges and retaining only graphs that provided no differences of |Z|<3 between fitted and estimated statistics (maximum |Z|=2.95 here). We used MSMC and MSMC2 relative population split time estimates to constrain models. (a) We colour lineages modelled as from the hypothesized coastal expansion (green), interior southern expansion (red), or interior northern expansion (blue), and populations according to ancestry proportions. Dashed lines represent admixture (proportions marked). (b) Locations and dates of East Asians used in model fitting, with colours indicating the majority ancestry source, are plotted using the “Google Map Layer” from ArcGIS Online Basemaps (Map data ©2020 Google).
We infer that a Tianyuan-related lineage with a northern geographic distribution contributed 98% of the ancestry of Mongolian Neolithic people and 90% to Upper Yellow River Neolithic farmers (who mixed with an Onge-related branch speculatively from Tibetan hunter-gatherers to form modern Tibetans). We infer that another Tianyuan-related lineage with a more southern geographic distribution contributed 73% of the ancestry of a hunter-gatherer from the Liangdao site on the southeast coast of China19 and 56% to Jomon hunter-gatherers from Japan. Japan was occupied by humans before and after the Ice Age and southern and northern Jomon were morphologically distinct20, which may relate to the admixture we detect there. The northerly Tianyuan-related lineage also contributed to both West Liao River farmers (67%) and Taiwan farmers (25%) with the rest of their ancestry being related to Liangdao southern hunter-gatherers; the fact that this northern Tianyuan-related lineage is different from (albeit related to) the one that contributed Upper Yellow River farmers suggests that there was likely an expansion of northern farmers to Taiwan unlinked to the expansion of Yellow River farmers.
The Onge-related lineage’s contributions are concentrated in coastal groups: we estimate 100% in Andamanese, 44% in Jomon, and 20% in ancient Taiwan farmers, consistent with the coastal route expansion hypothesized based on Y chromosome haplogroup D-M174 seen in both Andamanese and Japanese15. While Tibet is of course not coastal, the relatively high inferred contribution of this lineage to ancient Tibetans (24%) and the presence of D-M174 at ~50% in modern Tibetans cements the link between this Y chromosome and Onge-related ancestry. We hypothesize that Tibetan hunter-gatherers represent an early splitting branch of this Late Pleistocene coastal expansion that spread inland and occupied the high plateau.
Refining the Transeurasian Hypothesis
The farming-and-language-dispersal hypothesis21 suggests that increasing population densities in and around centres of domestication was important in propelling movements of people that spread languages, but in East Asia there has been limited data available for testing this theory. We began by searching for genetic correlates of the “Transeurasian hypothesis” 22 which proposes a macrofamily including Mongolic, Turkic, Tungusic, Koreanic, and Japonic based on reconstructed features including shared agricultural terms. The Transeurasian hypothesis proposes that languages of these families descend from a proto-language associated with the expansion of early millet farmers around the West Liao River in northeast China spreading west toward Mongolia, north toward Siberia, and east toward Korea and Japan.
To obtain insight into possible genetic correlates of this language spread, we began by studying our time transect in the Amur River Basin23. From the ~5500 BCE early Neolithic individuals and ~5000 BCE Boisman individuals until the ~900 BCE Iron Age Yankovsky culture and 50–250 CE Xianbei culture, Amur River Basin individuals are consistent with being a clade according to qpWave (Online Table 10). This locally continuous population also contributed to later populations, as reflected in Y chromosomal haplogroup C2b-F1396 and mitochondrial haplogroups D4 and C5 of Boisman, which are predominant in present-day Tungusic, Mongolic, and some Turkic-speakers, and also in a Heishui Mohe culture individual at ~1100 CE who had an estimated 43±15% Amur River Basin Neolithic ancestry (the remainder well-modelled by Han Chinese as expected if there was immigration from the south in historical times) (Online Table 10). This anciently established Amur River Basin lineage was part of a cline of more Jomon-relatedness in the east and most Mongolian Neolithic-related ancestry in the west. We infer 77–94% Mongolian Neolithic-related ancestry in Baikal hunter-gatherers5 (the remainder from Ancient North Eurasians who are a deeply splitting West Eurasian-related lineage who lived in the Baikal region in the Ice Age) (Online Table 11). We infer ~87% in Amur River Basin hunter-gatherers such as Boisman (the remainder Jomon-related). Native Americans share more alleles with Boisman and the Mongolian Neolithic individuals than with the great majority of other East Asians, suggesting that an early branch of this lineage, reflecting the northern distribution of the Tianyuan-related branch in Figure 2, was the source for the East Asian-related ancestry in Native Americans (Online Table 12).
The Transeurasian Hypothesis is that the Mongolic, Turkic, Tungusic, Koreanic, and Japonic protolanguages were spread by agriculturalists from the West Liao River region who our analysis (Figure 2) shows were a mixture of Upper Yellow River-related (~67%) and Liangdao-related ancestry (~33%). Strikingly we observe that this characteristic mixture of ancestries is absent in the Mongolian and Amur River Basin time transects in our study (Figure 3), which is not what is expected for the hypothesis that expansions of West Liao River farmers spread Mongolic and Tungusic languages. In contrast, West Liao River farmer ancestry did plausibly have an impact further east. For example, we can model present-day Japanese as two-way mixtures of ~92% Bronze Age West Liao River populations and ~8% Jomon, with negligible contribution from Yellow River farmer-related sources as confirmed since Yellow River farming groups are included in the outgroup set for this qpAdm analysis and the models fit (Online Table 13 and Online Table 14). This ancestry is consistent with having been transmitted through Korea, as Japanese can be modeled as ~91% Korean and ~9% Jomon (Online Table 13 and Online Table 14). None of our reported 6 Jomon individuals carries the derived allele at the EDARV370A variant in the human Ectodysplasin receptor which affects hair, sweat, and mammary glands (Online Table 15), which has been estimated to have arisen in mainland China ~30,000 years ago24 and then swept to high frequency in nearly all Holocene people from mainland East Asia and the Americas. The fact that it is nearly absent in the Jomon highlights this population’s genetic distinctiveness compared with mainland groups.
Figure 3: Estimates of mixture proportions using qpAdm.
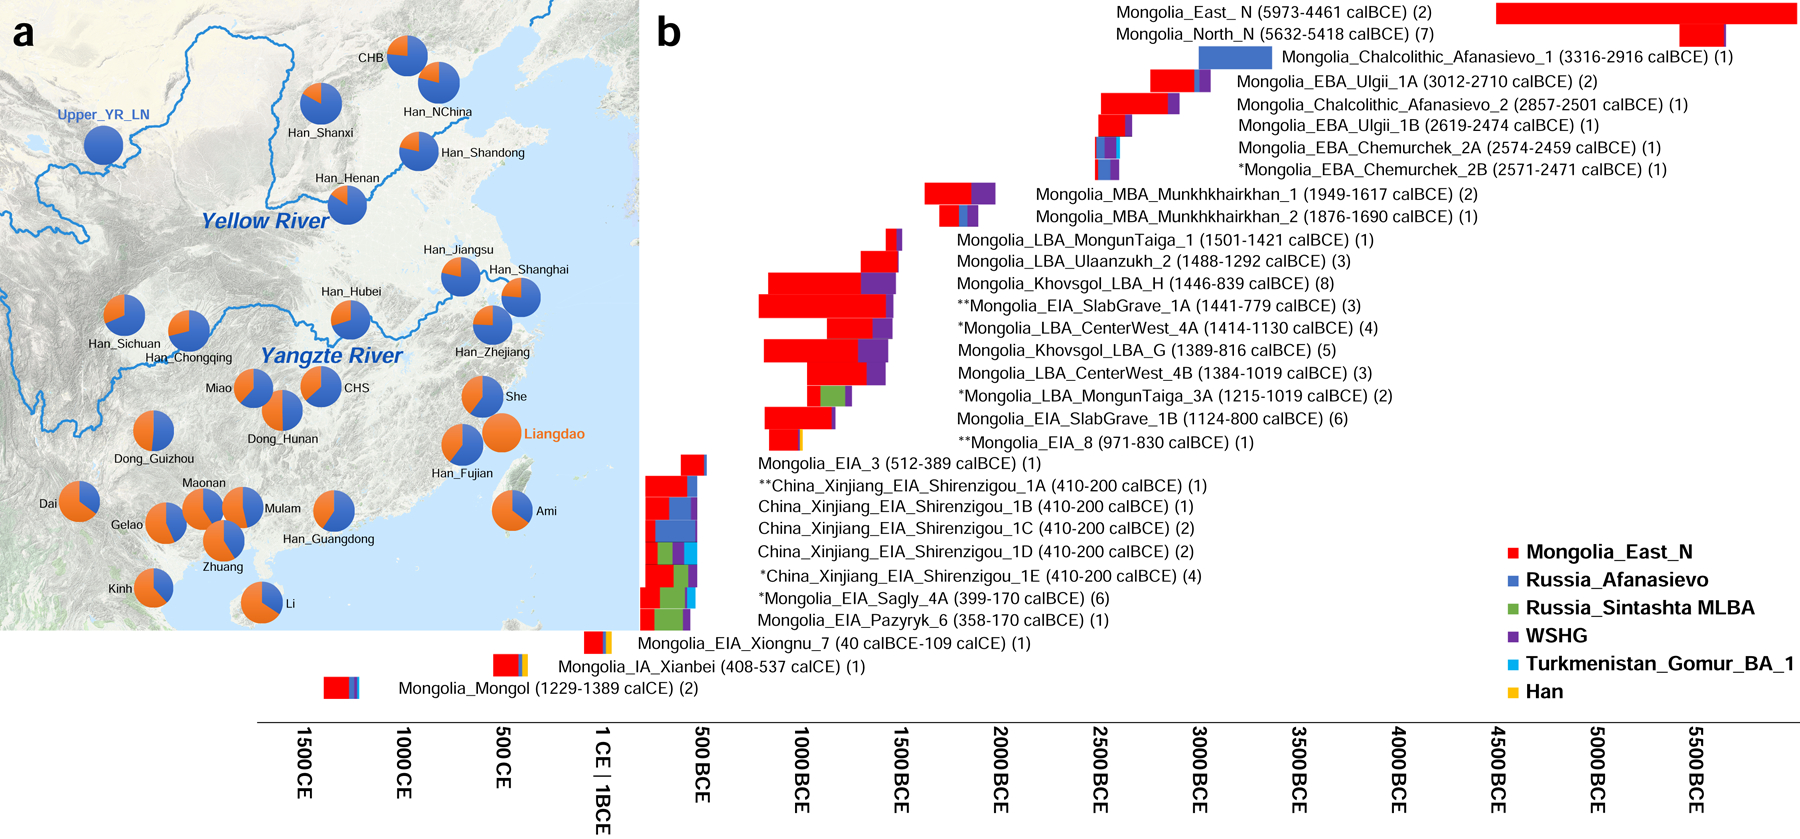
(a) qpAdm modelling of Yellow River farmer (blue) and Liangdao-related ancestry (orange) in present-day East Asians, with numbers from Online Table 22, and plotted using the “Google Map Layer” from ArcGIS Online Basemaps (Map data ©2020 Google). (b) Mongolians and Xinjiang. As sources we explored all possible subsets of Mongolia_East_N, Afanasievo, WSHG, Sintashta_MLBA, Turkmenistan_Gonur_BA_1, and Han Chinese, adding all groups to the reference set when not used as sources, and identifying parsimonious models (fewest numbers of sources) that fit at P>0.05 based on the Hotelling T2 test implemented in qpAdm (Online Table 25). These P-values do not incorporate any correction for multiple hypothesis testing. * indicates parsimonious models that only pass at P>0.01. ** indicates cases where multiple equally parsimonious models pass at P>0.05 so we can not determine whether the West Eurasian-related source was Afanasievo, WSHG, or Sintashta_MLBA (we plot the model with the largest p-value). Bars show ancestry proportions, and time spans are unions of all samples. We do not visualize results from singleton outliers.
Northern Origin of Sino-Tibetan
The Tibetan Plateau has been occupied by modern humans since 40,000–30,000 years ago25, but it is only since ~1600 BCE with the advent of agriculture that there is evidence for permanent occupation26. Indigenous Tibetans also speak Sino-Tibetan languages linked to languages in the coastal plain of China. The ‘northern origins hypothesis’ for the origin of these closely related languages suggests that farmers cultivating foxtail millet in the Upper and Middle Yellow River Basin expanded southwest toward the Tibetan Plateau and spread present-day Tibeto-Burman languages, and east and south towards the Central Plains and eastern coast amd spread Sinitic languages including the linguistic ancestor of Han Chinese27. The ‘southern origins hypothesis’ suggests that the proto-language arose in the Tibetan-Yi Corridor connecting the highlands to the lowlands and expanded in the early Holocene28.
To shed light on Tibetan ancestry and its relationship to that in Sinitic speakers, we grouped 17 present-day populations into three genetic clusters (Extended Data Fig. 7): “Core Tibetans”; “northern Tibetans” who are admixed between lineages related to Core Tibetans and West Eurasians; and “Tibeto-Yi Corridor” populations who we estimate using qpAdm3,16 have 30–70% ancestry related to Southeast Asians (Online Table 16) and include not just Tibetan speakers but also Qiang and Lolo-Burmese speakers. Ancient Yellow River farmers and present-day Han and Qiang share the most drift with Core Tibetans (Online Table 17), consistent with the hypothesis that Tibetans, Han and Qiang all harbor ancestry from a population related to Neolithic Yellow River farmers. We confirm large-scale admixture (minimum 22% but plausibly much higher consistent with the 84% estimate in Figure 2) in Core Tibetans through the decay of admixture linkage disequilibrium11. This provides independent evidence that Core Tibetans and their genetically almost indistinguishable relatives in ancient Nepal are unlikely to represent continuous descendants of Tibetan hunter-gatherers. We estimate that mixture occurred an average of ~290 BCE - 270 CE under models of a single pulse of admixture (Online Table 18). Its start could plausibly be as old as the ~1600 BCE date for the spread of agriculture onto the Tibetan plateau.
Han Chinese are characterized by a north-south genetic cline29–30. Upper and Middle Yellow River farmers and Tibetans share more alleles with Han compared with the Southeast Asian Cluster, while the Southeast Asian Cluster groups share more alleles with most Han Chinese groups when compared with Yellow River farmers (Online Table 19 and Online Table 20). Using qpWave3,31, we determined that two sources are consistent with contributing all the ancestry of most Han Chinese (Online Table 21), with an exception in northern Han for whom we infer West Eurasian-related admixture of 2–4% (Online Table 7 and Online Table 8). We estimate this mixture occurred on average 32–45 generations ago overlapping the Tang (618–907 CE) and Song (960–1279 BCE) dynasties from which there are historical records of integration of Han Chinese and western ethnic groups. For all other Han, we estimate 59–84% ancestry related to Upper and Middle Yellow River farmers, and the remainder from a population related to the ancient Liangdao hunter-gatherers, Speculatively this latter group corresponds to rice farmers of the Yangtze River Basin, an inference that gains strength from the fact that it comprises the primary ancestry of many Austronesian speakers, Tai-Kadai speakers on Hainan Island (Li, ~66%), Bronze Age Southeast Asians, and ~2/3 of the ancestry of some Austroasiatic speakers32,33 (Online Table 22, Figure 3).
Our results support the ‘northern origins hypothesis’ for Sino-Tibetan, since we detect a specific link between Sino-Tibetan speakers today and Upper and Middle Yellow River farmers. Aa timing concident with the archaeologically attested expansions of farming from this region is also supported by the Y chromosome evidence of a shared haplogroup Oα-F5 between Han and Tibetans deriving from a single male ancestor ~3800 BCE34. The cline of increasing Liangdao-related ancestry in southern Han today is plausibly due to expanding Han mixing with southern groups as they spread into southern China as recorded in the historical literature35. However, this was not the first southward migration, as southern Chinese are genetically closer to Late Neolithic Yellow River farmers than to earlier Middle Neolithic ones36, and since we also observe about 25% northern ancestry in ancient Taiwan farmers (Figure 2).
Rice Farming Expansions Spread Languages
Previous ancient DNA analysis in Southeast Asia showed that the earliest farmers of Southeast Asia harboured about 2/3 ancestry from East Asians plausibly related to southern Chinese agriculturalists, and about 1/3 ancestry from a deeply diverged hunter-gatherer lineage, a pattern that is most strongly evident in Austroasiatic speakers suggesting an association to that language spread32,33. By capitalizing on our time series spanning about 2,000 years from ancient Taiwan we confirm that this was part of a broader pattern. The ancient Taiwan individuals show strong genetic links to modern Austronesian speakers, a connection that is further supported by the fact that the dominant haplogroups in these ancient individuals are Y lineage O3a2c2-N6 and maternal mtDNA lineages E1a, B4a1a, F3b1, and F4b37,38 which are shared in modern Indigenous Taiwanese, and also present in Lapita culture individuals from Vanuatu who were plausibly the vectors for the first spread of Austronesian languages into the southwest Pacific39 (Online Table 12). Ancient Taiwan groups and modern Indigenous Taiwanese speaking Austronesian languages share significantly more alleles with Tai-Kadai speakers in southern mainland China and in Hainan Island40 than with other East Asians (Online Table 12), consistent with the hypothesis that ancient populations related to present-day Tai-Kadai speakers and descended more anciently from Yangtze River farmers (not yet sampled in ancient DNA) spread agriculture to Taiwan around 3000 BCE4. A surprising finding is our observation that ancient North Chinese individuals are more closely related to ancient individuals of our Taiwan time transect than to early Holocene hunter-gatherers on the mainland side of the Straits of Taiwan (Online Table 23). This suggests gene flow from Neolithic northern China into Taiwan, which we estimate at ~25% if we model it as derived from one of the two source lineages of Yellow River farmers (Figure 2). This ancestry does not fit as coming from Yellow River farmers themselves, suggesting a north-to-south migration not associated with expansions of these farmers. A speculative possibility is that this ancestry was carried by cultivators of foxtail millet which was domesticated in the north by ~8000 BCE42, and which in the south appears relatively early in the Taiwan Neolithic Tapenkeng culture (~3000–2500 BCE).
Admixture of West and East Eurasians
Mongolia falls near the eastern extreme of the Eurasian Steppe, and archaeological evidence shows that throughout the Holocene it was a conduit for cultural exchanges between East and West Eurasia. For example the Afanasievo culture, an eastward extension of the Yamnaya steppe pastoralist culture, brought the first dairying to the region43, and had a cultural influence on subsequent phenomena such as Chemurchek.
Our Mongolian time transect overwhelmingly derives ancestry from four sources 6000–600 BCE. The earliest-established—and the only source that is primarily East Asian-associated—is represented at essentially 100% frequency in the two East Mongolian Neolithic hunter-gatherer individuals at 6000–5000 BCE which are some of the earliest individuals in pour dataset (Figure 3, Online Table 24 and Online Table 25). The second source appears earliest in seven Neolithic hunter-gatherers from northern Mongolia from 5700–5400 BCE who can be modelled as having ~5% of ancestry related to previously reported West Siberian Hunter-gatherers (WSHG)6 (Online Table 25). The third source appears earliest in individuals from the Afanasievo culture (~3100 BCE), which are genetically extremely similar to Yamnaya steppe pastoralists consistent with the pattern in Afanasievo culture individuals from Russia4,6. The fourth source appears by ~1400 BCE and is well modelled as deriving from people with ancestry like the pastoralists of the Sintashta culture who derive from a mixture Yamnaya (~2/3) and European farmers (~1/3).
To quantify the admixture history in Mongolia, we used qpAdm (Online Table 25)3,16. Many eastern Mongolians can be modelled as simple two-way admixtures of Neolithic eastern Mongolians as one source (65–100%) and the remainder from West Siberian Hunter Gatherers (Figure 3). The individuals that fit this model were not only from Neolithic groups (0–5% West Siberian Hunter Gatherer), but also an Early Bronze Age child from the Afanasievo Kurgak govi site (15%), the Ulgii group (21–26%), the main grouping from the Middle Bronze Age Munkhkhairkhan culture (31–36%), and in the Late Bronze Age a combined group from the Center-West region (24–31%), and individuals of the Mongun Taiga type (35%). The fact that the Kurgak govi child has no evidence of Yamnaya-related ancestry despite his clear Afanasievo cultural association and chronology makes him the first case of an individual buried with Afanasievo traditions who has no evidence of Yamnaya ancestry. The legacy of the Yamnaya-era spread into Mongolia continued in two individuals from the Chemurchek culture whose ancestry can be only modelled by using Yamnaya/Afanasievo ancestry as a source (~33–51%, Online Table 25). This fits even when ancient European farmers are included in the outgroups, providing no evidence for the theory that long-distance movement of people spread West European megalithic cultural traditions to people of the Chemurchek culture44.
The one instance prior to 600 BCE in which our four source model does not fit occurs also occurs in a Chemurchek individual (p=5.1×10⁻⁵ from qpAdm), but we can successfully model them with 15% additional ancestry from populations related to the Turan region far to the south (Figure 3). A parallel study45 models a Chemurchek-associated individual as a mixture of Turan and early Kazakhstan pastoralists from the site of Botai, without any of the other three ancestries we detect in all Chemurchek individuals in our study. Since our best-fit model passes when Botai is in the reference set (p>0.84) (Online Table 25), the two findings would imply an extremely complex origin for Chemurchek if both were correct, with one migration stream carrying Botai-related ancestry and one not carrying it.
Beginning in the Middle Bronze Age, there is no compelling evidence in the Mongolian time transect data for a persistence of the Yamnaya-derived lineages that spread with Afanasievo. Instead the Yamnaya-related ancestry can only be modelled as deriving from a later spread related to people of the Middle to Late Bronze Age Sintashta and Andronovo horizons who were themselves a mixture of ~2/3 Yamnaya-related and 1/3 European farmer-related ancestry4,5,6. The Sintashta-related ancestry is detected in proportions of 0–57% in groups from this time onward, with substantial proportions of Sintashta-related ancestry only in western Mongolia (Figure 3, Online Table 25). For all these groups, qpAdm ancestry models pass with Afanasievo in the outgroups while models with Afanasievo as the source and Sintashta in the outgroups are all rejected (Figure 3, Online Table 25).
New ancestry began reaching Mongolia in large proportions beginning in the Late Bronze Age, with qpAdm models failing when using Neolithic eastern Mongolians as a single East Asian source in some Late Bronze Age individuals from Khovsgol, Ulaanzukh and Center-West region, two Early Iron Age individual associated with Slab Grave culture, and for Xiongnu, Xianbei and Mongols. However, when we include Han Chinese as a source, we estimate ancestry proportions of 9–80% in these individuals (Online Table 25). Turan-derived ancestry spread into the region again by the 6th to 4th century BCE in multiple individuals in the Iron Age Sagly culture. We find that alleles at two polymorphisms (rs1426654 and rs16891982) associated with light skin pigmentation and one (rs12913832) associated with blue eyes in Europeans occur frequently in the Sagly samples, but the allele at rs4988235 associated with lactose tolerance is nearly absent in all East Asians we analysed (Online Table 15).
While the Yamnaya/Afanasievo-associated lineages are consistent with having largely disappeared in Mongolia by the Middle to Late Bronze Age, we confirm and strengthen previous ancient DNA analysis suggesting that the legacy of this expansion persisted in western China into the time of the Iron Age Shirenzigou culture (410–190 BCE)46. Considering many of the Shirenzigou individuals singly as well as three of the five genetically homogeneous subclusters, the only parsimonious models derive all their West Eurasian-related ancestry from groups related to Afanasievo, confirming that Afanasievo ancestry without the characteristic European farmer-related mixture that appeared later in Central Asia and Mongolia persisted in Xinjiang. For example, for the two individuals with the most West Eurasian-related ancestry (Xinjiang_EIA_Shirenzigou_1C) all fitting three-way models include Russian Afanasievo (71–77%) (Figure 3, Online Table 25). Moreover, the total ancestry from the two other West Eurasian-related groups that can fit in small proportions in such models is always <9% (Online Table 25). In pre-state societies languages are thought to spread primarily through movements of people47, and these results thus adds weight to the theory that the Tocharian languages of the Tarim Basin spread through the migration of Yamnaya descendants to the Altai Mountains and Mongolia (in the guise of the Afanasievo culture), from whence they spread further to Xinjiang4,5,6,46,48,49. These results are significant for theories of Indo-European language diversification, as they increase the evidence in favour of the hypothesis that the split of the second-oldest branch in the Indo-European language tree occurred at the end of the fourth millennium BCE46,48,49.
Conclusion
This study marks significant progress in understanding East Asian population history, and further insights will come once more ancient DNA data are analyzed from pre-Ice Age East Asians and from Holocene people living in southern China.
Methods
Ethics Statement
The modern sample collection was carried out in 2014 in strict accordance with the ethical research principles of The Ministry of Science and Technology of the People’s Republic of China (Interim Measures for the Administration of Human Genetic Resources, June 10, 1998). Our sample collection and genotyping was further reviewed and approved by the Ethics Committee of the School of Life Sciences, Fudan University (October 22, 2014). Study staff informed potential participants about the goals of the project, and individuals who chose to participate gave informed consent consistent with broad studies of population history and human variation and public posting of anonymized data. There were no rewards for participating and no negative consequences for not participating; all participants signed or affixed a thumbprint to the consent form reviewed by Fudan University. An important principle of our study was to ensure that the research was underpinned not only by individual informed consent, but also support from community representatives sensitive to local perspectives, and thus we carried out community consultation with minority group leaders or village leaders as an integral part of the consent process. For each minority group, community representatives affirmed community support for the study through a signature or thumbprint on a form summarizing the Community Consultation process (these forms were completed between November 10 2014 and December 10 2014). Co-authors of the manuscript who were culturally Indigenous and in some cases were legally registered as members of minority groups specifically reviewed the manuscript’s discussion of population history to increase sensitivity to local perspectives. Specifically, co-author L.W. is a Tai-Kadai speaking Zhuang person from Guangxi in southwest China; R.S. is from Nepal; and L.K. and N. are based at the Tibet University for Nationalities, and N. is an Indigenous Tibetan. We emphasize that Indigenous and community narratives co-exist with scientific ones and may or may not align with them. Indigenous ancestry should not be confused with identity, which is about self-perception and culture and cannot be defined by genetics alone.
The ancient samples newly reported in this study were collected with the permission of the custodians of the samples, who are the archaeologists or museums in each of the countries for which we analyzed the data. We applied a case-by-case approach to obtaining permissions for each set of samples depending on the local expectations as these vary by region and cultural context. Every newly reported ancient sample in this study has permission for analysis from custodians of the samples who are co-authors and who affirm that ancient DNA analysis of these samples is appropriate. For most samples, we prepared formal collaboration agreements to explicitly list the ancient DNA work being performed by our team. In other instances, sample custodians who are co-authors determined that generation and publication of ancient DNA data was covered under their existing permissions for sample analysis, and so new sampling agreements were not required. Going beyond what was formally required, we also sought to make the presentation of the scientific findings sensitive to local perspectives from the regions from which the skeletons were excavated. For some regions for which we obtained DNA such as the southern islands of Japan and the Russian Far East sites we are not aware of modern communities with traditions of biological or cultural connection to the ancient remains. For other regions such as the Upper Yellow River Chinese or Mongolia the modern nation-states in which the ancient individuals lived are modern inheritors of the cultural and genetic heritage of the ancient groups. In Taiwan, in addition to obtaining formal permission for sampling from government institutions, we sought to ensure that the presentation of our results was sensitive to the perspectives of Indigenous Taiwanese who plausibly descend thousands of years ago from groups related to those from which we report data. The existence of at least sixteen non-Han Chinese Indigenous groups in Taiwan makes it difficult to connect particular sites to specific modern ethnic groups for prehistoric sites older than four hundred years, and it is rare for local communities to express connections with prehistoric sites. Nevertheless, two co-authors with Indigenous Taiwanese ancestry or cultural affiliation to these groups specifically reviewed the discussion of the Taiwan results to increase the sensitivity of our study to Indigenous group perspectives. H.-Y.Y. who is co-first author of the study has ancestry from the Paiwan Indigenous group. H.L. was the excavation leader for the Bilhun Hanben site and is the local community leader for the Ami group, whose present-day culture shows some similarities to the material culture of the site.
Ancient DNA laboratory work
All samples except those from Wuzhuangguoliang were prepared in dedicated clean room facilities at Harvard Medical School, Boston, USA and in some cases also the University of Vienna in Vienna, Austria. Online Table 2 lists experimental settings for each sample and library included in the dataset. Skeletal samples were surface cleaned and drilled or sandblasted and milled to produce a fine powder for DNA extraction50,51. We either followed the extraction protocol by Dabney et al52 replacing the extender-MinElute-column assembly with the columns from the Roche High Pure Viral Nucleic Acid Large Volume Kit53 (manual extraction) or, for samples prepared later, used a DNA extraction protocol based on silica beads instead of spin columns (and Dabney buffer) to allow for automated DNA purification54 (robotic extraction). We prepared individually barcoded double-stranded libraries for most samples using a protocol that included a DNA repair step with Uracil-DNA-glycosylase (UDG) to cut molecules at locations containing ancient DNA damage that is inefficient at the terminal positions of DNA molecules (Online Table 1, UDG: “half”)55, or, without UDG pre-treatment (double stranded minus). For a few extracts, single stranded DNA libraries56 were prepared with USER (NEB) addition in the dephosphorylation step that results in inefficient uracil removal at the 5’end of the DNA molecules, and does not affect deamination rates at the terminal 3’ end57. We performed target enrichment via hybridization with previously reported protocols8. We either enriched for the mitochondrial genome and 1.2M SNPs in two separate experiments or together in a single experiment. If split over two experiments, the first enrichment was for sequences aligning to mitochondrial DNA55,58 with some baits overlapping nuclear targets spiked in to screen libraries for nuclear DNA content. The second enrichment was for a targeted set of 1,237,207 SNPs that comprises a merge of two previously reported sets of 394,577 SNPs (390k capture)3 and 842,630 SNPs7. We sequenced the enriched libraries on an Illumina NextSeq500 instrument for 2×76 cycles (and both indices) or on Hiseq X10 instruments at the Broad Institute of MIT and Harvard for 2×101 cycles. We also shotgun sequenced each library for a few hundred thousand reads to assess the fraction of human reads.
Extractions of the Wuzhuangguoliang samples were performed in the clean room at Xi’an Jiaotong University and Xiamen University following the protocol by Rohland and Hofreiter59. Each extract was converted into double-stranded Illumina libraries following the manufacturer’s protocol (Fast Library Prep Kit, iGeneTech, Beijing, China). Sample-specific indexing barcodes were added to both sides of the fragments via amplification. Nuclear DNA capture was performed with AIExome Enrichment Kit V1 (iGeneTech, Beijing, China) according to the manufacturer’s protocol and sequenced on an Illumina NovaSeq instrument with 150 base pair paired-end reads.
Bioinformatic processing
We de-multiplexed the data and assigned sequences to samples based on the barcodes and/or indices, allowing up to one mismatch per barcode or index. We trimmed adapters and restricted to fragments where the two reads overlapped by at least 15 nucleotides. We merged sequences (allowing up to one mismatch) choosing bases in the merged region based on highest quality in case of a conflict, using either a modified version of Seqprep60 (if we were using bioinformatic processing pipeline 1 as specified in Online Table 2), or custom software (if were using bioinformatic processing pipeline 2; https://github.com/DReichLab/ADNA-Tools). We aligned the merged sequences using bwa (version 0.6.1 for pipeline 1 and version 0.7.15 for pipeline 2)61 to the mitochondrial genome RSRS62 and to the human genome (GRCh37, https://www.ncbi.nlm.nih.gov/assembly/GCF_000001405.13/). We removed duplicates with the same orientation, start and stop positions, and barcodes. We determined haplogroups using HaploGrep263. To assess authenticity we estimated the rate of cytosine to thymine substitution in the final nucleotide, which is expected to be at least 3% at cytosines in libraries prepared with a partial UDG treatment protocol and at least 10% for untreated libraries (minus) and single stranded libraries; all libraries we analyzed met this threshold. We also assessed authenticity by using contamMix (version 1.0.9 for pipeline 1 and 1.0.12 for pipeline 2)8 to determine the fraction of mtDNA sequences in an ancient sample that match the endogenous majority consensus more closely than a comparison set of 311 worldwide present-day human mtDNAs. For whole genome analysis, we randomly selected a single sequence covering every SNP position of interest (“pseudo-haploid” data) using custom software, only using nucleotides that were a minimum distance from the ends of the sequences to avoid deamination artifacts (https://github.com/DReichLab/adna-workflow). The coverages and numbers of SNPs covered at least once on the autosomes (chromosomes 1–22) are in Online Table 1 for a merge of data from all libraries for each sample. Online Table 2 gives results by library.
To evaluate whether there was evidence that ancient DNA data processed using the same bioinformatic pipeline was artifactually biased to appear similar to each other in f-statistic analysis, we computed statistics of the form f4(Group1Pipeline1, Group1Pipeline2; Group2Pipeline1, Group2Pipeline2) for all groups for which we had individuals in our main analysis dataset processed by both pipelines (Mongolia_EIA_Sagly_4, Mongolia_EIA_SlabGrave_1, Mongolia_LBA_CenterWest_4, Mongolia_LBA_MongunTaiga_3, Russia_MN_Boisman, and Taiwan_Hanben). For all 15 possible pairwise comparisons, the Z-scores for deviation from zero as computed based on a Block Jackknife standard error had magnitude < |2.7|, which is not significant after correcting for the 15 tests we performed (P=0.11 after applying a Bonferroni correction) (Online Table 3).
While these analyses reduce concerns about systematic differences in population genetic analysis driven by changes over time in the software we used to carry out our bioinformatic processing steps, we caution that there are other inhomogeneities in our ancient DNA dataset that have the potential to affect inferences. Other sources of inhomogeneity include systematic differences in the chemical properties and preservation conditions of DNA from different archaeological sites, (b) differences in wet laboratory protocols including differences between data from in-solution enrichment and direct shotgun sequencing, and (c) differences in wet laboratory and bioinformatic processing protocols across research groups that published the various datasets co-analyzed in our study. The fact that we can obtain fitting models of population history through admixture graph analysis (Figure 2) even in the presence of these differences, and that the admixture graph model also fits when restricting to transversion polymorphisms (Supplementary Information section 3), and finally that our f4-symmetry tests reveal no significant differences between data generated for this study using wet laboratory and bioinformatic protocols that changed over time (Online Table 3), increases confidence that our inferences are valid even in the presence of inhomogeneities.64
Customized damage restriction to address contamination in Wuzhuangguoliang
We explored authenticity metrics for different filtering strategies for the data from the Wuzhuangguoliang individuals: restricting only to damaged sequences, and merging damaged sequences with sequences that do not show damage in the final nucleotides but that are short (requiring a minimum of 30 bp, and increasing in 10 bp increments from there up to 180bp). We considered data from an individual usable for analysis if it consisted of a minimum 5000 SNPs, if the lower bound of its ANGSD 95% confidence interval is <0.01, and if the upper bound of its contamMix 95% confidence interval is >0.98. We choose the version of each sample that has the most SNPs covered as long as it meets the criteria above (Online Table 26).
Accelerator Mass Spectrometry Radiocarbon Dating
We generated 108 direct AMS (Accelerator Mass Spectrometry) radiocarbon (14C) dates; 70 at the Pennsylvania State University (PSUAMS), 32 through a collaboration of Pennsylvania State University (PSU-) and the University of California Irvine (UCIAMS), and 6 at Poznan Radiocarbon Laboratory (Poz). The methods used at Poznan are published elsewhere and here we summarize the methods used for the samples measured at PSUAMS and UCIAMS. Bone collagen from petrous, phalanx, or tooth (dentine) samples was extracted and purified using a modified Longin method with ultrafiltration (>30kDa gelatin)65. If bone collagen was poorly preserved or contaminated we hydrolysed the collagen and purified the amino acids using solid phase extraction columns (XAD amino acids)66. Prior to extraction we sequentially sonicated all samples in ACS grade methanol, acetone, and dichloromethane (30 minutes each) at room temperature to remove conservants or adhesives possibly used during curation. Extracted collagen or amino acid preservation was evaluated using crude gelatin yields (% wt), %C, %N and C/N ratios. Stable carbon and nitrogen isotopes were measured on a Thermo DeltaPlus instrument with a Costech elemental analyser at Yale University. C/N ratios between 3.06 and 3.45 indicate that all radiocarbon dated samples are well preserved. All samples were combusted and graphitized at PSU and UCIAMS using methods described elsewhere65. 14C measurements were made on a modified National Electronics Corporation 1.5SDH-1 compact accelerator mass spectrometer at either the PSUAMS facility or the Keck-Carbon Cycle AMS Facility at the University of California Irvine. All dates were calibrated using the IntCal20 curve67 in OxCal v 4.4.268 and are presented in calibrated calendar years BCE/CE .
Y chromosomal haplogroup analysis
We determined Y-haplogroups by examining the state of SNPs in ISOGG version 15.56 (https://isogg.org/tree/index.html) (Supplementary Information section 4).
X-chromosome contamination estimates
We performed an X-chromosomal contamination test for the male individuals following an approach introduced in ref. 69 and implemented in the ANGSD software9. We used the “MoM” (Methods of Moments) estimates. The estimates for some males are not informative because of the limited number of X-chromosomal SNPs covered by at least two sequences (we only report results for individuals with at least 200 SNPs covered at least twice).
Procedure for combining new Affymetrix Human Origins genotyping data on modern individuals with previously published data.
We merged the newly generated data with previously published datasets genotyped on Affymetrix Human Origins arrays16, restricting to present-day individuals with >95% genotyping completeness. We manually curated the data using ADMIXTURE12 and principal component analysis as implemented in EIGENSOFT10 to identify individuals that were outliers compared with others from their own populations in cases in which a main cluster was identifiable. We removed seven present-day individuals as outliers from subsequent analysis; the population IDs for these individuals are prefixed by the string “Ignore_” in the dataset we release (for analyses of ancient individuals, we do not remove outliers).
Principal Components Analysis.
We used the smartpca program of EIGENSOFT10, using default parameters and the lsqproject: YES and numoutlieriter: 0 options.
ADMIXTURE.
We carried out ADMIXTURE analysis in unsupervised mode12 after pruning for linkage disequilibrium in PLINK70 with parameters --indep-pairwise 200 25 0.4 which retained 256,427 SNPs. We ran ADMIXTURE with default 5-fold cross-validation (--cv=5), varying the number of ancestral populations between K=2 and K=18 in 100 bootstraps with different random seeds.
Clustering of ancient individuals.
We clustered ancient individuals based on chronology and archaeological association, and then further based on both qualitative similarity (in PCA and ADMIXTURE and outgroup f3-statistics) and quantitative homogeneity (based on f4-statistics, and qpAdm results). In general, group names have the format “<Country>_<Additional Geographic Detail If Any>_<Time Period>_<Cultural Association If Any>_<Genetic Cluster>”. For the individuals in Mongolia and the Xinjiang Iron Age Shirenzigou group, we carried out finer-clustering by using qpWave to test for homogeneity; we use an alphabetical suffix to designate the qpWave-based subcluster (e.g. Mongolia_EBA_Chemurchek_2A).
f-statistics.
We computed f-statistics using ADMIXTOOLS12 with default parameters, and standard errors using a block jackknife71. We use “outgroup-f3” statistics of the form f3(African_outgroup; Test, Comparison) to measure allele sharing between a Test population a Comparison panel. If we detect a significantly negative value for an “admixture-f3” statistic of the form f3(Test; Source1, Source2) we have evidence that a Test population is mixed between at least two ancestral populations differentially related (perhaps anciently) to Source1 and Source2. If we detect a significantly non-zero value of a statistic of the form f4(A,B;C,D) we can be confident that populations A and B (or C and D) are not consistent with being descended from a homogeneous ancestral population that split earlier in time from the ancestors of the other two groups. A significantly positive value of an f4-statistic of the form f4(A,B;C,D) implies an excess allele sharing between populations A and C or B and D, while a negative value implies sharing between populations B and C, or A and D.
FST computation.
We estimated FST using smartpca program of EIGENSOFT10 with default parameters and fstonly: YES and inbreed: YES. The populations and groupings used in this analysis are shown in Online Table 9.
Admixture graph modelling.
We modelled population relationships and admixture with qpGraph in ADMIXTOOLS16 using Mbuti as an outgroup. We computed f2-, f3- and f4- statistics measuring allele sharing of pairs, triples, and quadruples of populations and reported the maximum |Z|-score between predicted and observed values. We ranked models that passed according to this metric based on relative likelihood (Supplementary Information section 3).
Determining a minimum number of streams of ancestry.
We used qpWave3,31 as implemented in ADMIXTOOLS16 to test if a set of test populations is consistent with being related via N streams of ancestry from a set of outgroup populations. In qpWave, a test for rank N, implemented as a single hypothesis Hotelling T2 test, means that we are evaluating whether the test populations are consistent with descending from as few as N+1 sources of ancestry.
Inferring mixture proportions without an explicit phylogeny.
We used qpAdm3,31 as implemented in ADMIXTOOLS16 to estimate mixture proportions for a Test population as a combination of N ‘reference’ populations by exploiting (but not explicitly modelling) shared genetic drift with a set of ‘Outgroup’ populations. We compute standard errors with a Block Jackknife and a P-value for fit using a single hypothesis Hotelling T2 test.
Weighted linkage disequilibrium (LD) analysis.
LD decay was calculated using ALDER11 to infer admixture parameters including dates and mixture proportions, with a standard error computed as a Block Jackknife over chromosomes.
MSMC and MCMC2.
We used MSMC17 following the procedures in Mallick et al72 to infer cross-coalescence rates and population sizes among Ami/Atayal, Tibetan, and Ulchi. We also ran MCMC2 as described in Wang et al18.
Kinship analysis.
We used READ software73 as well as a custom method65 to determine genetic kinship between individual pairs.
Detecting runs of homozygosity (ROH).
We detect ROH in ancient DNA using the hapROH software as described in ref. 74.
Data availability
The aligned sequences are available through the European Nucleotide Archive under accession number PRJEB42781. The newly generated genotype data of 383 modern East Asian individuals have been deposited in Zenodo (https://doi.org/10.5281/zenodo.4058532). The previously published data co-analyzed with our newly reported data can be obtained as described in the original publications which are all explicitly referenced in Online Table 4; a compiled dataset that includes the merged genotypes used in this paper is available as the Allen Ancient DNA Resource at https://reich.hms.harvard.edu/allen-ancient-dna-resource-aadr-downloadable-genotypes-present-day-and-ancient-dna-data. Any other relevant data are available from the corresponding authors upon reasonable request.
Extended Data
Extended Data Figure 1|. Principal Component Analysis (PCA).
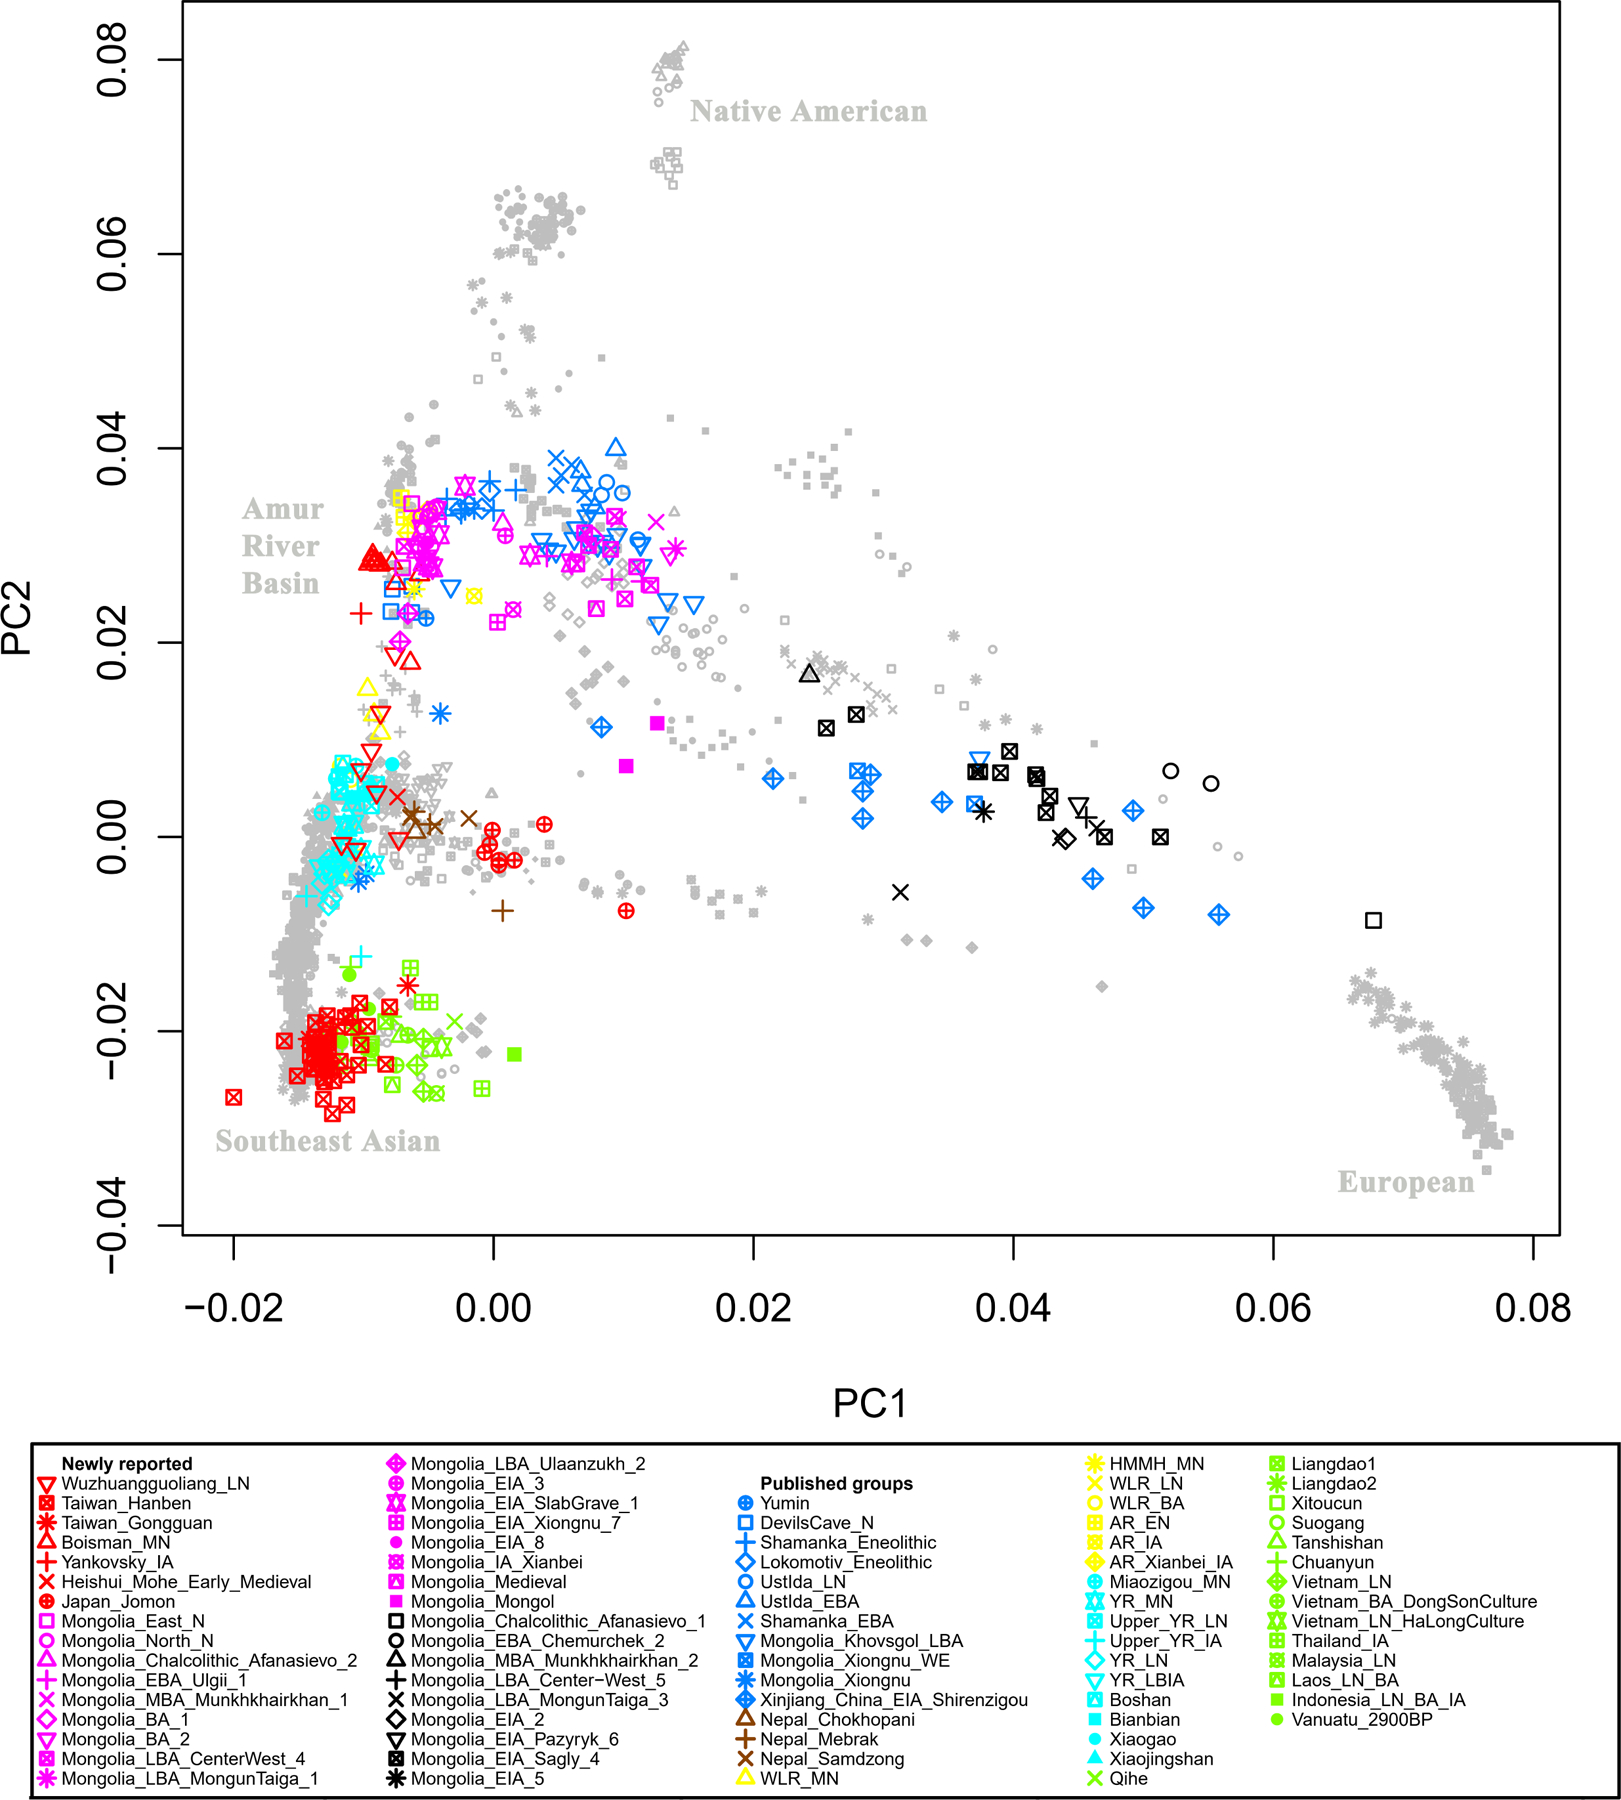
Projection of ancient samples onto PCA dimensions 1 and 2 defined by East Asians, Europeans, Siberians and Native Americans.
Extended Data Figure 2|. Principal Component Analysis (PCA).
(A) PCA dimensions 1 and 2 defined by present-day East Asians, Europeans, Siberians and Native Americans. (B) PCA dimensions 1 and 2 defined by present-day East Asian groups with the little West Eurasian mixture.
Extended Data Figure 3|. Neighbour-joining tree of present-day East Eurasians based on Fst distances using the Human Origin dataset.
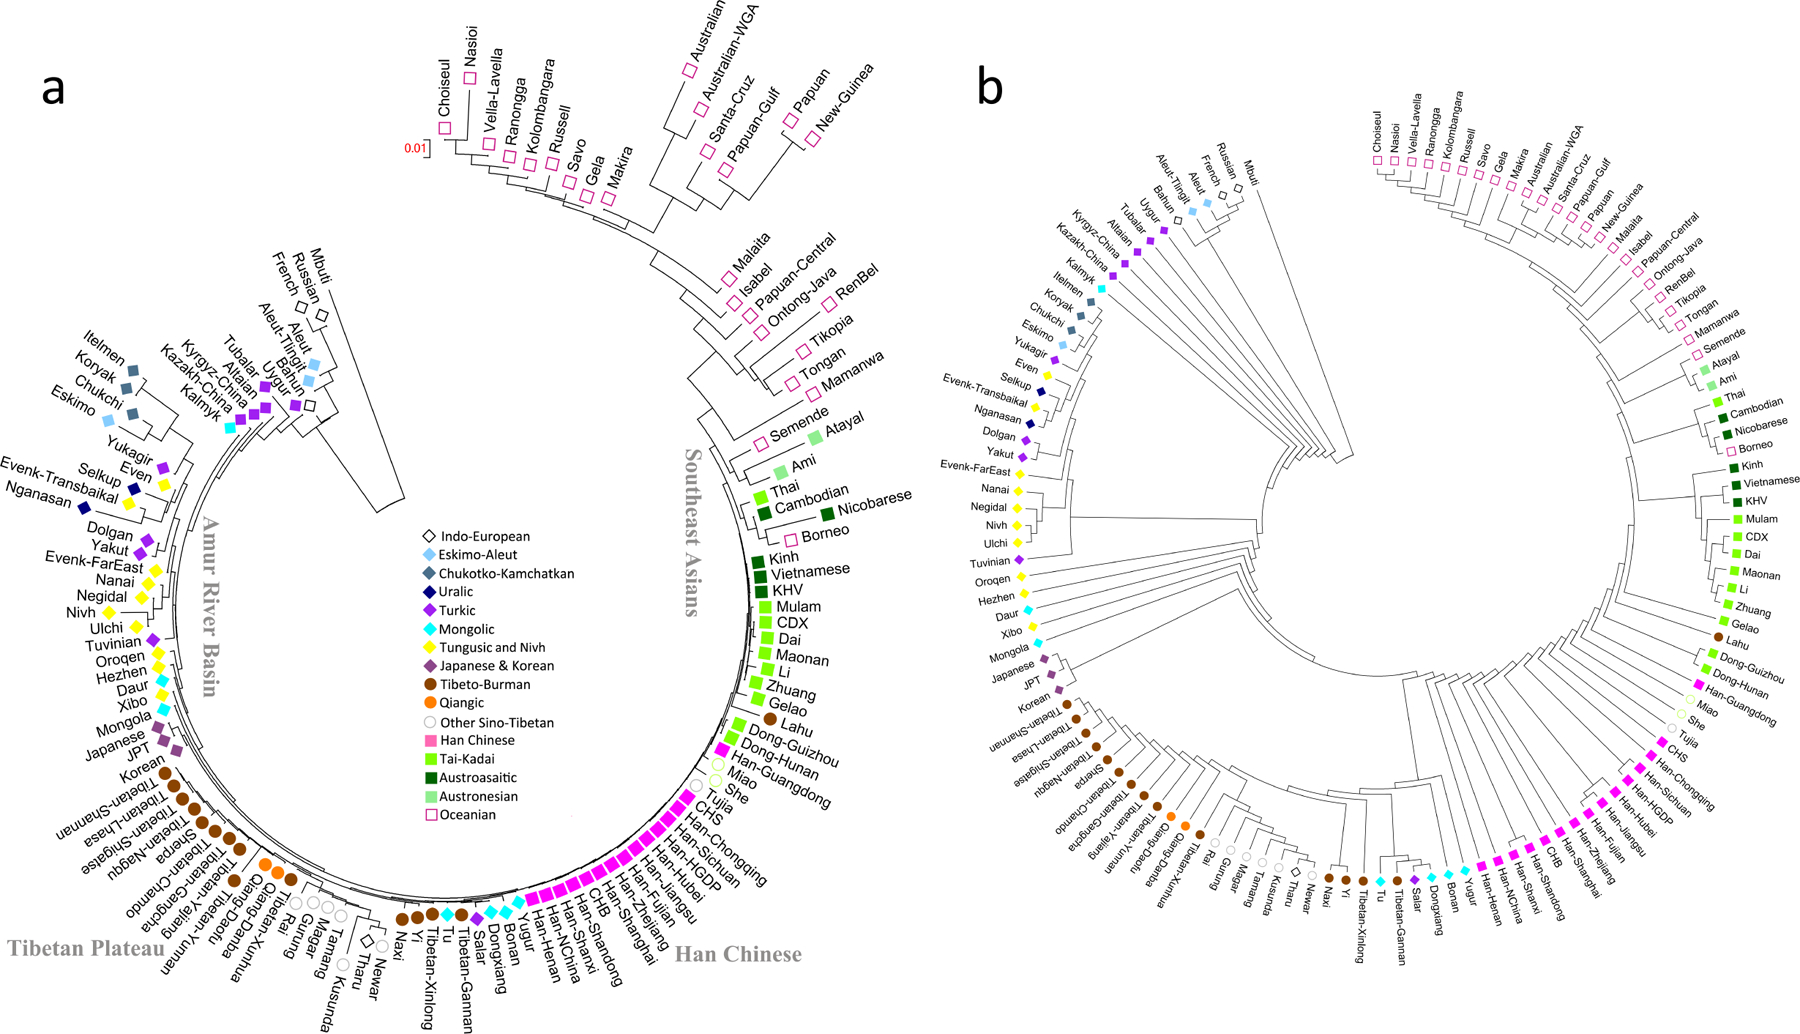
(a) The branch length is shown in Fst distance, (b) Version where internal branches are all shown as having the same length for better visualization.
Extended Data Figure 4|. ADMIXTURE plot at K=15 using the Human Origin dataset.
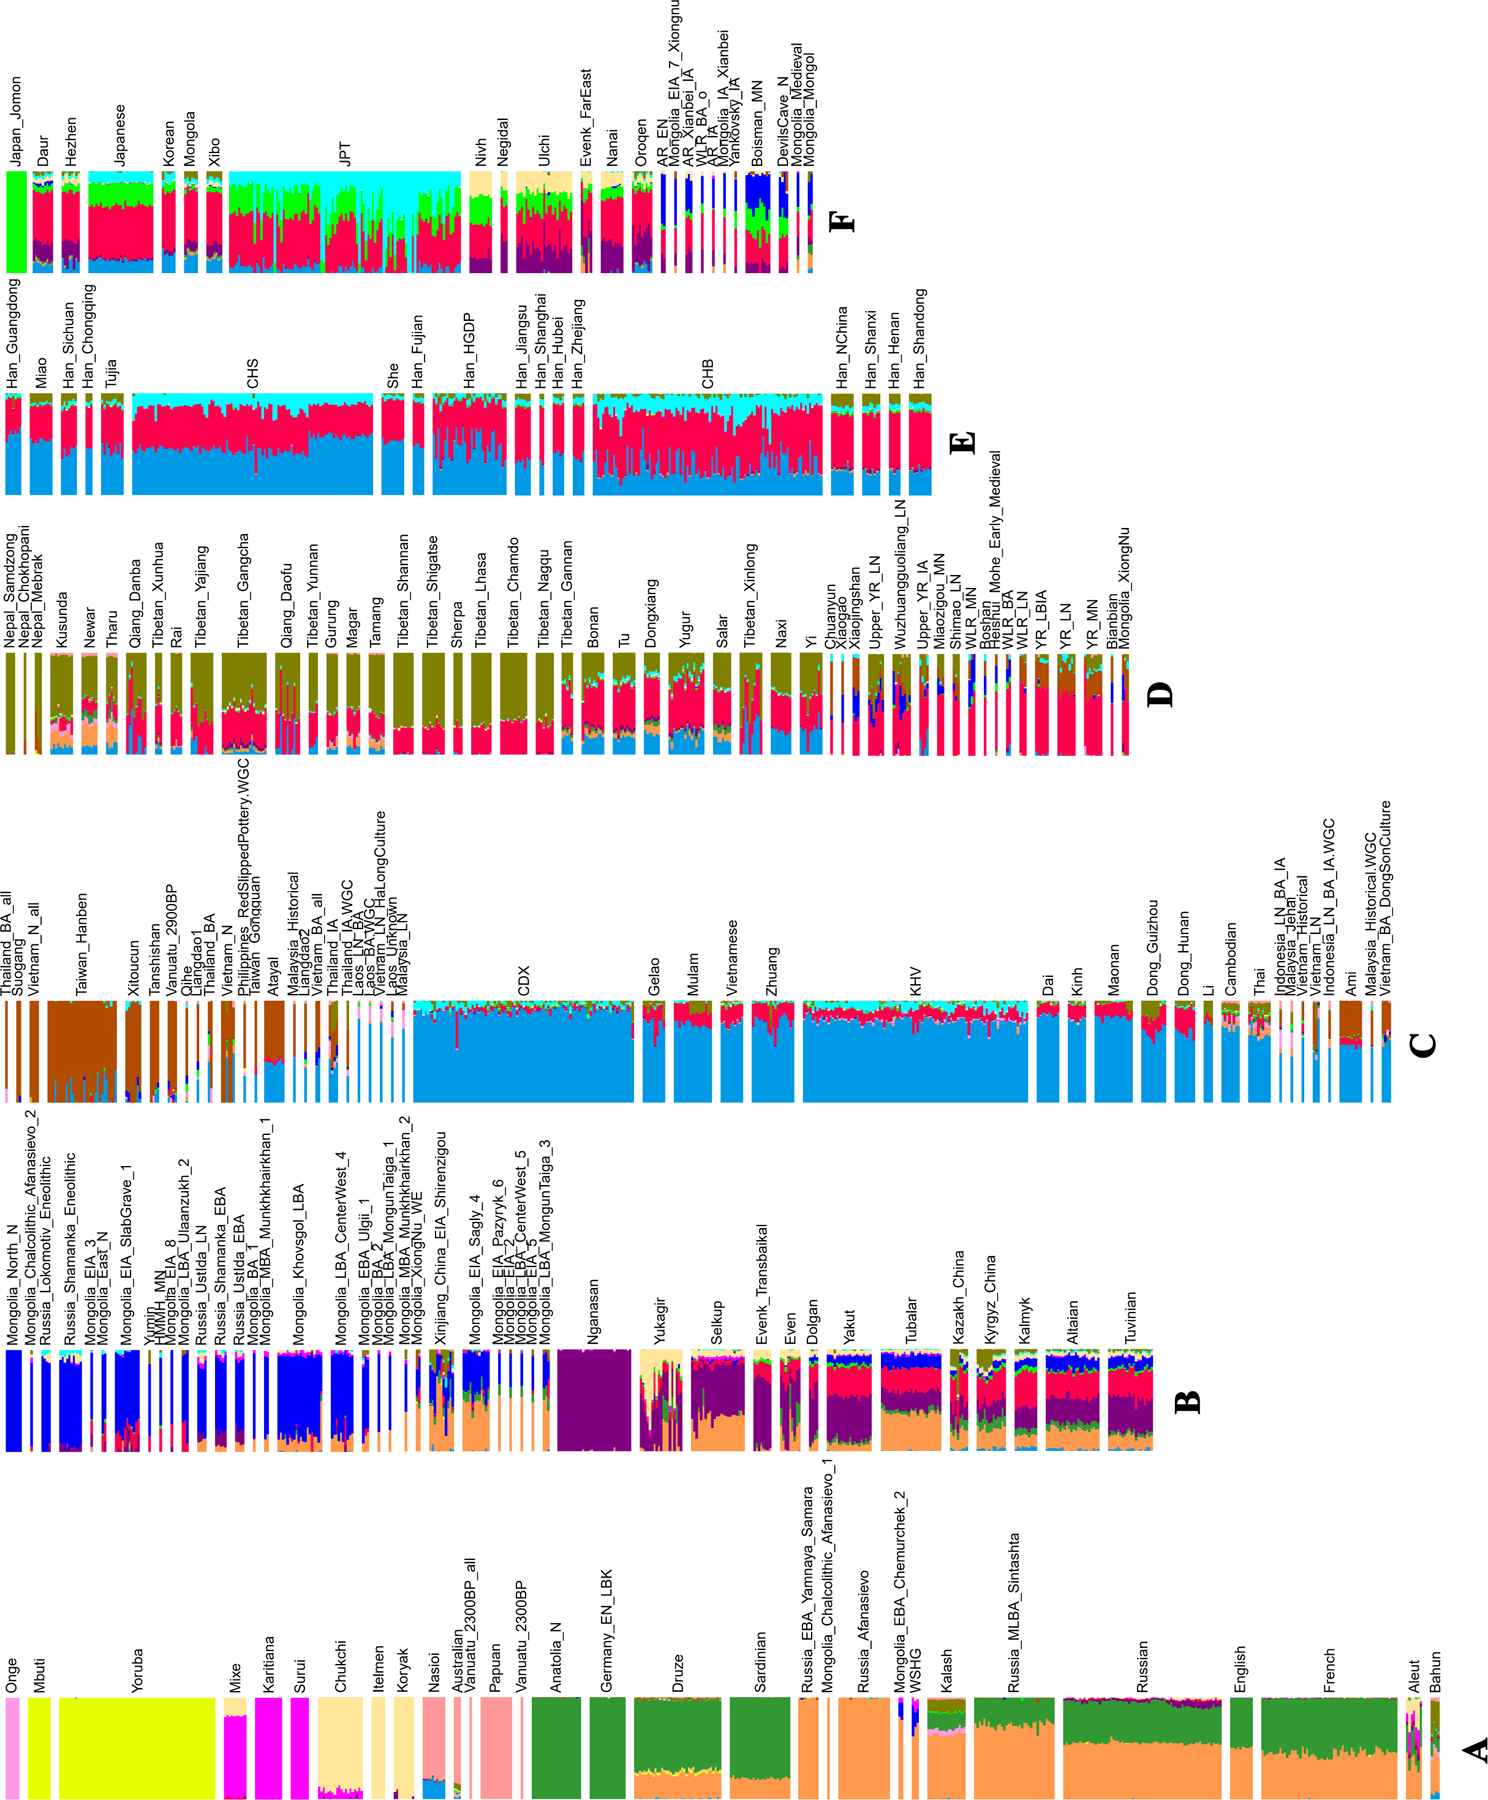
We grouped the populations roughly into six groups from A to F based on geographic and genetic affinity. (A) populations mainly from Africa (yellow), America (magenta), West Eurasia (dark green and light brown) and Oceania (light magenta); (B) populations mainly from Mongolia (blue) and Siberia (purple); (C) populations mainly from southern China and Southeast Asia (light blue); (D) populations mainly from the Tibetan Plateau (olive) and Neolithic Yellow River Basin (red); (E) mainly Han Chinese around China (light blue and red); (F) populations mainly from the Amur River Basin (blue and red) and northeast Asia.
Extended Data Figure 5|. Estimates of population split times.
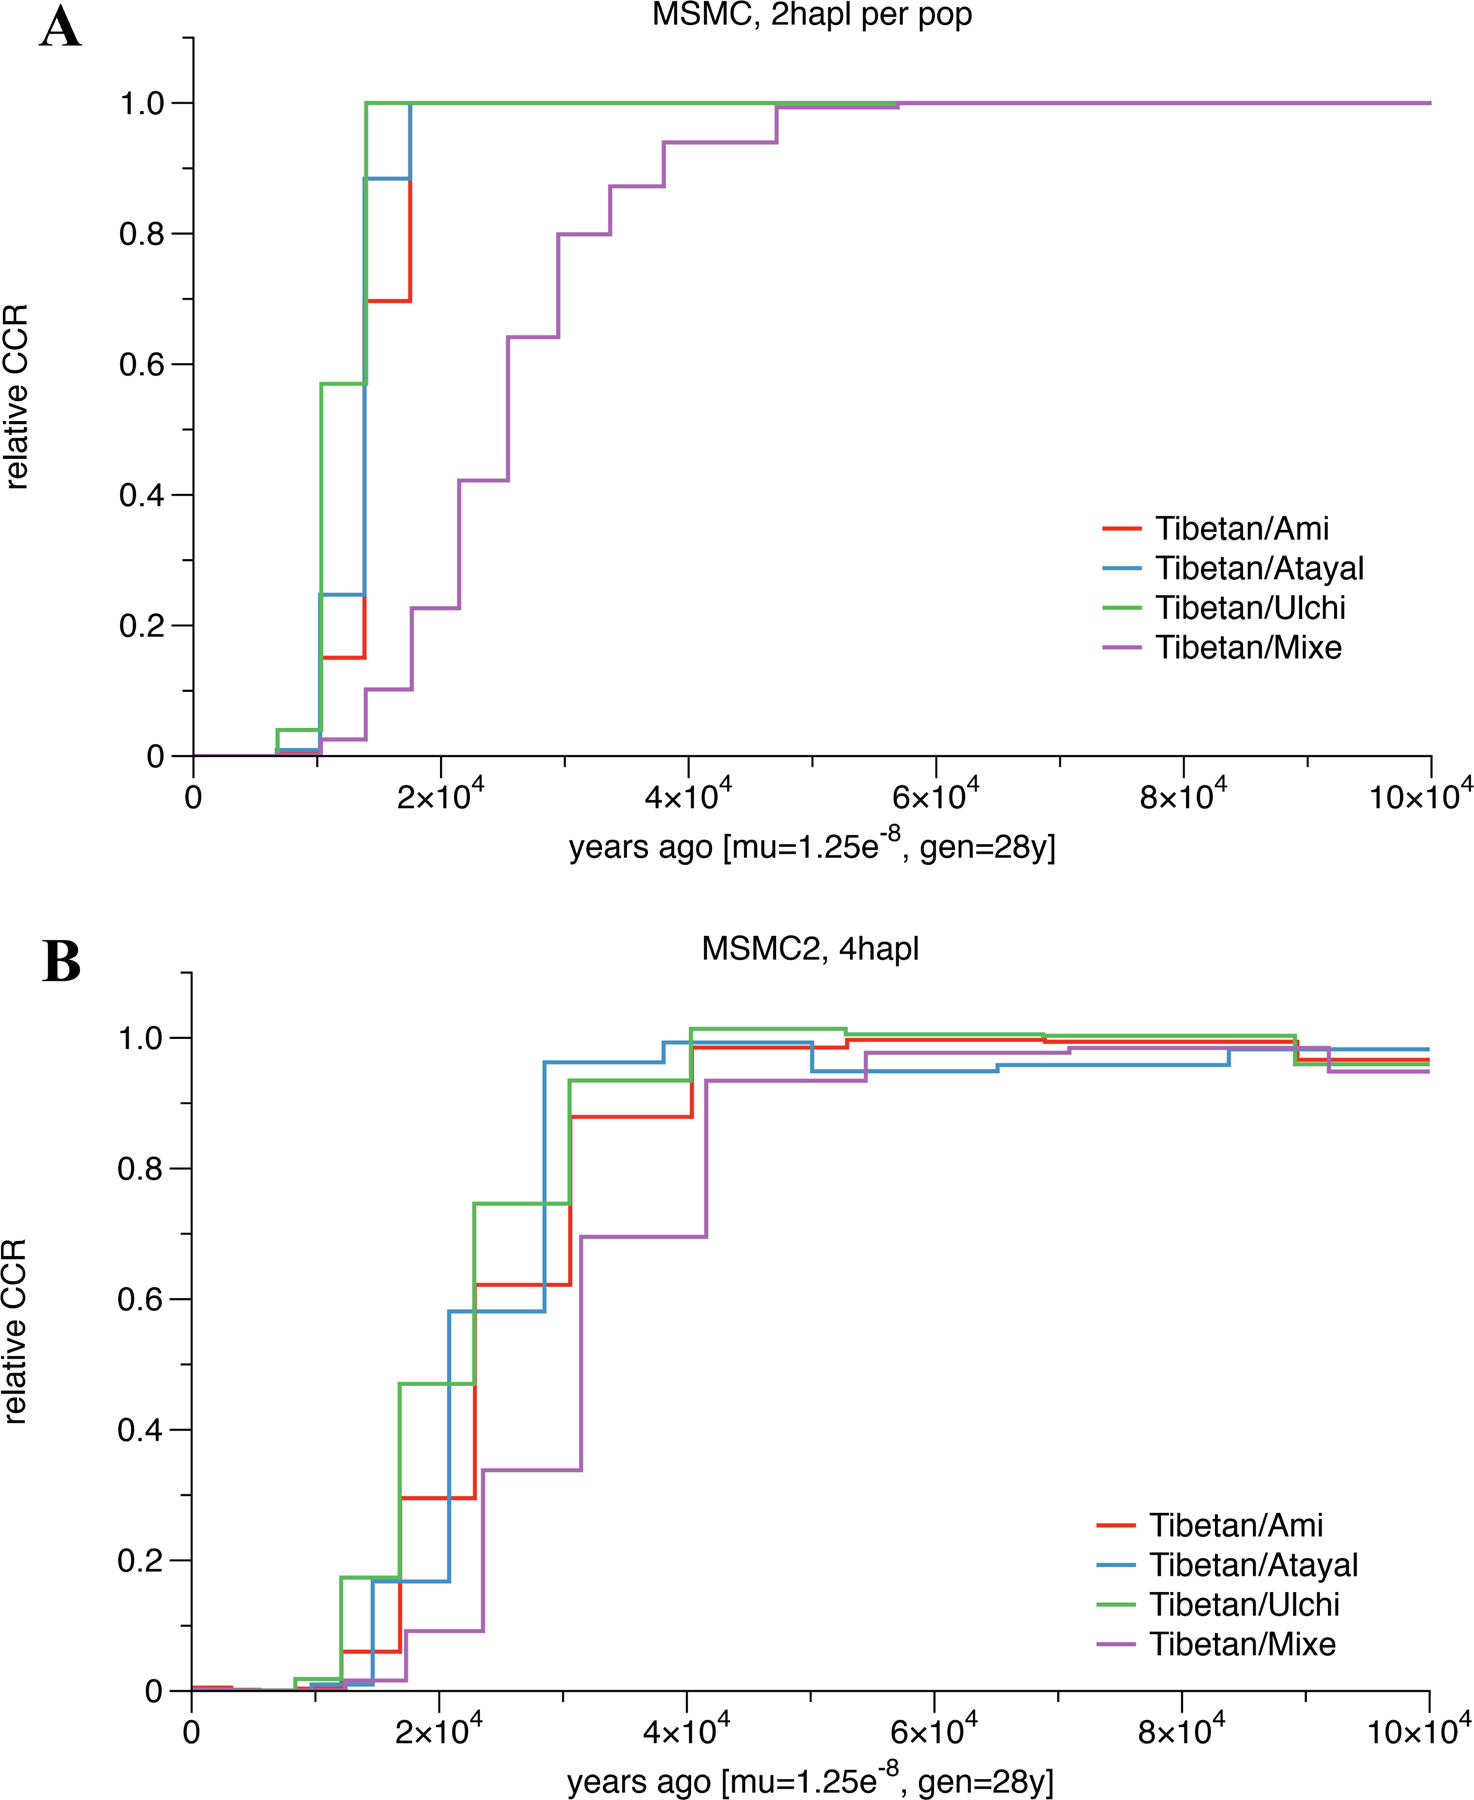
(A) Cross-coalescence rates for selected population pairs. We ran MSMC for four pairs of populations: Tibetan-Ami, Tibetan-Atayal, Tibetan-Ulchi and Tibetan-Mixe. We used one individuals from each population in this analysis. The modern genomic data for those individuals are from the Simons Genome Diversity Project. The times are calculated based on the mutation rate and generation time specified on the x-axis. (B) Cross-coalescence rates for selected population pairs. Same analysis as in Figure SI3–1, but using MSMC2 instead of MSMC, and using two individuals per population except for the Tibetan-Atayal pair, where we used only one.
Extended Data Figure 6|. Admixture graph model.
(This is the same as Figure 2 except that we show the fitted genetic drifts on each lineage.) We used all available sites in the 1240K dataset, restricting to transversions only to confirm that the same model fit (Supplementary Information section 3). We started with a skeleton tree that fits the data for Denisova, Mbuti, Onge, Tianyuan and Luxembourg Loschbour and one admixture event. We grafted on Mongolia East Neolithic, Upper Yellow River Late Neolithic farmers, Liangdao2, Japan Jomon, Nepal Chokhopani, Taiwan Hanben, and West Liao River Late Neolithic farmers in turn, adding them consecutively to all possible edges in the tree and retaining only graph solutions that provided no differences of |Z|<3 between fitted and estimated statistics (maximum |Z|=2.95 here). We used the MSMC and MSMC2 relative population split time estimates to constrain models. Deep splits are not well constrained due to minimal availability of Upper Paleolithic East Asian data. (a) Locations and dates of the East Asian individuals used in model fitting, with colours indicating whether the majority ancestry is from the hypothesized coastal expansion (green), interior expansion south (red), and interior expansion north. The map is based on the “Google Map Layer” from ArcGIS Online Basemaps (Map data ©2020 Google). (b) In the model visualization, we color lineages modelled as deriving entirely from one of these expansions, and also color populations according to ancestry proportions. Dashed lines represent admixture (proportions are marked), and we show the amount of genetic drift on each lineage in units of FST x 1000.
Extended Data Figure 7|. Shared genetic drift among Tibetans, measured by f3 (X, Y; Mbuti).
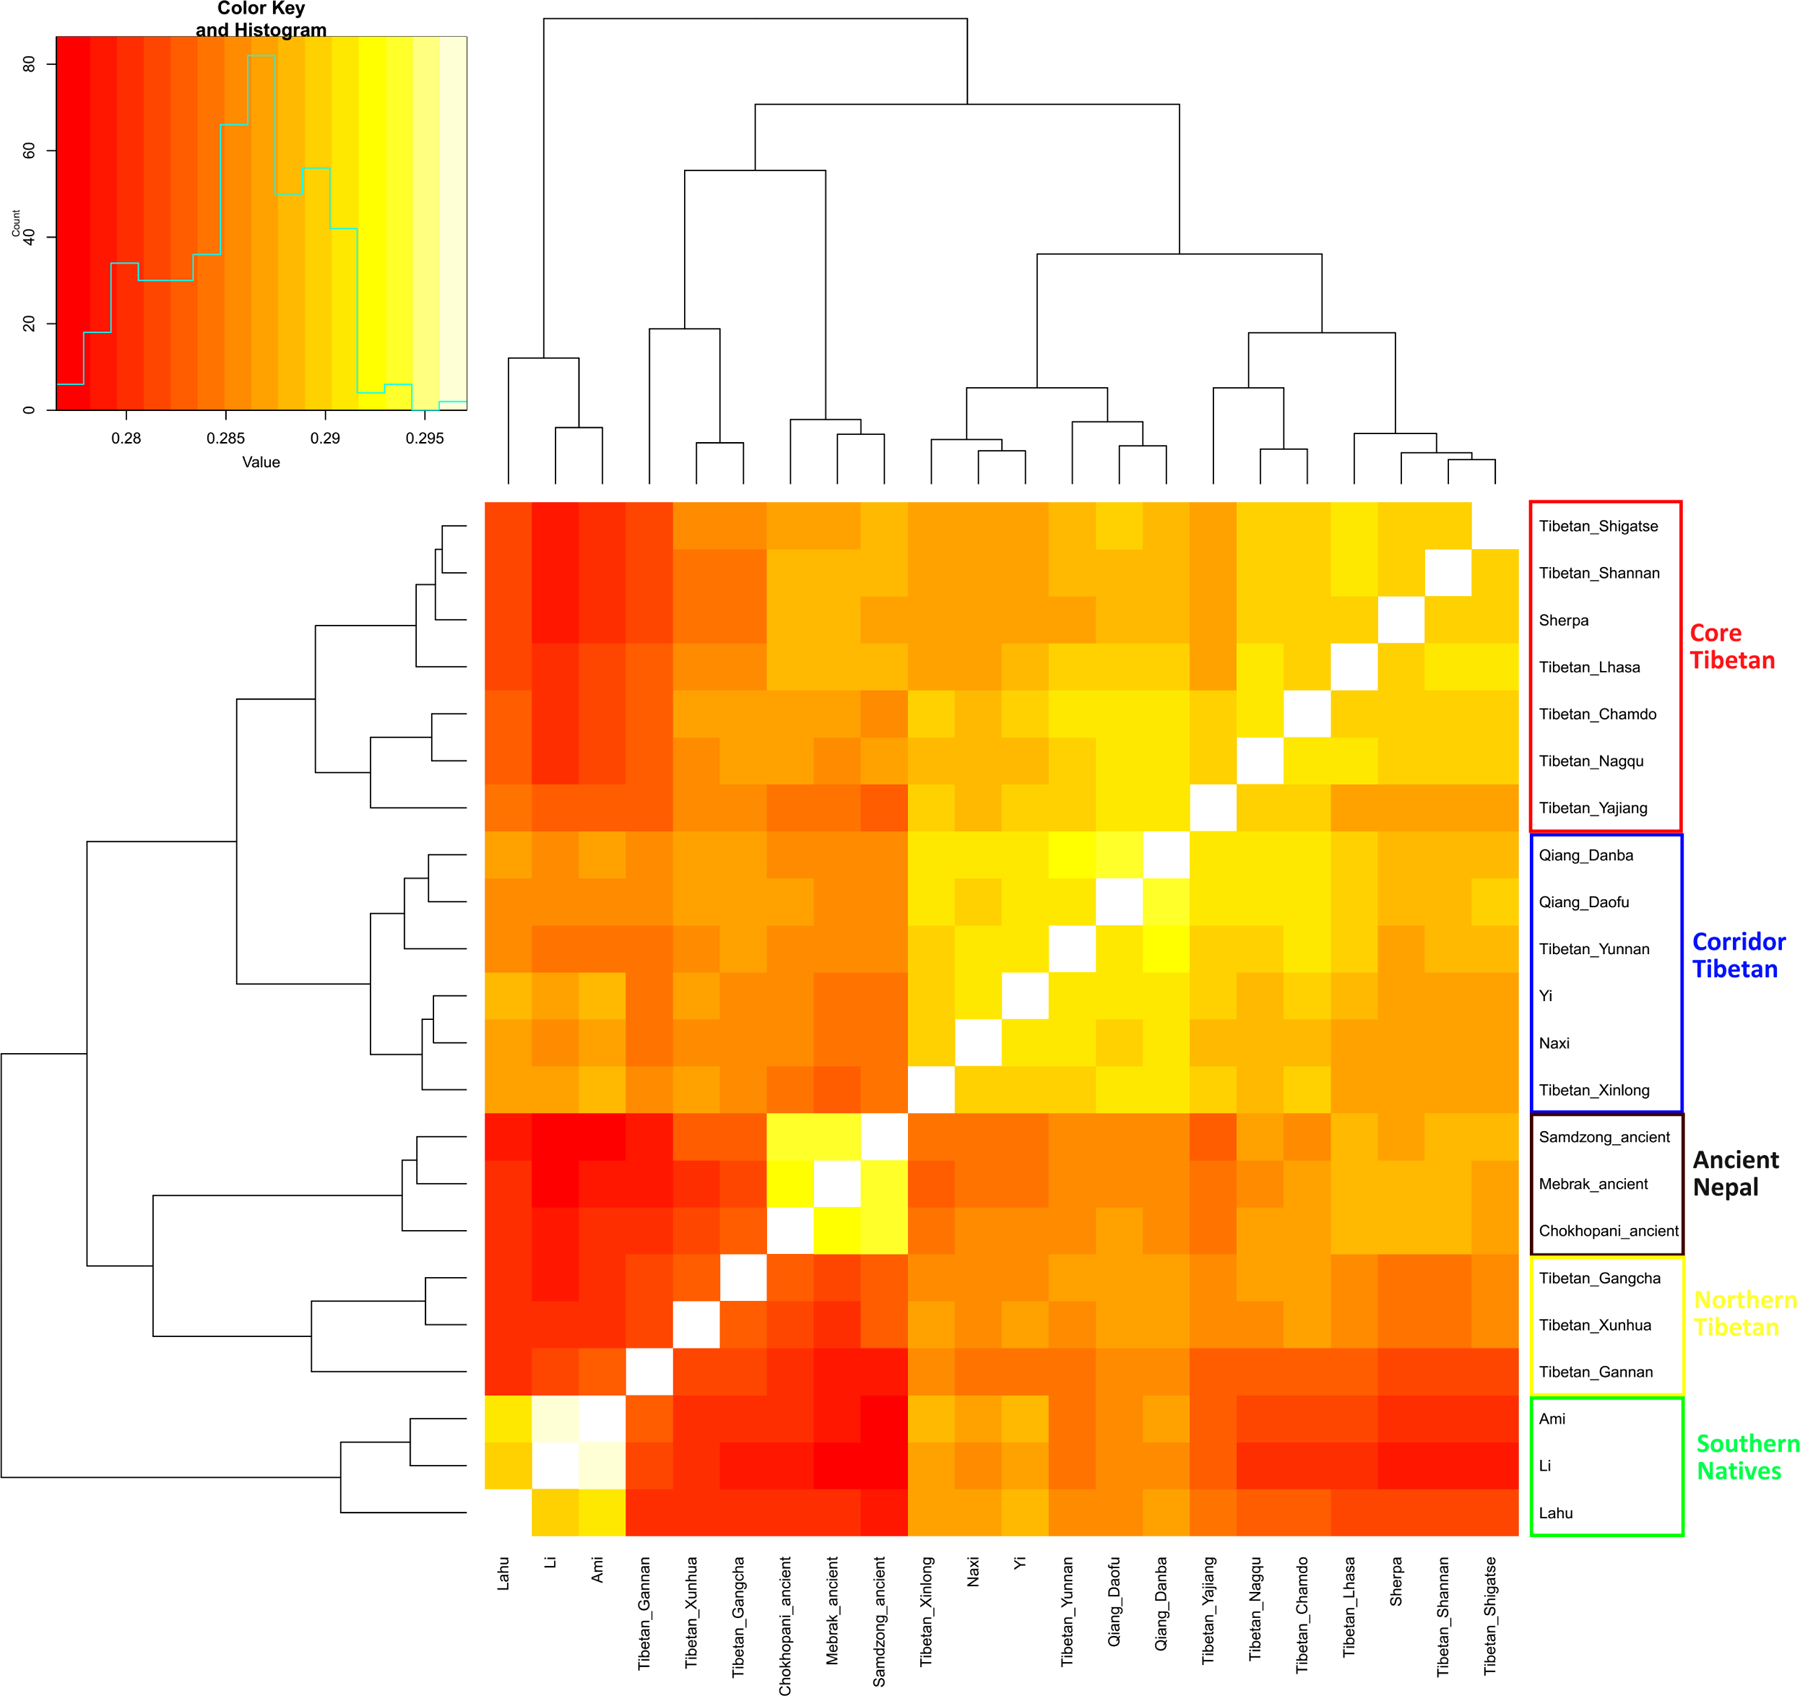
Lighter colors indicate more shared drift. Lahu groups with the Southeast Asian Cluster probably due to substantial admixture. The Tibetan_Yajiang are geographically in the Tibeto-Burman Corridor but group with Core Tibetans, presumably reflecting less genetic admixture from people of the Southeast Asian Cluster.
Extended Data Table 1|.
Population information for newly genotyped present-day individuals.
| Population | Language | Location | Latitude | Longitude | N |
|---|---|---|---|---|---|
| Tibetan | Tibetic, Sino-Tibetan | Chamdo, Tibet, China | 31.1 | 97.2 | 12 |
| Tibetan | Tibetic, Sino-Tibetan | Gangcha, Qinghai, China | 37.3 | 100.2 | 20 |
| Tibetan | Tibetic, Sino-Tibetan | Gannan, Gansu, China | 35 | 102.9 | 5 |
| Tibetan | Tibetic, Sino-Tibetan | Lhasa, Tibet, China | 30 | 91.1 | 9 |
| Tibetan | Tibetic, Sino-Tibetan | Nagqu, Tibet, China | 31.5 | 92.1 | 7 |
| Tibetan | Tibetic, Sino-Tibetan | Shannan, Tibet, China | 29.2 | 91.8 | 10 |
| Tibetan | Tibetic, Sino-Tibetan | Shigatse, Tibet, China | 29.3 | 88.9 | 10 |
| Tibetan | Tibetic, Sino-Tibetan | Xinlong, Sichuan, China | 31 | 100.3 | 10 |
| Tibetan | Tibetic, Sino-Tibetan | Xunhua, Qinghai, China | 35.8 | 102.5 | 4 |
| Tibetan | Tibetic, Sino-Tibetan | Yajiang, Sichuan, China | 30 | 101 | 10 |
| Tibetan | Tibetic, Sino-Tibetan | Yunnan, China | 27.8 | 99.7 | 4 |
| Qiang | Qiangic, Sino-Tibetan | Daofu, Sichuan, China | 30.9 | 101.1 | 11 |
| Qiang | Qiangic, Sino-Tibetan | Danba, Sichuan, China | 30.8 | 101.9 | 9 |
| Han | Chinese, Sino-Tibetan | Chongqing, China | 29.3 | 106.3 | 3 |
| Han | Chinese, Sino-Tibetan | Fujian, China | 26.1 | 119.3 | 5 |
| Han | Chinese, Sino-Tibetan | Guangdong, China | 23.2 | 113.2 | 7 |
| Han | Chinese, Sino-Tibetan | Henan, China | 34.8 | 113.6 | 5 |
| Han | Chinese, Sino-Tibetan | Hubei, China | 30.5 | 114.3 | 5 |
| Han | Chinese, Sino-Tibetan | Jiangsu, China | 32.l | 118.8 | 7 |
| Han | Chinese, Sino-Tibetan | Shandong, China | 36.6 | 117 | 10 |
| Han | Chinese, Sino-Tibetan | Shanghai, China | 31.2 | 121.5 | 2 |
| Han | Chinese, Sino-Tibetan | Shanxi, China | 37.9 | 112.5 | 8 |
| Han | Chinese, Sino-Tibetan | Sichuan, China | 30.7 | 104.1 | 7 |
| Han | Chinese, Sino-Tibetan | Zhejiang, China | 30.3 | 120.2 | 5 |
| Zhuang | Tai, Tai-Kadai | Guangxi, China | 22.8 | 108.4 | 22 |
| Li | Hlai, Tai–Kadai | Hainan, China | 18.5 | 110 | 4 |
| Dong | Kam-Sui, Tai–Kadai | Guizhou, China | 26.7 | 106.6 | 13 |
| Dong | Kam-Sui, Tai–Kadai | Hunan, China | 27.4 | 109.2 | 7 |
| Mulam | Kam-Sui, Tai–Kadai | Luocheng, Guangxi, China | 24.8 | 108.9 | 17 |
| Maonan | Kam-Sui, Tai–Kadai | Huanjiang, Guangxi, China | 24.8 | 108.3 | 17 |
| Gelao | Kra, Tai-Kadai | Longlin, Baise, Guangxi, China | 24.8 | 105.3 | 10 |
| Bonan | Mongolic | Jishishan, Gansu, China | 35.7 | 102.8 | 10 |
| Dongxiang | Mongolic | Linxia, Gansu, China | 35.6 | 103.2 | 7 |
| Yugur-Eastern | Mongolic | Sunan, Gansu, China | 38.9 | 99.6 | 16 |
| Kazakh | Kipchak, Turkic | Kazak Autonomous County of Aksay, Gansu, China | 38.5 | 94.3 | 8 |
| Kyrgyz | Kipchak, Turkic | Urumqi, Xinjiang,China | 43.8 | 87.7 | 13 |
| Yugur-Westem | Turkic | Sunan, Gansu, China | 38.9 | 99.6 | 1 |
| Salar | Oghuz, Turkic | Xunhua, Qinghai, China | 35.8 | 102.5 | 8 |
| Bahun | Nepali, Indo-European | Nepal | 27.4 | 85.3 | 5 |
| Gurung | Tamangic, Sino-Tibetan | Nepal | 27.4 | 86.2 | 5 |
| Magar | Magaric, Sino-Tibetan | Nepal | 27.4 | 86.2 | 6 |
| Newar | Sino-Tibetan | Nepal | 27.4 | 85.3 | 8 |
| Rai | Kiranti/Nepali | Nepal | 27.4 | 85.3 | 5 |
| Sherpa | Tibetic, Bodish, Sino-Tibetan | Nepal | 27.4 | 85.3 | 4 |
| Tamang | Tamangic, Sino-Tibetan | Nepal | 27.4 | 86.2 | 8 |
| Tharu | Indo-Aryan, Indo-European | Nepal | 27.4 | 86.2 | 5 |
Extended Data Table 2|.
Kinship detected between pairs of individuals.
| Region | Site | Family ID | N | Individuals | Relationship | Date |
|---|---|---|---|---|---|---|
| Japan | Rokutsu | Rokutsu.Family | 2 | I13886-I13887 | Brothers | 2136–1982 calBCE [intersection] |
| China | Wuzhuangguoliang | Wuzh.Family1 | 2 | S95-S97 | 1st degree relatives | 3400–2800 BCE |
| Taiwan | Hanben | Hanben.Family1 | 2 | I3611-I3612 | 2nd or 3rd degree relatives | 133–324 calCE [based on I3611] |
| Taiwan | Hanben | Hanben.Family2 | 2 | I15156-I8072 | 1st degree relatives | 1–800 CE |
| Taiwan | Hanben | Hanben.Family3 | 3 | I8078-I3735-I3734 | I8078-I1375 1st degree relatives; I3734 is a 2–3rd relative of I8078 | 376–532 calCE [based on I3735] |
| Russia | Boisman-2 | Boisman.Familyl | 6 | I3356-I14819-I14771-I14772-I14773-I14774 | father-mother-son-daughter-son2-daughter2 | 3705–3633 calBCE [based on I3356] |
| Russia | Boisman-2 | Boisman.Family2 | 2 | I1206-I1192 | 1st degree relatives | 4935–4803 calBCE [intersection] |
| Russia | Boisman-2 | Boisman.Family3 | 2 | I14307-I14308 | 1st degree relatives | 4841–4706 calBCE [based on I14308] |
| Mongola | Marzyn | Marzyn.Family | 3 | I11696-I11697-I11698 | 2nd or 3rd degree relatives | 5620–5484 calBCE [intersection] |
| Mongola | Ulaangom | Ulaangom.Family1 | 2 | I7029-I6230 | father-son | 346–172 calBCE [intersection] |
| Mongola | Ulaangom | Ulaangom.Family2 | 2 | I6231-I6232 | 2nd or 3rd degree relatives | 357–208 calBCE [intersection] |
| Mongola | Ulaangom | Ulaangom.Family3 | 2 | I12970-I7028 | 1st or 2nd degree relatives | 382–231 calBCE [intersection] |
| Mongolia | Ulaangom | Ulaangom.Family4 | 2 | I6224-I6225 | siblings | 370–197 calBCE [based on I6224] |
Supplementary Material
Acknowledgements
We thank David Anthony, Ofer Bar-Yosef, Katherine Brunson, Rowan Flad, Pavel Flegontov, Qiaomei Fu, Wolfgang Haak, Iosif Lazaridis, Mark Lipson, Iain Mathieson, Richard Meadow, Inigo Olalde, Nick Patterson, Pontus Skoglund, Dan Xu, and the four reviewers for valuable comments. We thank Naruya Saitou and the Asian DNA Repository Consortium for sharing genotype data from present-day Japanese groups. We thank Toyohiro Nishimoto and Takashi Fujisawa from the Rebun Town Board of Education for sharing the Funadomari Jomon samples, and Hideyo Tanaka and Watru Nagahara from the Archeological Center of Chiba City who are excavators of the Rokutsu Jomon site. The excavations at Boisman-2 site (Boisman culture), the Pospelovo-1 site (Yankovsky culture), and the Roshino-4 site (Heishui Mohe culture) were funded by the Far Eastern Federal University and the Institute of History, Archaeology and Ethnology Far Eastern Branch of the Russian Academy of Sciences; research on Pospelovo-1 is funded by RFBR project number 18–09-40101. C.C.W was funded by the Max Planck Society, the National Natural Science Foundation of China (NSFC 31801040), the Nanqiang Outstanding Young Talents Program of Xiamen University (X2123302), the Major project of National Social Science Foundation of China (20&ZD248), a European Research Council (ERC) grant to Dan Xu (ERC-2019-ADG-883700-TRAM) and Fundamental Research Funds for the Central Universities (ZK1144). O.B. and Y.B. were funded by Russian Scientific Foundation grant 17–14-01345. H.M. was supported by the grant JSPS 16H02527. M.R. and C.C.W received funding from the ERC under the European Union’s Horizon 2020 research and innovation program (grant No 646612) to M.R. The research of C.S. is supported by the Calleva Foundation and the Human Origins Research Fund. H.L was funded NSFC (91731303, 31671297), B&R International Joint Laboratory of Eurasian Anthropology (18490750300). J.K. was funded by DFG grant KR 4015/1–1, the Baden Württemberg Foundation, and the Max Planck Institute. Accelerator Mass Spectrometry radiocarbon dating work was supported by the National Science Foundation (NSF) (BCS-1460369) to D.J.K. and B.J.C. D.R. was funded by NSF grant BCS-1032255, NIH (NIGMS) grant GM100233, the Paul M. Allen Frontiers Group, John Templeton Foundation grant 61220, a gift from Jean-Francois Clin, and the Howard Hughes Medical Institute.
Footnotes
Competing interests
The authors declare no competing interests.
References
- 1.Cavalli-Sforza LL The Chinese human genome diversity project. Proc. Natl. Acad. Sci. USA 95, 11501–11503 (1998). [DOI] [PMC free article] [PubMed] [Google Scholar]
- 2.HUGO Pan-Asian SNP Consortium. Mapping human genetic diversity in Asia. Science 326, 1541–1545 (2009). [DOI] [PubMed] [Google Scholar]
- 3.Haak W, et al. Massive migration from the steppe was a source for Indo-European languages in Europe. Nature 522, 207–211 (2015). [DOI] [PMC free article] [PubMed] [Google Scholar]
- 4.Allentoft ME, et al. Population genomics of Bronze Age Eurasia. Nature 522,167–172 (2015). [DOI] [PubMed] [Google Scholar]
- 5.de Barros Damgaard P, et al. 137 ancient human genomes from across the Eurasian steppes. Nature 557, 369–374 (2018). [DOI] [PubMed] [Google Scholar]
- 6.Narasimhan VM, et al. The formation of human populations in South and Central Asia. Science 365, eaat7487 (2019). [DOI] [PMC free article] [PubMed] [Google Scholar]
- 7.Fu Q, et al. An early modern human from Romania with a recent Neanderthal ancestor. Nature 524, 216–219 (2015). [DOI] [PMC free article] [PubMed] [Google Scholar]
- 8.Fu Q, et al. DNA analysis of an early modern human from Tianyuan Cave, China. Proc. Natl Acad. Sci. USA 110, 2223–2227 (2013). [DOI] [PMC free article] [PubMed] [Google Scholar]
- 9.Korneliussen TS, Albrechtsen A, & Nielsen R ANGSD: Analysis of Next Generation Sequencing Data. BMC Bioinformatics 15, 356 (2014). [DOI] [PMC free article] [PubMed] [Google Scholar]
- 10.Patterson N, Price AL, & Reich D Population structure and eigenanalysis. PLoS Genet 2, e190 (2006). [DOI] [PMC free article] [PubMed] [Google Scholar]
- 11.Loh PR, et al. Inferring admixture histories of human populations using linkage disequilibrium. Genetics 193, 1233–1254 (2013). [DOI] [PMC free article] [PubMed] [Google Scholar]
- 12.Alexander DH, Novembre J, & Lange K Fast model-based estimation of ancestry in unrelated individuals. Genome Res 19, 1655–1664 (2009). [DOI] [PMC free article] [PubMed] [Google Scholar]
- 13.Yang MA, et al. 40,000-Year-Old Individual from Asia Provides Insight into Early Population Structure in Eurasia. Curr Biol 27, 3202–3208 (2017). [DOI] [PMC free article] [PubMed] [Google Scholar]
- 14.Massilani D, et al. Denisovan ancestry and population history of early East Asians. Science 370, 579–583 (2020). [DOI] [PubMed] [Google Scholar]
- 15.Wang CC, & Li H Inferring human history in East Asia from Y chromosomes. Investig Genet 4, 11 (2013). [DOI] [PMC free article] [PubMed] [Google Scholar]
- 16.Patterson N, et al. Ancient admixture in human history. Genetics 192, 1065–1093 (2012). [DOI] [PMC free article] [PubMed] [Google Scholar]
- 17.Schiffels S, & Durbin R Inferring human population size and separation history from multiple genome sequences. Nat Genet 46, 919–925 (2014). [DOI] [PMC free article] [PubMed] [Google Scholar]
- 18.Wang K, Mathieson I, O’Connell J, & Schiffels S Tracking human population structure through time from whole genome sequences. PLoS Genet 16, e1008552 (2020). [DOI] [PMC free article] [PubMed] [Google Scholar]
- 19.Yang MA, et al. Ancient DNA indicates human population shifts and admixture in northern and southern China. Science 369, 282–288 (2020). [DOI] [PubMed] [Google Scholar]
- 20.Nakashima A, Ishida H, Shigematsu M, Goto M, & Hanihara T Nonmetric cranial variation of Jomon Japan: Implications for the evolution of eastern Asian diversity. Am J Hum Biol 22, 782–790 (2010). [DOI] [PubMed] [Google Scholar]
- 21.Bellwood P & Renfrew C ed. Examining the farming/language dispersal hypothesis (McDonald Institute for Archaeological Research, Cambridge, 2002). [Google Scholar]
- 22.Robbeets M & Savelyev A ed. The Oxford Guide to the Transeurasian Languages (Oxford University Press, Oxford, 2020). [Google Scholar]
- 23.Siska V, et al. Genome-wide data from two early Neolithic East Asian individuals dating to 7700 years ago. Sci Adv 3, e1601877 (2017). [DOI] [PMC free article] [PubMed] [Google Scholar]
- 24.Kamberov YG, et al. Modeling recent human evolution in mice by expression of a selected EDAR variant. Cell, 152, 691–702 (2013). [DOI] [PMC free article] [PubMed] [Google Scholar]
- 25.Zhang XL, et al. The earliest human occupation of the high-altitude Tibetan Plateau 40 thousand to 30 thousand years ago. Science 362, 1049–1051 (2018). [DOI] [PubMed] [Google Scholar]
- 26.Chen FH, et al. Agriculture facilitated permanent human occupation of the Tibetan Plateau after 3600 B.P. Science 347, 248–250 (2015). [DOI] [PubMed] [Google Scholar]
- 27.Zhang M, Yan S, Pan W, Jin L Phylogenetic evidence for Sino-Tibetan origin in northern China in the Late Neolithic. Nature 569, 112–115 (2019). [DOI] [PubMed] [Google Scholar]
- 28.van Driem G in The Peopling of East Asia: Putting Together Archaeology, Linguistics and Genetics (eds Sagart L et al.) 81–106 (Routledge, London, 2005). [Google Scholar]
- 29.Liu S, et al. Genomic Analyses from Non-invasive Prenatal Testing Reveal Genetic Associations, Patterns of Viral Infections, and Chinese Population History. Cell, 175, 347–359 (2018). [DOI] [PubMed] [Google Scholar]
- 30.Chiang C, Mangul S, Robles C, & Sankararaman S A Comprehensive Map of Genetic Variation in the World’s Largest Ethnic Group-Han Chinese. Mol Biol Evol 35, 2736–2750 (2018). [DOI] [PMC free article] [PubMed] [Google Scholar]
- 31.Reich D, et al. Reconstructing Native American population history. Nature 488, 370–374 (2012). [DOI] [PMC free article] [PubMed] [Google Scholar]
- 32.Lipson M, et al. Ancient genomes document multiple waves of migration in Southeast Asian prehistory. Science 361, 92–95 (2018). [DOI] [PMC free article] [PubMed] [Google Scholar]
- 33.McColl H, et al. The prehistoric peopling of Southeast Asia. Science 361, 88–92 (2018). [DOI] [PubMed] [Google Scholar]
- 34.Wang LX, et al. Reconstruction of Y-chromosome phylogeny reveals two neolithic expansions of Tibeto-Burman populations. Mol Genet Genomics 293, 1293–1300 (2018). [DOI] [PubMed] [Google Scholar]
- 35.Ge JX, Wu SD, & Chao SJ Zhongguo yimin shi (The Migration History of China) (Fujian People’s Publishing House, Fuzhou, 1997). [Google Scholar]
- 36.Ning C, et al. Ancient genomes from northern China suggest links between subsistence changes and human migration. Nat. Commun 11, 2700 (2020). [DOI] [PMC free article] [PubMed] [Google Scholar]
- 37.Wei LH, et al. Phylogeography of Y-chromosome haplogroup O3a2b2-N6 reveals patrilineal traces of Austronesian populations on the eastern coastal regions of Asia. PLoS One 12, e0175080 (2017). [DOI] [PMC free article] [PubMed] [Google Scholar]
- 38.Ko AM, et al. Early Austronesians: into and out of Taiwan. Am. J. Hum. Genet 94, 426–36 (2014). [DOI] [PMC free article] [PubMed] [Google Scholar]
- 39.Skoglund P, et al. Genomic insights into the peopling of the Southwest Pacific. Nature 538, 510–513 (2016). [DOI] [PMC free article] [PubMed] [Google Scholar]
- 40.Lipson M, et al. Reconstructing Austronesian population history in island Southeast Asia. Nat Commun 5, 4689 (2014). [DOI] [PMC free article] [PubMed] [Google Scholar]
- 41.Bellwood P T he checkered prehistory of rice movement southwards as a domesticated cereal—from the Yangzi to the equator. Rice 4, 93–103 (2011). [Google Scholar]
- 42.Yang X, et al. Early millet use in northern China. Proc Natl Acad Sci U S A 109, 3726–3730 (2012). [DOI] [PMC free article] [PubMed] [Google Scholar]
- 43.Wilkins S, et al. Dairy pastoralism sustained eastern Eurasian steppe populations for 5,000 years. Nat Ecol Evol 4, 346–355 (2020). [DOI] [PMC free article] [PubMed] [Google Scholar]
- 44.Kovalev A The Great Migration of the Chemurchek People from France to the Altai in the Early 3rd Millennium BCE . International Journal of Eurasian Studies 1(11), pp. 1–58 (2011). [Google Scholar]
- 45.Choongwon J, et al. A dynamic 6,000-year genetic history of Eurasia’s Eastern Steppe. Cell 183, 890–904.e29 (2020). [DOI] [PMC free article] [PubMed] [Google Scholar]
- 46.Ning C, et al. Ancient Genomes Reveal Yamnaya-Related Ancestry and a Potential Source of Indo-European Speakers in Iron Age Tianshan. Curr Biol 29, 2526–2532.e4 (2019). [DOI] [PubMed] [Google Scholar]
- 47.Bellwood P in The Encyclopedia of Global Human Migration (Wiley-Blackwell, New Jersey, 2013). [Google Scholar]
- 48.Mallory JP In Search of the INDO-Europeans: Language, Archaeology and Myth (Thames & Hudson, New York, 1991). [Google Scholar]
- 49.Anthony D The Horse, the Wheel, and Language: How Bronze-Age Riders from the Eurasian Steppes Shaped the Modern World (Princeton University Press, Princeton and Oxford, 2007). [Google Scholar]
- 50.Pinhasi R, Fernandes DM, Sirak K, & Cheronet O Isolating the human cochlea to generate bone powder for ancient DNA analysis. Nat Protoc 14, 1194–1205 (2019). [DOI] [PubMed] [Google Scholar]
- 51.Sirak KA, et al. , A minimally-invasive method for sampling human petrous bones from the cranial base for ancient DNA analysis. Biotechniques 62, 283–289 (2017). [DOI] [PubMed] [Google Scholar]
- 52.Dabney J, et al. Complete mitochondrial genome sequence of a Middle Pleistocene cave bear reconstructed from ultrashort DNA fragments. Proc Natl Acad Sci U S A 110, 15758–63 (2013). [DOI] [PMC free article] [PubMed] [Google Scholar]
- 53.Korlević P Reducing microbial and human contamination in DNA extractions from ancient bones and teeth. Biotechniques 59, 87–93 (2015). [DOI] [PubMed] [Google Scholar]
- 54.Rohland N, Glocke I, Aximu-Petri A, & Meyer M Extraction of highly degraded DNA from ancient bones, teeth and sediments for high-throughput sequencing. Nat Protoc 13, 2447–2461 (2018). [DOI] [PubMed] [Google Scholar]
- 55.Rohland N, Harney E, Mallick S, Nordenfelt S & Reich D Partial uracil–DNA–glycosylase treatment for screening of ancient DNA. Phil. Trans. R. Soc. Lond. B 370, 20130624 (2015). [DOI] [PMC free article] [PubMed] [Google Scholar]
- 56.Gansauge MT, & Meyer M Selective enrichment of damaged DNA molecules for ancient genome sequencing. Genome Res 24, 1543–1549 (2014). [DOI] [PMC free article] [PubMed] [Google Scholar]
- 57.Meyer M, et al. , A high-coverage genome sequence from an archaic Denisovan individual. Science 338, 222–226 (2012). [DOI] [PMC free article] [PubMed] [Google Scholar]
- 58.Maricic T, Whitten M, & Pääbo S Multiplexed DNA sequence capture of mitochondrial genomes using PCR products. PLoS One 5, e14004 (2010). [DOI] [PMC free article] [PubMed] [Google Scholar]
- 59.Rohland N, & Hofreiter M Ancient DNA extraction from bones and teeth. Nat. Protoc 2, 1756–1762 (2007). [DOI] [PubMed] [Google Scholar]
- 60.John JS SeqPrep, https://github.com/jstjohn/SeqPrep (2011). [Google Scholar]
- 61.Li H, & Durbin R Fast and accurate short read alignment with Burrows–Wheeler transform. Bioinformatics, 25, 1754–1760 (2009). [DOI] [PMC free article] [PubMed] [Google Scholar]
- 62.Behar DM, et al. A “Copernican” reassessment of the human mitochondrial DNA tree from its root. Am J Hum Genet 90, 675–84 (2012). Erratum in: Am J Hum Genet. 90, 936 (2012). [DOI] [PMC free article] [PubMed] [Google Scholar]
- 63.Weissensteiner H, et al. HaploGrep 2: mitochondrial haplogroup classification in the era of high-throughput sequencing. Nucleic Acids Res 44, W58–W63 (2016). [DOI] [PMC free article] [PubMed] [Google Scholar]
- 64.Günther T, & Nettelblad C The presence and impact of reference bias on population genomic studies of prehistoric human populations. PLoS Genetics, 15(7), e1008302 (2019). [DOI] [PMC free article] [PubMed] [Google Scholar]
- 65.Kennett DJ et al. Archaeogenomic evidence reveals prehistoric matrilineal dynasty. Nat. Commun 8, 14115 (2017). [DOI] [PMC free article] [PubMed] [Google Scholar]
- 66.Lohse JC, Madsen DB, Culleton BJ & Kennett DJ Isotope paleoecology of episodic mid-to-late Holocene bison population expansions in the southern Plains, U.S.A. Quat. Sci. Rev 102, 14–26 (2014). [Google Scholar]
- 67.Reimer PJ et al. The IntCal20 Northern Hemisphere radiocarbon age calibration curve (0–55 cal kBP). Radiocarbon, 62, 725–757 (2020). [Google Scholar]
- 68.Bronk Ramsey C Bayesian analysis of radiocarbon dates. Radiocarbon, 51, 337–360 (2009). [Google Scholar]
- 69.Rasmussen M, et al. An Aboriginal Australian Genome Reveals Separate Human Dispersals into Asia. Science 334, 94–98 (2011). [DOI] [PMC free article] [PubMed] [Google Scholar]
- 70.Chang C, et al. Second-generation PLINK: rising to the challenge of larger and richer datasets. GigaScience 4, 7 (2015). [DOI] [PMC free article] [PubMed] [Google Scholar]
- 71.Busing FTA, Meijer E, & Leeden R Delete-m Jackknife for Unequal m. Statistics and Computing 9, 3–8 (1999). [Google Scholar]
- 72.Mallick SM, et al. The Simons Genome Diversity Project: 300 genomes from 142 diverse populations, Nature 538, 201–206 (2016). [DOI] [PMC free article] [PubMed] [Google Scholar]
- 73.Monroy KJM, Jakobsson M, & Günther T Estimating genetic kin relationships in prehistoric populations. PLoS One 13, e0195491 (2018). [DOI] [PMC free article] [PubMed] [Google Scholar]
- 74.Ringbauer H, Novembre J, & Steinruecken M Human Parental Relatedness through Time - Detecting Runs of Homozygosity in Ancient DNA. bioRxiv, doi: 10.1101/2020.05.31.126912 (2020). [DOI] [PMC free article] [PubMed] [Google Scholar]
Associated Data
This section collects any data citations, data availability statements, or supplementary materials included in this article.
Supplementary Materials
Data Availability Statement
The aligned sequences are available through the European Nucleotide Archive under accession number PRJEB42781. The newly generated genotype data of 383 modern East Asian individuals have been deposited in Zenodo (https://doi.org/10.5281/zenodo.4058532). The previously published data co-analyzed with our newly reported data can be obtained as described in the original publications which are all explicitly referenced in Online Table 4; a compiled dataset that includes the merged genotypes used in this paper is available as the Allen Ancient DNA Resource at https://reich.hms.harvard.edu/allen-ancient-dna-resource-aadr-downloadable-genotypes-present-day-and-ancient-dna-data. Any other relevant data are available from the corresponding authors upon reasonable request.