

Abstract
The expression of collagen VI in primary ovarian tumors may correlate with tumor grade and response to chemotherapy. We have sought to elucidate the role of collagen VI in promoting ovarian cancer tumor growth and metastasis. Here we examined the effects of collagen VI on ovarian carcinoma stromal progenitor cells (OCSPCs). Epithelial-like OCSPCs (epi-OCSPCs) and mesenchymal-like OCSPCs (msc-OCSPCs) were analyzed by liquid chromatography-mass spectrometry/mass spectrometry (LC-MS/MS). Differentially expressed genes were integrated with survival-related genes using The Cancer Genome Atlas (TCGA) data and confirmed in our samples. The roles of candidate genes and signaling pathways were further explored. We found that SKOV3/msc-OCSPCs possessed greater migration, invasion, and spheroid formation than SKOV3/epi-OCSPCs (P < 0.001). Expression of collagen alpha-3 (VI; COL6A3), which encodes collagen VI, was 90-fold higher in msc-OCSPCs than in epi-OCSPCs. Analysis of TCGA data and our samples indicated that high expression of COL6A3 was correlated with advanced-stage carcinoma (P < 0.01) and shorter overall survival (P < 0.01). In vitro, adding collagen VI, msc-OCSPCs, or knockdown collagen VI in msc-OCSPCs to epithelial ovarian carcinoma (EOC) cells augmented or decreased invasion and spheroid formation. Tumor dissemination to the peritoneal cavity and lung in mice following intraperitoneal coinjection with msc-OCSPCs and SKOV3-Luc cells and intravenous injection with COL6A3 and ES2 cells derived spheroids was significantly greater compare to coinjection with SKOV3-Luc cells alone or in combination with msc-OCSPCs/shCOL6A3 cells and msc-OCSPCs and ES2 derived spheroids. Knockdown of COL6A3 abolished the expression of DNMT1, CDK4, CDK6, and p-Rb in msc-OCSPCs and EOC spheroids. In contrast, overexpression of COL6A3 enhanced the expression of CDK4, CDK6, and p-Rb in SKOV3 cells. EOC spheroid formation, invasion, tumor growth, and metastasis were inhibited when COL6A3 downstream signaling pathway was blocked using CDK4/6 inhibitor LEE011. Our results suggested that collagen VI regulates the CDK4/6-p-Rb signaling pathway and promotes EOC invasiveness, stemness, and metastasis.
Keywords: Collagen VI, ovarian cancer, metastasis, stemness, CDK4/6-p-Rb signaling pathway
Introduction
Ovarian cancer has the highest mortality rate from gynecological cancer in the world [1]. Epithelial ovarian cancer (EOC) is usually diagnosed as advanced stage and has a poor prognosis, with a 5-year survival rate of < 30%, which is mainly due to the incomplete resection of tumor and resistance to chemotherapy drugs [2-4]. Tumor metastasis is highly associated with cancer-related death [5,6]. At least one-third of patients with epithelial ovarian cancer develope ascites, and when women with EOC develope ascites, their five-year survival rate drops sharply from 45% to 5% [7]. Cancer cells can spread to the metastatic site through ascites, which is composed of cancer cells, lymphocytes, mesothelial cells and soluble factors [8]. Cancer metastasis is a complex process that is regulated by the interaction between cancer cells and their microenvironment. Due to the lack of anatomical barriers, ovarian cancer can spread directly to the entire peritoneal cavity. The peritoneum and the greater omentum are common sites of metastasis [9]. Ascites are associated with cancer progression and provide a unique tumor microenvironment [7]; thus, understanding the mechanisms by which ascites regulate the metastasis of ovarian cancer cells is essential.
Cancer remodels the microenvironment by using tumor-secreted factors that affect the extracellular matrix and promote the formation of a premetastatic niche. Whereas cancer cells arise initially from an epithelial-mesenchymal transition (EMT), mesenchymal-epithelial transition (MET), formation of cancer stem cells (CSC), autophagy, and metastatic dormancy are all involved in cancer metastasis [10]. EMT initiates the metastasis of epithelial cancers. During metastasis, these cells form new cancers through MET in secondary site [11]. Previous studies have shown that a subset of carcinoma-associated fibroblasts (CAFs) in peritoneal metastases are derived from mesothelial cells via mesothelial-to-mesenchymal transition (MMT) [12], which is an EMT-like process [13]. The process of MMT changes causes mesothelial cells to become a fibroblast-like phenotype, and has an increased ability to migrate and invade the dense sub-mesothelial area.
Remodeling extracellular matrix through overexpression of collagen VI promotes cisplatin resistance in ovarian cancer cells [14]. The expression of COL6A3 in primary ovarian tumors is related to the degree of tumor differentiation, and can be used as an marker of chemotherapy response and overall survival (OS) [14]. COL6A3 in the tumor microenvironment is the main mediator of COL6-stimulated breast tumor growth and chemoresistance [15]. However, neither the mechanism of COL6A3 control over ovarian tumor cell behavior within the tumor microenvironment nor the key signaling networks activated by COL6A3 have been determined.
To identify molecular determinants underlying EMT in ovarian cancer cells and in the microenvironment of ovarian cancer stromal progenitor cells (OCSPCs) derived from ascites [16,17], we used quantitative liquid chromatography (LC)-mass spectrometry (MS)/MS to determine differential protein expression profiles between epithelial-like and mesenchymal-like OCSPCs. We used The Cancer Genome Atlas (TCGA) dataset (Broad GDAC Firehose database: http://firebrowse.org/) on high-grade advanced-stage serous ovarian cancer samples and correlated survival-related genes. Four genes that overlapped with our LC-MS/MS data were identified: COL6A3, COL5A1, EGFR, and TGFBI. COL6A3 was not previously identified as a marker of survival outcomes in advanced ovarian cancer, and how COL6A3 controls ovarian tumor cell behavior within the tumor microenvironment remains unknown. Thus, we focused our study on COL6A3.
Materials and methods
The institutional review board of our hospital approved the study protocol, and all patients provided informed consent before samples were collected. Ascite samples and ovarian cancer tissues obtained during surgery or for symptom relief in patients with primary or recurrent ovarian cancer were immediately taken to the laboratory for processing.
In vitro isolation and culture of OCSPCs from ascites and cancerous tissues
OCSPCs from ascites were isolated as described previously [16]. To obtain mesenchymal-like OCSPCs, cells were pelleted through centrifugation at room temperature for 5 min at 1500 rpm. To select epithelial-like OCSPCs, mononuclear cells were isolated on a Ficoll-Paque (GE Healthcare Life Sciences, Chicago, IL, USA) gradient and then washed with 2 mmol/L of ethylenediaminetetraacetic acid. A total of 3 × 10⁶ cells were resuspended in culture medium (basal medium A: Dulbecco’s modified Eagle’s medium [DMEM/F12] supplemented with 10% fetal bovine serum [FBS; Hyclone], 10 ng/mL of epidermal growth factor [EGF], and 10 ng/mL of fibroblast growth factor [FGF]-b1; basal medium B: M199 medium supplemented with 10% FBS, 20 ng/mL of EGF, and 0.4 μg/mL of hydrocortisone). Cells were maintained in a humidified chamber with 5% CO2 at 37°C, and the medium was refreshed every 3 days. OCSPCs at passage 4 were harvested for further experiments. Normal or cancerous ovarian tissue samples were minced in Hank’s Balanced Salt Solution (Invitrogen; Grand Island, NY, USA), mixed with 1 mg/mL of collagenase 1A (Sigma-Aldrich, St. Louis, MO, USA), incubated at 37°C for 60 min, filtered through a 70-μm nylon mesh to remove undigested tissue pieces, and centrifuged to obtain cell pellets.
Establishment of stable luciferase-expressing lentivirus or green fluorescent protein cell lines and ES2 or paclitaxel-resistant ES2 cell lines
SKOV3 (CVCL_0532) cells obtained from American Type Culture Collection (ATCC) were transfected with green fluorescent protein (GFP; SKOV3-GFP) or luciferase-expressing lentivirus (SKOV3-Luc) and cultured in McCoy’s 5A medium containing 10% FBS. The ES2 cell line (CVCL_3509) was obtained from ATCC. ES2 cells were maintained in a humidified atmosphere containing 5% CO2 at 37°C and were grown in McCoy’s 5A medium supplemented with 10% FBS. Paclitaxel-resistant ES2 (ES2TR) lines were developed by continuous exposure to paclitaxel. ES2 cells were exposed to increasing concentrations of paclitaxel, as described previously [18]. The final concentration of paclitaxel exposure for paclitaxel-resistant ES2TR subclones was 160 nM. All human cell lines were authenticated using Short Tandem Repeat profiling within the last 3 years. All experiments were performed using mycoplasma-free cells.
Migration and invasion experiments
For invasion assays, we used transwell chambers (8 μm, 24-well format; Corning Inc., Corning, NY, USA) or Matrigel-coated transwell chambers (BD Biosciences, San Jose, CA, USA) that were inserted into 24-well cell culture plates. SKOV3 cells or ES2 cells, ES2 spheroids, ES2TR cells, and ES2TR spheroids (3 × 10⁴ cells in 0.2 mL of serum-free medium) were added to the upper chamber. The following components in 0.2 mL of 5% FBS were added to the lower chambers: COL6 protein (Corning Life Sciences, Bedford, MA, USA) or conditioned medium (CM) from the following cell lines: normal ovarian stromal progenitor cells (NOSPCs), mesenchymal-like (msc)-OCSPCs, msc-OCSPCs knockdown COL6A3 (msc-OCSPCs/shCOL6A3), or msc-OCSPCs/vector. Cells were cultured for 72 h, and cells that migrated or invaded the inserts were fixed in methanol for 20 min, stained with crystal violet, and counted in three random microscope fields (Olympus BX3, Olympus, Tokyo, Japan) at a magnification of 40 ×, 100 ×, or 200 ×.
Spheroid formation by EOC cells
For spheroid formation, SKOV3, ES2, and ES2TR cells were cultured alone or were cocultured with msc-OCSPCs, msc-OCSPCs/shCOL6A3, or msc-OCSPCs/vector under spheroid-inducing conditions: DMEM/F12 containing 20 ng/mL of bFGF, 20 ng/mL of EGF, 10 ng/mL of IGF, and 2% B27 (Invitrogen, Carlsbad, CA, USA) with or without COL6A3 protein. For coculture experiments, cells were seeded at a 1:1 ratio in McCoy’s 5A medium (containing 10% serum, 100 U/mL of penicillin, and 100 μg/mL of streptomycin) and M199 medium (containing 10% FBS, 0.4 μg/mL of hydrocortisone, and 20 ng/mL of EGF). Cells were cultured for 2 weeks, centrifuged, and resuspended in spheroid culture medium. The suspended cells were then transferred to ultralow adherent dishes (Corning 3262, Pittston, PA, USA) and cultured for another week. Spheroid numbers were counted after 7 days under an Olympus light microscope. The spheroids were harvested on Day 14 for fluorescence-activated cell-sorting analysis.
Preparation and quantitative real-time polymerase chain reaction
RNA preparation and measurement were conducted as described previously [18]. Quantitative real-time polymerase chain reaction (QRT-PCR) was performed using an ABI Prism 7300 Sequence Detection System (Applied Biosystems, Foster City, CA, USA) with a Taqman Gene Expression Assay Hs00369360g1 and primers including COL6A3, DNA methyltransferase (DNMT) 1, DNMT3a, TDMT3b, ALDH1, and glyceraldehyde 3-phosphate dehydrogenase (GAPDH; internal control), with the following conditions: 2 min at 50°C, 10 min at 95°C, and then 40 cycles at 95°C for 15 s and at 60°C for 1 min. The interpolated number (Ct) of cycles that reach a fixed threshold above the background noise was used to quantify amplification. The QIAGEN-designed primers for COL6A3 were as follows: F-GTGTTCTCGGTGAGCACCTT; R-CAGCAGTTGAGAGTGATGCTG.
LC-MS/MS analysis
Proteins from the conditioned media were acetone-precipitated, resuspended in a digestion buffer (100 mM ammonium bicarbonate, 1% sodium deoxycholate, 10 mM tris (2-carboxyethyl) phosphine, and 40 mM chloroacetamide), digested with trypsin (protein:trypsin = 50:1, w/w), and desalted. The desalted peptides were resuspended in a sample buffer (2% ACN and 0.5% acetic acid) and subjected to nanoLC-MS/MS analysis. For each treatment condition, duplicate nanoLC-MS/MS runs were performed. NanoLC-MS/MS analysis was performed on a Dionex Ultimate 3000 RSLC system (Thermo Fisher Scientific, Waltham, MA, USA) coupled to an LTQ Orbitrap XL mass spectrometer (Thermo Fisher Scientific) with a nanoelectrospray ionization source. The peptides were loaded and separated on a 200 cm × 100 μm (I.D.) MonoCap C18 HighResolution Ultra 2000 column (GL Sciences, Tokyo, Japan) with a 5 cm × 75 μm (I.D.) MonoSpray FS emitter (GL Sciences). A flow rate of 500 nL/min was applied for sample loading and elution. Peptides were loaded onto the column in 95% buffer A (0.5% acetic acid) and eluted by a gradient of buffer B (80% acetonitrile and 0.5% acetic acid): 5%-40% B over 1440 min (24 h), 40%-99% B for 5 min, 99% B for 10 min, and 5% B for 60 min. The spray voltage was 2.4 kV. In the mass spectrometer, a data-dependent acquisition mode was employed to acquire mass spectra. Precursor ions were scanned, and MS spectra in a range of m/z 300-1600 were acquired using an Orbitrap mass analyzer (full width at half maximum of 60,000 resolution at m/z 400). Subsequent MS/MS scans were acquired from collision-induced dissociation of the ten most intense ions from precursor ions in the linear ion trap mass analyzer.
Processing and label-free quantitation of the LC-MS/MS dataset
All mass spectrometric raw data were processed and analyzed using MaxQuant (v1.5.3.8), and MS/MS spectra were searched using the Andromeda search engine of MaxQuant against a human proteome database downloaded from Uniprot (v2016.05). Enzyme specificity was Trypsin/P, and up to two missed cleavages were allowed. Carbamidomethylation on cysteine was set as a fixed modification. The oxidation of methionine and acetylation at the protein N-terminus were set as variable modifications. The maximal tolerance of peptide mass error in the main search was 6 ppm. Mass tolerance for fragment ions in MS2 spectra was 0.5 Da. Randomized protein sequences and a list of contaminants were used to evaluate false discovery rates (FDRs) of protein identification. Both FDRs of protein and peptide identification were set at 1%. We applied label-free quantitation or the MaxLFQ algorithm of MaxQuant to quantify identified proteins. Further bioinformatics analysis was performed using Perseus (v1.5.5.3). Potentially regulated proteins were identified using ANOVA (P < 0.01) in Perseus. The volcano plots (FDR < 0.01) were also generated using Perseus.
Plasmids, shRNA, overexpression, and transfection
COL6A3 knockdown was performed using human pLKO.1 lentiviral shRNA plasmids from The RNAi Consortium. The target sequences of the shRNA constructs were as follows: COL6A3#1 5’-GCTTTGCACATATTCGAGATT-3’; COL6A3#2 5’-GCCCTCATCCAAAGCATCAAA-3’; COL6A3#3 5’-CGCGACTTTGTAATGAACCTA-3’; COL6A3#4 5’-CCTTAATCTATGTGCACCGTT-3’; COL6A3#5 5’-GTGGTTAAGATGCTCCGTGAA-3’.
Cells with a high expression of COL6A3 were infected with lentiviral shRNA plasmids and selected in medium containing 2 μg/mL of puromycin. COL6A3 expression in isolated clones was analyzed by real-time PCR and Western blotting.
COL6A3 overexpression was performed using COL6A3 plasmids (linearized; provided from Omics Biotech). SKOV3 cells with a low expression of COL6A3 were cultured in McCoyred5A medium (10% FBS and penicillin-streptomycin). COL6A3 plasmids were transfected into SKOV3 cells by following the lipofectamine 2000 transfection protocol (2.5 μp linearized DNA/well). The transfected cells were used with G418 for selection (stock conc. is 100 mg/ml), and maintenance with medium: McCoym: 5A medium (10% FBS and penicillinstreptomycin) + 100 ug/ml G418.
Flow cytometric analysis of ALDH1
The percentage of OCSPCs, ES2 cells, ES2TR cells, ES2 spheroids, and ES2TR spheroids cocultured with COL6A3 or msc-OCSPCs that were ALDH1-positive was analyzed through flow cytometry (FACSCalibur, BD Biosciences) using fluorescein isothiocyanate- or phycoerythrin-conjugated antibodies against ALDH1.
Western blot analysis
Cells were lysed in phosphate-buffered saline (PBS) containing 1% Triton X-100 using an ultrasonic cell disruptor. Lysates were separated using SDS-PAGE (12.5%) and transferred to a polyvinylidene fluoride membrane (NEN). The membranes were blocked in blocking buffer (tris-buffered saline containing 0.2% Tween 20 and 1% I-block [NEN]) and incubated with polyclonal antibodies (Ab) separately for 1 h. A purified rabbit antihuman GAPDH polyclonal Ab (Santa Cruz Biotechnology, Inc., Dallas, TX, USA) was applied simultaneously to normalize the signals generated from the anti-COL6A3, DNMT1, DNMT3A, DNMT3B, E-cadherin, vimentin, EZH2, PIK3Ip1, p53, CDK4/6, Rb, p-Rb, and cyclin D1 Abs (Cell Signaling). After washing, an alkaline phosphatase-conjugated anti-rabbit Ab (Vector Laboratories, Burlingame, CA, USA) was applied. The membranes were washed, and the bound Abs were visualized by developing the nitro blue tetrazolium/5-bromo-4-chloro-3-indolyl phosphate chromogen.
Immunohistochemistry
Formalin-fixed and paraffin-embedded specimens were sliced by a microtome to a thickness of 1-3 μm and placed on coated slides. The tissue slides were then incubated with a purified rabbit monoclonal antibody of CDK4, CDK6, p-Rb, Rb, and RMab (Bio SB, Santa Barbara, CA, USA) by using a Thermo Scientific Autostainer 360 (Thermo Fisher Scientific Inc.). A pathologist not involved in the present study evaluated the immunostaining under blinded conditions. Cytoplasmic and nuclear staining were evaluated, and the intensities of both were scored on a scale from 0 to 3, where 0 = negative, 1 = week, 2 = moderate, and 3 = strong staining.
Analysis of TCGA data and ovarian cancer tissue samples
The TCGA dataset (n = 302) primarily included high- and advanced-stage serous ovarian cancer samples. A total of 744 survival-related genes (P < 0.01) were identified in 302 ovarian cancer samples by using the Cox proportional-hazards model in the R package. Genes overlapping with LC-MS/MS data were identified as follows: The values of candidate genes (Log2 (mesenchymal-like OCSPCs/epithelial-like OCSPCs ≥ 1 were considered. COL6A3 expression is presented as mean ± standard deviation. Clinical parameters affecting survival outcome such as International Federation of Gynecology and Obstetrics stage (early vs advanced) and operation status (optimal vs suboptimal debulking) were analyzed in our samples.
In vivo animal experiments and tumor imaging
Female null mice (BALB/cAnN.Cg-Foxn1nu/CrlNarl) were purchased from the National Animal Center (Taipei, Taiwan), and all experiments were approved by the Institutional Animal Care and Use Committee of Cathay General Hospital. In the first experiments, null mice at 5-7 weeks of age (6 mice/group) were coinjected intraperitoneally with 3 × 10⁶ msc-OCSPCs and 1 × 10⁶ SKOV3-Luc cells (IP). The msc-OCSPC cells were either COL6A3 knockdown cells (msc-OCSPCs/shCOL6A3) or vector alone control cells (msc-OCSPCs/mock). In the second experiments, null mice (6 mice/group) were injected with 1 × 10⁶ ES2 cells and COL6A3-derived spheroids or 1 × 10⁶ ES2 cells and msc-OCSPCs-derived spheroids (IV; tail vein), In the third experiments, mice (3 mice/group) were inoculated subcutaneously (SC) in bilateral flanks and IP with 1 × 10⁶ ES2 spheroids or ES2TR160 spheroids pretreated with or without 250 mg/kg/day LEE011 (PO). The numbers of tumors disseminated in the abdominal cavity or lung were examined in IVIS image system images and/or gross examination after mice were sacrificed. Tumor volumes were measured every week. Tumor growth was measured using calipers, and volume was calculated based on the modified ellipsoid formula (Vol = L × W × W/2). All experiments were carried out in duplicate. Bioluminescence optical images (Xenogen IVIS 2000, Caliper Life Sciences, Waltham, MA, USA) were obtained weekly after tumor cell injections. Tumor weights were measured following euthanasia at the end point. The histologic examination of tumor growth in the resected lung was confirmed during H&E and CDK4, CDK6, pRb, and Rb staining for tumor and nontumor areas.
Reagents/antibodies
COL6A3 inhibitor (pioglitazone and thiazolidinedione), DNMT1 inhibitor (5-AZA-dC), and CDK4/6 inhibitor (LEE011) were purchased from Novartis Pharma AG (Taiwan). The ECL Western blotting detection reagents were from Perkin Elmer (Boston, MA, USA). Antibodies recognizing COL6A3, DNMT1, DNMT3A, DNMT3B, CDK4/6, p-Rb, E-cadherin, vimentin, and GAPDH were purchased from Cell Signaling Technology (Beverly, MA, USA). The Cell Titer 96-well proliferation assay kit was obtained from Promega (Madison, WI, USA). Paclitaxel was obtained from Genetaxyl Crem Less Company.
Statistical analysis
Data were analyzed using SPSS 16.0 (SPSS Inc., Chicago, IL, USA). All numerical data are expressed as the mean ± SD from at least three experiments. Significant differences between two groups were determined using the Student’s t test, and significant differences among more than two groups were determined using one-way ANOVA. Progression-free survival (PFS) and OS were calculated through the Kaplan-Meier method. Differences in survival curves were calculated using the log-rank test. Cox’s univariate and multivariate regression analyses were used to evaluate prognostic factors for survival, and P < 0.05 was considered statistically significant.
Results
msc-OCSPCs enhanced the migration, invasion, and spheroid aggregation of EOC
We isolated two morphologically different adherent cell populations of OCSPCs from EOC patient ascites cultured in selective conditional media, as previously described [16,17]. Epithelial-like OCSPCs (epi-OCSPCs) with reduced tumor suppressor gene expression in the ovarian tumor microenvironment could promote tumorigenesis, which could be reversed through DNA demethylation [17]. Cancer-associated mesenchymal cells have been reported to promote the migration of cancer cells [19]. We reasoned that msc-OCSPCs could enhance the migration and invasion ability of ovarian cancer cells. ES2, ES2TR, and SKOV3 cells were metastatic and were used for the following experiments. The SKOV3/msc-OCSPCs possessed higher migration and invasion abilities than did SKOV3/epi-OCSPCs and NOSPCs (P < 0.001; Figure 1A upper and middle panel). In addition, the spheroid aggregation of SKOV3 cells cocultured with msc-OCSPCs was more developed than that of SKOV3 cells cocultured with epi-OCSPCs (P < 0.01; Figure 1A lower panel). We repeated the experiment using COL6A3 knockdown msc-OCSPCs. COL6A3 expression levels were significantly reduced after COL6A3 knockdown using COL6A3 shRNA transfected in msc-OCSPCs (OCSPCs-shCOL6A3-ID22-26 [m22-26]) compared with vector control transfectants (m-v; P < 0.0001; Figure 1B left). The invasiveness of the SKOV3 cells was significantly inhibited by COL6A3 knockdown (msc-OCSPCs/shCOL6A3) in experiments using two independent COL6A3 shRNAs compared with COL6A3 mock-controls (msc-OCSPCs/mock-COL6A3; P < 0.001: Figure 1B right). ES2 and ES2TR cells were highly metastatic. The invasiveness of ES2 cells, ES2TR cells, and their spheroids cells was also significantly inhibited by COL6A3 knockdown compared with the mock-controls (P < 0.001; Figure 2A and 2B).
Figure 1.

Migration, invasion, and spheroid formation in epithelial ovarian carcinoma cells with ovarian cancer stromal progenitor cells (OCSPCs). (A upper panel) Migration and (A middle panel) invasiveness of SKOV3 or SKOV3-green fluorescent protein (GFP) cells/mesenchymal-like OCSPCs (msc-OCSPCs) compared with SKOV3 or SKOV3-GFP cells/epithelial-like OCSPCs (epi-OCSPCs) and normal ovarian stromal progenitor cells, which were derived from benign ascites. OCSPCs were derived from malignant ascites. (A lower panel) Spheroid formation from SKOV3 cells or SKOV3-GFP cells cocultured with mesenchymal-like OCSPCs (SKOV3/msc-OCSPCs) compared with spheroid formation from SKOV3 cells or SKOV3-GFP cells cocultured with epi-OCSPCs cells (SKOV3/epi-OCSPCs) for 7 or 14 days. (B right) Collagen alpha-3 (VI; COL6A3) expression in OCSPCs following the shRNA knockdown of COL6A3 RNA. m: msc-OCSPCs; m-v: msc-OCSPCs/mockCOL6A3; m22-26: msc-OCSPCs/shCOL6A3. (B left) Invasiveness of SKOV3 cocultured with msc-OCSPCs or msc-OCSPCs/shCOL6A3 cells for 1-3 days.
Figure 2.
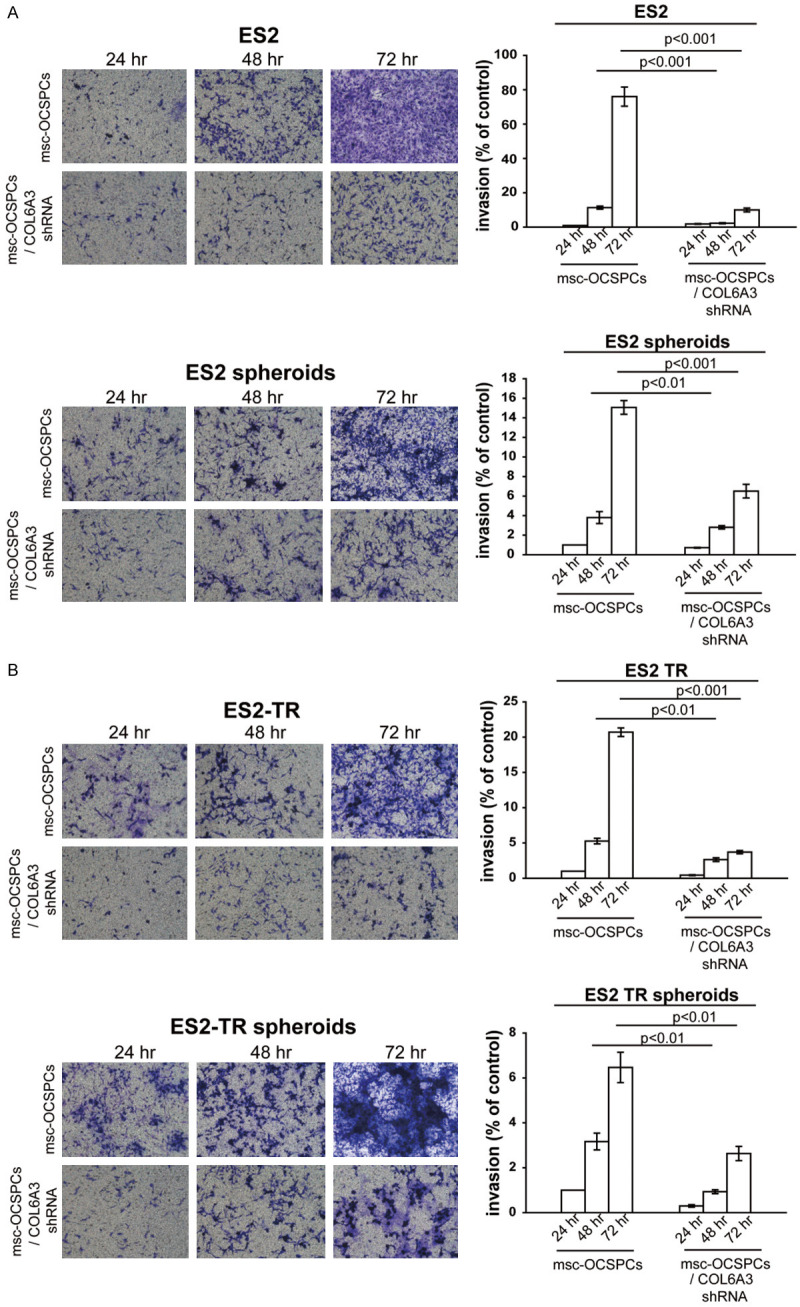
(A) Invasiveness of ES2 and ES2 spheroids, and (B) ES2TR and ES2TR spheroids cocultured with either msc-OCSPCs or msc-OCSPCs/shCOL6A3 for 1-3 days.
COL6A3 was abundant in msc-OCSPCs, EOC spheroids, and primary and metastatic EOC tumor tissues
To determine which proteins in conditional media from msc-OCSPCs participate in tumor cell migration through EMT and stemness, conditional media were prepared for proteomic analysis from four groups of OCSPCs grown under serum-free conditions: msc-OCSPCs, epi-OCSPCs, msc-NOSPCs, and msc-OCSPCs treated with 5AZA-dC. The total proteins from the conditional media were acetone-precipitated, resuspended in a digestion buffer, digested with trypsin, and analyzed using LC-MS/MS to identify differentially expressed genes. Genes differentially expressed between msc-OCSPCs and epi-OCSPCs are presented in Table 1. COL6A3, a mesenchymal-associated gene, showed significantly higher expression in the spindle subtype OCSPCs and EOC spheroids than in the epithelial subtype of OCSPCs or ovarian cancer cell lines (Figure 3A). Higher levels of COL6A3 were detected in msc-OCSPCs derived from recurrent malignant ascites (> 4980-fold) and primary malignant ascites from advanced ovarian cancer (> 198-fold) than in epi-OCSPCs. The relevance of this high expression, the spindle, and the “mesenchymal” subtype suggested that COL6A3 may participate in the EMT-prone phenotype of ovarian cancer cells. Furthermore, COL6A3 expression was significantly higher in advanced ovarian cancer patient tissues (n = 32) than in early ovarian cancer patient tissues (n = 38; 13.65 ± 14.30 vs 3.66 ± 4.32, respectively, P < 0.0001) and in benign ovarian cysts (n = 8; 13.65 ± 14.30 vs 1.08 ± 0.30, respectively, P = 0.009; Figure 3B). COL6A3 expression was significantly higher in pairs of metastatic omentum tissue (n = 3) and in primary ovarian cancer tissues (n = 3) than in benign ovarian cysts (n = 8; P < 0.01; Figure 3C). Taken together, the results showed that COL6A3 was highly expressed in both primary and metastatic ovarian cancer tissues such as omentum and stromal cells (msc-OCSPCs) within the tumor microenvironment but exhibited much lower expression in benign tissues and epi-OCSPCs. These results suggested that metastatic and ovarian cancer tissues and msc-OCSPCs in the tumor microenvironment upregulated COL6A3 expression, which suggested the supporting role of stromal cells expressing COL6A3 in metastasis.
Table 1.
Differential gene expression in proteomic analysis between mesenchymal-like ovarian cancer stromal progenitor cells and epithelial-like ovarian cancer stromal progenitor cells
| Protein names | Gene names | Log2 (E/M) |
|---|---|---|
| Aminopeptidase N | ANPEP | -2.0 |
| Annexin A2 | ANXA2; ANXA2P2 | -2.0 |
| ATP synthase subunit alpha | ATP5A1 | -2.1 |
| Pentraxin-related protein PTX3 | PTX3 | -2.1 |
| Endoglin | ENG | -2.3 |
| Neuropilin-1 | NRP1 | -2.3 |
| Nidogen-2 | NID2 | -2.5 |
| Periostin | POSTN | -2.5 |
| Fibronectin | FN1 | -2.5 |
| Angiotensin-converting enzyme | ACE | -2.6 |
| Plasma protease C1 inhibitor | SERPING1 | -2.8 |
| Annexin A6 | ANXA6 | -3.0 |
| Fibulin-2 | FBLN2 | -3.1 |
| SPARC | SPARC | -3.3 |
| Collagen alpha-1 (XVIII) chain | COL18A1 | -3.4 |
| Fibrillin-1 | FBN1 | -3.8 |
| Collagen alpha-1 (V) chain | COL5A1 | -3.8 |
| Collagen alpha-3 (VI) chain | COL6A3 | -6.6 |
| Nidogen-1 | NID1 | -6.7 |
| Collagen alpha-1 (VI) chain | COL6A1 | -8.2 |
Note: E represents epithelial-like ovarian cancer stromal progenitor cells. M represents mesenchymal-like ovarian cancer stromal progenitor cells.
Figure 3.

Collagen alpha-3 (VI; COL6A3) expression levels are correlated with survival and clinicopathological parameters. (A) COL6A3 expression in mesenchymal-like ovarian cancer stromal progenitor cells (OCSPCs), epithelial-like OCSPCs, and several ovarian cancer cell lines. (B) COL6A3 expression levels in advanced ovarian cancer tissues (n = 29), benign tissues (n = 8), and early-stage ovarian cancer tissues (n = 32). (C) COL6A3 expression levels in benign ovarian tissue, EOC, and metastatic omentum. (D) COL6A3 expression levels in stage II (n = 20), stage III (n = 243), and stage IV (n = 38) high-grade serous ovarian carcinoma derived from TCGA data analysis. (E) Effect of high (n = 76) or low (n = 223) expression of COL6A3 on the survival of patients with high-grade serous ovarian cancer. TCGA RNAseq data were analyzed. (F) Overall survival (OS) and (G) progression free survival (PFS) in Cathay General Hospital patients with ovarian cancer and high or low expression of COL6A3 (P = 0.004 in OS; P = 0.009 in PFS). (H) COL6A3 expression levels with clinicopathologic parameters of the primary ovarian cancer patients in Cathay General Hospital.
COL6A3 expression correlated with advanced stage and poor survival in EOC
We examined the putative correlation between COL6A3 expression and advanced stage and poor survival. To identify poor outcome gene signatures, we used the TCGA dataset (n = 369), which primarily included high-grade and advanced-stage serous ovarian cancer samples. Expression data and clinical data for the TCGA dataset were downloaded from the TCGA data portal (https://tcgadata.nci.nih.gov/tcga/tcgaHome2.jsp) and the Gene Expression Omnibus website (http://www.ncbi.nlm.nih.gov/gds/), respectively. COL6A3 expression was significantly higher in stage III (n = 243) samples than in stage II samples (n = 20; P = 0.046; Figure 3D). We assessed the possible association between COL6A3 and survival through Kaplan-Meier analysis. Log-rank test analysis of the TCGA RNAseq data indicated that advanced ovarian cancer patients exhibiting higher expression (> median level) of COL6A3 had a shorter OS rate than did those with lower expression (< median level) of COL6A3 (P = 0.0093; Figure 3E). COL6A3 expression levels (high vs low) for OS were significantly different in univariate analysis (P = 0.020). In multivariate analysis, age (HR: 1.2, 95% CI [1.08-1.4], P = 0.002) and stage (HR: 1.4, 95% CI [1.03-1.8], P = 0.032) were independent factors in OS. In multivariate analysis, COL6A3 expression levels (high vs low) exhibited a trend toward association but failed to reach statistical significance (HR: 1.3, 95% CI 0.99-1.7, P = 0.06). However, the COL6A3 expression level (high vs low) was an independent factor for OS in stage IV patients after adjusting for age (HR: 2.0, 95% CI 1.0-3.9, P = 0.049 for COL6A3; HR: 1.2, 95% CI 0.84-1.7, P = 0.330 for age). Analysis of OS and PFS in our patients with ovarian cancer revealed that those with higher expression of COL6A3 had shorter OS (P = 0.004; Figure 3F) and shorter PFS (P = 0.009; Figure 3G) than did patients with lower expression of COL6A3. With a median follow-up of 60 months, the 5-year OS in patients with ovarian cancer was 48% for those with high expression of COL6A3 and 93% for those with low expression of COL6A3 (P = 0.004; Figure 2F). Correlation analysis of expression levels of COL6A3 with the clinicopathological parameters of our patients with primary ovarian cancer indicated that COL6A3 mRNA levels were associated with stage (P = 0.007) and debulking status (P = 0.032; Table 2). COL6A3 mRNA levels were not associated with histological subtype (serous vs non-serous, P = 0.765) and age (P = 0.672). COL6A3 mRNA levels were higher in the advanced-stage and suboptimal debulking group than in the early-stage and optimal debulking group, respectively (median [COL6A3/GAPDH]: advanced stage [9.57] vs early stage [2.45], P = 0.001; suboptimal debulking [9.56] vs optimal debulking [2.62], P = 0.000; Figure 3H). Advanced stage and residual tumor > 1 cm (suboptimal debulking) were regarded as the two most crucial prognostic factors in patients with ovarian cancer.
Table 2.
Correlation between clinicopathological characteristics and collagen alpha-3 (IV) expression in 64 patients with epithelial ovarian cancer
| Parameter | Low COL6A3 expression | High COL6A3 expression | p value |
|---|---|---|---|
| Patient numbers | 33 | 31 | |
| Age | 52 (26-78) | 54 (32-85) | 0.672 |
| Histologic subtype | 0.765 | ||
| serous | 18 | 16 | |
| non-serous | 17 | 13 | |
| Diseas disease | 0.007 | ||
| Early (I + II) | 25 | 11 | |
| Advanced (III + IV) | 10 | 18 | |
| Operation status | 0.032 | ||
| optimal debulking | 29 | 17 | |
| subopitimal debulking | 6 | 12 |
Note: optimal debuking (residual tumor < 1 cm); suboptimal debulking (residual tumor > 1 cm).
COL6 or msc-OCSPCs CM enhanced the invasiveness of EOC, and the knockdown of COL6A3 in OCSPCs inhibited the invasiveness of EOC and spheroids
We hypothesized that COL6 may enhance the invasiveness of tumor cells. We performed a transwell experiment in which SKOV3 cells (3 × 10⁴) were seeded in the upper chamber, and 750 μL of SKOV3 was conditioned in serum-free medium containing 0, 5, 25, or 50 μg of the COL6 protein placed in the lower chamber. We examined whether adding COL6 enhanced the invasiveness of SKOV3 cells. We discovered that the invasiveness was enhanced by increasing the concentration of COL6 proteins (P < 0.001; Figure 4A). We examined the effect of OCSPC CM on transwell invasion. SKOV3 cells (3 × 10⁴) were seeded in the upper chamber, and 750 μL serum-free M199 medium (serum-free) or 750 μL of OCSPC CM (msc-OCSPCs CM; prepared from msc-OCSPCs grown in medium containing 10% FBS, 0.4 μg/mL of hydrocortisone, and 20 ng/mL of EGF) was placed in the lower chamber. We discovered that the invasiveness was enhanced by increasing the amount of msc-OCSPCs CM (P < 0.001; Figure 4B).
Figure 4.
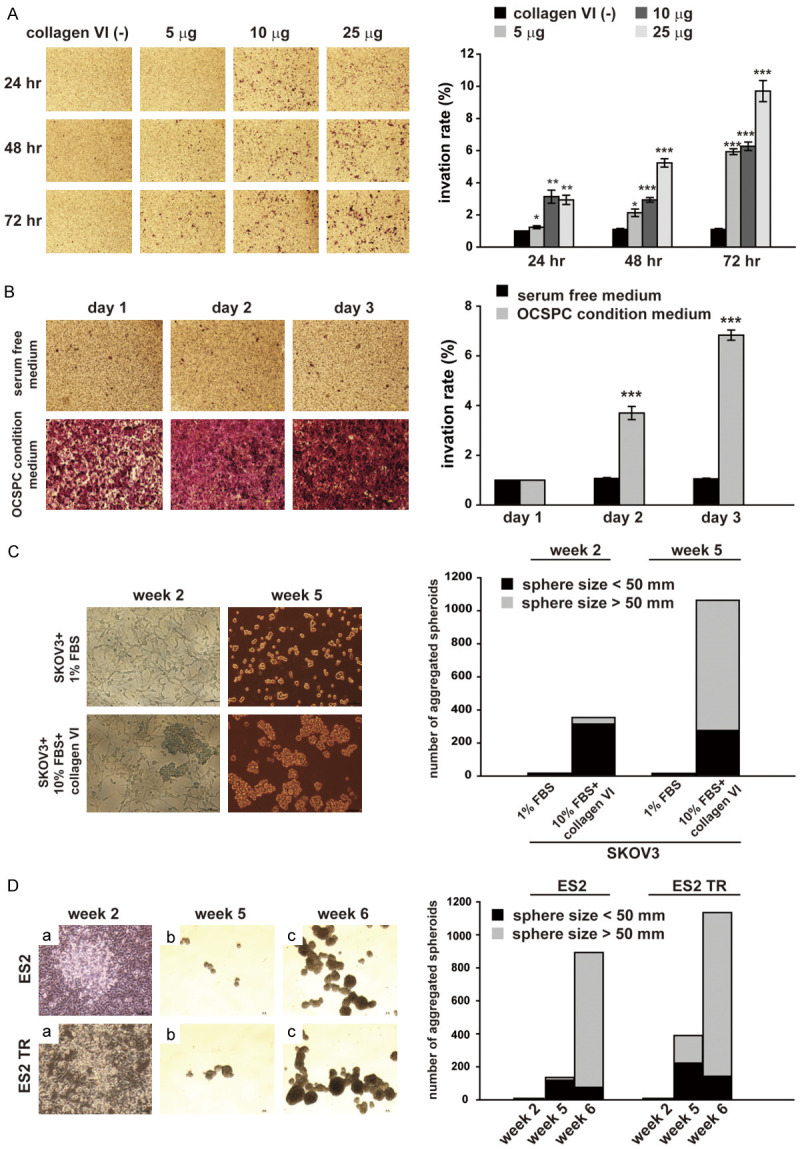
Effect of Collagen IV (COL6) or ovarian cancer stromal progenitor cell (OCSPC) conditional medium with epithelial ovarian cancer cells. (A) Effect of COL6 or (B) OCSPCs on transwell invasion. SKOV3 cells (3 × 10⁴) were seeded in the upper chamber. (A) 750 μL of SKOV3 conditioned medium (CM; serum-free) containing 0, 5, 25, or 50 μg of COL6 protein was placed in the lower chamber. (B) 750 μL of serum-free M199 medium or 750 μL of OCSPC CM was placed in the lower chamber. Cultures were incubated for 24, 48, or 72 h. (C) Formation of aggregated spheroids from SKOV3 cells, which were cultured in medium with either 1% FBS or 10% FBS and COL6 protein for 2 weeks before the medium was replaced with Dulbecco’s modified Eagle’s medium (DMEM)/F12 medium, and the cultures were continued for 3 more weeks. (D) Spheroid formation in ES2 and ES2TR cells. Cells were cultured in McCoy’s 5A medium with the addition of 35 mg/mL of COL6 protein twice a week for 4 weeks. Cells were then washed, transferred to ultralow adherent dishes in DMEM/F12 medium, and cultured for 1 or 2 more weeks.
COL6 enhanced spheroid formation in EOC, and COL6A3 knockdown in OCSPCs inhibited spheroid formation in EOC
We then tested if COL6 proteins enhanced spheroid growth. SKOV3 cells were cultured with COL6 proteins in 10% FBS for 2 or 5 weeks and then transferred to a spheroid culture medium. We noted that the number of spheroids was markedly increased compared with SKOV3 cells grown without COL6 proteins added (Figure 4C). We further tested whether COL6A3 proteins enhanced ES2 spheroid formation. ES2 or ES2TR cells were cultured in McCoy’s 5A medium (contain 10% serum, 100 units/mL of penicillin, and 100 μg/mL of streptomycin) with COL6 proteins (25 mg/mL added twice/week) for 4 weeks and then transferred to a spheroid culture medium. We discovered that the number of spheroids markedly increased (Figure 4D). By contrast, when ES2 and ES2TR cells were cocultured with msc-OCSPCs/shCOL6A3 for 2 weeks and then transferred to a spheroid culture medium, the development of spheroids (≥ 50 nM) was markedly reduced compared with spheroids in cocultures with msc-OCSPCs (Figure 5A and 5B). Since the role of stem cells in EOC has not been established, ALDH1 is a presumable stem cell marker in vitro but may not in vivo when human tissues are analyzed. ALDH1 expression was similar between ES2 and ES2TR spheroids and between ES2 or ES2TR parental cells cocultured with msc-OCSPCs (Figure 5C and 5D). ALDH1 expression assessed through flow cytometry was significantly higher in ES2 or ES2TR parental cells cocultured with COL6A3 than in ES2 or ES2TR parental cells (P < 0.001; Figure 5E and 5F). ALDH1 expression was significantly reduced in msc-OCSPCs/shCOL6A3 compared with expression in msc-OCSPCs (P < 0.01; Figure 5G).
Figure 5.

(A) Spheroid formation by ES2 or (B) ES2TR cells. Cells were cocultured with mesenchymal-like (msc)-OCSPCs or msc-OCSPCs/shCOL6A3. ES2 cells were cocultured with msc-OCSPCs. Cells were seeded at a 1:1 ratio in McCoy’s 5A medium and M199 medium. Cells were cultured for 2 weeks, centrifuged, and resuspended in spheroid culture medium: DMEM/F12 medium. Cell suspensions were then transferred to ultra-low adherent dishes and cultured for 1 more week. (C) quantitative real-time polymerase chain reaction analysis of ALDH1 expression levels among ES2, ES2 spheroids, and ES2 cocultured with msc-OCSPCs. (D) ALDH1 expression among ES2TR, ES2TR spheroids, and ES2TR cocultured with msc-OCSPCs. (E) Flow cytometric analysis of the percentage of cells that were ALDH1 positive (percent of control MFI) among ES2, ES2 spheroids, ES2 cocultured with msc-OCSOCs, and ES2 with the addition of COL6A3 and (F) among ES2TR, ES2TR spheroids, ES2TR cocultured with msc-OCSOCs, and ES2TR with the addition of COL6A3. (G) Analysis of the percentage of cells that were ALDH1 positive (percent of control MFI) between msc-OCSOCs and msc-OCSOCs/shCOL6A3.
IP coinjection with msc-OCSPCs and EOC enhanced tumor growth and metastasis
To determine the capacity of OCSPCs to enhance EOC tumor growth and metastasis, msc-OCSPCs and SKOV3-Luc indicator cells were coinjected (IP) into the peritoneal cavity of null mice. Luciferase activity and gross metastatic tumor growth were enhanced in the peritoneal cavity in mice (n = 6) following coinjection with msc-OCSPCs and SKOV3-Luc cells compared with coinjection with PBS and SKOV3-Luc cells (P < 0.01, Student’s t test; Figure 6A).
Figure 6.

Tumor dissemination and metastasis in vivo. A. Luciferase activity and disseminated tumors growth in mice (n = 3 in each group) after intraperitoneal (IP) coinjection with ovarian cancer stromal progenitor cells (OCSPCs) or phosphate-buffered saline (PBS) and SKOV3-Luc cells. Comparison of SKOV3 + OCSPCs tumors and SKOV3 + PBS tumors after 5 weeks. B. Disseminated tumor growth and numbers of peritoneal cavities in mice (n = 3 in each group) following IP injection with sham (PBS), SKOV3 cells, SKOV3 with mesenchymal-like (msc)-OCSPCs, and SKOV3 with msc-OCSPCs/shCOL6A3. C. Luciferase activity and disseminated tumors growth in mice (n = 3 in each group) after intraperitoneal (IP) coinjection with ovarian cancer stromal progenitor cells (OCSPCs) or knockdown COL6A3 OCSOCs (shRNA COL6A3) and SKOV3-Luc cells. Comparison of SKOV3 + OCSPCs tumors and SKOV3 + shRNA COL6A3 tumors after 5 weeks. D. Histologic images of disseminated tumor growth in lung in mice (n = 6 in each group) after intravenous (IV) injection with ES2 and COL6A3 derived tumorspheres (TS) or ES2 and msc-OCSPCs derived TS cells. Comparison of ES2 and COL6A3 derived TS and ES2 and msc-OCSPCs derived TS cells after 5 weeks. The yellow arrow indicates the tumor area (40 ×).
Coinjection of COL6A3 knockdown msc-OCSPCs with EOC cells reduced the severity of metastasis to the abdominal cavity
We examined the growth inhibitory effect of knock down of COL6A3 expression in msc-OCSPCs and on growth of SKOV3-Luc cells in vivo. We employed a xenograft model in which null mice were coinjected with 3 × 10⁶ msc-OCSPCs and 1 × 10⁶ SKOV3-Luc cells (IP). The msc-OCSPC cells were either COL6A3 knockdown cells (msc-OCSPCs/shCOL6A3) or vector alone control cells (msc-OCSPCs/mock), as described in the Materials and Methods section. The luciferase activity and numbers of tumors disseminated in the abdominal cavity significantly decreased in mice (n = 6) receiving msc-OCSPCs/shCOL6A3 cells compared with mice (n = 6) receiving msc-OCSPCs/mock cells (P < 0.05, Student’s t test; Figure 6B and 6C).
IV injection with ES2 cells and COL6A3-derived spheroids promoted metastasis
We reasoned that EOC with COL6A3 derived spheroids promoted metastasis. We examined the metastasis-promoting effect of COL6A3 expression in mice injected with ES2 cells and COL6A3-derived spheroids in vivo. We employed a xenograft model in which null mice were injected with 1 × 10⁶ ES2 cells and COL6A3-derived spheroids, as described in the Materials and Methods section. Metastases in the lung were observed following tail vein injections with ES2 cells with COL6A3-derived spheroids. Representative pictures during histologic examination of tumors disseminated in the lung were noted in mice receiving ES2 cells with COL6A3-derived spheroids (Figure 7). Immunohistochemistry cytoplasmic and nuclear staining for CDK4 was strong in tumor areas. The nuclear staining for CDK6 and p-Rb was weak to moderate in tumor areas. However, the nuclear staining for Rb were diffuse strong in tumor areas (Figure 7). Above data indicate CDK4-CDK6-(p-) Rb may involve in ES2 cells with COL6A3-derived spheroids generated tumors.
Figure 7.

CDK4 and Rb overexpression in the tumor of the resected lung after IV injection with ES2 cells and COL6 derived spheroids. Histologic images of H&E staining and CDK4, CDK6, p-Rb, and Rb staining of tumor growth in the resected lung after IV injection with ES2 cells and COL6 derived spheroids. The black frame indicates the tumor area (40 × and 200 ×). The intensity of CDK6 and p-Rb were weak to moderate staining in nucleus (40 × and 200 ×).
Comparison and validation the metastasis ability between IV injection with ES2 cells and COL6A3-derived spheroids and ES2 cells and msc-OCSPCs derived spheroids
We validated and examined if ES2 with COL6A3 derived spheroids is superior to ES2 with msc-OCSPCs derived spheroids which could promote lung metastasis. We employed a xenograft model in which null mice were injected with 1 × 10⁶ ES2 cells and COL6A3-derived spheroids or 1 × 10⁶ ES2 cells and msc-OCSPCs derived spheroids, as described in the Materials and Methods section. Six out of 6 mice (6/6) underwent metastases in the lung were observed following tail vein injections with ES2 cells with COL6A3-derived spheroids compared to two out of 6 mice (2/6) were observed following tail vein injections with ES2 cells with msc-OCSPCs derived spheroids (P = 0.014) (Figure 6D).
COL6A3 regulated CDK4/6, and the p-Rb signaling pathway to inhibit tumor growth and metastasis
Our previous study demonstrated Inhibiting COL6A3 reduced the tumorigenicity of EOC spheroids in vivo (unpublished data). We next examined the possible downstream signaling pathway of COL6A3 in EOC spheroids and msc-OCSPCs. DNMTs, p-RB, CDK4, CDK6, and vimentin are downstream signaling molecules whose expression was decreased in EOC/shCOL6A3 spheroids and msc-OCSPCs/shCOL6A3 compared to mock-shCOL6A3 (Figure 8A). We observed that expression of CDK4/6 and pRB was high in EOC spheroids cells (Figure 8A). Expression of DNMT1, CDK4, CDK6, and pRB was reduced in EOC spheroids when COL6A3 downstream signaling pathway was blocked with LEE011, a CDK4/6 inhibitor (Figure 8B and 8C). Notably, CDK4/6 inhibitor LEE011 did not decrease COL6A3 expression in EOC spheroids (Figure 8D). We performed a further knockdown of the COL6A3 downstream signaling pathway through CDK4/6-pRB using LEE011 to determine if reduction of CDK4/6-pRB inhibited invasiveness of EOC spheroids. We found that invasiveness of EOC and EOC spheroids was significantly inhibited by treatment with 1 μM LEE011 (Figure 8E). Moreover, invasiveness of SKOV3 cells was also significantly inhibited by msc-OCSPCs treated with 1 μM LEE011 (data not shown). We further validated if overexpression of COL6A3 regulated CDK4/6 and the p-Rb signaling pathway in EOC cells. In contrast, overexpression of COL6A3 increased CDK4, CDK6, and p-Rb expression in SKOV3 cells (Figure 9). Our results indicated COL6A3 regulated CDK4/6 and the p-Rb signaling pathway. LEE011 decreased cell growth of both SKOV3 and msc-OCSPCs in a dose-dependent manner (Figure 10A and 10B). Spheroid numbers were further decreased in EOC/shCOL6A3 spheroids treated with LEE011 or TZD compared to EOC spheroids (Figure 10C and 10D). In vivo, the average volume of EOC spheroid-derived tumors was significantly decreased by pre-treatment with LEE011 compared to those without treatment (657.94 mm3 vs 262.93 mm3, P < 0.05 for ES2 spheroids; 586.61 mm3 vs 338.51 mm3, P < 0.05 for ES2TR spheroids) (Figure 10E and 10G). The average weight of ES2 spheroid-derived tumors and ES2TR spheroid-derived tumors treated with LEE011 was significantly less than spheroid-derived tumors without treatment (0.438 gm vs 0.182 gm, P < 0.01 for ES2 spheroids; 0.448 gm vs 0.208 gm, P < 0.05 for ES2TR spheroids) (Figure 10F and 10H). To validate LEE011 inhibited tumor disseminated metastasis in abdominal cavity, we employed a xenograft model in which null mice were coinjected with 3 × 10⁶ msc-OCSPCs and 1 × 10⁶ SKOV3-Luc cells (IP) feeding with or without 250 mg/kg/day LEE011, PO. The luciferase activity of tumors disseminated in the peritoneal cavity significantly decreased in mice receiving LEE011 compared with those without treatment (P < 0.05, Student’s t test; Figure 11).
Figure 8.

COL6A3 regulates CDK4, CDK6, and p-Rb pathway. The DNMT1, CDK4, CDK6, and p-Rb expression were shown in ES2 tumosphere (TS), ES2TRTS, msc-OCSPCs, SKOV3, and overexpressed COL6A3 SKOV3 cells.
Figure 9.

Molecular profile changes in epithelial ovarian cancer with collagen alpha-3 (IV; COL6A3) and mesenchymal-like (msc)-ovarian cancer stromal progenitor cell (OCSPC)-derived spheroids treated with LEE011 or COL6A3 knockdown (A) Expression of p-Rb, CDK4, and CDK6 in ES2 and ES2TR with COL6A3 and msc-OCSPC-derived spheroids, compared with their expression in ES2 and ES2TR. (B) Expression of DNA methyltransferase, Rb, p-Rb, CDK1, 4, 6, E-cadherin, and vimentin in ES2 spheroids, ES2TR spheroids, and msc-OCSPCs (pt’s msc) compared with their expression in these cell lines with COL6A3 knockdown (shCOL6A3). (C and D) The molecular profile changes in ES2 spheroids and ES2TR spheroids treated with 0, 2, or 5 μM LEE011. (E) Invasiveness of 1 × 10⁴ ES2, ES2 spheroids, ES2TR, and ES2TR spheroids treated with 30 μM TZD or 1 or 2 μM LEE011 for 3 days.
Figure 10.

LEE011 inhibits epithelial ovarian cancer spheroids and tumor growth. (A) Changes in cell growth in ovarian cancer stromal progenitor cells and (B) SKOV3 cells treated with 0, 2, or 5 μM LEE011. (C, D) The size and numbers of spheroids in (C) ES2 spheroids and ES2 spheroids/shCOL6A3 or (D) ES2TR spheroids and ES2TR spheroids/shCOL6A3. (E) Tumor size and (F) weight changes following subcutaneous injection of mice with ES2 spheroids, (G) ES2TR spheroids alone, or (H) ES2TR spheroids treated with LEE011.
Figure 11.

Tumor growth in the peritoneal cavity visualized by luciferase activity after intraperitoneal coinjection of mice with msc-OCSPCs cells and SKOV3-Luc cells treated with or without 250 mg/kg/day LEE011 (PO).
Discussion
Our results revealed that msc-OCSPCs enhanced the invasiveness and spheroid formation of EOC in vitro and increased tumor growth and metastasis in vivo. The evidence indicated that msc-OCSPCs arose from mesothelium through EMT [17]. The importance of ascetic fluid may provide a unique tumor microenvironment for the proliferation, survival, and spread of the disease and is increasingly recognized. Ascitic fluid in advanced ovarian cancer occurs in all histological subtypes [17], which suggests that the ascetic fluid may aid tumor growth and dissemination.
We noted COL6A3 was highly expressed in msc-OCSPCs from ascites. COL6 has been reported to be correlate with the tumor grade and cisplatin resistance of EOC cells [14], and COL6 levels are upregulated in ovarian cancer [20]. COL6 is present in primary ovarian tumors, as indicated by the ovarian tissue array [14]. However, COL6A3 expression related to survival outcomes in EOC has not been reported. COL6A3 expression was correlated with advanced stage and poor survival in EOC, according to the TCGA data and our EOC samples. COL6A3 expression levels were higher in patients with advanced-stage (stages III and IV) ovarian cancer and in those with suboptimal surgical debulking than in patients in the early-stages and those receiving optimal debulking (Figure 2H). COL6 may be involved in cell anchoring and cell signaling through interactions with integrins [21] and possibly other receptors such as NG2 [22] and DDR1/2 [23]. Integrin α2β1 was significantly more highly expressed in msc-OCSPCs than in epi-OCSPCs [17], which leads to speculation that integrin α2β1 may be a co-receptor for COL6. However, the exact receptor for COL6A3 is still unknown.
COL6 upregulation has been reported in relation to tumor progression in breast cancer, colon cancer, and pancreatic ductal adenocarcinoma [15,24,25]. COL6 cooperatively influences cancer cell behavior in the tumor microenvironment through paracrine and autocrine pathways. Stromal adipocytes represent a prominent source of COL6 in the ovarian microenvironment.
COL6 was highly abundant in both primary and metastatic ovarian cancer tissues and in omentum and ascitic stromal cells (msc-OCSPCs) within the tumor microenvironment, and benign ovarian cysts and epi-OCSPCs have considerably lower expression levels. High levels of COL6 in cell lysates and CM from msc-OCSPCs in the tumor microenvironment are crucial in promoting EMT, invasion, and spheroid formation by EOC. When EOC cells were cocultured with COL6 or CM from msc-OCSPCs, invasiveness and spheroid formation by EOCs were elevated. By contrast, the knockdown of COL6A3 in msc-OCSPCs resulted in reduced invasiveness and spheroid formation by EOCs. ALDH1 expression was reduced further in shCOL6A3/msc-OCSPCs from msc-OCSPCs. In vivo, disseminated tumor growth in the peritoneal cavity in mice was more inhibited by the administration (through IP) of msc-OCSPCs/shCOL6A3 and EOC spheroids than by administering msc-OCSPCs/mock and EOC spheroids. Disseminated tumor growth in lung in mice was more promoted by the administration (through IV) of COL6A3 and EOC derived spheroids than by administering msc-OCSPCs and EOC derived spheroids.
We previously showed that mRNA levels of CCND2 and CDKN2B were significantly lower in OCSPCs from ascites than those from bulk tumor tissues [17]. CCND2 and CDKN2B are components of the CDKN2A/CDK4/6-cyclin D1-pRB pathway. We speculate that the CDKN2A/CDK4/6-cyclin D1-pRB pathway is the possible downstream signaling pathway of COL6A3 in EOC spheroids and msc-OCSPCs. As expected, DNMTs, p-RB, CDK4, CDK6, and vimentin expression were decreased in cocultures of EOC/shCOL6A3 spheroids and msc-OCSPCs/shCOL6A3 than in cocultures of EOC spheroids and msc-OCSPCs. The data indicated that COL6A3 regulates the CDK4/6-p-Rb pathway in both EOC spheroids and msc-OCSPCs. When the COL6A3 downstream signaling pathway was knocked down in msc-OCSPCs and EOC spheroids by using the CDK4/6 inhibitor, LEE011, invasion and tumor growth in EOC spheroids were inhibited.
We recognize the mechanisms by which COL6A3 activates its downstream genes may result partly because the collagen is far away from transcriptional regulation. Surface receptors of COL6 are not identified. Thus, we cannot perform the experiment to block receptor-ligand interaction to confirm that this results in a similar phenotype.
In conclusion, COL6, a secreted protein that is abundant in primary and metastatic ovarian cancer tissues and in msc-OCSPCs and EOC spheroids, appears to promote EOC in EMT, stemness, tumor growth, and metastasis.
Acknowledgements
This work was supported by research funds from the Ministry of Science and Technology (MOST) and Cathay General Hospital, Taipei, Taiwan (NSC101-2314-B-281-005-MY3, MOST 104-2314-B-281-006-MY3, MOST107-2314-B-281-005-MY3). We thank Mr. Eric Milner for English editing of the manuscript.
The Institutional Review Board of Cathay General Hospital approved the study protocol, and all patients provided informed consent before the samples were collected. The animal experiments were approved by the Institutional Animal Care and Use Committee of Cathay General Hospital.
Disclosure of conflict of interest
None.
References
- 1.Siegel R, Naishadham D, Jemal A. Cancer statistics, 2013. CA Cancer J Clin. 2013;63:11–30. doi: 10.3322/caac.21166. [DOI] [PubMed] [Google Scholar]
- 2.Kurman RJ, Shih IM. The dualistic model of ovarian carcinogenesis; revisited, revised, and expanded. Am J Patho. 2016;186:733–747. doi: 10.1016/j.ajpath.2015.11.011. [DOI] [PMC free article] [PubMed] [Google Scholar]
- 3.Cho KR, Shih IM. Ovarian cancer. Annu Rev Pathol Mech Dis. 2009;4:287–313. doi: 10.1146/annurev.pathol.4.110807.092246. [DOI] [PMC free article] [PubMed] [Google Scholar]
- 4.Kipps E, Tan DS, Kaye SB. Meeting the challenge of ascites in ovarian cancer: new avenues for therapy and research. Nat Rev Cancer. 2013;13:273–282. doi: 10.1038/nrc3432. [DOI] [PMC free article] [PubMed] [Google Scholar]
- 5.Rankin EB, Giaccia AJ. Hypoxic control of metastasis. Science. 2016;352:175–80. doi: 10.1126/science.aaf4405. [DOI] [PMC free article] [PubMed] [Google Scholar]
- 6.Massague J, Obenauf AC. Metastatic colonization by circulating tumour cells. Nature. 2016;529:298–306. doi: 10.1038/nature17038. [DOI] [PMC free article] [PubMed] [Google Scholar]
- 7.Ahmed N, Stenvers KL. Getting to know ovarian cancer ascites: opportunities for targeted therapy-based translational research. Front Oncol. 2013;3:256. doi: 10.3389/fonc.2013.00256. [DOI] [PMC free article] [PubMed] [Google Scholar]
- 8.Cvetkovic D. Early events in ovarian oncogenesis. Reprod Biol Endocrinol. 2003;1:68. doi: 10.1186/1477-7827-1-68. [DOI] [PMC free article] [PubMed] [Google Scholar]
- 9.Lengyel E. Ovarian cancer development and metastasis. A J Pathol. 2010;177:1053–1064. doi: 10.2353/ajpath.2010.100105. [DOI] [PMC free article] [PubMed] [Google Scholar]
- 10.Liu Q, Zhang H, Jiang X, Qian C, Liu Z, Luo D. Factors involved in cancer metastasis: a better understanding to “seed and soil” hypothesis. Mol Cancer. 2017;16:176. doi: 10.1186/s12943-017-0742-4. [DOI] [PMC free article] [PubMed] [Google Scholar]
- 11.Thiery JP. Epithelial-mesenchymal transitions in tumour progression. Nat Rev Cancer. 2002;2:442–454. doi: 10.1038/nrc822. [DOI] [PubMed] [Google Scholar]
- 12.Sandoval P, Jiménez-Heffernan JA, Rynne-Vidal A, Pérez-Lozano ML, Gilsanz Á, Ruiz-Carpio V, Reyes R, García-Bordas J, Stamatakis K, Dotor J, Majano PL, Fresno M, Cabañas C, López-Cabrera M. Carcinoma-associated fibroblasts derive from mesothelial cells via mesothelial-to-mesenchymal transition in peritoneal metastasis. J Pathol. 2013;231:517–531. doi: 10.1002/path.4281. [DOI] [PubMed] [Google Scholar]
- 13.Yanez-Mo M, Lara-Pezzi E, Selgas R, Ramírez-Huesca M, Domínguez-Jiménez C, Jiménez-Heffernan JA, Aguilera A, Sánchez-Tomero JA, Bajo MA, Álvarez V, Castro MA, Peso Gd, Cirujeda A, Gamallo C, Sánchez-Madrid F, López-Cabrera M. Peritoneal dialysis and epithelial-to-mesenchymal transition of mesothelial cells. N Engl J Med. 2003;348:403–413. doi: 10.1056/NEJMoa020809. [DOI] [PubMed] [Google Scholar]
- 14.Sherman-Baust CA, Weeraratna AT, Rangel LB, Pizer ES, Cho KR, Schwartz DR, Shock T, Morin P. Remodeling of the extracellular matrix through overexpression of collagen VI contributes to cisplatin resistance in ovarian cancer cells. Cancer Cell. 2003;3:377–386. doi: 10.1016/s1535-6108(03)00058-8. [DOI] [PubMed] [Google Scholar]
- 15.Park J, Scherer PE. Adipocyte-derived endotrophin promotes malignant tumor progression. J Clin Invest. 2012;122:4243–4256. doi: 10.1172/JCI63930. [DOI] [PMC free article] [PubMed] [Google Scholar]
- 16.Ho CM, Chang SF, Hsiao CC, Chien TY, Shih DT. Isolation and characterization of stromal progenitor cells from ascites of patients with epithelial ovarian adenocarcinoma. J Biomed Sci. 2012;14:19–23. doi: 10.1186/1423-0127-19-23. [DOI] [PMC free article] [PubMed] [Google Scholar]
- 17.Ho CM, Shih DT, Hsiao CC, Huang SH, Chang SF, Cheng WF. Gene methylation of human ovarian carcinoma stromal progenitor cells promotes tumorigenesis. J Transl Med. 2015;13:367. doi: 10.1186/s12967-015-0722-7. [DOI] [PMC free article] [PubMed] [Google Scholar]
- 18.Ho CM, Huang CJ, Huang SH, Chang SF, Cheng WF. Demethylation of HIN-1 reverses paclitaxel-resistance of ovarian clear cell carcinoma through the AKT-mTOR signaling pathway. BMC Cancer. 2015;15:789. doi: 10.1186/s12885-015-1744-5. [DOI] [PMC free article] [PubMed] [Google Scholar]
- 19.Li W, Zhou Y, Yang J, Zhang X, Zhang H, Zhang T, Zhao S, Zheng P, Huo J, Wu H. Gastric cancer-derived mesenchymal stem cells prompt gastric cancer progression through secretion of interleukin-8. J Exp Clin Cancer Res. 2015;34:52. doi: 10.1186/s13046-015-0172-3. [DOI] [PMC free article] [PubMed] [Google Scholar]
- 20.Ismail RS, Baldwin RL, Fang J, Browning D, Karlan BY, Gasson JC, Chang DD. Differential gene expression between normal and tumor-derived ovarian epithelial cells. Cancer Res. 2000;60:6744–6749. [PubMed] [Google Scholar]
- 21.Pfaff M, Aumailley M, Specks U, Knolle J, Zerwes HG, Timpl R. Integrin and Arg-Gly-Asp dependence of cell adhesion to the native and unfolded triple helix of collagen type VI. Exp Cell Res. 1993;206:167–176. doi: 10.1006/excr.1993.1134. [DOI] [PubMed] [Google Scholar]
- 22.Nishiyama A, Stallcup WB. Expression of NG2 proteoglycan contricauses retention of type VI collagen on the cell surface. Mol Biol Cell. 1993;4:1097–1108. doi: 10.1091/mbc.4.11.1097. [DOI] [PMC free article] [PubMed] [Google Scholar]
- 23.Vogel W, Gish GD, Alves F, Pawson T. The discoidin domain receptor tyrosine kinases are activated by collagen. Mol Cell. 1997;1:13–23. doi: 10.1016/s1097-2765(00)80003-9. [DOI] [PubMed] [Google Scholar]
- 24.Qiao J, Fang CY, Chen SX, Wang XQ, Cui SJ, Liu XH, Jiang YH, Wang J, Zhang Y, Yang PY, Liu F. Stroma derived COL6A3 is a potential prognosis marker of colorectal carcinoma revealed by quantitative proteomics. Oncotarget. 2015;6:29929–29946. doi: 10.18632/oncotarget.4966. [DOI] [PMC free article] [PubMed] [Google Scholar]
- 25.Kang CY, Wang J, Axell-House D, Soni P, Chu ML, Chipitsyna G, Sarosiek K, Sendecki J, Hyslop T, Al-Zoubi M, Yeo CJ, Arafat HA. Clinical significance of serum COL6A3 in pancreatic ductal adenocarcinoma. J Gastrointest Surg. 2014;18:7–15. doi: 10.1007/s11605-013-2326-y. [DOI] [PubMed] [Google Scholar]