

SUMMARY
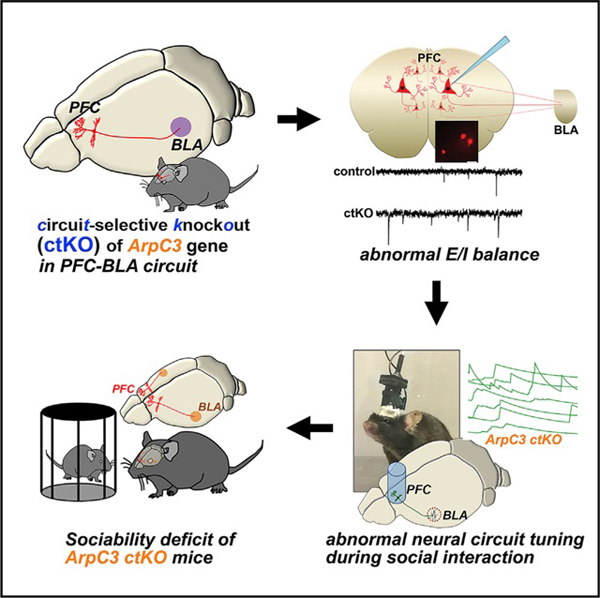
Psychiatric disorders are highly heritable pathologies of altered neural circuit functioning. How genetic mutations lead to specific neural circuit abnormalities underlying behavioral disruptions, however, remains unclear. Using circuit-selective transgenic tools and a mouse model of maladaptive social behavior (ArpC3 mutant), we identify a neural circuit mechanism driving dysfunctional social behavior. We demonstrate that circuit-selective knockout (ctKO) of the ArpC3 gene within prefrontal cortical neurons that project to the basolateral amygdala elevates the excitability of the circuit neurons, leading to disruption of socially evoked neural activity and resulting in abnormal social behavior. Optogenetic activation of this circuit in wild-type mice recapitulates the social dysfunction observed in ArpC3 mutant mice. Finally, the maladaptive sociability of ctKO mice is rescued by optogenetically silencing neurons within this circuit. These results highlight a mechanism of how a gene-to-neural circuit interaction drives altered social behavior, a common phenotype of several psychiatric disorders.
In Brief
Kim et al. exploit circuit-selective gene manipulation approaches in vivo to specifically knock out ArpC3 in the PFC-BLA circuit and find disrupted neuronal activities in the circuit, leading to abnormal social behavior. Optogenetic PFC-BLA circuit activation disrupts sociability of normal mice, while optogenetic circuit silencing rescues the abnormal sociability in the circuit knockout mice.
Graphical Abstract
INTRODUCTION
Complex social behaviors are highly adaptive for many species, including rodents and primates, and are likely mediated by conserved brain regions and neural circuits. Although abnormal social functioning is a major comorbid symptom of many psychiatric disorders (i.e., autism spectrum disorder [ASD], schizophrenia [SZ], and anxiety disorders) (Kennedy and Adolphs, 2012), few treatments are available due to lack of understanding of the pathophysiological mechanisms underlying social dysfunction.
Thus, to understand the genetics of abnormal behaviors, a major question is how disrupted social behavior emerges as a consequence of gene mutations. To approach this fundamental question, various lines of mutant mice have been generated to investigate the cellular and synaptic abnormalities that arise from these mutations in parallel with tests of behavioral face validity (Jones et al., 2011; Won et al., 2013). However, the mechanistic findings at the cellular and synaptic levels are often quite diverse and broadly affect multiple brain regions. As a result, our current understanding of how specific behavioral symptoms arise in these animal models remains fragmentary.
As a pathway model of maladaptive behaviors driven by altered synaptic function, we previously used Cre/Lox genetics to target a critical subunit (ArpC3; GeneBank: NM_019824.4) of the Arp2/3 complex (Kim et al., 2013, 2015), an important cytoskeletal regulator of dendritic spines. The Arp2/3 complex is a convergent endpoint effector of many upstream molecules that regulate the synaptic cytoskeleton and are associated with several developmental and psychiatric disorders, such as WASF1, RAC1, SHANK3, DISC1, CYFIP1, SYNGAP1, KALRN, TRIO, and CNKSR2 (De Rubeis et al., 2013; Durand et al., 2012; Hayashi-Takagi et al., 2010; Hu et al., 2016; Ito et al., 2018; Reijnders et al., 2017; Russell et al., 2014; Sadybekov et al., 2017). Conditional knockout (KO) of Arp2/3 activity in cortical regions results in behavioral abnormalities that include psychomotor agitation, cognitive dysfunction, and impaired sociability (Kim et al., 2013), several of which respond to antipsychotics (Kim et al., 2015). Notably, mutation of the Arp2/3 complex subunit ArpC2 has been recently identified as an SZ risk factor in humans (Gulsuner et al., 2020), and the expression of Arp2/3 complex subunits was significantly downregulated in the prefrontal cortex (PFC) of SZ patients (Datta et al., 2017).
In addition to the roles of the PFC in decision-making, attention, working memory, and goal-directed behaviors (Kesner and Churchwell, 2011; Ridderinkhof et al., 2004), this region is known to be tightly associated with social behaviors across spe-cies (Amodio and Frith, 2006; Bicks et al., 2015; Lee et al., 2016; Sliwa and Freiwald, 2017). Studies with human and animal models suggest that abnormal activity of the PFC can result in social behavioral disturbances (Nelson and Valakh, 2015; Rubenstein, 2010; Yizhar et al., 2011). The PFC functions through projections to other brain regions, including nucleus accumbens (Bossert et al., 2012), hippocampus (Barker et al., 2017), brain stem (Franklin et al., 2017), substantia nigra (Kim et al., 2015), and amygdala (Hultman et al., 2016). The synchronized activities between the PFC and amygdala during social interactions have been observed in several studies, suggesting a brain circuitry between these brain regions may govern aspects of social behavior (Huang et al., 2016; Hultman et al., 2016; Kennedy and Adolphs, 2012; Sliwa and Freiwald, 2017). Notably, the projection from the amygdala to the PFC was shown to modulate social behavior and anxiety state of wild-type (WT) mice (Felix-Ortiz et al., 2016).
Using circuit-selective genetic approaches, we report the identification of a population of PFC neurons that project to the basolateral amygdala (BLA). The activity of these neurons is modulated by social context. We show that loss of ArpC3 within this circuit is sufficient to recapitulate the reduced sociability of ArpC3 mutant mice. This effect results from circuit-specific increased neuronal activity, abrogating the differential activity of these neurons during social interactions. Optogenetic activation of this circuit in WT mice during social interaction bouts to mimic the neural circuit abnormality recapitulates the reduced sociability of ArpC3 mutants. By contrast, silencing overactive neurons within the circuit-selective KO (ctKO) mice normalizes social interactions. Together, this study reveals a pathogenic mechanism linking gene loss to the abnormal circuitry underlying a social endophenotype. These results and advanced methods open new avenues for understanding the neural circuit links between genotype and maladaptive behavior.
RESULTS
Frontal Cortical Arp2/3 Function Is Essential for Sociability
Loss of Arp2/3 activity in forebrain excitatory neurons leads to progressive behavioral abnormalities that are congruent with psychiatric endophenotypes, such as impaired social affiliation (Kim et al., 2013). To identify a critical brain region mediating social abnormalities, we used functional brain mapping by selective re-expression of recombinant ArpC3 exclusively within the ArpC3-deleted (Cre-positive) excitatory neurons of ArpC3f/f: CaMKllCre mice using FARR (flex adeno-associated virus [AAV]-mediated regional rescue) (Figure 1A) (Kim et al., 2015). This approach was previously reported and demonstrated to rescue morphological and electrophysiological phenotypes associated with loss of ArpC3. Since the frontal cortical (FC) region is strongly implicated in diverse social behaviors of humans and animals (Amodio and Frith, 2006; Bicks et al., 2015; Sliwa and Freiwald, 2017), we hypothesized that rescuing ArpC3 in the FC would relieve the abnormal social behavior displayed by ArpC3f/f:CaMKllCre mice. To test this hypothesis, we conducted a social affiliation test comparing ArpC3f/f mice (control) with ArpC3f/f:CaMKllCre mice infected within the FC with either control AAV-Flex-GFP (KO) or AAV-Flex-ArpC3–2A-GFP (rescue) (Figure 1B). Control mice displayed a strong preference for the social stimulus over the non-social stimulus, while KO mice did not, demonstrating a sociability impairment. Strikingly, in rescue mice the sociability impairment of the KO mice was largely normalized (Figure 1C). Statistical analysis revealed that control and rescue mice significantly preferred the social stimulus compared with their baseline preference levels (Figure 1D, NS-NS), whereas KO mice did not. No differences in the total number of social and non-social contacts were observed; however, increased locomotion in the KO mice (Kim et al., 2013) was also normalized by the FC rescue virus (Figure S1). These data demonstrate that the FC is a critical brain region associated with abnormal behaviors in the KO (ArpC3f/f:CaMKllCre) mice, including reduced sociability. While this treatment was sufficient to restore the social phenotype in the ArpC3 mutants, the underlying neural circuitry relevant to impaired sociability was not revealed.
Figure 1. Regional Rescue of ArpC3 within the FC Normalizes the Sociability Deficit of the ArpC3f/f:CaMKIICre KO Mice.

(A) Schematic Illustration representing the selective re-expression of ArpC3 and GFP in CaMKII:Cre-positive KO neurons of the frontal cortex (FC). Inset shows the regional rescue strategy of Cre-dependent ArpC3 expression.
(B) Illustration of social affiliation test (SAT) with the FC rescued mice. Fluorescence image shows the expression of ArpC3 and GFP in the FC area.
(C) Representative heatmaps of movement traces between social (S) stimulus versus non-social (NS) stimulus in the SAT for ArpC3f/f mice (control; n = 18 male and female mice), ArpC3f/f:CaMKIICre mice injected with AAV-Flex-GFP (KO; n = 11 male and female mice), and ArpC3f/f:CaMKIICre mice injected with AAV-Flex-ArpC3–2A-GFP (rescue; n = 15 male and female mice).
(D) Preference scores for NS versus NS (white bar with red dots) or for NS versus S (gray bar with blue dots).
p < 0.0001 for control, p = 0.0002 for rescue. *p < 0.05. All data are presented as mean ± SEM.
See also Figure S1.
Subpopulations of FC neurons are likely to modulate social behaviors via connectivity with brain areas important for decision-making and emotional salience. To visualize and determine the efferent brain targets, we traced the axonal processes from FC neurons infected by GFP-expressing AAV (AAV-hSyn-GFP) (Figures 2A–2C). Tracing the GFP-positive axonal processes through serial brain sections revealed specific FC neuronal projections to several brain areas, including brainstem, striatum, entorhinal cortex, and ventral tegmental area (VTA). We also found a prominent axonal bundle projecting to the BLA, a brain structure associated with social behaviors (Baron-Cohen et al., 2000; Rutishauser et al., 2015) (Figure 2C). Projections from regions of PFC to the BLA have been previously described using fluorescent dyes and lectins (Bouwmeester et al., 2002; Cassell et al., 1989; Gabbott et al., 2005; Mcdonald et al., 1996), and abnormalities in this circuit have been implicated in several psychiatric conditions (Anticevic et al., 2013; Carballedo et al., 2011; Kessler et al., 2005; Liu et al., 2014).
Figure 2. Circuit-Selective Cre Expression Visualizes a Projection from the PFC to BLA.
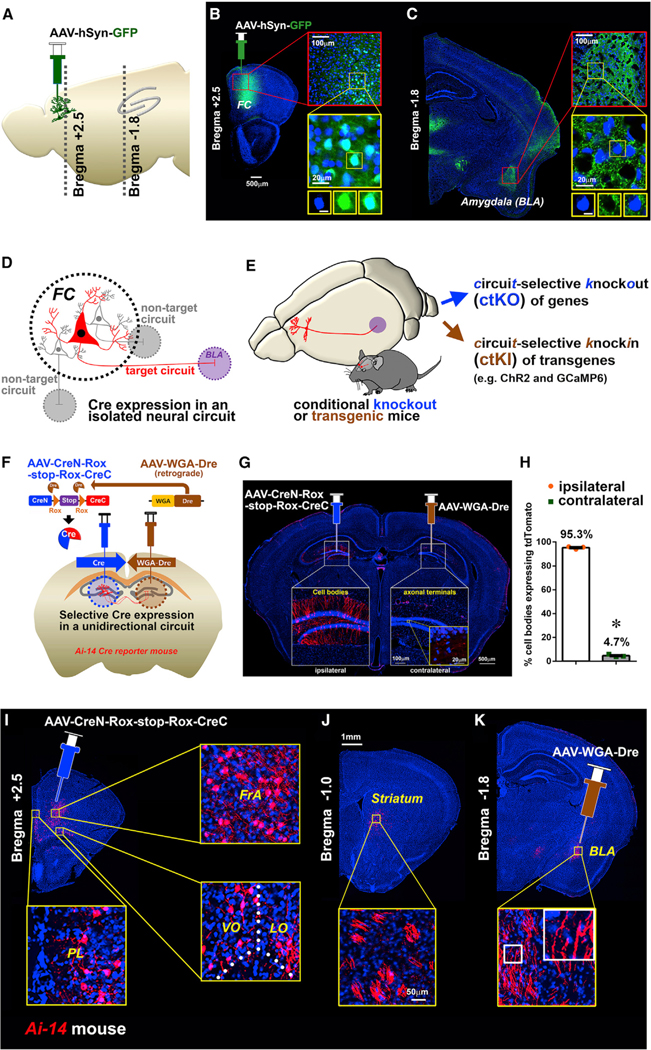
(A) Schematic illustrating the position of the injection site and the brain slices utilized in tracing.
(B) AAV-hSyn-GFP injection in the FC. Inset: high-magnification images display the expression of GFP in the cell bodies (blue; DAPI). Scale bar, 5 μm.
(C) Axonal projection from the FC to the basolateral amygdala (BLA). Inset: high-magnification images display punctate GFP fluorescence representing axonal fibers within the BLA. Scale bar, 5 μm.
(D) Schematic illustrating the isolated expression of Cre within a single projection circuit initiated from the FC.
(E) Schematic conceptualizing both circuit-selective knockout (ctKO) and circuit-selective knockin (ctKI) approaches.
(F) Schematic illustration for the in vivo testing of the circuit-selective expression of Cre using retrograde Dre (AAV-WGA-Dre) and Dre-dependent Cre (AAV-CreN-Rox-stop-Rox-CreC) in the reciprocal dentate gyrus (DG) circuit of Ai-14 Cre-reporter mice (Cre-dependent tdTomato-expressing mouse line).
(G) Representative image of coronal brain slice shows the cell body expression of tdTomato within the ipsilateral DG (AAV-CreN-Rox-stop-Rox-CreC) and axonal fibers of the contralateral side of DG (AAV-WGA-Dre).
(H) Bar graph shows the mean percentage of cell bodies in the ipsilateral versus the contralateral side to determine the circuit specificity of Cre activity. n = 3 mice. p < 0.0001.
(I–K) Circuit-selective Cre expression between the prefrontal cortex (PFC) and the BLA of Ai-14 mice. Cell bodies of the circuit are detected in PFC subregions including the prelimbic (PL), ventral orbital (VO), lateral orbital (LO), and frontal association (FrA) regions of the PFC (I). Axonal fibers pass through the medial part of the striatum (J) and terminate in the BLA (K).
*p < 0.05. All data are presented as mean ± SEM.
See also Figure S2.
Development of a Circuit-Selective Gene Manipulation Approach
The robust axonal projection from the FC to the BLA and its association with psychiatric disorders led us to further investigate this neuronal connection as a candidate brain circuit associated with the social affiliation deficit found in the ArpC3f/f:CaMKllCre mice. To reveal a circuit-level pathology evoked by a gene mutation, a circuit-selective gene manipulation approach was needed. However, manipulating genes within isolated neural circuits is difficult to achieve with high specificity due to technical limitations. A method for Cre expression based on neuronal connectivity with specificity and flexibility would be highly desirous for testing the interactions between gene effect, brain circuitry, and behavior. To overcome prior limitations of retrograde Cre expression, which infects inputs of a target region from multiple brain regions (Kim et al., 2015), we developed an advanced method of circuit-selective Cre expression in vivo. We hypothesized that the combinational expression of wheat germ agglutinin (WGA)-mediated retrograde expression of Dre (WGA-Dre) within a defined target region and a Dre-recombinase-dependent Cre (CreN-Rox-stop-Rox-CreC) (Hermann et al., 2014) in projection neurons could provide selective and unidirectional expression of active Cre within specific neural circuits (Figure 2D; Figure S2A). This method could be applied to produce ctKO or circuit-selective knockin (ctKI) mice (Figure 2E). To test this idea, a Cre reporter (Flex-GFP) was expressed with either WGA-Dre or CreN-Rox-stop-Rox-CreC or in combination together in cultured cells (Figure S2B). GFP fluorescence was detected only in cells expressing all three constructs, demonstrating the high specificity of the conditional Dre-dependent Cre expression. Expressing WGA-Dre alone in Ai-14 Cre-reporter mice (Cre-dependent tdTomato-expressing mouse line) confirmed Dre recombinase had no detectable activity toward floxed alleles in vivo (Figures S2C–S2G). CreN-Rox-stop-Rox-CreC expressed alone in Ai-14 Cre-reporter mice displayed background activity by an unknown mechanism that was 0.74% of that when combined with WGA-Dre co-infection or 4.0% of that when combined with retrograde WGA-Dre injection from the BLA (Figures S2H–S2L). These data supported the feasibility of this approach to delete floxed alleles in a circuit-selective manner. To functionally test whether this approach could selectively target neuronal circuits unidirectionally in vivo, we utilized reciprocal circuits of the dentate gyrus (DG) (Gradinaru et al., 2010) in Ai-14 Cre-reporter mice for quantitative image analysis. AAV-CreN-Rox-stop-Rox-CreC was injected into the left and AAV-WGA-Dre was injected into the right DG of Ai-14 Cre-reporter mice (Figure 2F). Two weeks later, tdTomato-positive neuronal cell bodies and dendrites were detected in the ipsilateral side (left), whereas tdTomato axonal fibers were observed in the contralateral (right) hilus of DG (Figure 2G). Quantification of cell bodies from both hemispheres confirmed the Cre-dependent labeling of neurons was almost exclusively (95.3%) retrograde to the AAV-WGA-Dre injection (Figure 2H). Thus, this circuit-selective Dre and Cre approach confers an innovative method to express Cre recombinase within select unidirectional neural circuits of the brain.
PFC Neurons Directly Project to the BLA
Using this circuit-selective Cre expression approach, we first visualized the isolated FC-BLA circuit to define the regional distribution of cell bodies in the FC and to confirm the route of axonal projection to the BLA. Ai-14 Cre-reporter mice were stereotaxically injected with the AAV-CreN-Rox-stop-Rox-CreC (300 nL of 1 × 10¹³ genome copies [GC]/mL) and AAV-WGA-Dre (30 nL of 1 × 10¹³ GC/mL) viruses into the FC and BLA, respectively. These titers and volumes of viruses efficiently and specifically infected FC and BLA regions with no cross-infection with each other (Figures S2M and S2N). Two weeks after the infections, tdTomato fluorescence was traced in serial brain sections (Figures 2I–2K), revealing that the neuronal cell bodies were distributed in subdivisions of the FC that corresponded to the PFC, including the prelimbic (PL), infralimbic (IL), medial orbital (MO), ventral orbital (VO), lateral orbital (LO), and frontal association (FrA) cortices. This circuit-selective imaging allowed us to observe refined axonal tracks compared with the axonal projection signals visualized by classical AAV-hSyn-GFP-driven tracing. Circuit-selective labeled axonal fibers from the PFC traveled through the medial striatum near the lateral ventricle and terminated within the BLA (Figures 2J and 2K).
ctKO of ArpC3 in the PFC-BLA Projection Disrupts Social Affiliation
Next, we tested whether selective deletion of ArpC3 in the PFC-BLA projection is sufficient to recapitulate the impaired sociability seen in ArpC3f/f:CaMKllCre mice. Using ctKO mice and control animals (BLA infection with AAV-WGA versus AAV-WGA-Dre) (Figure 3A), we tested the social interactions of each group in a social affiliation paradigm (Figures 3B and 3C). In the first test phase, when mice were permitted to interact with two identical non-social stimuli, neither group showed a preference for one stimulus over the other. However, in the second phase where a non-social stimulus was paired with a social stimulus, the control mice displayed a significant preference for the social over the non-social stimulus (Figure 3D). In comparison, ctKO mice displayed little preference for the social over the non-social stimulus (Figure 3D). As a control, we analyzed the total stimulus contact numbers, and no significant differences existed between groups Figure 3E), indicating that the circuit disruption of ArpC3 did not affect the basic exploratory behavior of the mice. A second potential confound could be due to altered motor activity levels of ctKO mice (as in the ArpC3f/f:CaMKllCre mice; Figures S1D and S1E). However, there were no significant differences in the veloc-ity or total distance traveled in the social affiliation test (Figures 3F and 3G). Additional analysis of open field testing (OFT) also revealed no significant changes in locomotor, stereotypical, or rearing behaviors from controls (Figures S3A–S3E), demonstrating the specificity of the ctKO effectively segregated the altered social behavior from the locomotor disturbances seen in ArpC3f/f:CaMKllCre mice.
Figure 3. Circuit-Selective Loss of ArpC3 within the PFC-BLA Recapitulates the Abnormal Sociability of the ArpC3 Mutant Mice.

(A) Schematic illustration of the ctKO strategy using the circuit-selective expression of Cre in ArpC3f/f:Ai-14 mice.
(B) Schematic showing SAT with PFC-BLA ctKO mice.
(C) Left: image shows the experimental arena used in the test. Right: representative heatmaps represent time spent in space over time in the arena for each genotype.
(D) Preference ratio for NS-NS or NS-S for ArpC3f/f:PFC CreN-Rox-stop-Rox-CreC::amygdala WGA (control; orange), n = 7 male mice; and for ArpC3f/f:PFC CreN-Rox-stop-Rox-CreC::amygdala WGA-Dre (ctKO; green), n = 10 male mice. p > 0.9999 for NS-NS test, p = 0.0062 for NS-S test.
(E–G) Graphs showing the mean (E) total contacts for the S and NS, (F) movement velocity, and (G) total distance traveled for each genotype during the NS-S test.
*p < 0.05. Data represent mean ± SEM.
See also Figure S3.
Because the BLA is also known to regulate anxiety (Roozendaal et al., 2009), we conducted a light-dark emergence test to determine whether the ctKO mice displayed anxiety-like behavior (Figures S3F–S3L). There were no significant differences between the ctKO and control mice in distances traveled, duration of time spent, or frequency of transits between the light and dark chambers, indicating anxiety levels of the ctKO mice were unaffected. Together, these data demonstrate that the ArpC3 ctKO of the PFC-BLA projection selectively recapitulates the social behavioral impairment of the previously described ArpC3f/f:CaMKllCre mice (Kim et al., 2013). Importantly, this occurred without altering other previously described PFC- or BLA-associated behaviors such as anxiety and hyper-locomotor activity.
ArpC3 ctKO in the PFC-BLA Projection Elevates Neuronal Activity
Using this circuit-selective Cre expression system, we also examined the effect of ArpC3 loss on the physiological characteristics of the PFC-BLA neurons and socially coupled activity properties. To visualize circuit-selective neurons of the PFC for patch-clamp recordings, ArpC3f/f:Ai-14 double mutant (ctKO) and Ai-14 (control) mice were injected with AAV-CreN-Rox-stop-Rox-CreC and AAV-WGA-Dre viruses into the PFC and BLA, respectively (Figure 4A). Thirty to 40 days following the infections, whole-cell patch-clamp recordings of the tdTomato-positive ctKO neurons or neurons from control mice were conducted in acute brain slices containing the PL and IL areas of medial PFC (Figure 4B). In this analysis, we found that the mean miniature excitatory postsynaptic current (mEPSC) amplitude of PL neurons in the ArpC3 ctKO mice was not significantly different from that of controls (Figures 4D; p = 0.165). However, Kolmogorov-Smirnov (KS) test revealed a significant increase in amplitude of PL-BLA ctKO neurons (Figure 4E; p < 0.001). On the other hand, the mEPSC frequency of PL ctKO neurons was significantly elevated compared with that of control neurons (Figures 4F and 4G; p < 0.01 with t test, p < 0.001 with KS test). The analysis of IL neurons (Figure 4H) revealed that the mEPSC amplitude of ctKO neurons was not different from that of control neurons (Figures 4I and 4J). However, the mEPSC frequency of IL was significantly upregulated in ctKO neurons (Figures 4K and 4L; p < 0.01 with t test, p < 0.001 with KS test). Interestingly, the miniature inhibitory postsynaptic current (mIPSC) of ctKO neurons displayed an opposite pattern. The amplitude of ctKO IPSC was significantly decreased in the PL compared with control (Figures 4N and 4O; p < 0.05 with t test, p < 0.001 with KS test). In the frequency test, the mean mIPSC of the ctKO neurons in PL was decreased but failed to reach statistical significance (Figure 4P; p = 0.051). However, the KS test revealed a significant difference (Figure 4Q; p < 0.001). The IL analysis revealed that the mean IPSC amplitude was not altered by ArpC3 deletion (Figure 4S; p = 0.231); yet, significant decrease was found by KS test (Figure 4T; p < 0.05). Finally, there was no change of mIPSC frequency in the IL region (Figures 4U and 4V). Together, these data demonstrate that the ArpC3 ctKO triggered effects on both excitatory and inhibitory synaptic transmission in the PFC-BLA neural circuit potentially affecting excitatory/inhibitory (E/I) balance.
Figure 4. ArpC3 Gene Deletion Disrupts E/I Balance of the Neurons within the PFC-BLA Circuit.

(A and B) Schematic representations of (A) the approach to visualize tdTomato-positive ctKO neurons in PFC and (B) patch clamp of the tdTomato-positive ArpC3 ctKO neurons in PL and IL that project to BLA. Inset shows representative image of circuit neurons sparsely labeled with tdTomato. Scale bar represents 20 μm.
(C–G) The mEPSC of PL in control and ctKO mice.
(C) Representative mEPSC traces of control (WT) tdTomato neurons (n = 9 from 5 male and female Ai-14 mice) or tdTomato-positive ctKO neurons (n = 15 from 5 male and female ArpC3f/f:Ai-14 mice) in PL.
(D) The mean amplitude of mEPSC in PL.
(E) The cumulative probability plot of mEPSC amplitudes in PL (two-sample Kolmogorov-Smirnov [KS] test, ***p < 0.001).
(F) The mean frequency of mEPSC in PL (**p < 0.01).
(G) The cumulative probability plot of mEPSC frequency in PL (KS test, ***p < 0.001).
(H–L) mEPSC of IL in control and ctKO mice.
(H) The representative mEPSC traces of control (n = 15 from 5 male and female Ai-14 mice) or ctKO neurons (n = 18 from 5 male and female ArpC3f/f:Ai-14 mice) in IL.
(I) Mean amplitude of mEPSC in IL.
(J) The cumulative probability plot of mEPSC amplitudes in PL.
(K) The mean frequency of mEPSC in IL (**p < 0.01).
(L) The cumulative probability plot of mEPSC frequency in IL (KS test, ***p < 0.001).
(M) Representative mIPSC traces of WT (n = 13 from 5 male and female Ai-14 mice) or ctKO neurons (n = 14 from 5 male and female ArpC3f/f:Ai-14 mice) in PL. (N–Q) mIPSC of PL in control and ctKO mice.
(N) The mean amplitude of mIPSC in PL (*p < 0.05).
(O) The cumulative probability plot of mIPSC amplitudes in PL (KS test, ***p < 0.001).
(P) The mean frequency of mIPSC in PL.
(Q) The cumulative probability plot of mIPSC frequency in PL (KS test, ***p < 0.001).
(R–V) mIPSC of IL in control and ctKO mice.
(R) Representative mIPSC traces of control (n = 15 from 5 male and female Ai-14 mice) or ctKO neurons (n = 18 from 5 male and female ArpC3f/f:Ai-14 mice) in IL.
(S) The mean amplitude of mIPSC in IL.
(T) The cumulative probability plot of mIPSC amplitudes in PL (KS test, *p < 0.05).
(U) The mean frequency of mIPSC in IL.
(V) The cumulative probability plot of mEPSC frequency in IL.
Data are presented as mean ± SEM. ***p < 0.001, **p < 0.01, *p < 0.05.
Both in vitro electrophysiology data and social behavioral data observed in the ArpC3 ctKO mice suggest that the abnormal social behavior of the ArpC3 ctKO mice could be caused by elevated neural activation of the neural circuit projection from PFC to BLA. Thus, we next measured neural activities in WT and ctKO mice during social behavior in real time using in vivo calcium imaging with an endoscope.
ArpC3 ctKO Alters Socially Evoked Activity in the PL-BLA Neural Projection
Recent single-unit recordings have demonstrated a subpopulation of PFC neurons exhibit elevated activity during social approach in the three-chamber sociability task (Lee et al., 2016), consistent with a potential role of this brain region in social behaviors. To determine whether the PFC-BLA projection neurons of WT mice modulate their activity in response to social interactions and whether this is altered in the ctKO mice in real time, we unilaterally labeled the circuit with the genetically encoded calcium indicator GCaMP6s (ctKI-GCaMP6s) using co-infection of AAV-Flex-GCaMP6s in PFC (Figure 5A). In vivo imaging of calcium dynamics was conducted in the PL-BLA neurons because this neuronal population showed a prominent increase of mEPSC and decrease of mIPSC in the ArpC3 ctKO mice (Figure 4). Thus, we implanted a gradient-index (GRIN) lens into the PL region of PFC and connected a head-mounted microscope (Inscopix) to quantify activity in the PL-BLA circuit during social interactions (Figures 5B and 5C). In this assay, the testing (microscope mounted) and social stimulus mice freely moved within a rectangular arena and were simultaneously monitored for calcium signals (index of neuronal activity) and body centroid distance between two mice (index of social interaction).
Figure 5. Loss of ArpC3 Alters Social Context-Dependent Neuronal Tuning within the PL-BLA Circuit.

Head-mounted microscopy of PL-BLA circuit GCaMP6s fluorescence during S and NS activity bouts of WT (n = 6 male mice) and ArpC3 ctKO (n = 4 male mice).
(A) Schematic of the approach to selectively express GCaMP6s within PFC-BLA circuit using circuit-selective Cre expression combined with Cre-dependent GCaMP6s expression.
(B) Top: PL-BLA circuit activity imaging strategy using ctKI-GCaMP6s mouse with head-mounted fluorescence microscope and GRIN lens implanted into the PL region. Bottom: schematic illustrates the GCaMP6s expression in the PFC-BLA circuit and location of lens in the PL region. Representative inset shows a raw image of sparse GCaMP6s expression in the PL.
(C) Representative image of rectangular arena for simultaneous monitoring of social interactions and GCaMP6s-based neural activity. Inset shows a real-time tracking image of the two mice.
(D) Representative neuronal activity traces for WT (red lines) and ctKO (green lines).
(E) Mean rise time of calcium transients between WT and ctKO mice during behavioral task (p < 0.001).
(F) Mean decay time of calcium transients between WT and ctKO mice (p < 0.001).
(G) Mean amplitude of calcium transients between WT and ctKO mice (p < 0.001).
(H) Schematic illustrating the indexed behavior based on the distance between the experimental and S stimulus mice.
(I and J) Proportions and total cell numbers of social (+) and social ( ) neurons in the PL-BLA circuit of WT (I) and ctKO (J) mice.
(K) Comparison of frequency in the number of calcium transients between social (−) versus social (+) neurons of control and ctKO while mice are close to each other (centroids under 15 cm, p < 0.001 for WT, p > 0.05 for ctKO).
(L) Same analysis as in (K) while mice are distant from each other (centroids over 15 cm, p < 0.001 for WT, p < 0.01 for ctKO).
***p < 0.001, **p < 0.01. Data are presented as mean ± SEM.
We analyzed the relationship between PL-BLA circuit activity and behavior during a 10 min test period (Figures 5B and 5C). Interestingly, the rise, decay, and amplitude of calcium transients were significantly increased in ArpC3 ctKO mice (Figures 5D–5G) under the condition of similar basal fluorescence (Figures S4A and S4B). These changes might be caused by the overall increased activity of ctKO neurons as observed in in vitro electrophysiology results (Figure 4).
To analyze the behavior-dependent calcium dynamics in the PL-BLA circuit of WT and ctKO mice, we calculated the event frequency using event detection of calcium transients (threshold of 2.0 standard deviations above the mean). Based on the frequency of calcium transients during close interactions (close, body centroids under 15 cm) and during separation bouts (far, body centroids over 15 cm) (Figure 5H), we identified two major classes of neurons: social (+) cells (47.3%; 87/184) and social (−) cells (52.7%; 97/184) in WT mice (n = 6) (Figure 5I; Video S1). This classification was based on the social preference index computed during interaction between two mice: (frequencyclose – frequencyfar)/(frequencyclose + frequencyfar) (details in STAR Methods). Social (+) neurons show higher activity when the test animal is close to a young female C3H/HeJ mouse (social stimulus). Social (−) neurons show higher activity when the animal is far away from a social stimulus mouse.
To test whether the social (+) neurons are specifically active during social interaction, we compared neural activity when mice are in close proximity to a social or non-social stimulus (Figure S4C). Social (+) neurons were significantly more active during close proximity with the social stimulus mouse rather than with an object (non-social stimulus). In contrast, social (−) neurons were more active when animals interacted with the non-social object (Figure S4D). These data demonstrate that the circuit neurons that were categorized as social (+) and social (−) display context-specific socially evoked activity.
We also applied the same analysis to ctKO neurons in the PL-BLA circuit. Interestingly, ctKO neurons exhibited a similar bidirectional tuning with indexed behavior (social (+), 54.0% of neurons [95/176] and social (−), 46.0% of neurons [81/176] from four mice) (Figure 5J; Video S2). Importantly, while the event rate was significantly different between social (+) and social (−) neurons during both social (close) and non-social (far) bouts in WT mice, ctKO mice did not show a difference during close interactions (Figures 5K and 5L). Thus, while the functional identity (social (+) versus social (−)) of the ctKO neurons in PL-BLA circuit appeared unaltered, differential tuning of activity during social interactions was significantly degraded in the ctKO mice, likely due to the elevated activity of these neurons.
Optogenetic Activation of the PL-BLA Circuit Disrupts Social Affiliation
Based on the above-mentioned analysis, we hypothesized that elevated activity of the PL-BLA neurons during social bouts was responsible for the sociability deficit of the of the ArpC3 ctKO mice. To test this hypothesis, we sought to mimic the ArpC3 ctKO condition in WT mice using circuit-selective conditional optogenetics to elevate activity of PL-BLA neurons during social interaction (Figures 6A–6C). Channelrhodopsin 2 (ChR2) was expressed within the PFC-BLA circuit by transducing AAV-CreN-Rox-stop-Rox-CreC and AAV-WGA-Dre in the PFC and BLA, respectively, in Cre-dependent conditional ChR2 (Ai-32) or WT (opsin-free) mice (Figure 6A; Figure S5). After the viral injections, we implanted optic fibers bilaterally into the PL. A month after the infection and optic fiber implantation, the social affiliation of the PL-BLA ctKI ChR2 (ctKI-ChR2) versus opsin-free mice was measured with and without optogenetic stimulation during social approach. Without optical stimulation (baseline, day 1), ctKI-ChR2 mice preferred the social stimulus rather than the non-social stimulus (object) (Figure 6H). However, conditional optical activations of the PL-BLA circuit during social bouts (selective activation in laser zone; Figures 6C and 6D) strongly influenced social behavior (Figure 6H), as the ctKI-ChR2 mice no longer preferred the social stimulus during stimulation (Figure 6I; Video S3). These differences were also reflected in the measurement of the average distance between the ctKI-ChR2 mice and the social stimulus (Figure 6J), indicating that the ctKI-ChR2 mice no longer showed interest in remaining in close proximity to the social stimulus. On the contrary, the same optical stimulation did not alter the social affiliation of opsin-free control mice (Figure 6E), which strongly preferred the social stimulus under all conditions (Figure 6F). The mean distance between the opsin-free mice and the social stimulus was also not altered by the optical protocol, further confirming that laser illumination itself did not affect the sociability of the mice (Figure 6G). Together, these data demonstrate that elevated activity of PL-BLA circuit during bouts of social interaction is sufficient to disrupt sociability behavior.
Figure 6. Conditional Optogenetic Activation of the PL-BLA Circuit during Social Interac-tion Mimics the Abnormal Sociability of the ArpC3 ctKO Mice.

(A) Schematic representation of the optogenetic strategy for activating the PL-BLA circuit. Insets show representative images of circuit neurons labeled with ChR2-eYFP in the PL and BLA.
(B) Representative snapshot of the testing arena consisting of a non-social and a social region.
(C) The social arena has a virtual laser zone around the S stimulus, which upon entering triggers stimulation with 473 nm light (5 ms pulse width, 5 Hz, 6–8 mW).
(D) The time schedule for the real-time social preference tests with schematic illustrations of the circuit-selective optogenetic stimulations.
(E–G) Laser itself does not alter the social behavior of opsin-free WT mice (n = 5 male mice).
(E) Representative heatmaps of movement traces between S versus NS without laser (baseline) or with 5 Hz lasers within the S stimulus zone.
(F) Graph of preference score for S versus NS stimulus for each condition (orange, baseline; green, 5 Hz laser).
(G) Average distance between the experimental mouse and S stimulus for each condition.
(H–J) Same measurement for circuit-specific ChR2-expressing mice (n = 6 male mice).
(H) Representative heatmaps of movement traces for ctKI ChR2 mice.
(I) Preference score for each optogenetic condition. p = 0.0357 for laser versus baseline.
(J) Average distance between the experimental mouse and S stimulus.
p = 0.0039 for laser versus baseline. *p < 0.05. Data are presented as mean ± SEM.
Sociability is a complex behavioral measure that can be influenced by other behavioral states previously ascribed to PFC or BLA functions, including aversion and motivational levels that could confound the analysis of social interactions (Bromberg-Martin et al., 2010; Lammel et al., 2014). Thus, to test whether these states influenced our assay, using the same mice used in the social affiliation test mentioned above, we also analyzed whether activation of the PL-BLA circuit altered measures of these behaviors. We first tested whether the PL-BLA ctKI-ChR2 activation (Figure S5A) would produce an aversive response using a place preference test (Figure S5B). ctKI-ChR2 mice and opsin-free control mice showed equivalent preferences between the stimulation and neutral zones both at baseline (without laser illumination) and with laser stimulation (Figures S5C and S5D). Thus, activation of the PL-BLA circuit did not evoke an aversive response.
To test the effect of PL-BLA circuit stimulation on the motivation level of the same mice, we analyzed the effect of optogenetic activation on preferences for a zone containing food pellets in fasting mice (Figure S5E). Both the ctKI-ChR2 and opsin-free mice retained a strong preference for the food zone to an indistinguishable level from baseline (Figures S5F and S5G), demonstrating that the optogenetic activation on the PL-BLA circuit does not affect general motivation levels of mice such as those induced by appetite. Together, these results show that selectively elevating the activity of the PL-BLA circuit during social bouts specifically hampers the sociability of WT mice, mimicking the loss of differential coding of activity during social interactions observed in the ctKO mice without affecting the levels of aver-siveness and motivation.
Optogenetic Inactivation of Neurons within the PL-BLA Circuit Relieves Social Dysfunction of ArpC3 ctKO Mice
The above-mentioned results suggested that normalization of the elevated activity of the PL-BLA circuit in the ArpC3 ctKO mice during social bouts could rescue their social behavioral dysfunction. To test this hypothesis, we selectively expressed eArch3.0 within the ArpC3 KO PFC-BLA circuit by infection of AAV-CreN-Rox-stop-Rox-CreC/AAV-Flex-eArch3.0-eYFP (enhanced Yellow Fluorescent Protein) virus mixture in the PFC and AAV-WGA-Dre in the BLA of ArpC3f/f mice followed by implantation of optic fibers in both PL regions of PFC (Figure 7A). A month after the surgery, the social affiliation test was conducted with the ctKO-ArpC3 with ctKI-eArch3.0 mice using conditional optogenetic inactivation of the circuit specifically during social interaction (Figure 7B). At baseline (no laser, day 1), the ArpC3 ctKO mice reproduced the social behavioral deficit by displaying similar exploration times for both the social and non-social stimulus (Figures 7C and 7D). This social dysfunction was significantly relieved by inactivation of the KO circuit during social interactions (day 2) (Figures 7C and 7D). The ctKO-ArpC3/ctKI-eArch3.0 mice preferred the social rather than the non-social stimulus when the animals conditionally received eArch3.0-mediated circuit inactivation during social bouts. The average distance between the ctKO-ArpC3/ctKI-eArch3.0 mice and the social stimulus also reflected the normalization of social behavior following eArch-mediated silencing as the mean distance between the ArpC3 ctKO and social stimulus mice was reduced (Figures 7C and 7E). Thus, optically reducing the activity within the PL-BLA circuit during social bouts was sufficient to rescue the effects of loss of ArpC3 within this circuit.
Figure 7. Conditional Optogenetic Inactivation of the PL-BLA Circuit Relieves Social Dysfunction of the ArpC3 ctKO Mice.

(A) Schematic representation of the optogenetic strategy for inactivating the PL-BLA circuit of ArpC3 ctKO mice. Insets show representative images of circuit neurons labeled with eArch3.0-eYFP in the PL and BLA.
(B) The time schedule for the real-time social preference tests with schematic illustrations of the circuit-selective optogenetic inactivation.
(C) Representative heatmaps of movement traces between S versus NS stimuli without laser (baselines) or with eArch3.0-mediated optical inactivation within the S stimulus zone.
(D) Graph of preference score for S versus NS (blue, baseline; gray, eArch3.0 inactivation; n = 6 male mice for each group). p = 0.043 for baseline versus eArch3.0.
(E) Average distance between the experimental mouse and S stimulus. p = 0.039 for baseline versus eArch3.0.
*p < 0.05. Data are presented as mean ± SEM. See also Figures S6 and S7.
We next tested the effect of the circuit inactivation on the social behavior of WT mice (Figures S6A and S6B). In this test, we found that the optogenetic silencing of PL-BLA circuit reduced the mean social preference in WT mice, but this failed to reach statistical significance (Figure S6C; p = 0.074). Similarly, there was no significant difference in mean distance between experimental and social stimulus mouse (Figure S6D; p = 0.204). This trend of reduced social preference, despite no statistical difference, may suggest that social behavior could be affected by abnormally high or low PL-BLA circuit activities that are out of normal range.
Finally, we tested whether the PL-BLA circuit inactivation alters anxiety state of animals, which could influence normal social interaction. A month after eArch3.0 expression in the PFC-BLA circuit and optic fiber implantation, we tested the anxiety level of the mice during optogenetic circuit inactivation using open field and elevated plus maze. Open field testing consisted of 5 min acclimation and consecutive 5 min epochs with alternating laser stimulation (OFF-ON-OFF) (Figure S7A). The movement tracing revealed that the laser stimulation (ON) did not alter the frequency and duration in the center area of the open field as well as the total traveled distance compared with OFF periods (Figures S7B–S7E). Elevated plus maze testing also consisted of consecutive 5 min epochs (OFF-ON-OFF) (Figure S7F). Compared with the laser OFF period, the PL-BLA circuit inactivation (ON) did not change the frequency and duration in open arms (Figures S7G–S7I). Together, these data do not support the possibility that the PL-BLA circuit inactivation affects the anxiety level of WT mice in these tests.
DISCUSSION
Here, we have investigated a neural circuit level mechanism underlying the reduced sociability associated with a loss-of-function mutation in the synaptic cytoskeletal Arp2/3 complex. This phenotype of ArpC3 mutant mice arises from a subpopulation of PFC neurons that project to the subcortical regions of the BLA and whose activity is bidirectionally tuned to social interaction and non-social bouts. Using combined ctKO and ctKI approaches paired with in vivo calcium imaging, we demonstrate that ArpC3 gene disruption within the PFC-BLA circuit drives both elevated neuronal excitation and loss of differential tuning of these neurons during social interaction bouts. Optogenetic activation of these neurons in WT mice during the initiation of social contact reproduces the reduced sociability of ArpC3 mutant and ctKO mice. Conversely, optically suppressing neural activity within this projection during social interactions rescues sociability deficits following ArpC3 loss. Together, these results support that abnormal circuit PFC-BLA activity in the mutant ArpC3 mice is causally responsible for social dysfunction. These findings define a pathogenic PFC projection mechanism that alters top-down control of structures important for social behavior.
In early studies of primates, amygdala lesions resulted in “social indifference” of free-ranging rhesus monkeys in natural social settings (Dicks et al., 1969). More recent work suggests this may occur via disturbances to the salience of face versus non-facial images, a property that is likely important for social communication and interactions (Taubert et al., 2018). Moreover, in humans, social network size positively correlates with the size of the amygdala (Bickart et al., 2011). Rodent lesion studies have also implicated the amygdala in social-context-based decision-making (Hernandez-Lallement et al., 2016), supporting an evolutionally conserved neural circuit for social behavior. Interestingly, social defeat in mice disrupts synchrony among the PFC and amygdala, which leads to stress-induced social dysfunction (Hultman et al., 2016).
The functional disruption of the Arp2/3 pathway within the PFC-BLA neural projection appears to elevate the excitation of these neurons, in agreement with our previous findings in Arp2/3 mutant neurons (Kim et al., 2015). We note these effects are most likely postsynaptic in origin due to the sparse, circuit-specific (from PFC to BLA) labeling and KO; however, we cannot completely rule out the possibility of a presynaptic effect. The finding that inhibitory transmission is also reduced coupled with enhanced excitatory inputs suggests an increase in the E/I balance. Elevation in the E/I balance is known to produce significant impairments in cortical processing and behavioral impairments associated with increased gamma band oscillations. How these alterations impact the BLA will be important to determine in future studies (Tamura et al., 2017). Overall, our results delineate a specific circuit in the medial PFC in which increase E/I balance could generate specific impairments in social behavior.
During endoscopic calcium imaging, we found a significantly increased amplitude of calcium transient in ctKO neurons that is consistent with our electrophysiology data. This high amplitude also increased the decay time due to the slow nature of GCaMP6s fluorescence signals (Chen et al., 2013), leading to temporal masking of multiple underlying neuronal spiking events and resulting in an overall lower number of higher amplitude calcium events in the ctKO group, likely due to elevated neuronal activity.
By monitoring neural activity within the PL-BLA projection during social behaviors, we found two populations of neurons, social (+) and social (−), that bidirectionally represent social behavior, the tuning of which is altered in mice with reduced sociability. While the precise mechanisms of how the each population may affect social behavior is unclear, recent neuronal calcium imaging in the PFC of mice during social behaviors has also found social ON and OFF neuronal ensembles that are perturbed by the psychoactive drug phencyclidine (PCP) under conditions that elevate the activity of these neurons and alter social interactions that are thought to mimic aspects of psychosis in humans (Liang et al., 2018). This study, when combined with the results presented here, strongly supports the likelihood that the proper bidirectional tuning of neuronal activity to social behaviors is an important feature in the PFC. Dysregulation of this may result in outcomes relevant to behaviors associated with psychiatric disorders. These findings also highlight the notion that bidirectional tuning of PFC neurons has important computational properties to determine social interaction outcomes. How these distinct populations arise within the PFC is currently unclear, and whether they are responding to different external sensory cues or internal states is unknown. Future work to map inputs of the social (+) and social (−) neurons may help unravel these questions.
It is well known that the coupling of emotional associations with behavior by the BLA can occur via convergent receipt of negative and positive stimuli (Ambroggi et al., 2008; Beyeler et al., 2016; Cador et al., 1989; Goosens and Maren, 2001; Gore et al., 2015; Killcross et al., 1997; Namburi et al., 2015; Paton et al., 2006; Redondo et al., 2014; Stuber et al., 2011). Our findings, which demonstrate socially tuned (+) and (−) populations both project to the BLA, reveal how the PFC could function to modulate emotional valence by such convergence important for sociability. The projection we define may compute and translate within the PFC negative and positive stimuli into properties of emotional processing within the BLA during social and non-social choices. Dysfunctional emotional processing emerging from perturbations to the tuning of social (+) and social (−) input into the BLA would be expected to give rise to the abnormal social behavior we observed. Indeed, our combined optogenetic approaches to mimic abnormal social behavior in WT mice or rescue the behavior of the ctKO mice experimentally confirm this expectation.
Recent calcium imaging in the medial amygdala has revealed distinct sex-specific encoding of social representations (Li et al., 2017). Our results imply the BLA could also encode representations of socially relevant stimuli via the PFC social (+) and social (−) neuronal populations we identify. It is possible the BLA encodes social (+) and social (−) information by distinct projections to different cell types within the BLA, such as principle neurons versus interneurons. Alternatively, they may be encoded by projections to genetically defined BLA cell populations, such as those previously identified to respond to positive (Ppp1rb1b+) versus negative (Rspo2+) stimuli (Kim et al., 2016). Uncovering how information from social (+) and social (−) PFC neuronal projections are encoded within the BLA has promise to reveal future principles of neuronal representations of social behavior.
Together, our results highlight a previously unknown mechanism of how other gene mutations may give rise to social abnormalities through specific perturbations to social circuitry. Application of the innovative circuit-level genetic tools described here to other gene-circuit interaction analyses opens a window into previously unobservable maladaptive brain states and behaviors.
STAR★METHODS
RESOURCE AVAILABILITY
Lead Contact
Further information and requests for resources should be directed to and will be fulfilled by lead contact, Il Hwan Kim (ikim9@uthsc.edu).
Materials Availability
Materials developed and utilized in this study are available from the lead contacts upon reasonable request.
Data and Code Availability
Data and code developed and utilized in this study are available from the lead contacts upon reasonable request.
EXPERIMENTAL MODEL AND SUBJECT DETAILS
We used 3–5-month-old male and female mice for all the experiments except C3H/HeJ mice. Conditional ArpC3 knockout (Arpc3f/f) and Ai-14 (B6;129S6-Gt(ROSA)26Sortm14(CAG-tdTomato)Hze/J; stock no. 007908; Jackson Laboratory) lines that have been described previously(Kim et al., 2013, 2015)). Ai-32 line (B6;129S-Gt(ROSA)26Sortm32(CAG-COP4*H134R/EYFP)Hze/J; stock no. 012569; Jackson Laboratory) was generously provided by F. Wang (Duke University, Durham, NC). Female C3H/HeJ mice were purchased from Jackson Laboratory (stock no. 000659) and used at the age of 30–50 days. The genetic background of mice except C3H/HeJ line was 129Sv × C57BL/6J. All mice were housed (3–5 mice per cage) in the Duke University’s Division of Laboratory Animal Resources (DLAR) and in the Laboratory Animal Care Unit (LACU) of the University of Tennessee Health Science Center. All tests were conducted during the light cycle. Animal groups were randomly assigned from the animal number and were given treatments such as viruses before testing. All procedures were conducted with a protocol approved by the Duke University and the University of Tennessee Institutional Animal Care and Use Committee in accordance with US National Institutes of Health guidelines.
We used HEK293T cells (ATCC; CRL-11268) to produce and purify adeno-associated viruses as well as to test the selective expression of Cre recombinase by co-expression of AAV-CreN-Rox-stop-Rox-CreC and AAV-WGA-Dre. The HEK293T cells were grown in the Dulbecco’s Modified Eagle’s Medium (DMEM) containing 10% of fetal bovine serum.
METHOD DETAILS
Adeno-associated virus (AAV) preparation
AAV2/9-Ef1α-Flex-GFP (AAV-Flex-GFP), AAV2/9-Ef1α-Flex-ArpC3–2A-GFP (AAV-Flex-ArpC3–2A-GFP), and AAV2/9-hSyn-GFP (AAV-hSyn-GFP), AAV2/9-Ef1α-CreN-Rox-stop-Rox-CreC (AAV-CreN-Rox-stop-Rox-CreC), AAV2/9-Ef1α-WGA-Dre (AAV-WGA-Dre), and AAV2/9-hSyn-Flex-GCaMP6s were purified as follows. Each AAV vector was co-transfected with the packaging plasmid serotype 2/9 and pAd-deltaF helper plasmids into HEK293T cells using the PEI method. After 48 hr incubation, cells were collected, lysed by three times of freeze-thaw cycles in lysis buffer (150 mM NaCl, 20 mM Tris-HCl; pH 8.5), and incubated with benzonase (50 U/ml; Novagen) for 30 min in 37°C. The viral particles were then concentrated by ultracentrifugation (67,000 × g, 1 hr) using an iodixanol gradient solution (15%, 25%, 40% and 60%), and purified 3 times using an Amicon filter unit (100K MWCO; Millipore) by exchanging into PBS. The final viruses were concentrated to 1×10¹³ GC/ml. AAV2/9-hSyn-Flex-GCaMP6s was purchased from UPENN vector core (AV-9-PV2821) and AAV DJ-Ef1α-Flex-eArch3.0-eYFP was purchased from Stanford vector core (GVVC-AAV-55).
Stereotaxic injections
Stereotaxic injections were performed as described in our previous report (Kim et al., 2015). In brief, mice were kept deeply anesthetized in a stereotaxic frame (David Kopf Instruments) with isoflurane. For rescue experiments and axon tracing from FC, 0.8 μL of virus (AAV-Flex-GFP, AAV-Flex-ArpC3–2A-GFP, or AAV-hSyn-GFP) was injected into mice at p15–20 using a 33-gauge needle. Viruses were infused slowly over 12 min into the FC (AP: +2.5, ML ± 1.0, DV: −0.5 to −1.5 from brain surface) using a microdriver with a 10 μL Hamilton syringe.
For the Cre expression within the circuit between PFC and BLA, AAV-CreN-Rox-stop-Rox-CreC (300nl; 1X10¹³ GC/ml) and AAV-WGA-Dre (30nl; 1×10¹³ GC/ml) were injected into the PFC (AP: +2.5, ML ± 1.0, DV: −0.5 to −1.5) and BLA (AP: −2.0, ML ± 3.2, DV: −4.3 from brain surface) respectively. For testing the circuit selective expression of Cre in the DG, AAV-CreN-Rox-stop-Rox-CreC (100nl; 1×10¹³ GC/ml) and AAV-WGA-Dre (100nl; 1×10¹³ GC/ml) were injected into each side of the DG (AP: −2.0, ML ± 1.5, DV: −2.0 from brain surface). For co-expression of the GCaMP6s and Cre within the PFC-BLA circuit, AAV-hSyn-Flex-GCaMP6s (150nl; 1×10¹³ GC/ml) was mixed with AAV-CreN-Rox-stop-Rox-CreC (150nl; 1×10¹³ GC/ml) and injected into the medial part of the PFC (AP: +2.5, ML ± 0.5, DV: −0.5 to −1.5). The viruses were infused slowly for over 12 min using a Nanoject (Drummond Scientific) connected to a glass pipette. The injection pipette was left in place for 10 min post-injection before it was retracted.
Circuit tracing
The circuit tracing was conducted as described in our previous study(Kim et al., 2015). In brief, two weeks after the AAV infections, mice were deeply anesthetized with isoflurane, perfused transcardially with phosphate buffered saline (PBS) containing 25 U/ml heparin, followed by 4% PFA in PBS. Perfused brains were removed, postfixed overnight at 4°C in 4% PFA, and then cryo-protected with 30% sucrose in PBS. Brains were cut into 50 μm coronal sections by cryostat (Leica CM 3000). Sections were counterstained with a 4′,6-diamidino-2-phenylindole solution (DAPI; Sigma-Aldrich). After washing four times with PBST, the serial sections were coverslip-ped with FluorSave (CalBioChem) aqueous mounting medium. Images were taken by tile scan imaging using an LSM 710 confocal microscope (Zeiss) with a 10 × objective under the control of Zen software (Zeiss). To obtain the detailed views of cell bodies and axonal fibers, a 63 × oil-immersion objective lens was used.
Electrophysiology
To express the Cre within the circuit between PFC and BLA, AAV-CreN-Rox-stop-Rox-CreC (200nl; 1×10¹³ GC/ml) and AAV-WGA-Dre (200nl; 1X10¹³ GC/ml) were injected into the PFC (AP: +2.5, ML ± 1.0, DV: −0.5 to −1.5) and BLA (AP: 2.0, ML ± 3.2, DV: −4.3 from brain surface) respectively. Four weeks after surgery, brains were gently removed into ice-cold modified artificial cerebrospinal fluid (aCSF) solution bubbled with 95% O2%–5% CO2 containing the following (in mM): 194 sucrose, 30 NaCl, 2.5 KCl, 1 MgCl2, 26 NaHCO3, 1.2 NaH2PO4, and 10 D-glucose. After 5 min, sagittal slices were cut with a thickness of 250 μm. During the recovery period (30 min), the slices were left in 35.5°C oxygenated aCSF containing the following (in mM): 124 NaCl, 2.5 KCl, 2 CaCl2, 1 MgCl2, 26 NaHCO3, 1.2 NaH2PO4, and 10 D-glucose, pH adjusted to 7.4 with HCl and osmolarity set to 315 mosM. The slices were then placed in the same aCSF at room temperature (22–23°C). Recording pipettes (3.5–5.5 MΩ) contained the following (in mM): 150 K-Gluconate, 2 MgCl2, 1.1 EGTA, 10 HEPES, 3 Na-ATP, and 0.2 Na-GTP, pH adjusted to 7.2 with CsOH and osmolarity set to ~300 mosM.
mEPSCs (miniature excitatory postsynaptic currents) were recorded with 1 μM tetrodotoxin and 50 μM picrotoxin in the bath solution in voltage-clamp mode (cells held at −70 mV). mIPSCs (miniature inhibitory postsynaptic currents) were recorded at −70 mV with 1 μM tetrodotoxin and 20 μM APV (2-amino-5-phosphonopentanoic acid) and 50 μM DNQX (6,7-dinitroquinoxaline-2,3-dione) in the bath solution. All recordings were performed with MultiClamp 700B amplifier (Molecular Devices). Signals were filtered at 10 kHz and digitized at 20 kHz with a Digidata 1440A digitizer (Molecular Devices). During the recordings, the slice was maintained under continuous perfusion of oxygenated aCSF with a temperature of 28 – 30°C and a flow rate of 2–3 mL/min. The mEPSC or mIPSC was detected using software in pCLAMP10.
Cell biology
HEK293T cells were co-transfected with combinations of each viral construct (Ef1α-CreN-Rox-stop-Rox-CreC and Ef1α-WGA-Dre) and Cre-reporter Ef1α-Flex-GFP using FuGENE HD (Promega). 48 h after transfection, the cells were fix using 4% PFA for 10 min, and then washed 3 times with PBS. The Cre reporter GFP expression was imaged by Zeiss 710 confocal microscope with a 10 × objective under the control of Zen software (Zeiss).
Behavioral tests
Open field test
We conducted the open field test as described in our previous reports(Kim et al., 2013, 2014, 2015). Mice were placed into a square (21 cm × 21 cm) open field (AccuScan Instruments) and their motor activities were monitored for over 3 hr under a 350 lx illumination using VersaMax software (AccuScan Instruments). Locomotor (distance traveled), rearing (vertical beam-breaks) and stereotypical activities (repetitive beam-breaks < 1 s) were measured in 5-min time-bins.
Social affiliation test
Social affiliation tests were conducted as in our previous report(Kim et al., 2013). In brief, the test apparatus is a rectangular chamber (54 × 26 × 24 cm) illuminated at 80–110 lux. This test was composed of two phases: non-social exploration and social affiliation testing. In the first phase, the mouse was placed at center area of the chamber, which has two small wire-mesh cages containing identical non-social objects that were located in each side of chamber. The mice were given full access to explore for 10 min. The mouse was removed to its home cage and a social stimulus [young (p30–50) female C3H/HeJ mouse] was placed into one of the wire-mesh cages while the other contains another non-social object (different from the object used in the first phase). For the second phase of testing, the test mouse was returned to the chamber and given full access to the apparatus for 10 min. All behaviors including nose contact, velocity, and distance traveled across both test phases were analyzed by the EthoVision program (Noldus). Contact with a non-social or social stimulus was defined as the mouse approaching the wire-mesh cage and its nose being within 4cm of the cage.
Light-Dark box test
The light–dark testing box apparatus is a mouse shuttle-box (Med Associates) composed of two adjoined boxes: a dark chamber (under 5 lux) and a lighted chamber (600 lux), which are divided by a door controlled by a computer. Before testing, the mouse was placed in the dark chamber. The testing was started by opening the door, and the mouse was given full access to the entire apparatus for 5 min. The total distance traveled in each chamber, time spent on each chamber, number of transitions between chambers, and total distance moved were detected by photo beam breaks, and analyzed by Med Associates software.
Elevated plus maze
The elevated plus maze apparatus consisted of two open arms (30 × 5 cm) and two closed arms (30 × 5 cm) intersecting at a central platform (5 × 5 cm). The apparatus was elevated 41 cm above the ground and were illuminated at 290 lux around the center platform. Mice were connected to bilateral optic patch cables, placed in the center platform, and were allowed to explore for 15 min. During the elevated plus maze test, 5 min epochs with alternating laser stimulation was given (OFF-ON-OFF; 5 min per an epoch). EthoVision video tracking software (Noldus) was used to track location of the animals as well as controlling the laser stimulation epochs. Location of the mice were quantified relative to the positions of the body’s centers.
GCaMP6 imaging with head-mounted fluorescent microscope
Surgery
Four-weeks after injection of viruses into male WT and ArpC3f/f mice, 1mm diameter/4mm length gradient index (GRIN) lenses (In-scopix ProView™ lens) were implanted in the PL region of PFC (AP: +2.5 mm, ML ± 0.5 mm, DV: −0.8 mm) after aspirating ~0.2 mm of the above cortical tissue with 28-gauge needle. Once in place, the lens was secured to the skull using a C&B-Metabond (Parkell) cementing over two screws on the skull, and covered with Kwik-Sil (WPI) to protect the lens surface. Two weeks after the GRIN lens implantation, the baseplate (Inscopix) was mounted onto the mouse head under visual guidance using microscope (Inscopix) to determine the best field of view.
Behavior
Before experiments, testing mice (male) were connected with head-mounted microscope (Inscopix) and habituated to the empty chamber (60 × 15 × 30cm) for 10 min for 2 days. On test days, mice were exposed freely in same arena with a social stimulus mouse for 10 min. The GCaMP6s-mediated neuronal activities recorded by nVista HD program (Inscopix) were synchronized with behavioral data collected by a Point Grey FlyCap2 camera (Point Grey).
Image processing
All movies were initially preprocessed using the Mosaic program (Inscopix) for motion correction and spatial binning (5 × 5) and subsequently analyzed using custom MATLAB scripts(Pnevmatikakis et al., 2016). We used constrained non-negative matrix factorization (CNMF) for simultaneously denoising, deconvolving, and demixing of calcium imaging data(Pnevmatikakis et al., 2016). This method allows accurate source extraction of cellular signals and addresses spatial overlaps between neurons. We calculated peak to noise ratio (PNR) and correlation (CN) images to select the cell locations. We then initialized spatial and temporal components of neurons by the parameters based on PNR and CN and estimated the background given the neuron’s activity. We updated the spatial and temporal components while fixing the estimated background fluctuations. If necessary, these steps are repeated. Each state was defined by the distance between the centroids of each mouse body (close: less than 15 cm, far: over 15 cm). Calcium transients over 2.0 standard deviation above their mean were counted as calcium events from the background fluctuations. Neurons were classified as social (+) or social (−) by the index (Frequency close – Frequency far) / (Frequency close + Frequency far). If the index is positive, then the neuron is classified as social (+); if the index is negative, it is classified as social (−).
Optogenetics with real-time social preference task
Surgery
Optic probe implantation was completed as described in our previous report(Kim et al., 2015). Two to three weeks after viral infection, flat-cut fiber implants (105 μm fiber diameter and 1.25mm OD ferrule) were lowered into place bilaterally targeting the frontal cortex (AP: +2.5 mm, ML: +1.0 mm, DV: −0.8 mm from brain surface) and secured in place using a C&B-Metabond (Parkell) cement covering two screws on the skull.
Experimental setting
Optogenetic experimental procedures were the same as our previous report(Kim et al., 2015). Testing began at least two weeks after implant surgery. On test days, mice were connected to a 473nm (ChR2) or 561nm (eArch3.0) DPSS laser (Shanghai Laser & Optics) via 62.3 μm core diameter sheathed fibers, connected to the implant with ceramic ferrule sleeves. A single laser beam was split (50:50) with a 1 × 2 optical commutator (Doric) to deliver ~5mW optical power to each hemisphere.
Behavior
The real-time social preference procedure was designed based on a real-time conditioned place preference task(Jennings et al., 2013; Stamatakis and Stuber, 2012). The experimental chamber (50 × 30 × 28cm) was composed of two arenas: social arena and non-social arena. Each arena had a small wire-mesh cage located in each side of chamber. The social arena’s cage contains a social stimulus, and the non-social arena’s cage contains a non-social stimulus (similar size of a Lego block). Before experiments, mice (male) were habituated to the empty chamber for 10 min for 3 days. Sessions consist of consecutive 10 min baseline and 5Hz stimulation sessions conducted on different days. The testing mice were placed at the center of the chamber, at the borderline between social and non-social arena. During baseline session (day1), no laser stimulation was delivered in either the social or non-social arenas. During laser activation (day2) session, constant laser stimulation (pulse width 5ms; power 6–8mW) was delivered when the mouse entered the laser zone (20 × 20cm) around the social stimulant until the mouse crossed back outside of the zone. For suppressing ArpC3 ctKO neurons, continuous light stimulation (power ~10mW) was delivered when the mouse stayed the laser zone around the social stimulant.
Behavioral data were video recorded (HD Pro Webcam C920, Logitech) interfaced with Bonsai software. Real-time laser manipulations were controlled by Bonsai software through Arduino (Arduino UNO, Arduino LLC) with a custom-made Arduino sketch.
QUANTIFICATION AND STATISTICAL ANALYSIS
All data are expressed as mean ± SEM and all statistics were analyzed using a GraphPad Prism (version 6.01) program. Independent t test and paired t test (two-sided) were used for analysis of differences between two groups. When comparing more than two groups, ANOVA and Bonferroni’s post hoc tests were used. To monitor changes over time, repeated-measures ANOVA followed by Bonferroni’s pairwise comparisons were utilized. For analyses of cumulative probabilities of mEPSC and mIPSC, two-sample Kolmogorov-Smirnov test was used. A p < 0.05 was considered statistically significant. Detailed statistical results are described in Table S1.
Supplementary Material
KEY RESOURCES TABLE
| REAGENT or RESOURCE | SOURCE | IDENTIFIER |
|---|---|---|
| Bacterial and Virus Strains | ||
| AAV9-Ef1a-Flex-GFP | Current study | N/A |
| AAV9-Ef1a-Flex-ArpC3–2A-GFP | Current study | N/A |
| AAV9-Ef1a-WGA-Dre | Current study | N/A |
| AAV9-Ef1a-WGA | Current study | N/A |
| AAV9-Ef1a-CreN-Rox-stop-Rox-CreC | Current study | N/A |
| AAV9-hSyn-GFP | Current study | N/A |
| AAV9-hSyn-Flex-GFP | UPENN vector core | AV-9-PV2821 |
| AAV9-hSyn-Flex-GCaMP6s | Purification using Addgene#100845 construct | https://doi.org/10.1038/nature12354 |
| AAV DJ-Flex-EF1a-eArch3.0-eYFP | Stanford vector core | GVVC-AAV-55 |
| Escherichia coli; Stbl3 | Thermo Fisher | C737303 |
| Chemicals, Peptides, and Recombinant Proteins | ||
| DAPI | Sigma | 10236276001 |
| Tetrodotoxin citrate | Tocris Biosciences | 1069 |
| picrotoxin | Sigma | 124-87-8 |
| 2-amino-5-phosphonopentanoic acid (APV) | Sigma | 76326-31-3 |
| 6,7-dinitroquinoxaline-2,3-dione (DNQX) | Sigma | 2379-57-9 |
| isoflurane | Henry Schein | 1182097 |
| C&B Metabond ® Quick Adhesive Cement System | Parkell | S380 |
| Ethilon Suture 3/0 | Ethicon | 669H |
| Heparin sodium salt | Sigma | H3393 |
| Paraformaldehyde | VWR | 100504–158 |
| Tissue-Tek O.C.T. Compound | Sakura | 4583 |
| Mounting solution | EMD Millipore | 345789 |
| PEI | Polyscience | 24765 |
| Benzonase | Novagen | 70664 |
| Phenol red | Sigma | P0290 |
| Optiprep | Sigma | D1556 |
| FuGENE HD | Promega | E2311 |
| Experimental Models: Cell Lines | ||
| HEK293T | ATCC | CRL-11268 |
| Experimental Models: Organisms/Strains | ||
| Mouse: C57BL/6J | The Jackson Laboratory | #000664 |
| Mouse: Ai-14 (B6;129S6-Gt(ROSA) 26Sortm14(CAG-tdTomato)Hze/J) | The Jackson Laboratory | #007908 |
| Mouse: Ai-32 (B6;129S-Gt(ROSA) 26Sortm32(CAG-COP4*H134R/EYFP)Hze/J) | The Jackson Laboratory | #012569 |
| Mouse: C3H/HeJ | The Jackson Laboratory | #000659 |
| Mouse: ArpC3f/f | Duke University | https://doi.org/10.1038/nn.4015 |
| Recombinant DNA | ||
| AAV-Ef1a-Flex-GFP | Current study | N/A |
| AAV-Ef1a-Flex-ArpC3-2A-GFP | Current study | N/A |
| AAV-Ef1a-WGA-Dre | Current study | N/A |
| AAV-Ef1a-WGA | Current study | N/A |
| AAV-Ef1a-CreN-Rox-stop-Rox-CreC | Current study | N/A |
| AAV-hSyn-Flex-GCaMP6s | Addgene#100845 | https://doi.org/10.1038/nature12354 |
| AAV-hSyn-GFP | Current study | N/A |
| Software and Algorithms | ||
| Prism | GraphPad | https://www.graphpad.com/ |
| Bonsai | Arduino | https://www.arduino.cc/ |
| Mosaic | Inscopix | https://www.inscopix.com/ |
| nVista HD | Inscopix | https://www.inscopix.com/ |
| CNMF | Pnevmatikakis et al., 2016 | https://doi.org/10.1016/j.neuron.2015.11.037 |
| EthoVisionXT | Noldus | https://www.noldus.com/ |
| light–dark box software | Med Associates | https://www.med-associates.com/ |
| VersaMax software | AccuScan Instruments | http://www.accuscan-usa.com/index.html |
| Zen software | Zeiss | https://www.zeiss.com/corporate/int/home.html |
| pCLAMP10 | Molecular Devices | https://www.moleculardevices.com/ |
Highlights.
A subpopulation of prefrontal cortical neurons projects to the basolateral amygdala
ArpC3 circuit-selective knockout (ctKO) in PFC-BLA disrupts neural activity and social behavior
Optogenetic PFC-BLA activation recapitulates the social dysfunction of ctKO mice
Optogenetic PFC-BLA silencing rescues the social dysfunction in ArpC3 ctKO mice
ACKNOWLEDGMENTS
We thank Drs. William Wetsel, Stephen Lisberger, Nicole Calakos, and Richard Mooney for their critical reading and comments; Drs. Ramona Rodriguiz and Erin Spence for behavioral technical support; Jonnathan Singh Alvarado and Shanna Resendez (Inscopix) for technical support and advice on head-mounted microscopy; and Michael Richardson for video editing support. This work was supported by National Institutes of Health (NIH) grant MH117429 and National Alliance for Research on Schizophrenia and Depres-sion (NARSAD) Young Investigator grant 25163 (I.H.K.), NIH grants MH103374 and NS059957 (S.H.S.), and NIH grant MH112883 (H.H.Y.).
Footnotes
The authors declare no competing interests.
SUPPLEMENTAL INFORMATION
Supplemental Information can be found online at https://doi.org/10.1016/j.celrep.2020.107965.
REFERENCES
- Ambroggi F, Ishikawa A, Fields HL, and Nicola SM (2008). Basolateral amygdala neurons facilitate reward-seeking behavior by exciting nucleus accumbens neurons. Neuron 59, 648–661. [DOI] [PMC free article] [PubMed] [Google Scholar]
- Amodio DM, and Frith CD (2006). Meeting of minds: the medial frontal cortex and social cognition. Nat. Rev. Neurosci 7, 268–277. [DOI] [PubMed] [Google Scholar]
- Anticevic A, Brumbaugh MS, Winkler AM, Lombardo LE, Barrett J, Corlett PR, Kober H, Gruber J, Repovs G, Cole MW, et al. (2013). Global prefrontal and fronto-amygdala dysconnectivity in bipolar I disorder with psychosis history. Biol. Psychiatry 73, 565–573. [DOI] [PMC free article] [PubMed] [Google Scholar]
- Barker GR, Banks PJ, Scott H, Ralph GS, Mitrophanous KA, Wong LF, Bashir ZI, Uney JB, and Warburton EC (2017). Separate elements of episodic memory subserved by distinct hippocampal-prefrontal connections. Nat. Neurosci 20, 242–250. [DOI] [PubMed] [Google Scholar]
- Baron-Cohen S, Ring HA, Bullmore ET, Wheelwright S, Ashwin C, and Williams SC (2000). The amygdala theory of autism. Neurosci. Biobehav. Rev 24, 355–364. [DOI] [PubMed] [Google Scholar]
- Beyeler A, Namburi P, Glober GF, Simonnet C, Calhoon GG, Conyers GF, Luck R, Wildes CP, and Tye KM (2016). Divergent Routing of Positive and Negative Information from the Amygdala during Memory Retrieval. Neuron 90, 348–361. [DOI] [PMC free article] [PubMed] [Google Scholar]
- Bickart KC, Wright CI, Dautoff RJ, Dickerson BC, and Barrett LF (2011). Amygdala volume and social network size in humans. Nat. Neurosci 14, 163–164. [DOI] [PMC free article] [PubMed] [Google Scholar]
- Bicks LK, Koike H, Akbarian S, and Morishita H. (2015). Prefrontal Cortex and Social Cognition in Mouse and Man. Front. Psychol 6, 1805. [DOI] [PMC free article] [PubMed] [Google Scholar]
- Bossert JM, Stern AL, Theberge FR, Marchant NJ, Wang HL, Morales M, and Shaham Y. (2012). Role of projections from ventral medial prefrontal cortex to nucleus accumbens shell in context-induced reinstatement of heroin seeking. J. Neurosci 32, 4982–4991. [DOI] [PMC free article] [PubMed] [Google Scholar]
- Bouwmeester H, Smits K, and Van Ree JM (2002). Neonatal development of projections to the basolateral amygdala from prefrontal and thalamic structures in rat. J. Comp. Neurol 450, 241–255. [DOI] [PubMed] [Google Scholar]
- Bromberg-Martin ES, Matsumoto M, and Hikosaka O. (2010). Dopamine in motivational control: rewarding, aversive, and alerting. Neuron 68, 815–834. [DOI] [PMC free article] [PubMed] [Google Scholar]
- Cador M, Robbins TW, and Everitt BJ (1989). Involvement of the amygdala in stimulus-reward associations: interaction with the ventral striatum. Neuroscience 30, 77–86. [DOI] [PubMed] [Google Scholar]
- Carballedo A, Scheuerecker J, Meisenzahl E, Schoepf V, Bokde A, Möller HJ, Doyle M, Wiesmann M, and Frodl T. (2011). Functional connectivity of emotional processing in depression. J. Affect. Disord 134, 272–279. [DOI] [PubMed] [Google Scholar]
- Cassell MD, Chittick CA, Siegel MA, and Wright DJ (1989). Collateralization of the amygdaloid projections of the rat prelimbic and infralimbic cortices. J. Comp. Neurol 279, 235–248. [DOI] [PubMed] [Google Scholar]
- Chen TW, Wardill TJ, Sun Y, Pulver SR, Renninger SL, Baohan A, Schreiter ER, Kerr RA, Orger MB, Jayaraman V, et al. (2013). Ultrasensitive fluorescent proteins for imaging neuronal activity. Nature 499, 295–300. [DOI] [PMC free article] [PubMed] [Google Scholar]
- Datta D, Arion D, Roman KM, Volk DW, and Lewis DA (2017). Altered Expression of ARP2/3 Complex Signaling Pathway Genes in Prefrontal Layer 3 Pyramidal Cells in Schizophrenia. Am. J. Psychiatry 174, 163–171. [DOI] [PMC free article] [PubMed] [Google Scholar]
- De Rubeis S, Pasciuto E, Li KW, Fernández E, Di Marino D, Buzzi A, Ostroff LE, Klann E, Zwartkruis FJ, Komiyama NH, et al. (2013). CYFIP1 coordinates mRNA translation and cytoskeleton remodeling to ensure proper dendritic spine formation. Neuron 79, 1169–1182. [DOI] [PMC free article] [PubMed] [Google Scholar]
- Dicks D, Myers RE, and Kling A. (1969). Uncus and amiygdala lesions: effects on social behavior in the free-ranging rhesus monkey. Science 165, 69–71. [DOI] [PubMed] [Google Scholar]
- Durand CM, Perroy J, Loll F, Perrais D, Fagni L, Bourgeron T, Montcouquiol M, and Sans N. (2012). SHANK3 mutations identified in autism lead to modification of dendritic spine morphology via an actin-dependent mechanism. Mol. Psychiatry 17, 71–84. [DOI] [PMC free article] [PubMed] [Google Scholar]
- Felix-Ortiz AC, Burgos-Robles A, Bhagat ND, Leppla CA, and Tye KM (2016). Bidirectional modulation of anxiety-related and social behaviors by amygdala projections to the medial prefrontal cortex. Neuroscience 321, 197–209. [DOI] [PMC free article] [PubMed] [Google Scholar]
- Franklin TB, Silva BA, Perova Z, Marrone L, Masferrer ME, Zhan Y, Kaplan A, Greetham L, Verrechia V, Halman A, et al. (2017). Prefrontal cortical control of a brainstem social behavior circuit. Nat. Neurosci 20, 260–270. [DOI] [PMC free article] [PubMed] [Google Scholar]
- Gabbott PL, Warner TA, Jays PR, Salway P, and Busby SJ (2005). Prefrontal cortex in the rat: projections to subcortical autonomic, motor, and limbic centers. J. Comp. Neurol 492, 145–177. [DOI] [PubMed] [Google Scholar]
- Goosens KA, and Maren S. (2001). Contextual and auditory fear conditioning are mediated by the lateral, basal, and central amygdaloid nuclei in rats. Learn. Mem 8, 148–155. [DOI] [PMC free article] [PubMed] [Google Scholar]
- Gore F, Schwartz EC, Brangers BC, Aladi S, Stujenske JM, Likhtik E, Russo MJ, Gordon JA, Salzman CD, and Axel R. (2015). Neural Representations of Unconditioned Stimuli in Basolateral Amygdala Mediate Innate and Learned Responses. Cell 162, 134–145. [DOI] [PMC free article] [PubMed] [Google Scholar]
- Gradinaru V, Zhang F, Ramakrishnan C, Mattis J, Prakash R, Diester I, Goshen I, Thompson KR, and Deisseroth K. (2010). Molecular and cellular approaches for diversifying and extending optogenetics. Cell 141, 154–165. [DOI] [PMC free article] [PubMed] [Google Scholar]
- Gulsuner S, Stein DJ, Susser ES, Sibeko G, Pretorius A, Walsh T, Majara L, Mndini MM, Mqulwana SG, Ntola OA, et al. (2020). Genetics of schizophrenia in the South African Xhosa. Science 367, 569–573. [DOI] [PMC free article] [PubMed] [Google Scholar]
- Hayashi-Takagi A, Takaki M, Graziane N, Seshadri S, Murdoch H, Dunlop AJ, Makino Y, Seshadri AJ, Ishizuka K, Srivastava DP, et al. (2010). Disrupted-in-Schizophrenia 1 (DISC1) regulates spines of the glutamate synapse via Rac1. Nat. Neurosci 13, 327–332. [DOI] [PMC free article] [PubMed] [Google Scholar]
- Hermann M, Stillhard P, Wildner H, Seruggia D, Kapp V, Sánchez-Iranzo H, Mercader N, Montoliu L, Zeilhofer HU, and Pelczar P. (2014). Binary recombinase systems for high-resolution conditional mutagenesis. Nucleic Acids Res. 42, 3894–3907. [DOI] [PMC free article] [PubMed] [Google Scholar]
- Hernandez-Lallement J, van Wingerden M, Schäble S, and Kalenscher T. (2016). Basolateral amygdala lesions abolish mutual reward preferences in rats. Neurobiol. Learn. Mem 127, 1–9. [DOI] [PubMed] [Google Scholar]
- Hu H, Haas SA, Chelly J, Van Esch H, Raynaud M, de Brouwer AP, Weinert S, Froyen G, Frints SG, Laumonnier F, et al. (2016). X-exome sequencing of 405 unresolved families identifies seven novel intellectual disability genes. Mol. Psychiatry 21, 133–148. [DOI] [PMC free article] [PubMed] [Google Scholar]
- Huang WC, Chen Y, and Page DT (2016). Hyperconnectivity of prefrontal cortex to amygdala projections in a mouse model of macrocephaly/autism syndrome. Nat. Commun 7, 13421. [DOI] [PMC free article] [PubMed] [Google Scholar]
- Hultman R, Mague SD, Li Q, Katz BM, Michel N, Lin L, Wang J, David LK, Blount C, Chandy R, et al. (2016). Dysregulation of Prefrontal Cortex-Mediated Slow-Evolving Limbic Dynamics Drives Stress-Induced Emotional Pathology. Neuron 91, 439–452. [DOI] [PMC free article] [PubMed] [Google Scholar]
- Ito Y, Carss KJ, Duarte ST, Hartley T, Keren B, Kurian MA, Marey I, Charles P, Mendonc a, C., Nava C, et al. ; NIHR BioResource; Care4Rare Canada Consortium (2018). De Novo Truncating Mutations in WASF1 Cause Intellectual Disability with Seizures. Am. J. Hum. Genet 103, 144–153. [DOI] [PMC free article] [PubMed] [Google Scholar]
- Jennings JH, Sparta DR, Stamatakis AM, Ung RL, Pleil KE, Kash TL, and Stuber GD (2013). Distinct extended amygdala circuits for divergent motivational states. Nature 496, 224–228. [DOI] [PMC free article] [PubMed] [Google Scholar]
- Jones CA, Watson DJ, and Fone KC (2011). Animal models of schizophrenia. Br. J. Pharmacol 164, 1162–1194. [DOI] [PMC free article] [PubMed] [Google Scholar]
- Kennedy DP, and Adolphs R. (2012). The social brain in psychiatric and neurological disorders. Trends Cogn. Sci 16, 559–572. [DOI] [PMC free article] [PubMed] [Google Scholar]
- Kesner RP, and Churchwell JC (2011). An analysis of rat prefrontal cortex in mediating executive function. Neurobiol. Learn. Mem 96, 417–431. [DOI] [PubMed] [Google Scholar]
- Kessler RC, Berglund P, Demler O, Jin R, Merikangas KR, and Walters, (2005). Lifetime prevalence and age-of-onset distributions of DSM-IV disorders in the National Comorbidity Survey Replication. Arch. Gen. Psychiatry 62, 593–602. [DOI] [PubMed] [Google Scholar]
- Killcross S, Robbins TW, and Everitt BJ (1997). Different types of fear-conditioned behaviour mediated by separate nuclei within amygdala. Nature 388, 377–380. [DOI] [PubMed] [Google Scholar]
- Kim IH, Racz B, Wang H, Burianek L, Weinberg R, Yasuda R, Wetsel WC, and Soderling SH (2013). Disruption of Arp2/3 results in asymmetric structural plasticity of dendritic spines and progressive synaptic and behavioral abnormalities. J. Neurosci 33, 6081–6092. [DOI] [PMC free article] [PubMed] [Google Scholar]
- Kim IH, Wang H, Soderling SH, and Yasuda R. (2014). Loss of Cdc42 leads to defects in synaptic plasticity and remote memory recall. eLife 3, e02839. [DOI] [PMC free article] [PubMed] [Google Scholar]
- Kim IH, Rossi MA, Aryal DK, Racz B, Kim N, Uezu A, Wang F, Wetsel WC, Weinberg RJ, Yin H, and Soderling SH (2015). Spine pruning drives antipsychotic-sensitive locomotion via circuit control of striatal dopamine. Nat. Neurosci 18, 883–891. [DOI] [PMC free article] [PubMed] [Google Scholar]
- Kim J, Pignatelli M, Xu S, Itohara S, and Tonegawa S. (2016). Antagonistic negative and positive neurons of the basolateral amygdala. Nat. Neurosci 19, 1636–1646. [DOI] [PMC free article] [PubMed] [Google Scholar]
- Lammel S, Lim BK, and Malenka RC (2014). Reward and aversion in a heterogeneous midbrain dopamine system. Neuropharmacology 76 (Pt B), 351–359. [DOI] [PMC free article] [PubMed] [Google Scholar]
- Lee E, Rhim I, Lee JW, Ghim JW, Lee S, Kim E, and Jung MW (2016). Enhanced Neuronal Activity in the Medial Prefrontal Cortex during Social Approach Behavior. J. Neurosci 36, 6926–6936. [DOI] [PMC free article] [PubMed] [Google Scholar]
- Li Y, Mathis A, Grewe BF, Osterhout JA, Ahanonu B, Schnitzer MJ, Murthy VN, and Dulac C. (2017). Neuronal Representation of Social Information in the Medial Amygdala of Awake Behaving Mice. Cell 171, 1176–1190. [DOI] [PMC free article] [PubMed] [Google Scholar]
- Liang B, Zhang L, Barbera G, Fang W, Zhang J, Chen X, Chen R, Li Y, and Lin DT (2018). Distinct and Dynamic ON and OFF Neural Ensembles in the Prefrontal Cortex Code Social Exploration. Neuron 100, 700–714. [DOI] [PMC free article] [PubMed] [Google Scholar]
- Liu H, Tang Y, Womer F, Fan G, Lu T, Driesen N, Ren L, Wang Y, He Y, Blumberg HP, et al. (2014). Differentiating patterns of amygdala-frontal functional connectivity in schizophrenia and bipolar disorder. Schizophr. Bull 40, 469–477. [DOI] [PMC free article] [PubMed] [Google Scholar]
- Mcdonald AJ, Mascagni F, and Guo L. (1996). Projections of the medial and lateral prefrontal cortices to the amygdala: a Phaseolus vulgaris leucoagglutinin study in the rat. Neuroscience 71, 55–75. [DOI] [PubMed] [Google Scholar]
- Namburi P, Beyeler A, Yorozu S, Calhoon GG, Halbert SA, Wichmann R, Holden SS, Mertens KL, Anahtar M, Felix-Ortiz AC, et al. (2015). A circuit mechanism for differentiating positive and negative associations. Nature 520, 675–678. [DOI] [PMC free article] [PubMed] [Google Scholar]
- Nelson SB, and Valakh V. (2015). Excitatory/Inhibitory Balance and Circuit Homeostasis in Autism Spectrum Disorders. Neuron 87, 684–698. [DOI] [PMC free article] [PubMed] [Google Scholar]
- Paton JJ, Belova MA, Morrison SE, and Salzman CD (2006). The primate amygdala represents the positive and negative value of visual stimuli during learning. Nature 439, 865–870. [DOI] [PMC free article] [PubMed] [Google Scholar]
- Pnevmatikakis EA, Soudry D, Gao Y, Machado TA, Merel J, Pfau D, Reardon T, Mu Y, Lacefield C, Yang W, et al. (2016). Simultaneous Denoising, Deconvolution, and Demixing of Calcium Imaging Data. Neuron 89, 285–299. [DOI] [PMC free article] [PubMed] [Google Scholar]
- Redondo RL, Kim J, Arons AL, Ramirez S, Liu X, and Tonegawa S. (2014). Bidirectional switch of the valence associated with a hippocampal contextual memory engram. Nature 513, 426–430. [DOI] [PMC free article] [PubMed] [Google Scholar]
- Reijnders MRF, Ansor NM, Kousi M, Yue WW, Tan PL, Clarkson K, Clayton-Smith J, Corning K, Jones JR, Lam WWK, et al. ; Deciphering Developmental Disorders Study (2017). RAC1 Missense Mutations in Developmental Disorders with Diverse Phenotypes. Am. J. Hum. Genet 101, 466–477. [DOI] [PMC free article] [PubMed] [Google Scholar]
- Ridderinkhof KR, Ullsperger M, Crone EA, and Nieuwenhuis S. (2004). The role of the medial frontal cortex in cognitive control. Science 306, 443–447. [DOI] [PubMed] [Google Scholar]
- Roozendaal B, McEwen BS, and Chattarji S. (2009). Stress, memory and the amygdala. Nat. Rev. Neurosci 10, 423–433. [DOI] [PubMed] [Google Scholar]
- Rubenstein JL (2010). Three hypotheses for developmental defects that may underlie some forms of autism spectrum disorder. Curr. Opin. Neurol 23, 118–123. [DOI] [PubMed] [Google Scholar]
- Russell TA, Blizinsky KD, Cobia DJ, Cahill ME, Xie Z, Sweet RA, Duan J, Gejman PV, Wang L, Csernansky JG, and Penzes P. (2014). A sequence variant in human KALRN impairs protein function and coincides with reduced cortical thickness. Nat. Commun 5, 4858. [DOI] [PMC free article] [PubMed] [Google Scholar]
- Rutishauser U, Mamelak AN, and Adolphs R. (2015). The primate amygdala in social perception - insights from electrophysiological recordings and stimulation. Trends Neurosci. 38, 295–306. [DOI] [PMC free article] [PubMed] [Google Scholar]
- Sadybekov A, Tian C, Arnesano C, Katritch V, and Herring BE (2017). An autism spectrum disorder-related de novo mutation hotspot discovered in the GEF1 domain of Trio. Nat. Commun 8, 601. [DOI] [PMC free article] [PubMed] [Google Scholar]
- Sliwa J, and Freiwald WA (2017). A dedicated network for social interaction processing in the primate brain. Science 356, 745–749. [DOI] [PMC free article] [PubMed] [Google Scholar]
- Stamatakis AM, and Stuber GD (2012). Activation of lateral habenula inputs to the ventral midbrain promotes behavioral avoidance. Nat. Neurosci 15, 1105–1107. [DOI] [PMC free article] [PubMed] [Google Scholar]
- Stuber GD, Sparta DR, Stamatakis AM, van Leeuwen WA, Hardjoprajitno JE, Cho S, Tye KM, Kempadoo KA, Zhang F, Deisseroth K, and Bonci A. (2011). Excitatory transmission from the amygdala to nucleus accumbens facilitates reward seeking. Nature 475, 377–380. [DOI] [PMC free article] [PubMed] [Google Scholar]
- Tamura M, Spellman TJ, Rosen AM, Gogos JA, and Gordon JA (2017). Hippocampal-prefrontal theta-gamma coupling during performance of a spatial working memory task. Nat. Commun 8, 2182. [DOI] [PMC free article] [PubMed] [Google Scholar]
- Taubert J, Flessert M, Wardle SG, Basile BM, Murphy AP, Murray EA, and Ungerleider LG (2018). Amygdala lesions eliminate viewing preferences for faces in rhesus monkeys. Proc. Natl. Acad. Sci. USA 115, 8043–8048. [DOI] [PMC free article] [PubMed] [Google Scholar]
- Won H, Mah W, and Kim E. (2013). Autism spectrum disorder causes, mechanisms, and treatments: focus on neuronal synapses. Front. Mol. Neurosci 6, 19. [DOI] [PMC free article] [PubMed] [Google Scholar]
- Yizhar O, Fenno LE, Prigge M, Schneider F, Davidson TJ, O’Shea DJ, Sohal VS, Goshen I, Finkelstein J, Paz JT, et al. (2011). Neocortical exci-tation/inhibition balance in information processing and social dysfunction. Nature 477, 171–178. [DOI] [PMC free article] [PubMed] [Google Scholar]
Associated Data
This section collects any data citations, data availability statements, or supplementary materials included in this article.
Supplementary Materials
Data Availability Statement
Data and code developed and utilized in this study are available from the lead contacts upon reasonable request.